
New Insights for Gem-Quality Mn-Bearing Diopside-Omphacite, Violane Variety, from Saint Marcel (Val D’Aosta, Italy): Its Trace Elements and Spectroscopic Characterization

 ,
,
Abstract
:1. Introduction
2. Background Information
3. Materials and Methods
4. Results
4.1. Gemological Properties
4.2. Major Element Composition
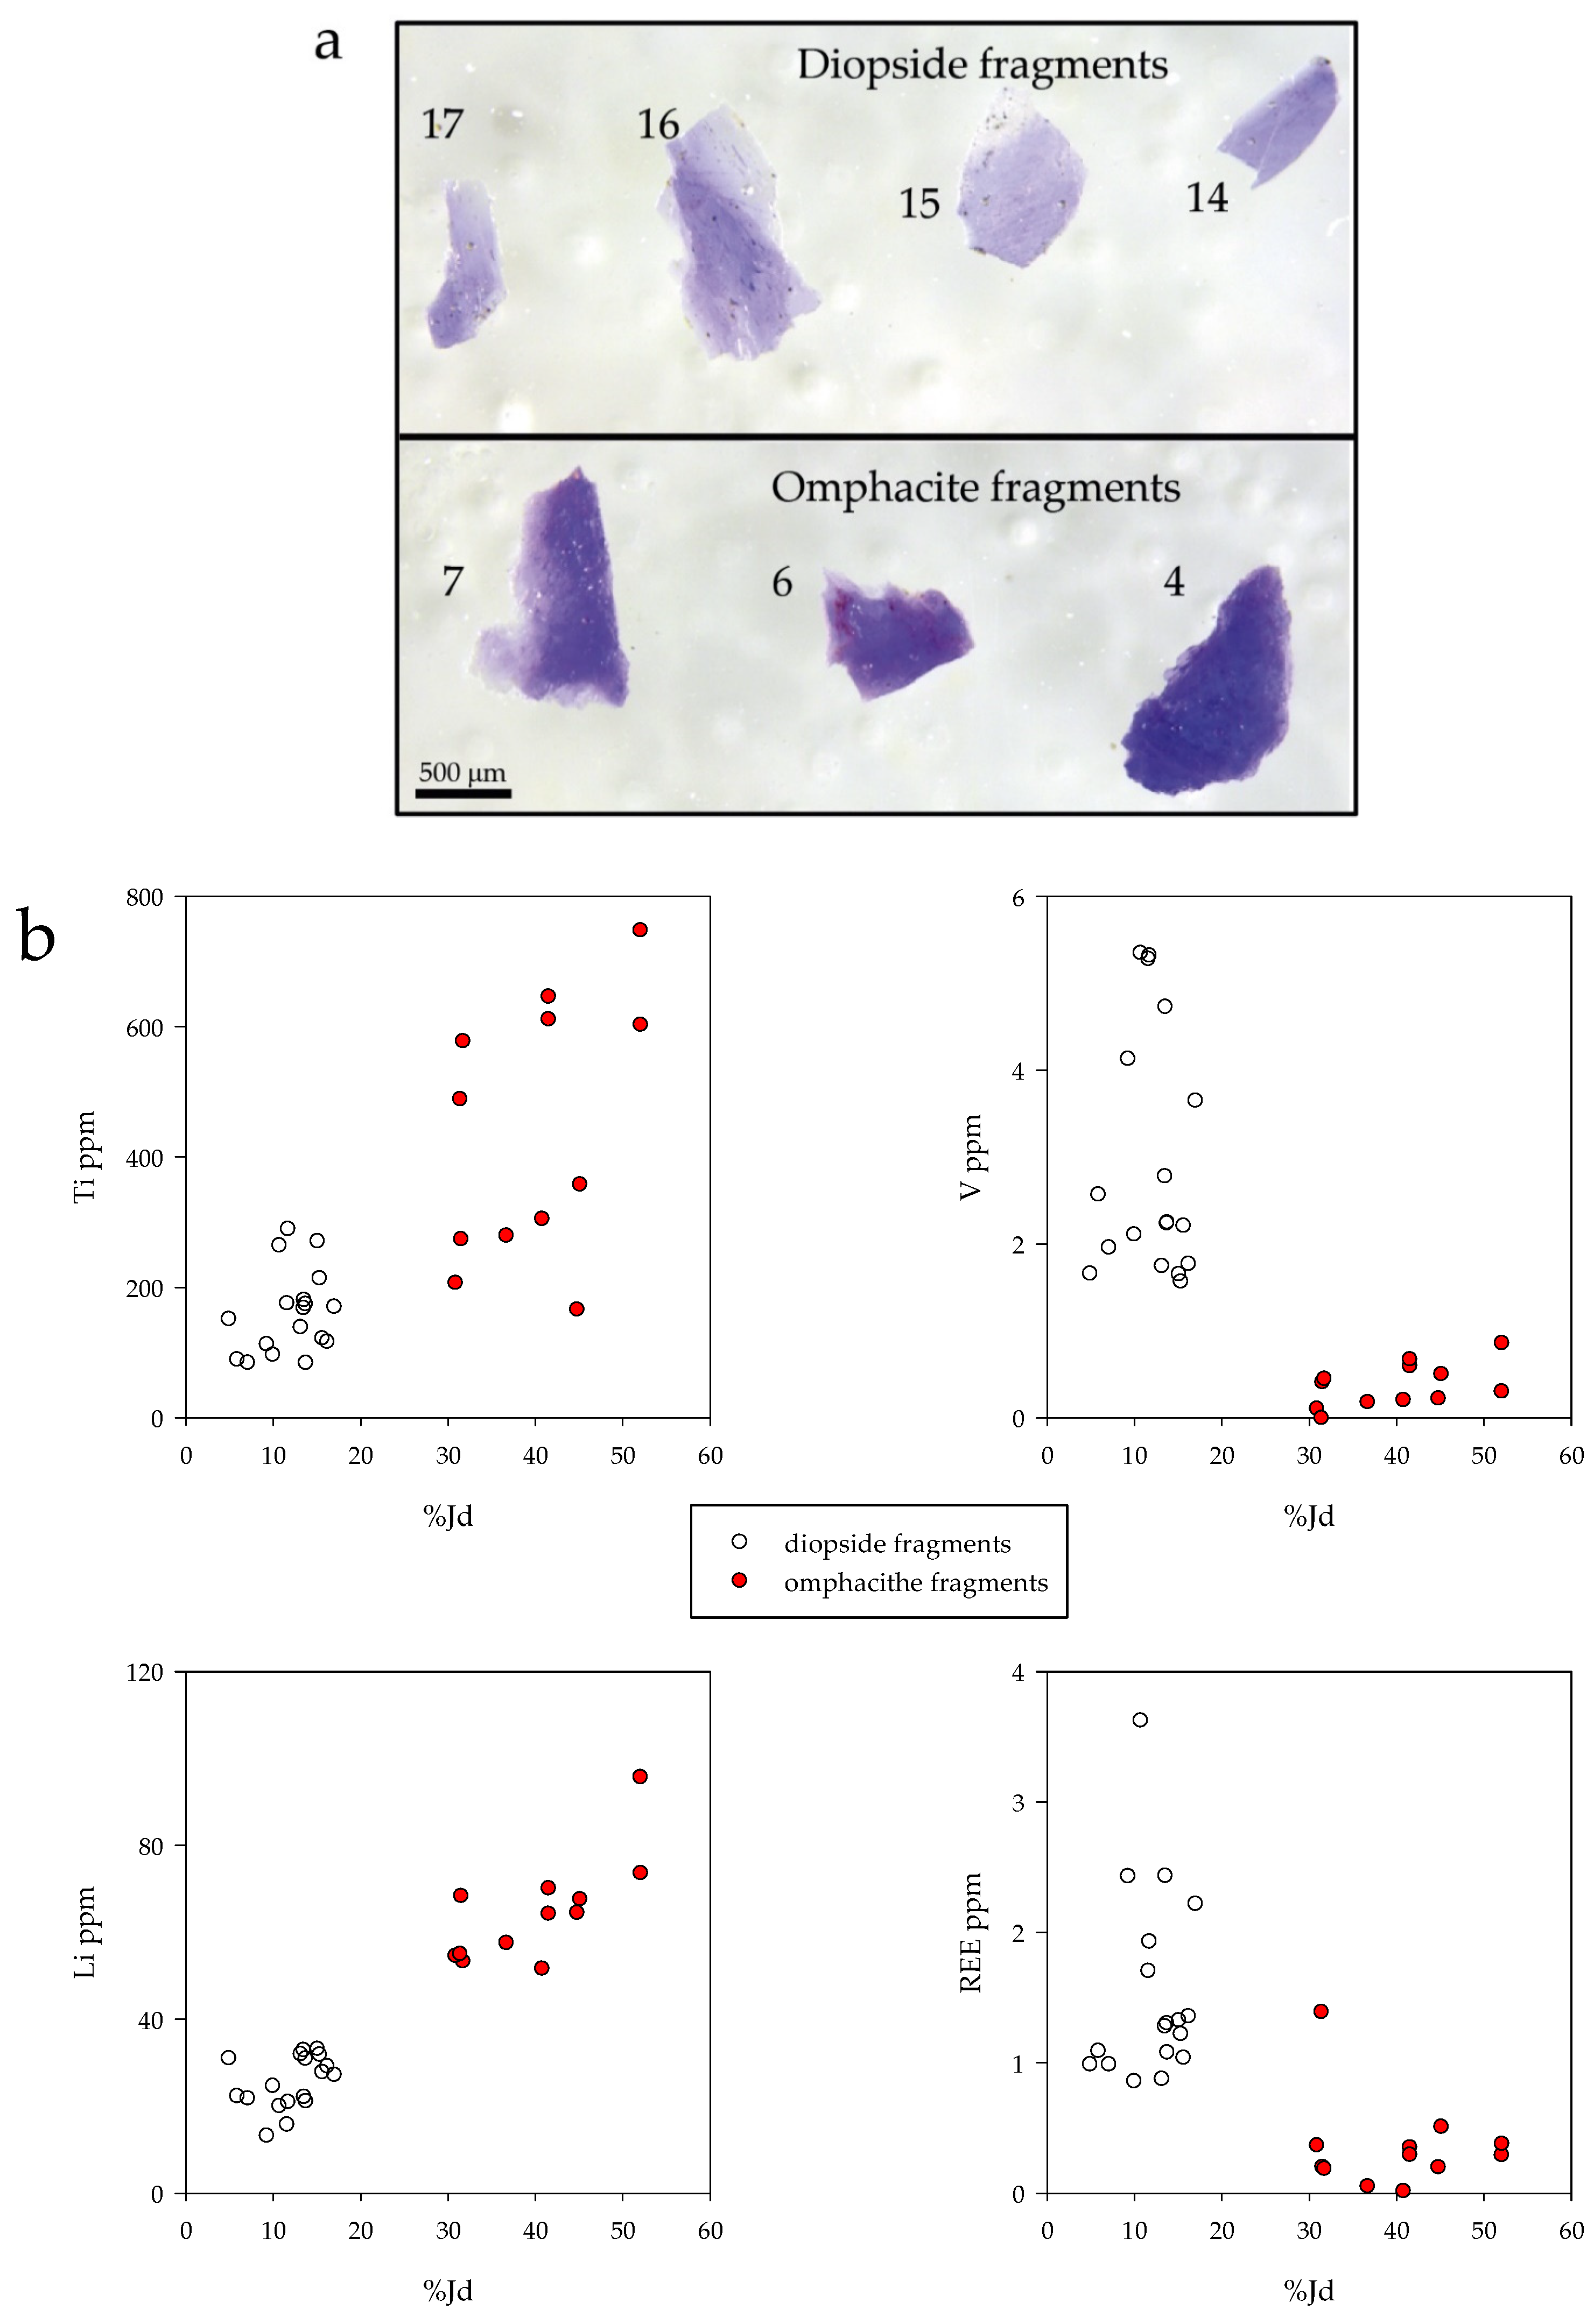
4.3. Trace Elements
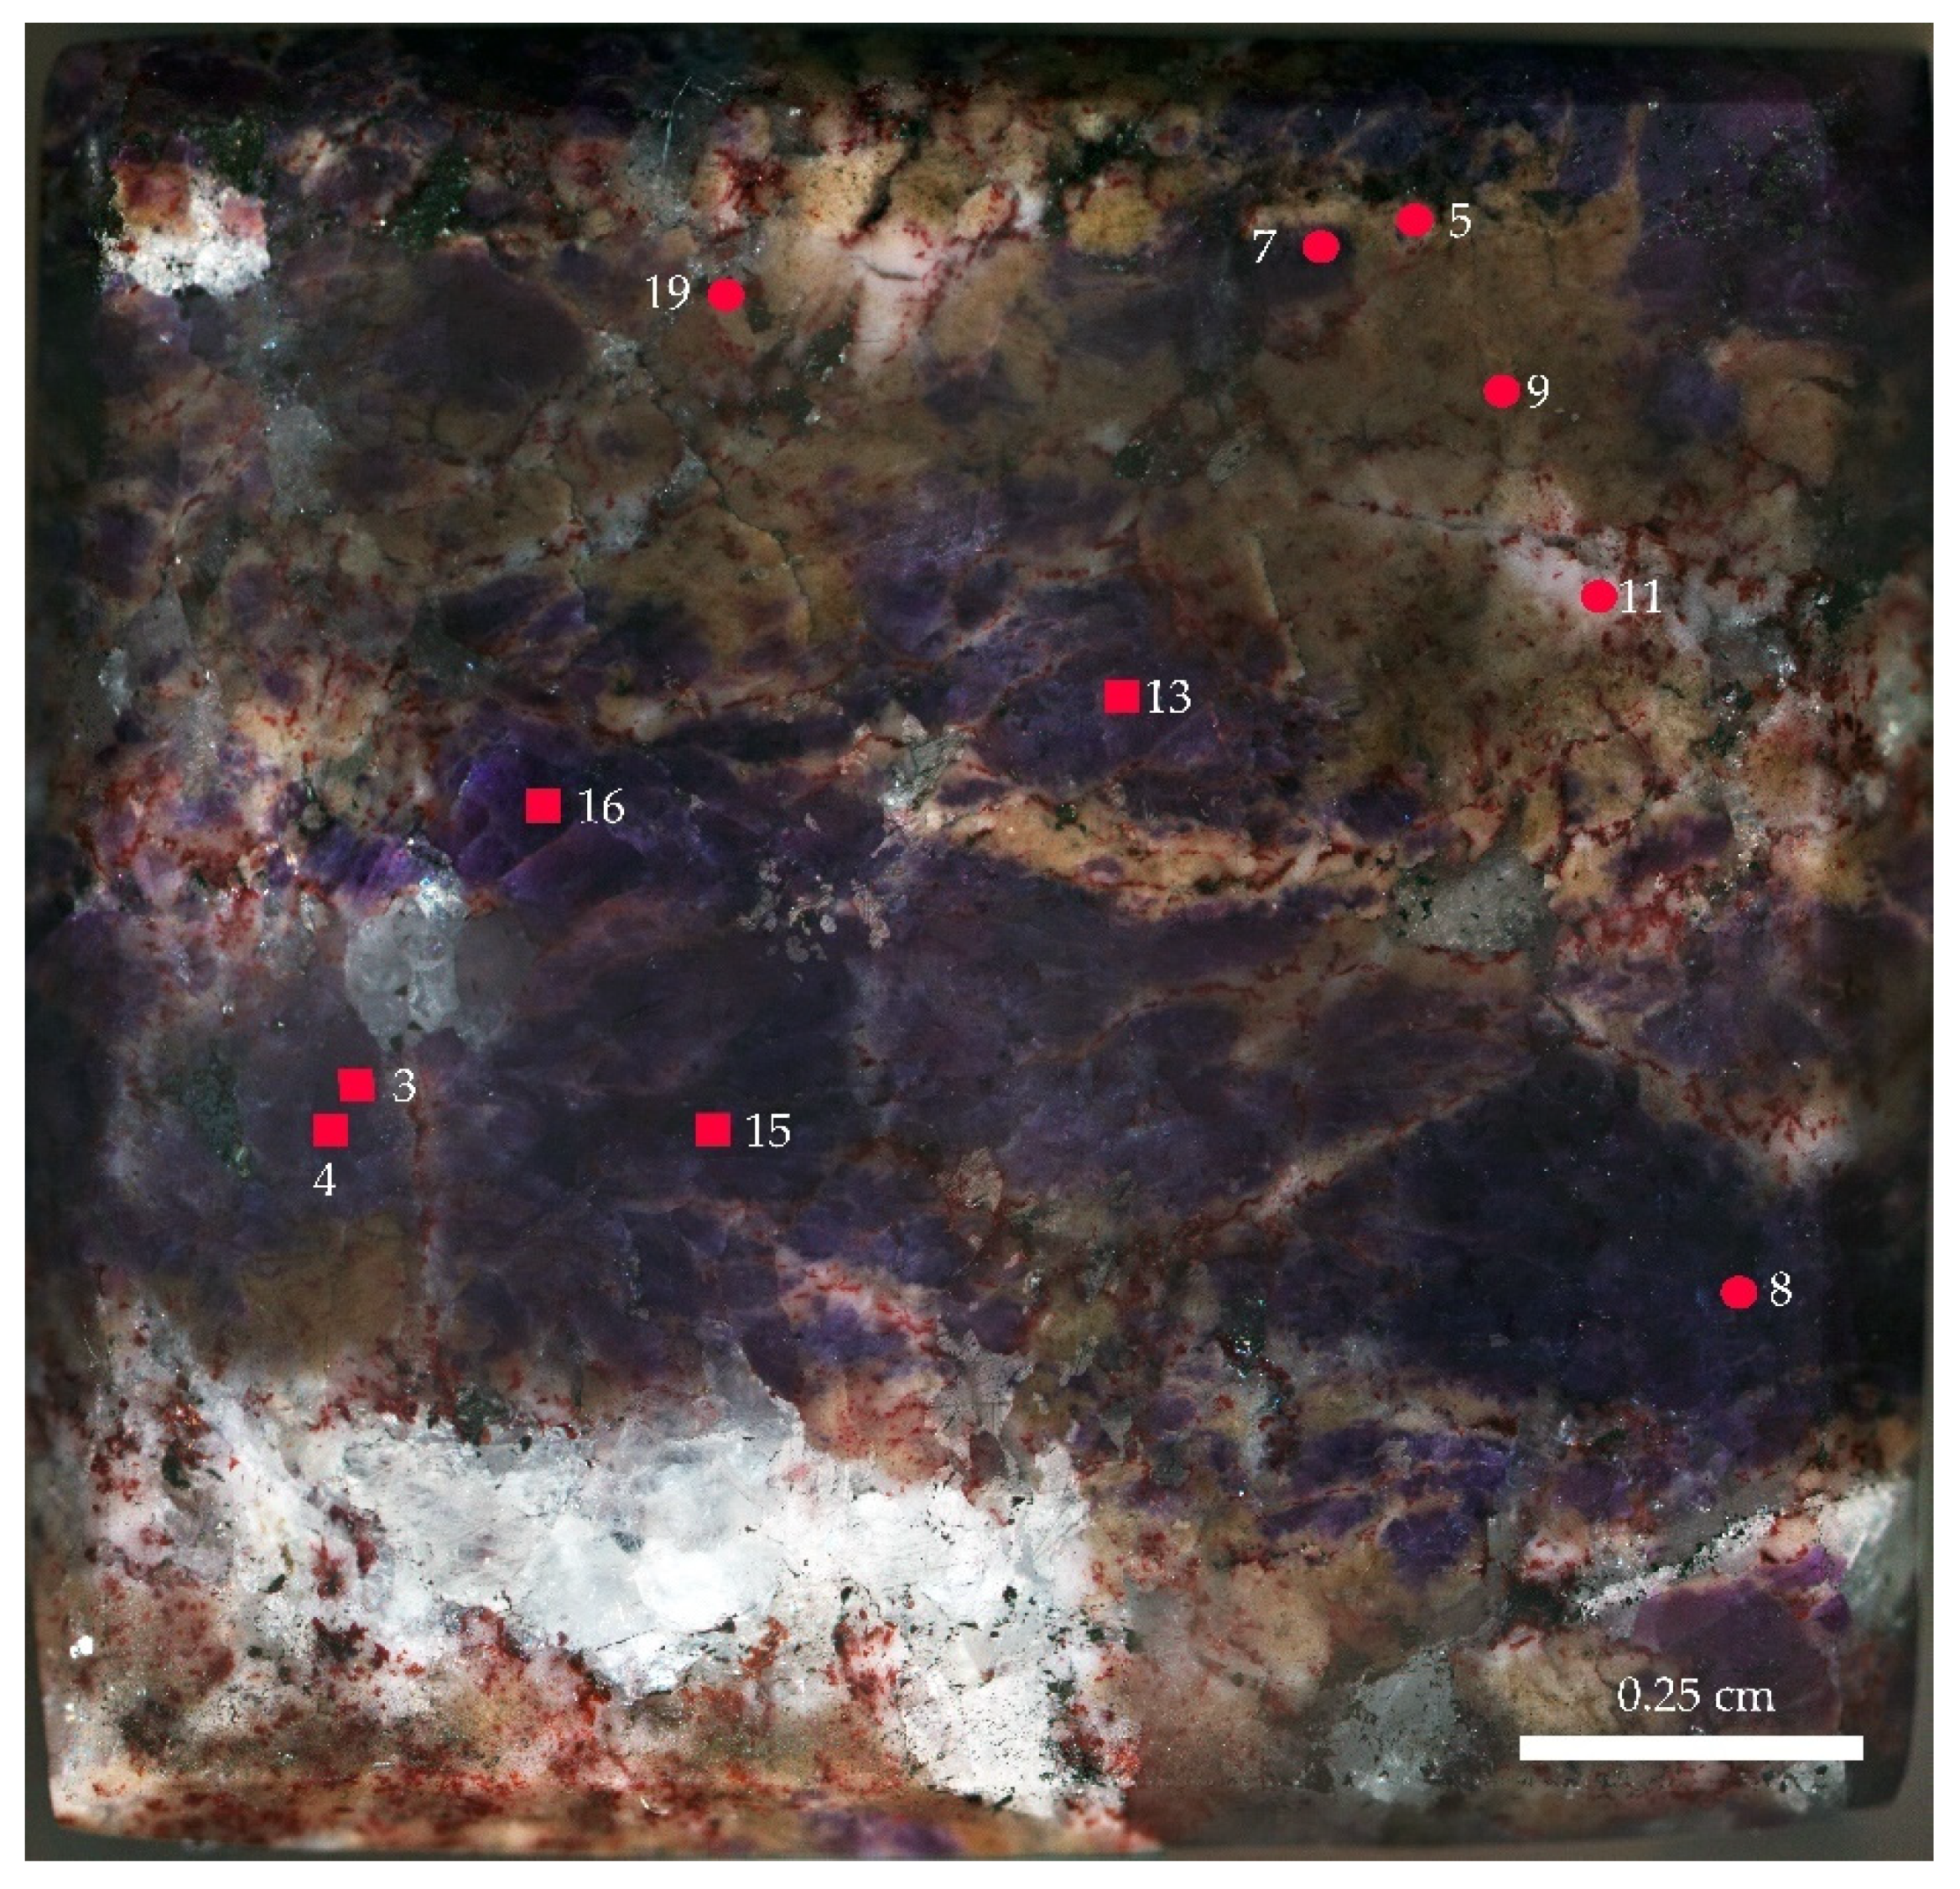
4.4. Raman and FTIR Spectroscopy
5. Discussion and Conclusions
Supplementary Materials
Author Contributions
Funding
Institutional Review Board Statement
Informed Consent Statement
Data Availability Statement
Acknowledgments
Conflicts of Interest
References
- Ciriotti, M.E.; Fascio, L.; Pasero, M. Italian Type Minerals; Plus: Pisa, Italy, 2009. [Google Scholar]
- Bondi, M.; Mottana, A.; Kurat, G.; Rossi, G. Cristallochimica del violano e della schefferite di St. Marcel (Valle d’Aosta). Rend. Soc. It. Min. Petr. 1978, 34, 15–25. [Google Scholar]
- Brown, P.; Essene, E.J.; Peacor, D.R. The mineralogy and petrology of manganese-rich rocks from St. Marcel, Piedmont, Italy. Contrib. Mineral. Pet. 1978, 67, 227–232. [Google Scholar] [CrossRef]
- Mottana, A.; Rossi, G.; Kracher, A.; Kurat, G. Violan revisited: Mn-bearing omphacite and diopside. Tsch. Miner. Petr. Mitt. 1979, 26, 187–201. [Google Scholar] [CrossRef]
- Griffin, W.L.; Mottana, A. Crystal chemistry of clinopyroxenes from the St. Marcel manganese deposit, Val d’Aosta, Italy. Am. Mineral. 1982, 67, 568–586. [Google Scholar]
- Cara, W.; Laurs, B.M. Blue diopside from Russia. J. Gemmol. 2020, 37, 124–126. [Google Scholar]
- Herd, C.D.K.; Peterson, R.C.; Rossman, G.R. Violet-colored diopside from Southern Baffin Island, Nunavut, Canada. Can. Mineral. 2000, 38, 1193–1199. [Google Scholar] [CrossRef]
- Reinecke, T. Crystal chemistry and reaction relations of piemontites and thulites from highly oxidized low grade metamorphic rocks at Vitali, Andros Island, Greece. Contrib. Mineral. Pet. 1986, 93, 56–76. [Google Scholar] [CrossRef]
- Macrì, M.; Troilo, F.; Serracin, M. A new gemstone from Italy: “A violane quartz”. Gems Gemol. 2007, 43, 262–263. [Google Scholar]
- Tumiati, S. Geochemistry, mineralogy and petrology of the eclogitized manganese deposit of Praborna (Valle d’Aosta, Western Italian Alps). Ph.D. Thesis, Universita‘dell’Insubria (Como, Italy)–Université Denis Diderot, Paris, France, 2005. Unpublished. [Google Scholar]
- Dal Piaz, G.V. La formazione mesozoica dei calcescisti con pietre verdi fra la Valsesia e la Valtournanche ed i suoi rapporti strutturali con il ricoprimento del monte Rosa e con la Zona Sesia-Lanzo. Boll. Soc. Geol. It. 1965, 84, 67–104. [Google Scholar]
- Bearth, P. Die Ophiolite der Zone von Zermatt-Saas Fee. Beitr. Geol. Karte Schweiz; Kümmerly & Frey: Bern, Switzerland, 1967; NF132. [Google Scholar]
- Ernst, W.G.; Dal Piaz, G.V. Mineral parageneses of eclogitic rocks and related mafic schists of the Piemonte ophiolite nappe, Breuil- St. Jacques area, Italian Western Alps. Am. Mineral. 1978, 63, 621–640. [Google Scholar]
- Martin-Vernizzi, S. La mine de Praborna (Val d’Aoste, Italie): Une Série Manganésifère Métamorphisée Dans le Facies Eclogite. Ph.D. Thesis, Université Pierre et Marie Curie, Paris, France, 1982. [Google Scholar]
- Tumiati, S.; Martin, S.; Godard, G. Hydrothermal origin of manganese in the high-pressure ophiolite metasediments of Praborna ore deposit (Aosta Valley, Western Alps). Eur. J. Mineral. 2010, 22, 577–594. [Google Scholar] [CrossRef]
- Castello, P. Il giacimento di Praborna (S. Marcel-AO). Riv. Min. It. 1982, 3, 87–92. [Google Scholar]
- Breithaupt, A. Bestimmung neuer Mineralien. J. für Prakt. Chem. 1838, 15, 320–338. [Google Scholar] [CrossRef]
- Des Cloizeaux, A. Manuel de Minéralogie; (2 volumes: I, 1862; II, 1874, 19–20); Dunod Éditor: Paris, France, 1862. [Google Scholar]
- Schluttig, E. Chemisch-Mineralogische Untersuchungen von weniger bekannten Silicaten. Zeits. Kryst. Min. 1888, 13, 73–76. [Google Scholar]
- Hey, M.H. An Index of Mineral Species and Varieties; British Museum: London, UK, 1962. [Google Scholar]
- Tröger, E. Optische Bestimmung der Gesteinsbildender Minerale; Teil 2. Schweizerbart’sche Verlagsbuchhandlung: Stuttgart, Germany, 1967. [Google Scholar]
- Strunz, H. Mineralogische Tabellen; Akademische Verlagsgesellschaft, Geest & Portig: Leipzig, Germany, 1970. [Google Scholar]
- Morimoto, N.; Fabriès, J.; Ferguson, A.K.; Ginzburg, I.V.; Ross, M.; Seifert, F.A.; Zussman, J.; Aoki, K.; Gottardi, G. Nomenclature of pyroxenes. Miner. Mag. 1988, 53, 535–550. [Google Scholar] [CrossRef]
- Martin, S.; Rebay, G.; Kienast, J.R.; Mevel, C. An eclogitised oceanic palaeo-hydrothermal field from the St. Marcel Valley (Italian Western Alps). Ofioliti 2008, 33, 49–63. [Google Scholar]
- Anders, E.; Grevesse, N. Abundances of the elements: Meteoritic and solar. Geochim. Cosmochim. Acta 1989, 53, 197–214. [Google Scholar] [CrossRef]
- Bocchio, R.; De Capitani, L.; Ottolini, L.; Cella, F. Trace element distribution in eclogites and their clinopyroxene/garnet pair: A case study from Soazza (Switzerland). Eur. J. Mineral. 2000, 12, 147–161. [Google Scholar] [CrossRef]
- Burt, D.M. Compositional and phase relations among rare earth element minerals. In Geochemistry and Mineralogy of Rare Earth Elements; Lipin, B.R., McKay, G.A., Eds.; Reviews in Mineralogy; Mineralogical Society of America: Washington, DC, USA, 1989; Volume 21, pp. 259–307. [Google Scholar]
- Oberti, R.; Caporuscio, F.A. Crystal chemistry of clinopyroxenes from mafic eclogites: A study on the key role of the M2 site population by means of crystal-structure refinement. Am. Mineral. 1991, 76, 1141–1152. [Google Scholar]
- Messiga, B.; Tribuzio, R.; Bottazzi, P.; Ottolini, L. An ion microprobe study on trace element composition of clinopyroxenes from blueschist and eclogitized Fe–Tigabbros, Ligurian Alps, northwestern Italy: Some petrologic considerations. Geochim. Cosmochim. Acta 1995, 59, 59–75. [Google Scholar]
- Meagher, E.P. Silicate Garnets. In Orthosilicates; Ribbe, P.H., Ed.; Reviews in Mineralogy; Mineralogical Soc. of America: Washington, DC, USA, 1980; Volume 5, pp. 25–66. [Google Scholar]
- Woodland, A.B.; Seitz, H.-M.; Altherr, R.; Marschall, H.; Olker, B.; Ludwig, T. Li abundances in eclogite minerals: A clue to a crustal or mantle origin? Contrib. Mineral. Pet. 2002, 43, 587–601. [Google Scholar] [CrossRef]
- Coccato, A.; Karampelas, S.; Wörle, M.; van Willigen, S.; Pétrequin, P. Gem quality and archeological green ‘jadeite jade’ versus ‘omphacite jade’. J. Raman Spectr. 2014, 45, 1260–1265. [Google Scholar] [CrossRef]
- McMillan, P. Structural studies of silicate glasses and melts-applications and limitations of Raman spectroscopy. Am. Mineral. 1984, 69, 622–644. [Google Scholar]
- Mernagh, T.P.; Hoatson, D.M. Raman Spectroscopic Study of Pyroxene Structures from the Munni Munni Layered Intrusion, Western Australia. J. Raman Spectr. 1997, 28, 647–658. [Google Scholar] [CrossRef]
- Huang, E.; Chen, C.H.; Huang, T.; Lin, E.H.; Xu, J. Raman spectroscopic characteristics of Mg-Fe-Ca pyroxenes. Am. Mineral. 2000, 85, 473–479. [Google Scholar] [CrossRef]
- Katerinopoulou, A.; Musso, M.; Amthauer, G. A Raman spectroscopic study of the phase transition in omphacite. Vib. Spectr. 2008, 48, 163–167. [Google Scholar] [CrossRef]
- Buzatu, A.; Buzgar, N. The Raman study of single-chain silicates. In Analele Ştiintifice Ale Universitatii, Al. I. Cuza” IAŞI Geologie; “Al. I. Cuza” University of Iași,: Iași, Romania, 2010; pp. 1429–1443. [Google Scholar]
- Downs, R.T. The RRUFF Project: An integrated study of the chemistry, crystallography, Raman and infrared spectroscopy of minerals. In Proceedings of the Program and Abstracts of the 19th General Meeting of the International Mineralogical Association Kobe, Japan, Commission on Ore Mineralogy, Report of the Sulfosalt Subcommittee, Kobe, Japan, 23–28 July 2006. [Google Scholar]
- Ostrooumov, M.; Lasnier, B.; Lefrant, S.; Fritsch, E. FT-Raman and infrared reflexion spectrometry of minerals and gems. Available online: http://www.geocities.ws/ostroum/ (accessed on 7 January 2021).
- Jafari Baghjeghaz, M.; Salahinejad, E. Enhanced sinterability and in vitro bioactivity of diopside through fluoride doping. Ceram. Int. 2017, 43, 4680–4686. [Google Scholar] [CrossRef]
- Shahrouzifar, M.R.; Salahinejad, E. Strontium doping into diopside tissue engineering scaffolds. Ceram. Int. 2019, 45, 10176–10181. [Google Scholar] [CrossRef]
- Manrique-Ortega, M.D.; Mitrani, A.; Casanova-González, E.; Jiménez-Galindo, L.A.; Ruvalcaba-Sil, J.L. Methodology for the non–destructive characterization of jadeite-jade for archaeological studies. Spectrochim. Acta A 2019, 217, 294–309. [Google Scholar] [CrossRef]
- Ou Yang, C.M.; Jian, Q.L.; Hansheng, L.; Kwok, B. Recent studies on inky black omphacite jade. J. Gemmol. 2003, 28, 337. [Google Scholar]
- Franz, L.; Tay, T.S.; Hänni, H.A.; de Capitani, C.; Thanasuthipitak, T.; Atichat, W. A Comparative Study of Jadeite, Omphacite and Kosmochlor Jades from Myanmar, and Suggestions for a Practical Nomenclature. Gems Gemol. 2014, 34, 2010–2229. [Google Scholar] [CrossRef]
- Zhao, L.; Ma, H.; Fang, C.; Ding, L.; Jia, X. Synthesis and characterization of purple NaAlSi2O6 jadeite under high pressure and high temperature. J. Cryst. Growth 2018, 499, 30–34. [Google Scholar] [CrossRef]
- Harlow, G.E.; Quin, E.P.; Rossman, G.R.; Rohtert, W.R. Blue omphacite from Guatemala. Gems Gemol. 2004, 40, 68–70. [Google Scholar]
- Simakin, A.G.; Kislov, E.V.; Salova, T.P.; Shaposhnikova, O.Y.; Nekrasov, A.N. Reduced CO, fluid as an agent of ole-forming processes: A case study of dolomite-replacement skarns at the Yoko-Dovyren massif. Petrology 2019, 27, 1–16. [Google Scholar] [CrossRef]
- Lu, R. Color origin of lavender jadeite: An alternative approach. Gems Gemol. 2012, 48, 273–283. [Google Scholar] [CrossRef]
- Abduriyim, A.; Saruwatari, K.; Katsurada, Y. Japanese jadeite: History, characteristics, and comparison with other sources. Gems Gemol. 2017, 53, 48–67. [Google Scholar] [CrossRef]
- Bristow, J.K.; Parker, S.C.; Catlow, C.R.A.; Woodley, S.M.; Walsh, A. Microscopic origin of the optical processes in the blue sapphire. Chem. Commun. 2013, 49, 5259–5261. [Google Scholar] [CrossRef] [Green Version]
- Rossman, G.R. Lavender jade: The optical spectrum of Fe3+ and Fe2+ -Fe3+ inter-valence charge transfer in jadeite from Burna. Am. Mineral. 1974, 59, 868–870. [Google Scholar]
- Bocchio, R.; Adamo, I.; Bordoni, V.; Caucia, F.; Diella, V. Gem-quality zoisite from Merelani (Northwestern Tanzania): Review and new data. Per. Mineral. 2012, 81, 379–391. [Google Scholar] [CrossRef]
- Olivier, B. The Geology and Petrology of the Merelani Tanzanite Deposit, N.E. Tanzania. Ph.D. Thesis, Stellenbosch University, Stellenbosch, South Africa, 2006. [Google Scholar]


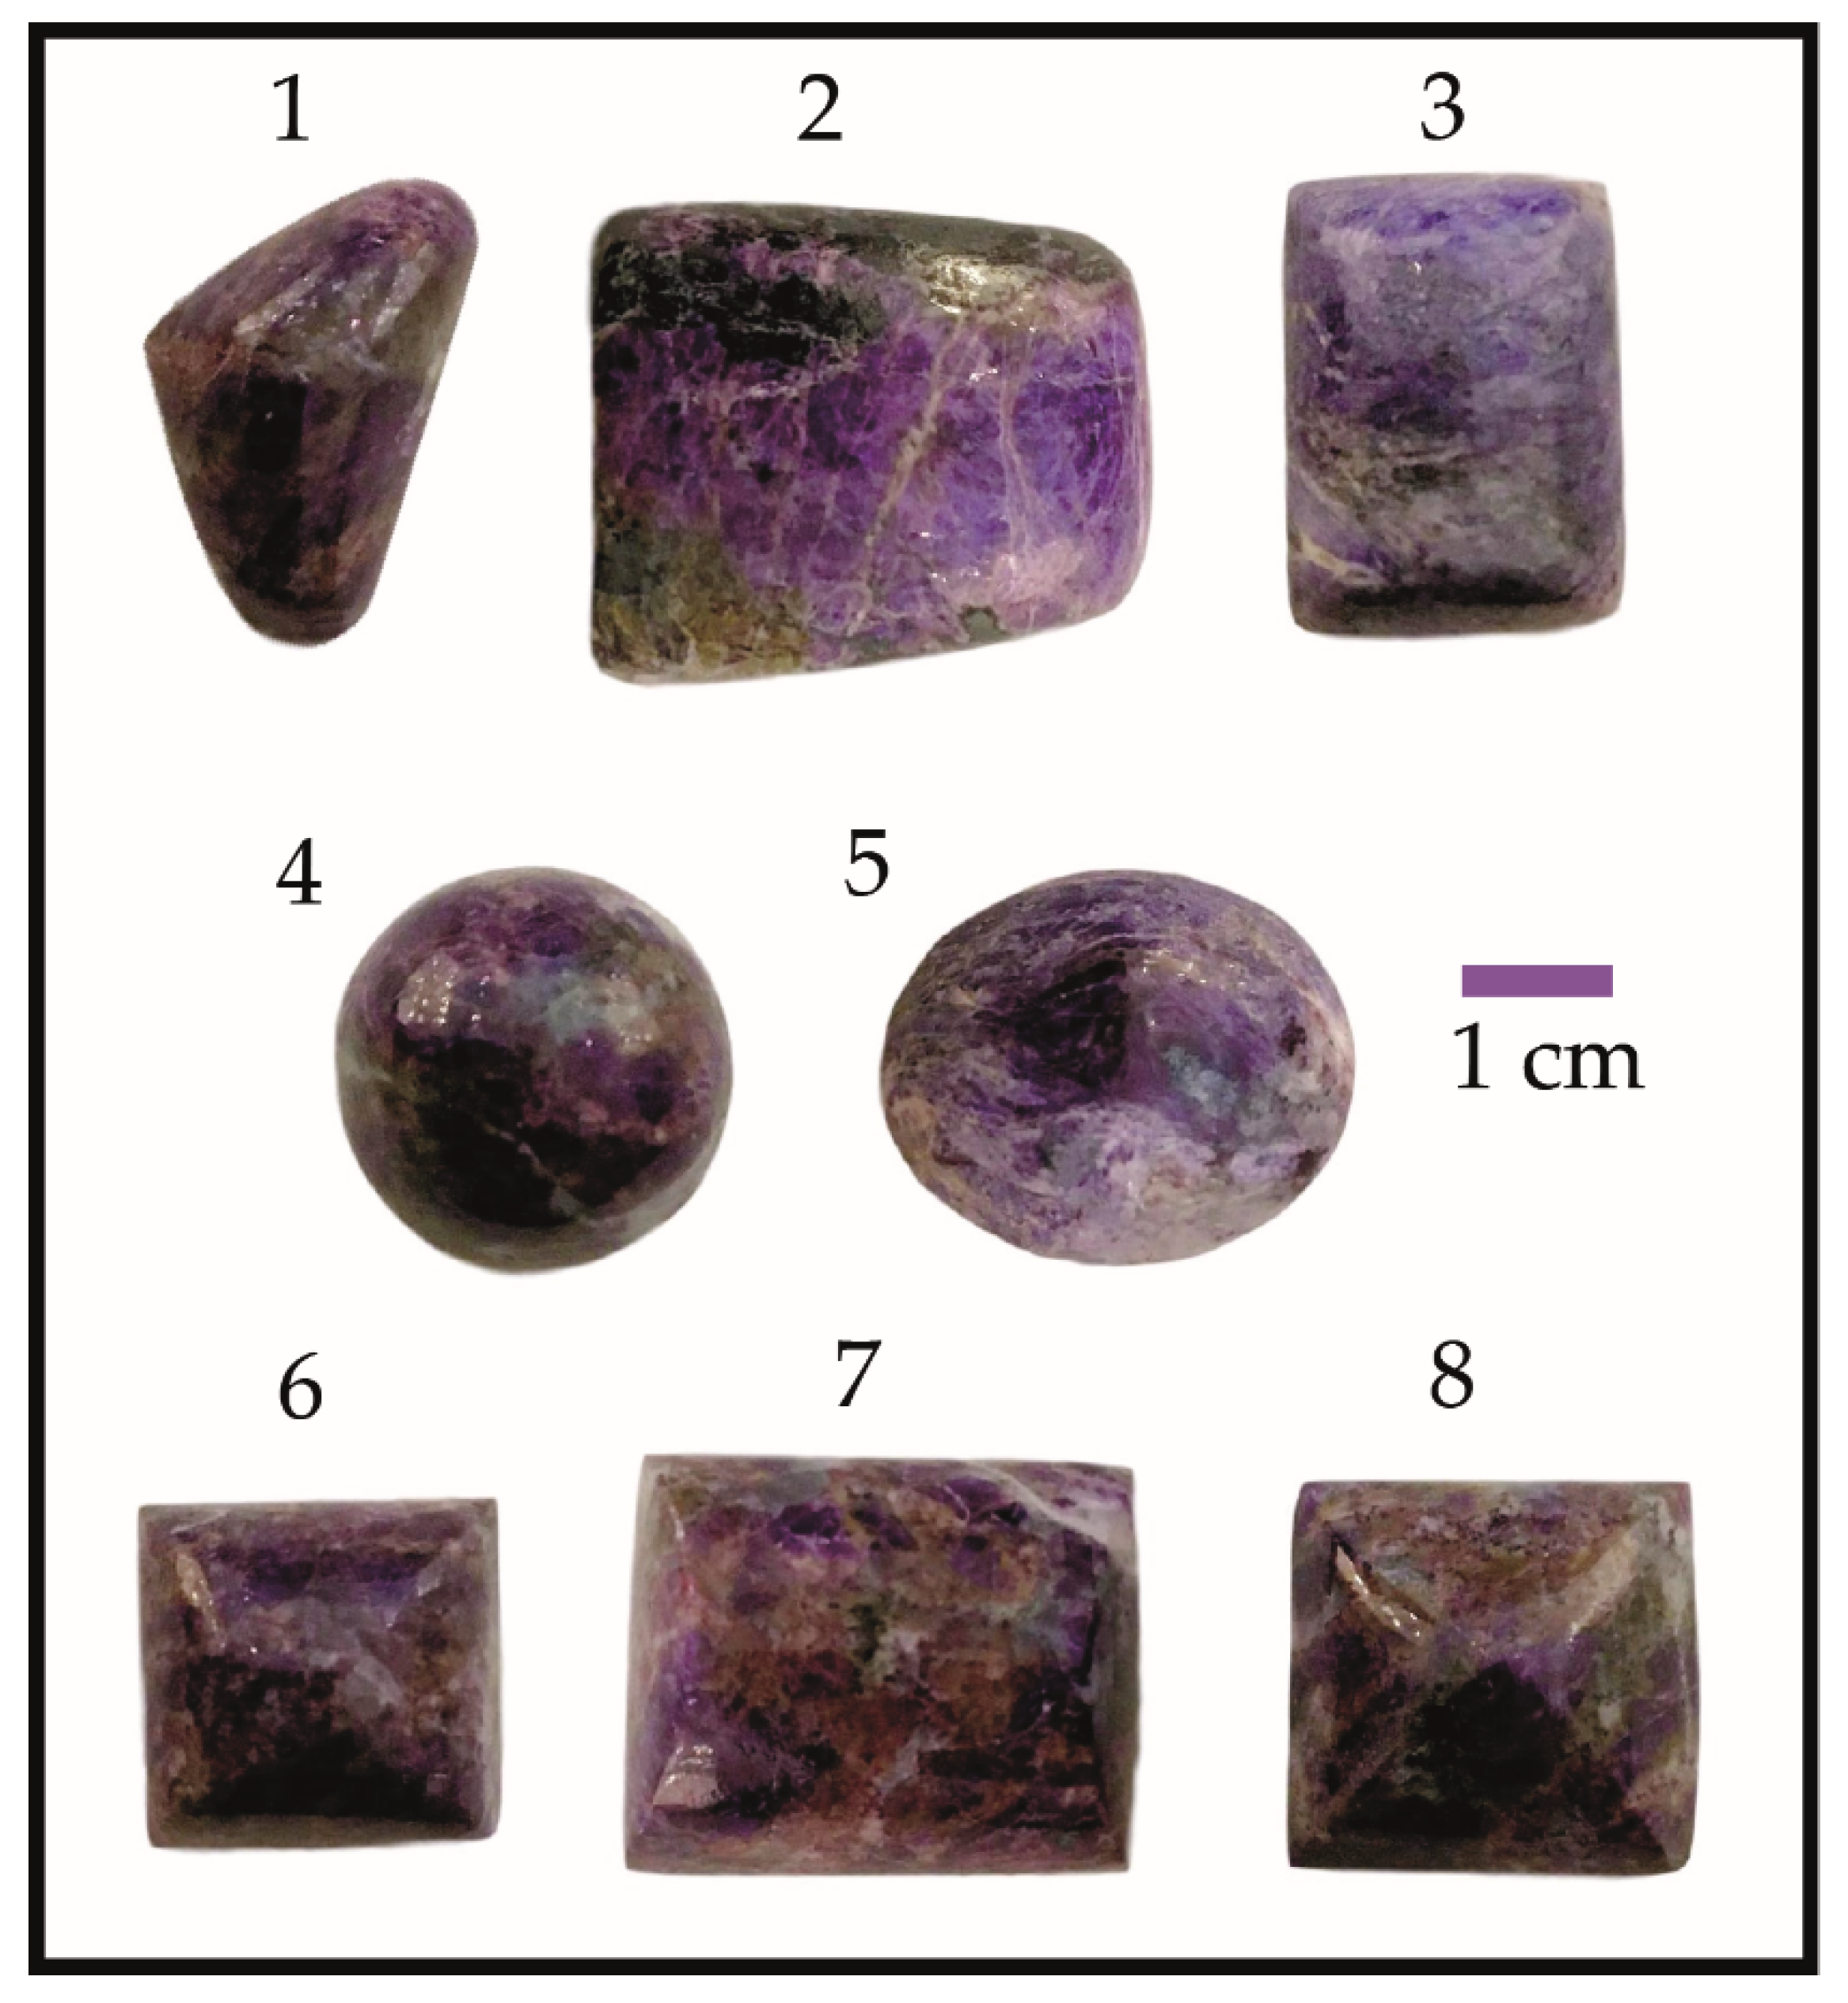
| Gem | Weight (ct) | SG (g/cm3) | Refraction Index | Color (GIA) | Cut/Shape |
|---|---|---|---|---|---|
| 1 | 11.54 | 2.98 | 1.694 | Pantone 2745U + 2695C Purple 4 − Blue Violet | Cabochon |
| 2 | 38.67 | 3.3 | 1.715 | Pantone 2745U + 273U Blue Violet − Purple 2 | Cabochon |
| 3 | 20.24 | 3.04 | 1.7 | Pantone 2747U + 5285C Slate Blue 1 | Cabochon |
| 4 | 10.42 | 2.92 | 1.68 | Pantone 2695C Purple 4 | Sphere |
| 5 | 12.01 | 2.96 | 1.685 | Pantone 2736U + 2738U Medium Slate Blue − Medium Purple 4 | Cabochon |
| 6 | 20.47 | 2.97 | 1.69 | Pantone 273U + 2695C Purple 4 − Blue Violet | Cabochon |
| 7 | 12.06 | 2.97 | 1.688 | Pantone 2695C Purple 4 | Cabochon |
| 8 | 11.73 | 2.99 | 1.698 | Pantone 273U + 2695C Purple 4 − Blue Violet | Cabochon |
| (a) | ||||||||||||||||
|---|---|---|---|---|---|---|---|---|---|---|---|---|---|---|---|---|
| Sample | PV2 | PV3 | PV3-12 | PV4 | ||||||||||||
| Average 43 pts | Minimum | Maximum | Average 20 pts | Minimum | Maximum | Diopside | Average 44 pts | Minimum | Maximum | |||||||
| SiO2 | 56.84 | 56.25 | 57.49 | 56.89 | 56.34 | 57.26 | 55.62 | 56.90 | 56.34 | 57.52 | ||||||
| TiO2 | 0.05 | - | 0.19 | 0.10 | 0.04 | 0.23 | - | 0.10 | - | 0.38 | ||||||
| Al2O3 | 10.05 | 8.98 | 11.94 | 9.49 | 7.77 | 10.49 | 0.67 | 10.30 | 8.62 | 12.13 | ||||||
| Cr2O3 | 0.01 | - | 0.09 | 0.01 | - | 0.06 | - | 0.01 | - | 0.08 | ||||||
| FeOtot | 1.14 | 0.20 | 3.91 | 1.05 | 0.36 | 3.09 | 1.51 | 1.52 | 0.19 | 4.45 | ||||||
| MnOtot | 1.18 | 0.70 | 1.65 | 1.25 | 1.08 | 1.46 | 0.16 | 0.98 | 0.59 | 1.47 | ||||||
| MgO | 9.75 | 8.07 | 11.03 | 10.20 | 9.24 | 11.07 | 16.99 | 9.51 | 7.24 | 11.17 | ||||||
| CaO | 14.11 | 11.60 | 15.79 | 14.65 | 13.52 | 15.92 | 24.68 | 13.72 | 10.05 | 16.42 | ||||||
| Na2O | 7.00 | 5.92 | 8.36 | 6.59 | 5.80 | 7.12 | 0.96 | 7.14 | 5.70 | 9.13 | ||||||
| Total | 100.14 | - | - | 100.25 | - | - | 100.59 | 100.20 | - | - | ||||||
| Fe2O3 | 1.27 | 0.22 | 4.35 | 1.17 | 0.40 | 3.43 | 1.68 | 1.68 | 0.21 | 4.95 | ||||||
| MnO | 0.56 | 0.01 | 1.28 | 0.69 | 0.26 | 1.23 | 0.16 | 0.66 | 0.01 | 1.31 | ||||||
| Mn2O3 | 0.69 | - | 1.54 | 0.62 | - | 1.10 | - | 0.35 | - | 1.29 | ||||||
| Total | 100.34 | - | - | 100.46 | - | - | 100.76 | 100.40 | - | - | ||||||
| Number of ions on the basis of 4 cations | ||||||||||||||||
| Si | 1.996 | - | - | 2.000 | - | - | 1.996 | 1.997 | - | - | ||||||
| AlIV | 0.004 | - | - | - | - | - | 0.004 | 0.003 | - | - | ||||||
| AlVI | 0.412 | - | - | 0.393 | - | - | 0.024 | 0.424 | - | - | ||||||
| Ti | 0.001 | - | - | 0.003 | - | - | - | 0.003 | - | - | ||||||
| Cr | - | - | - | - | - | - | - | - | - | - | ||||||
| Fe3+ | 0.034 | - | - | 0.031 | - | - | 0.045 | 0.044 | - | - | ||||||
| Mn2+ | 0.012 | - | - | 0.018 | - | - | 0.005 | 0.019 | - | - | ||||||
| Mn3+ | 0.023 | - | - | 0.019 | - | - | - | 0.010 | - | - | ||||||
| Mg | 0.511 | - | - | 0.534 | - | - | 0.909 | 0.498 | - | - | ||||||
| Ca | 0.531 | - | - | 0.552 | - | - | 0.949 | 0.516 | - | - | ||||||
| Na | 0.476 | - | - | 0.449 | - | - | 0.067 | 0.486 | - | - | ||||||
| Calculated end-members | ||||||||||||||||
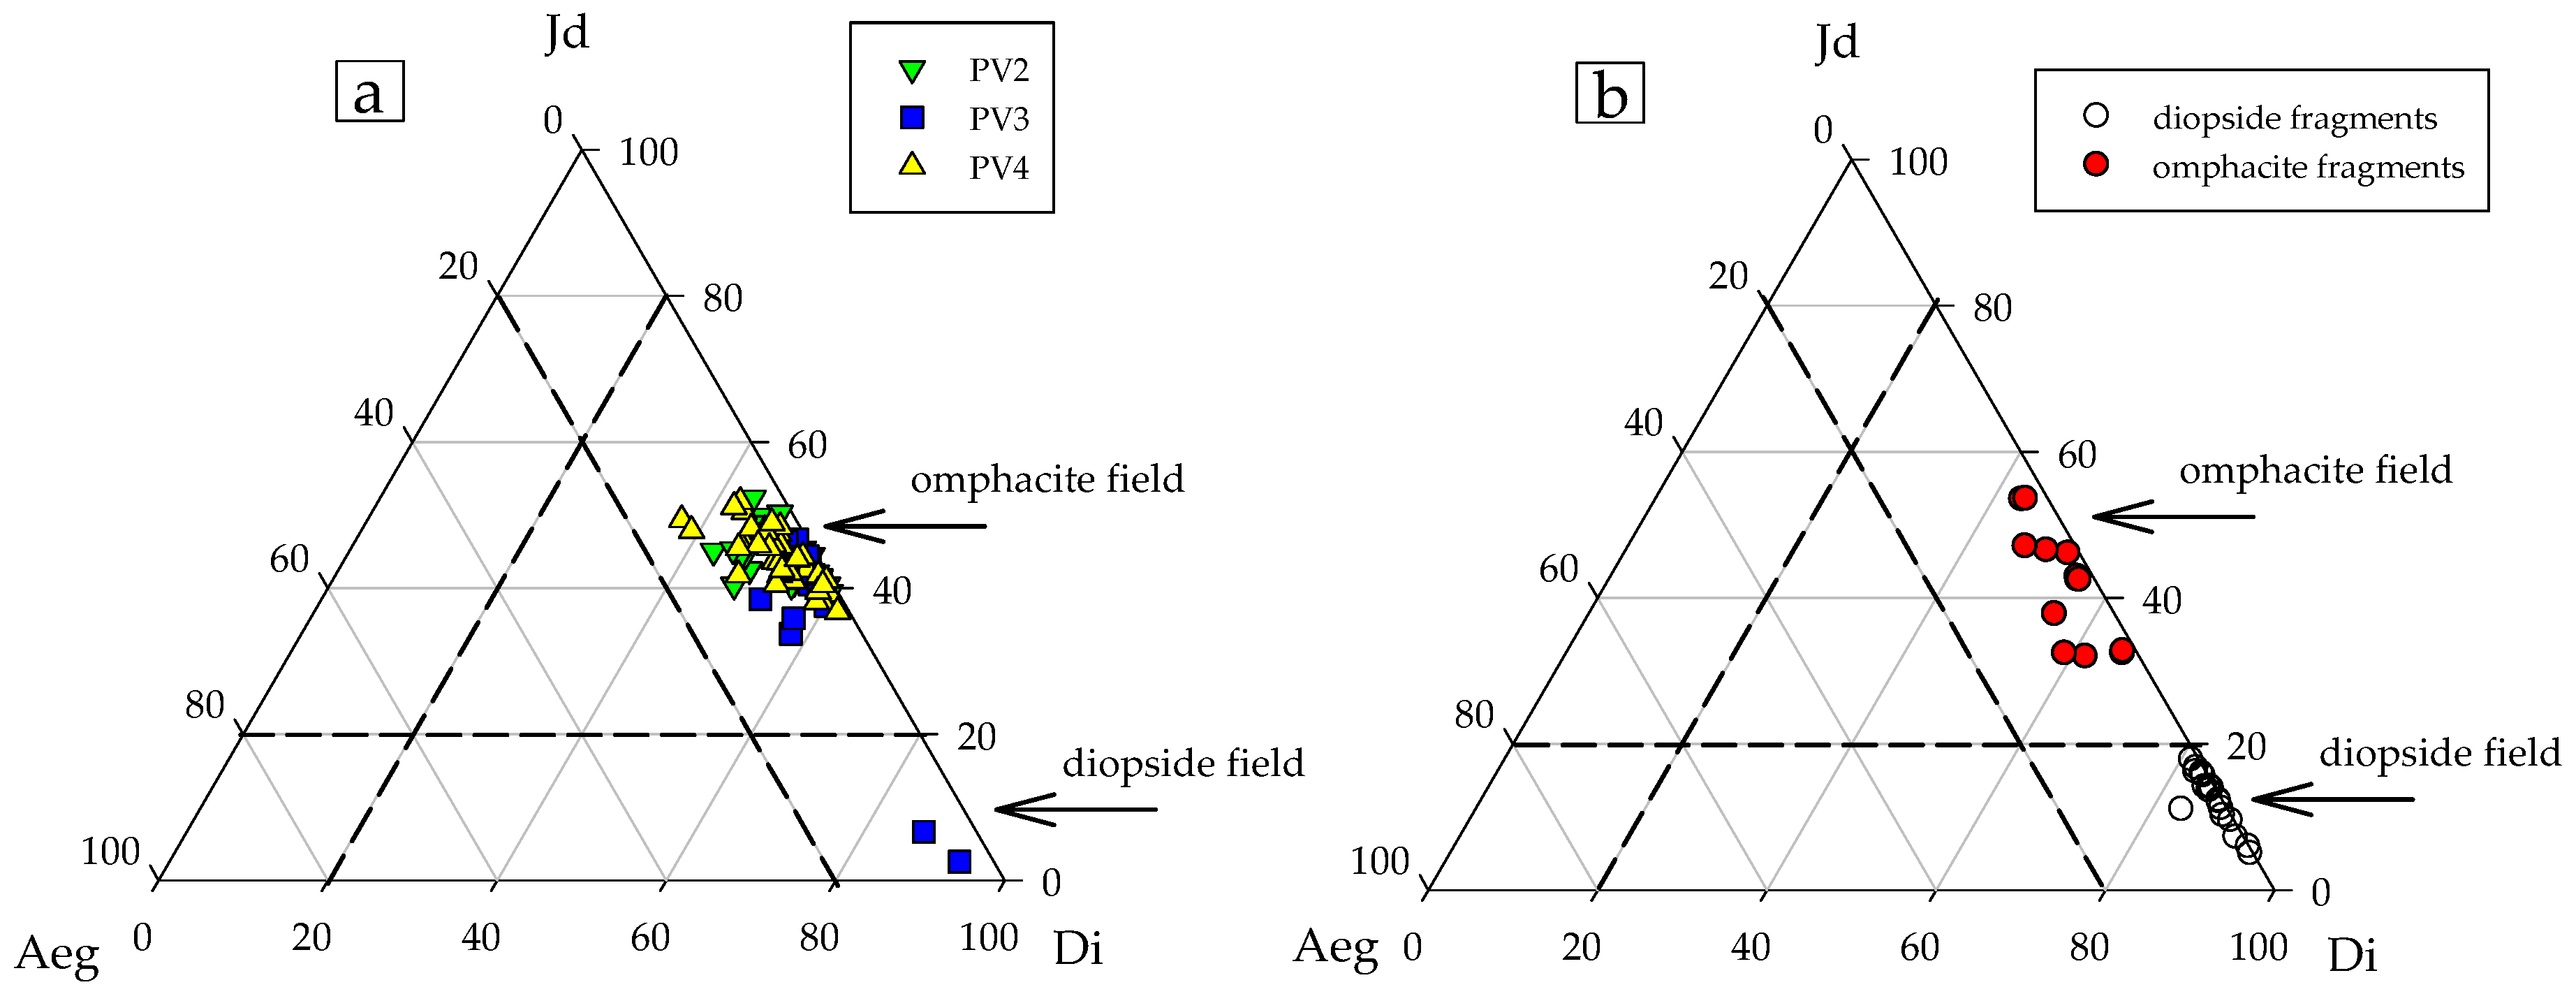
| Di | 0.52 | - | - | 0.53 | - | - | 0.93 | 0.50 | - | - | ||||||
| Jd | 0.42 | - | - | 0.40 | - | - | 0.03 | 0.43 | - | - | ||||||
| Aeg | 0.03 | - | - | 0.03 | - | - | 0.04 | 0.04 | - | - | ||||||
| Others | 0.04 | - | - | 0.04 | - | - | 0.00 | 0.03 | - | - | ||||||
| (b) | ||||||||||||||||
| Sample | Omphacite Fragments | Diopside Fragments | ||||||||||||||
| 3-1 | 3-2 | 6-1 | 12-1 | 12-2 | 13-1 | 13-2 | 1-1 | 1-2 | 2-1 | 2-2 | 6-2 | 10-1 | 10-2 | 17-1 | 17-2 | |
| SiO2 | 56.74 | 57.40 | 56.91 | 56.24 | 56.58 | 56.85 | 56.62 | 55.58 | 55.50 | 56.03 | 55.64 | 55.07 | 55.78 | 55.78 | 55.98 | 55.34 |
| TiO2 | 0.02 | 0.08 | - | 0.05 | 0.03 | 0.14 | 0.07 | 0.02 | 0.01 | 0.01 | 0.07 | - | 0.01 | 0.06 | - | 0.08 |
| Al2O3 | 7.62 | 10.76 | 10.69 | 8.98 | 7.03 | 9.13 | 7.31 | 3.12 | 2.38 | 3.85 | 3.19 | 2.85 | 2.23 | 2.51 | 3.62 | 1.10 |
| Cr2O3 | - | - | - | - | - | 0.03 | - | 0.02 | 0.03 | 0.01 | 0.02 | - | 0.02 | 0.03 | 0.01 | - |
| FeOtot | 0.58 | 0.44 | 1.90 | 2.38 | 1.97 | 0.56 | 2.74 | 0.31 | 0.33 | 0.29 | 0.37 | 1.99 | 0.15 | 0.23 | 0.19 | 0.11 |
| MnOtot | 0.96 | 1.00 | 0.99 | 0.98 | 1.19 | 1.40 | 1.04 | 1.23 | 0.92 | 1.16 | 1.10 | 0.84 | 1.07 | 1.50 | 1.43 | 0.72 |
| MgO | 12.06 | 10.09 | 9.29 | 10.31 | 11.69 | 10.90 | 10.98 | 15.26 | 15.77 | 14.78 | 15.55 | 15.44 | 16.23 | 15.64 | 15.00 | 17.32 |
| CaO | 17.48 | 14.33 | 12.39 | 14.55 | 16.62 | 15.18 | 15.98 | 22.10 | 23.18 | 21.45 | 22.09 | 21.19 | 23.34 | 22.69 | 21.54 | 24.59 |
| Na2O | 5.08 | 6.77 | 7.29 | 6.91 | 5.40 | 6.24 | 5.83 | 2.35 | 1.82 | 2.64 | 2.33 | 2.25 | 1.81 | 2.02 | 2.46 | 0.97 |
| Total | 99.99 | 99.95 | 99.46 | 100.69 | 100.38 | 100.40 | 100.51 | 100.21 | 100.36 | 100.56 | 98.52 | 99.63 | 100.53 | 99.77 | 100.44 | 100.58 |
| Fe2O3 | 0.64 | 0.49 | 2.11 | 2.64 | 2.19 | 0.62 | 3.05 | 0.34 | 0.37 | 0.32 | 0.41 | 2.21 | 0.17 | 0.25 | 0.21 | 0.12 |
| MnO | 0.53 | 1.00 | 0.99 | 0.08 | 1.19 | 1.40 | 1.04 | 0.56 | 0.45 | 0.77 | 0.73 | 0.84 | 0.21 | 0.72 | 1.03 | 0.29 |
| Mn2O3 | 0.47 | - | - | 0.99 | - | - | - | 0.75 | 0.53 | 0.43 | 0.41 | - | 0.96 | 0.87 | 0.44 | 0.49 |
| Total | 100.65 | 100.92 | 99.67 | 100.76 | 100.73 | 100.50 | 100.88 | 100.10 | 100.04 | 100.29 | 100.44 | 99.85 | 100.74 | 100.57 | 100.30 | 100.30 |
| Number of ions on the basis of 4 cations | ||||||||||||||||
| Si | 1.998 | 1.999 | 2.011 | 1.973 | 1.998 | 1.995 | 2.000 | 1.993 | 1.995 | 2.002 | 1.986 | 1.987 | 1.989 | 1.996 | 2.002 | 1.986 |
| AlIV | 0.002 | 0.001 | - | 0.027 | 0.002 | 0.005 | - | 0.007 | 0.005 | - | 0.014 | 0.013 | 0.011 | 0.004 | - | 0.014 |
| AlVI | 0.314 | 0.440 | 0.445 | 0.344 | 0.291 | 0.372 | 0.304 | 0.124 | 0.096 | 0.162 | 0.120 | 0.108 | 0.083 | 0.101 | 0.153 | 0.033 |
| Ti | - | 0.002 | - | 0.001 | 0.001 | 0.004 | 0.002 | 0.001 | - | - | 0.002 | - | - | 0.002 | - | 0.002 |
| Cr | - | - | - | - | - | 0.001 | - | 0.001 | 0.001 | - | 0.001 | - | - | 0.001 | - | - |
| Fe3+ | 0.017 | 0.013 | 0.056 | 0.070 | 0.058 | 0.016 | 0.081 | 0.009 | 0.010 | 0.009 | 0.011 | 0.060 | 0.004 | 0.007 | 0.006 | 0.003 |
| Mn2+ | 0.016 | 0.029 | 0.030 | 0.003 | 0.036 | 0.042 | 0.031 | 0.017 | 0.014 | 0.023 | 0.022 | 0.026 | 0.006 | 0.022 | 0.031 | 0.009 |
| Mn3+ | 0.013 | - | - | 0.026 | - | - | - | 0.020 | 0.014 | 0.012 | 0.011 | - | 0.026 | 0.024 | 0.012 | 0.013 |
| Mg | 0.633 | 0.524 | 0.489 | 0.539 | 0.616 | 0.570 | 0.578 | 0.816 | 0.845 | 0.787 | 0.827 | 0.830 | 0.863 | 0.834 | 0.800 | 0.927 |
| Ca | 0.660 | 0.535 | 0.469 | 0.547 | 0.629 | 0.571 | 0.605 | 0.849 | 0.893 | 0.821 | 0.845 | 0.819 | 0.892 | 0.870 | 0.825 | 0.946 |
| Na | 0.347 | 0.457 | 0.499 | 0.470 | 0.370 | 0.424 | 0.399 | 0.163 | 0.127 | 0.183 | 0.161 | 0.157 | 0.125 | 0.140 | 0.171 | 0.068 |
| Calculated end-members | ||||||||||||||||
| Di * | 0.64 | 0.51 | 0.46 | 0.54 | 0.60 | 0.53 | 0.57 | 0.82 | 0.86 | 0.79 | 0.82 | 0.81 | 0.87 | 0.84 | 0.80 | 0.92 |
| Jd ** | 0.32 | 0.45 | 0.46 | 0.37 | 0.31 | 0.41 | 0.31 | 0.13 | 0.10 | 0.16 | 0.14 | 0.11 | 0.09 | 0.11 | 0.15 | 0.05 |
| Aeg *** | 0.02 | 0.01 | 0.06 | 0.07 | 0.06 | 0.02 | 0.08 | 0.01 | 0.01 | 0.01 | 0.01 | 0.05 | - | 0.01 | 0.01 | - |
| Others | 0.03 | 0.03 | 0.03 | 0.03 | 0.03 | 0.04 | 0.03 | 0.04 | 0.03 | 0.04 | 0.03 | 0.03 | 0.03 | 0.05 | 0.04 | 0.02 |
| Sample | Omphacite Fragments | Diopside Fragments | |||||||||||||
|---|---|---|---|---|---|---|---|---|---|---|---|---|---|---|---|
| 3 | 4 | 6 | 7 | 12 | 13 | 1 | 2 | 8 | 9 | 10 | 14 | 15 | 16 | 17 | |
| Sc | 2.14 | 2.02 | 1.98 | 2.16 | 2.56 | 2.26 | 2.50 | 2.73 | 1.55 | 1.47 | 1.30 | 1.33 | 1.13 | 1.13 | 1.06 |
| Ti | 219.92 | 594.32 | 675.27 | 501.89 | 243.09 | 396.84 | 117.74 | 145.46 | 232.49 | 175.60 | 188.48 | 102.94 | 179.91 | 126.15 | 182.66 |
| V | 0.32 | 0.52 | 0.58 | 0.59 | 0.14 | 0.21 | 1.93 | 2.01 | 5.30 | 4.19 | 4.74 | 2.09 | 2.11 | 2.52 | 1.61 |
| Cr | 39.59 | 35.32 | 38.93 | 41.56 | 10.38 | 9.65 | 31.01 | 20.80 | 19.84 | 23.91 | 21.24 | 25.58 | 29.14 | 36.18 | 29.57 |
| Co | 82.00 | 98.18 | 125.23 | 175.77 | 49.16 | 45.77 | 150.94 | 130.86 | 76.85 | 78.64 | 79.56 | 137.90 | 151.07 | 155.34 | 153.14 |
| Ni | 92.84 | 120.46 | 128.94 | 120.57 | 191.43 | 195.61 | 149.35 | 102.90 | 103.33 | 109.76 | 106.81 | 105.94 | 151.69 | 163.66 | 164.59 |
| Zn | 41.99 | 45.17 | 49.06 | 76.00 | 65.01 | 60.97 | 43.14 | 38.95 | 51.13 | 50.13 | 52.68 | 37.84 | 42.27 | 43.25 | 41.65 |
| Sr | 47.53 | 60.98 | 53.31 | 74.05 | 45.24 | 42.12 | 171.91 | 212.75 | 26.30 | 19.01 | 29.88 | 200.16 | 161.00 | 191.97 | 152.99 |
| Y | 0.04 | 0.05 | 0.10 | 0.10 | 0.03 | 0.04 | 0.09 | 0.31 | 0.06 | 0.03 | 0.08 | 0.20 | 0.08 | 0.10 | 0.07 |
| Zr | 0.31 | 1.53 | 1.04 | 1.27 | 0.36 | 0.30 | 0.60 | 1.53 | 0.23 | 0.19 | 0.27 | 1.22 | 0.65 | 0.71 | 1.24 |
| Li | 66.39 | 58.77 | 84.65 | 68.84 | 56.04 | 53.29 | 28.28 | 30.04 | 18.34 | 24.66 | 16.59 | 24.78 | 27.70 | 27.00 | 31.41 |
| La | 0.008 | 0.009 | 0.011 | 0.010 | 0.024 | 0.025 | 0.030 | 0.076 | 0.055 | 0.088 | 0.092 | 0.038 | 0.055 | 0.047 | 0.055 |
| Ce | 0.005 | 0.002 | 0.006 | 0.023 | < | < | 0.006 | 0.021 | 0.002 | < | < | 0.004 | 0.009 | 0.005 | 0.013 |
| Pr | 0.005 | 0.006 | 0.009 | 0.019 | 0.008 | 0.076 | 0.086 | 0.110 | 0.146 | 0.203 | 0.273 | 0.074 | 0.086 | 0.085 | 0.097 |
| Nd | 0.046 | 0.137 | 0.124 | 0.117 | 0.103 | 0.396 | 0.429 | 0.653 | 1.180 | 1.530 | 1.995 | 0.629 | 0.645 | 0.689 | 0.603 |
| Sm | 0.028 | 0.060 | 0.078 | 0.106 | 0.026 | 0.262 | 0.140 | 0.242 | 0.243 | 0.213 | 0.416 | 0.182 | 0.202 | 0.186 | 0.135 |
| Eu | 0.015 | 0.018 | 0.023 | 0.024 | 0.011 | 0.041 | 0.033 | 0.034 | 0.047 | 0.047 | 0.047 | 0.029 | 0.040 | 0.012 | 0.053 |
| Gd | 0.078 | 0.073 | 0.030 | 0.077 | 0.041 | 0.139 | 0.097 | 0.114 | 0.125 | 0.174 | 0.163 | 0.037 | 0.100 | 0.107 | 0.145 |
| Tb | 0.005 | 0.003 | 0.008 | 0.005 | < | 0.019 | 0.009 | 0.015 | 0.003 | 0.009 | 0.007 | 0.008 | 0.008 | 0.006 | 0.007 |
| Dy | 0.009 | 0.022 | 0.065 | 0.022 | 0.012 | 0.019 | 0.034 | 0.052 | 0.009 | 0.040 | 0.014 | 0.020 | 0.053 | 0.021 | 0.038 |
| Ho | 0.003 | < | < | < | < | < | 0.003 | < | 0.002 | 0.004 | 0.003 | 0.006 | 0.011 | 0.006 | 0.010 |
| Er | < | 0.010 | 0.012 | 0.019 | < | < | 0.013 | 0.013 | 0.010 | 0.011 | 0.011 | < | < | 0.012 | 0.024 |
| Tm | < | < | 0.003 | < | < | 0.005 | < | < | < | 0.004 | 0.003 | < | 0.008 | 0.003 | 0.003 |
| Yb | < | < | 0.019 | < | < | < | < | 0.011 | < | 0.018 | 0.017 | < | < | < | < |
| Lu | < | < | < | < | < | < | < | 0.003 | < | < | < | < | < | 0.006 | < |
| ΣREE | 0.199 | 0.341 | 0.385 | 0.420 | 0.225 | 0.982 | 0.877 | 1.342 | 1.821 | 2.339 | 3.040 | 1.025 | 1.216 | 1.185 | 1.181 |
| (a) | ||||||||
|---|---|---|---|---|---|---|---|---|
| Point 5 | Point 6 | Point 7 | Point 8 | Point 9 | Point 19 | [35] | [37] | Bands |
| 236 | 225 | 227 | 225 | 226 | 225 | 229 | 230 | M-O stretch/bend |
| 256 | 254 | - | 267 | 255 | 256 | 255 | 248 | |
| 288 | - | - | 288 | - | 264 | - | 296 | |
| 321 | 328 | 322 | 322 | 325 | 328 | 325 | 323 | |
| 367 | - | 354 | 354 | - | - | 359 | 358 | |
| 383 | 390 | 388 | 388 | 391 | 393 | 389 | 389 | |
| 505 | 503 | 503 | 505 | 509 | 507 | 509 | 507 | O-Si-O bend |
| - | - | 527 | - | - | 527 | 529 | 527 | |
| 556 | 557 | 557 | 555 | 560 | 554 | 558 | 558 | |
| 664 | 665 | 665 | 665 | 666 | 667 | 666 | 665 | Si-Obr stretch |
| - | 885 | 855 | 859 | 874 | 858 | 854 | 853 | Si–Onbr stretch |
| 916 | 9011 | 909 | 906 | 912 | 915 | - | 907 | |
| 1010 | 1011 | 1010 | 1010 | 1013 | 1013 | 1010 | 1010 | |
| 1042 | 1043 | 1042 | 1045 | 1045 | 1046 | 1045 | 1045 | |
| (b) | ||||||||
| Point 3 | Point 4 | Point 13 | Point 15 | Point 16 | [37] | [38] | Bands | |
| 209 | 205 | 206 | 205 | - | 223 | 217 | M-O stretch/bend | |
| 243 | 240 | 249 | 239 | 236 | 248 | 264 | ||
| 295 | 288 | 290 | 297 | 300 | 296 | - | ||
| 338 | 333 | 330 | 335 | 337 | 327 | - | ||
| 347 | 347 | - | 349 | - | 356 | 343 | ||
| 376 | 376 | 389 | 377 | 373 | 389 | 376 | ||
| - | - | - | - | - | 451 | - | ||
| 487 | 477 | 478 | 490 | - | 480 | - | ||
| 510 | 505 | 507 | 505 | - | 506 | 522 | O-Si-O bend | |
| 561 | 557 | - | 563 | 557 | 563 | 558 | ||
| 606 | - | 605 | - | - | - | 605 | ||
| 680 | 680 | 668 | 679 | 679 | 667 | 668 | Si-Obr stretch | |
| 743 | 747 | - | - | - | - | 747 | ||
| 864 | 862 | 866 | - | 860 | - | Si-Onbr stretch | ||
| 884 | 887 | - | 883 | - | 878 | - | ||
| 917 | 912 | - | 910 | - | 907 | 910 | ||
| 1020 | 1012 | 1013 | 1021 | 1022 | 1013 | 1022 | ||
Publisher’s Note: MDPI stays neutral with regard to jurisdictional claims in published maps and institutional affiliations. |
© 2021 by the authors. Licensee MDPI, Basel, Switzerland. This article is an open access article distributed under the terms and conditions of the Creative Commons Attribution (CC BY) license (http://creativecommons.org/licenses/by/4.0/).
Share and Cite
Diella, V.; Bocchio, R.; Caucia, F.; Marinoni, N.; Langone, A.; Possenti, E. New Insights for Gem-Quality Mn-Bearing Diopside-Omphacite, Violane Variety, from Saint Marcel (Val D’Aosta, Italy): Its Trace Elements and Spectroscopic Characterization. Minerals 2021, 11, 171. https://doi.org/10.3390/min11020171
Diella V, Bocchio R, Caucia F, Marinoni N, Langone A, Possenti E. New Insights for Gem-Quality Mn-Bearing Diopside-Omphacite, Violane Variety, from Saint Marcel (Val D’Aosta, Italy): Its Trace Elements and Spectroscopic Characterization. Minerals. 2021; 11(2):171. https://doi.org/10.3390/min11020171
Chicago/Turabian StyleDiella, Valeria, Rosangela Bocchio, Franca Caucia, Nicoletta Marinoni, Antonio Langone, and Elena Possenti. 2021. "New Insights for Gem-Quality Mn-Bearing Diopside-Omphacite, Violane Variety, from Saint Marcel (Val D’Aosta, Italy): Its Trace Elements and Spectroscopic Characterization" Minerals 11, no. 2: 171. https://doi.org/10.3390/min11020171
APA StyleDiella, V., Bocchio, R., Caucia, F., Marinoni, N., Langone, A., & Possenti, E. (2021). New Insights for Gem-Quality Mn-Bearing Diopside-Omphacite, Violane Variety, from Saint Marcel (Val D’Aosta, Italy): Its Trace Elements and Spectroscopic Characterization. Minerals, 11(2), 171. https://doi.org/10.3390/min11020171