Article

Climate Resilience of Internally-Insulated Historic Masonry Assemblies: Comparison of Moisture Risk under Current and Future Climate Scenarios

by
Jacqueline Lu
1,*,
Valentina Marincioni
1,
Scott Allan Orr
2 and
Hector Altamirano-Medina
1
1
UCL Institute for Environmental Design and Engineering, Central House, 14 Upper Woburn Pl, London WC1H 0NN, UK
2
UCL Institute for Sustainable Heritage, Central House, 14 Upper Woburn Pl, London WC1H 0NN, UK
*
Author to whom correspondence should be addressed.
Minerals 2021, 11(3), 271; https://doi.org/10.3390/min11030271
Submission received: 30 January 2021 / Revised: 26 February 2021 / Accepted: 2 March 2021 / Published: 6 March 2021
(This article belongs to the Special Issue Moisture Issue in Historical Masonry)

Abstract

:
The conservation of cultural heritage built of historical brick masonry alongside meeting targets in energy reduction will most likely require widespread installation of internal wall insulation (IWI). In London, traditional buildings (pre-1919) make up 40% of the existing stock and insulating from the interior is a likely retrofit solution for solid brick walls. Adding insulation may introduce a higher risk to moisture accumulation and consequences such as mould growth and material decay. To investigate resilience to future moisture loads, three interior insulation assemblies (conforming to two U-value guidelines) were simulated in DELPHIN under reference, near-future (2040), and far-future climate (2080) scenarios. Calcium silicate, phenolic foam, and wood fibre assemblies were simulated. The reference year climate file was compiled from observed data and future files developed using the UK Climate Projections 2018 (UKCP18). Assemblies were evaluated for moisture accumulation, mould growth risk, and freeze-thaw (FT) risk. Results show low-to-medium risks in 2040 and high risks in 2080, assemblies of higher absorptivity and thinner insulation comparatively performing best. The calcium silicate assembly fared best for moisture performance; however, all assemblies will be subject to high moisture risk levels in the far future and responsible retrofits must take this and alternative design solutions into account.

1. Introduction

There is a global call to action to tackle the climate crisis; in the most recent update to the Climate Change Act 2008, the UK became the first major economy to pledge net zero emissions by 2050 [1]. In the UK, building operations account for 34% of the nation’s greenhouse gas emissions with fossil fuel heating making up almost half of energy use [2]. With around 25% of homes built prior to 1919 [3], internal wall insulation (IWI) is the likely method of bringing solid wall homes to modern energy performance standards while preserving the aesthetic and conservational value of historic exteriors [4].
While IWI offers energy-saving benefits, it changes the hygrothermal behaviour: it introduces extra vapour and thermal resistance, reducing inward drying and posing a risk for mould growth [5]. Accumulation of moisture can lead to a host of problems affecting both building and occupant health and comfort. In a Danish study, solid masonry with diffusion-open insulation showed hygrothermal differences to the uninsulated case: observations over 30 months showed 20–30% higher humidity levels and lower temperature throughout the masonry [6]. Mould thrives under high relative humidity and can lead to timber decay [7] and a higher risk of respiratory illnesses [8]. High moisture content is also a prime factor in freeze-thaw (FT) damage when water expands within pores and imposes high material stresses. In a Swedish study, an internally insulated case was modelled to have a higher number of freeze-thaw cycles and ice content than the original solid brick [9].
Wind-driven rain (WDR) results from the joint occurrence of wind and rain, where wind induces a horizontal force to create oblique rain [10]. It is a prominent wetting mechanism, putting significant external moisture loads on an assembly [11]. The moisture load from WDR has been studied to be the most critical to moisture risk [12,13,14,15]. In studies which combine IWI options and WDR analysis, results generally show capillary-active assemblies [16,17], namely calcium silicate-based [18] to result in lowest moisture levels.
The changing climate will ultimately impact the environmental loads buildings will experience. Specifically, under a high emission (i.e., RCP8.5) scenario in the UK Climate Projections 2018 (UKCP18), there will be a 27% increase in average winter precipitation and an increase in hourly extremes [19]. WDR is a key concern due to these changes, with exposure levels studied from the previous UK Climate Projections 2009 (UKCP09). projections predicting increased events of shorter duration and higher volume [20]. In studying the subsequent effects of future WDR loads on various facades, simulations were performed under multiple Swedish climate scenarios and showed increased water content in both wood and concrete exteriors [21]. Other studies on future moisture risk exist, however they do not discuss WDR. Existing internal retrofitting options for South Tyrol were expected to have increased condensation risk in the future [22]. In North America, results from hygrothermal simulations also illustrate the future climate providing conditions that favour mould growth compared to the reference climate [23]. There is limited research linking future WDR exposures to hygrothermal performance of solid brick walls with IWI retrofits. As simulations require location-specific weather data, an opportunity is presented here to explore London’s future climate and how moisture loads are likely to affect various types of retrofits.
A wide range of research has investigated moisture risk topics, IWI in solid brick walls, wind-driven rain, and future climate. Studies either explored one of these in-depth or as a pair. Studies have also been observed to be concentrated in Nordic, Central European, and Scottish climates (e.g., [21] in Sweden, [13] in northern Italy, and [24] in Scotland). From this review, no study has explored the link of future moisture exposure (inclusion of WDR) to moisture risks in IWI assemblies. Specifically, the latest UKCP18 projections have not yet been used in hygrothermal simulations and their application in London. The UKCP18 projections have been designed to replace the previous UKCP09 scenarios, refined with new emissions scenarios, new generations of climate models, and an updated baseline of 1981–2000, which was used to evaluate historical simulation skill. UKCP18 has improved regional climate variability and projections of kilometre scale resolution (2.2 km) [19]. This study aimed to understand future moisture loads and how various IWI retrofit assemblies will perform in these scenarios

2. Materials and Methods

Observed weather data were used to develop the reference year climate file, one representative of near-extreme climate conditions. Of the various weather stations around London, the London Weather Centre (LWC) was chosen for its proximity to the Borough of Wandsworth and data availability. Wandsworth is the borough with the highest number of dwellings (67,270) built pre-1919. Per ISO 15927, 15 years of climate data spanning 1990–2005 [25] were analysed to select the year with the 90th percentile total annual rainfall and used for simulation as the reference climate; 1992 was excluded due to insufficient data, while 1990–2005 was selected as it included the most complete data for the variables required for simulation listed in Table 1. A full wetting (October–March) and drying (April–September) cycle was used to analyse yearly rainfall. Atmospheric counter radiation was calculated using empirical relationships between cloud index, temperature, and vapour pressure. This method is also used by the WUFI hygrothermal simulation software [26].
For future climate conditions, the UKCP18 projections and weather morphing were used to produce climate files. Raw data containing hourly projections at the 2.2 km grid were available from the CEDA archive for the RCP8.5 high-emissions scenario [27]. The high-emissions scenario is frequently referred to as “business as usual”, suggesting climate outcomes if countries do not reduce emissions. The UKCP18 projections contain data for three periods: 1980–2000, 2020–2040, and 2060–2080. The years 2040 and 2080 were selected for near and far future, respectively. The UKCP18 projections contain 12 ensembles for each year. Each ensemble represents a plausible simulation of the future. The ensembles used in the study were selected using 2080 rainfall data considering the 90th percentile rainfall. Variables required for simulation and their availability from UKCP18 are listed in Table 1. In addition to calculating long-wave counter radiation above, diffuse shortwave radiation was calculated by splitting the given global horizontal radiation into diffuse and direct components via k , a diffuse radiation ratio [28]. Wind speed and direction were calculated using the given Northward and Eastward wind vectors.
The UKCP18 projections provided hourly values for temperature and precipitation. A morphing procedure was used [29] to downscale the remaining daily variables to a finer hourly timescale. This procedure uses the reference climate year data and “morphs” them by applying a shift or scaling factor, based on future projections.
The general equation from ISO 15927-3:2009 was used to calculate the hourly WDR intensity in L/m2. This method uses hourly wind and precipitation data (Equation (1)).
I = 2 9 v r 8 9 cos ( D θ ) ,
v : vertical rain [mm], r : wind speed [m/s], D : prevailing wind direction [°], θ : facade orientation [°].
A total of 24 hygrothermal simulations were carried out in DELPHIN 6.0 [30]: one selection from each category (thermal performance, wall assembly, and climate file) in Figure 1 made up each simulation run. Each climate file consisted of data for one wetting and drying cycle (October–October); three cycles were simulated continuously by repeating the climate file.
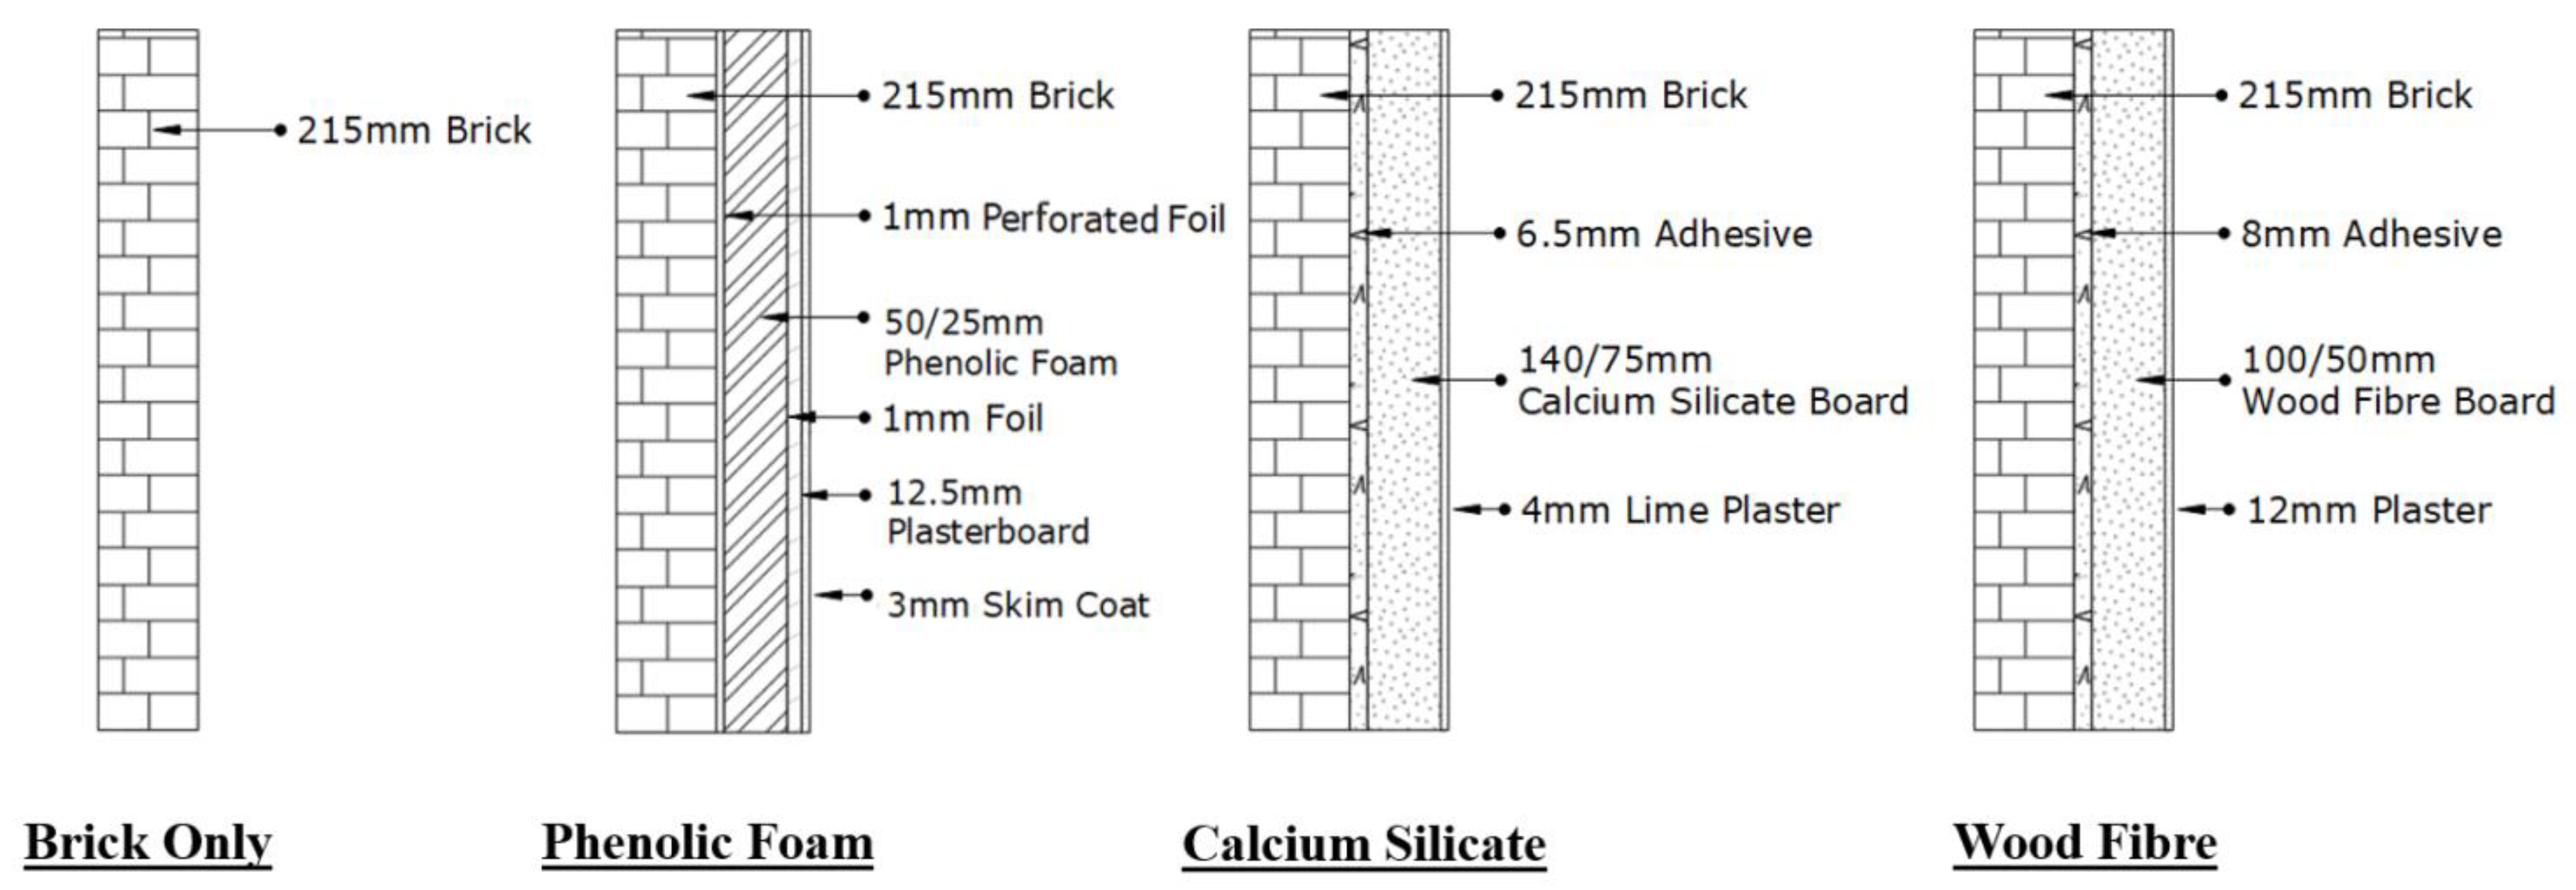
The wall assemblies were selected to represent existing conditions of a solid brick wall (assuming no other wall components) and three popular internal solid wall insulation materials (Figure 2). Using DELPHIN’s material database, a clustering technique was used to group bricks by their properties [31]. From Cluster 2 (historical bricks of clay and loam), brick ZG was selected for its median values as well as matching the BRE solid wall survey’s median values [32]. Brick thickness was based upon the common 9” build in UK solid walls [33]. Insulation thicknesses were selected to achieve identical U-values across assemblies. Two U-values were simulated: a “low” U-value of 0.35 W/(m2K) guided by Building Regulations Part L [34] and a “high” U-value of 0.6 W/(m2K) recommended by the Bristolian’s Guide to Internal Wall Insulation [35] was used to compare retrofit thicknesses for solid walls and effects on moisture performance. The three insulation assemblies selected are presented in Table 2.
The analysis considered two capillary active systems developed for internal wall insulation: calcium silicate and dense wood fibre board [39]. Calcium silicate has a very high water absorption (i.e., high sorption in the over-hygroscopic range). Wood fibre is the most common capillary active system in the UK [40] and has a high water vapour sorption in the hygroscopic range. These capillary active systems were compared with phenolic foam, one of the most used insulation systems in the UK together with poly-isocyanurate and polyurethane [39].
Assemblies were modelled as 1D components. This common approach is used in hygrothermal assessments as it manages computational demand while having capability to give first indication of differences in assembly performance. All simulations were performed for a vertical wall with southern exposure. A south orientation was chosen since it is subject to the largest proportion of prevailing winds and thus WDR, making it most critical to moisture loads at London’s latitude. WDR was calculated using DELPHIN’s standard rain model, following ISO 15927-3. A rain exposure coefficient of 0.7 was used, representing a sheltered building less than 10 m in height from ASHRAE 160P [41]. To represent the average indoor conditions, temperature and RH was set to 20 °C and 50% for all simulations. The indoor conditions were constant throughout all simulations to focus the subsequent analysis on the impact of changing exterior conditions. Initial material temperature and relative humidity were set to default 20 °C and 80%, respectively.
BS EN 15026-2007 is the widely-used standard for moisture transfer by numerical methods applied in hygrothermal simulations. However, it has no moisture risk assessment criteria. To assess moisture balance of the various assemblies, total moisture content (liquid water, water vapour, and ice) was monitored to see if there was wetting, drying, or equilibrium reached throughout the simulation period.
Monitors were placed at interface of brick and insulation to compare risk of condensation and mould growth across assemblies. Mould growth was predicted via the VTT model, an empirical model that predicts mould growth as a function of temperature, relative humidity, and substrate [42,43]. In this model, the extent of mould growth on a surface is described by a mould index, M (-), ranging from 0 (no growth) to 6 (full coverage of a surface). In addition, freeze-thaw risk was evaluated by monitoring ice content in the outer 1 cm of the brick through the simulation period, as this is where the risk is highest. Traditionally, a critical degree of saturation is used to represent a porous material’s resistance to damage from freezing [9]. As there may still be freeze-thaw occurring at lower moisture contents, total ice content was monitored in simulations to observe impacts of the changing climate.

3. Results

3.1. Climate Analysis

From the 15 years of continuous weather data analysed, 1999 was ranked to have annual rainfall nearest to the 90th percentile and selected to represent the near-extreme reference climate for simulations. For future climate, a similar ranking process was undertaken for the 12 available projection sets. Ensemble 1 (90th percentile) was selected for climate file creation.
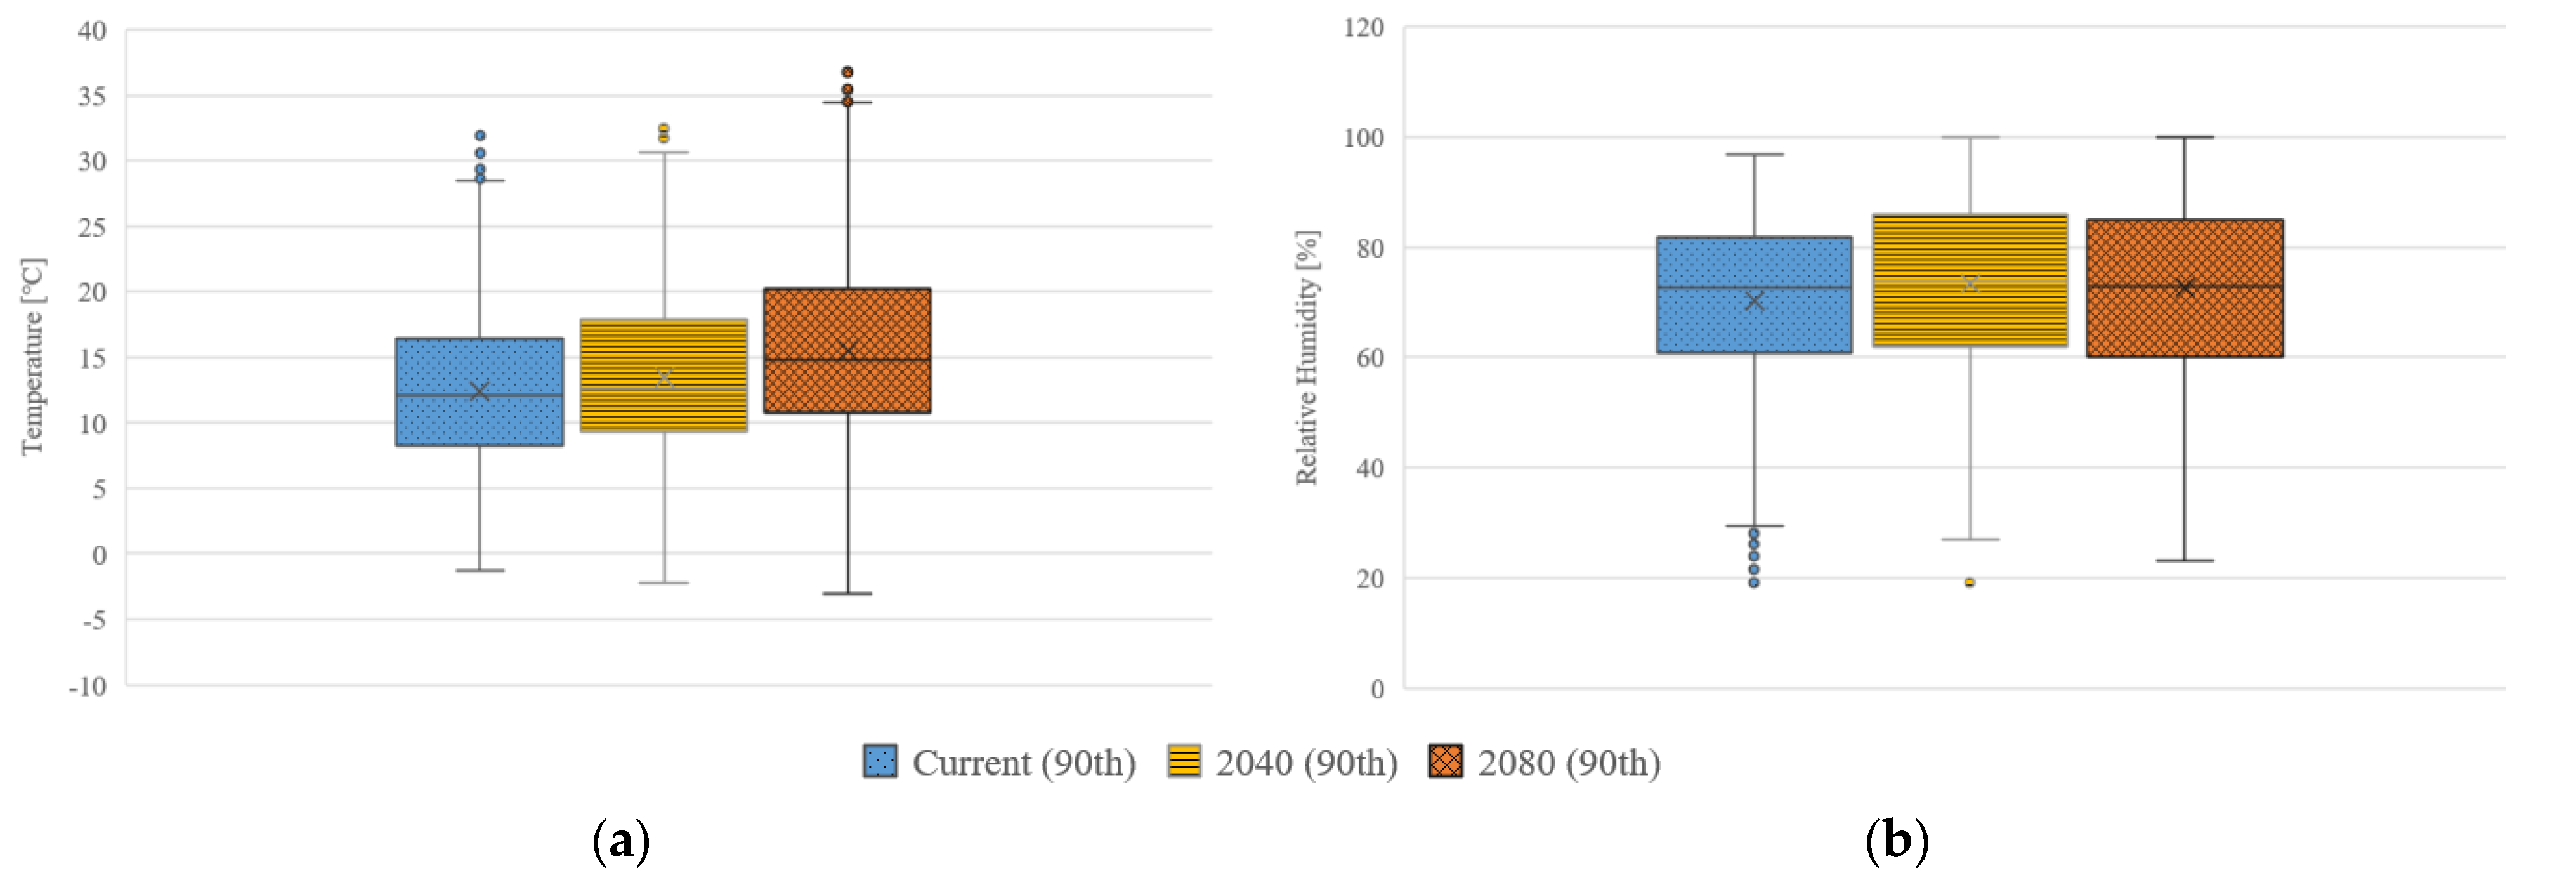
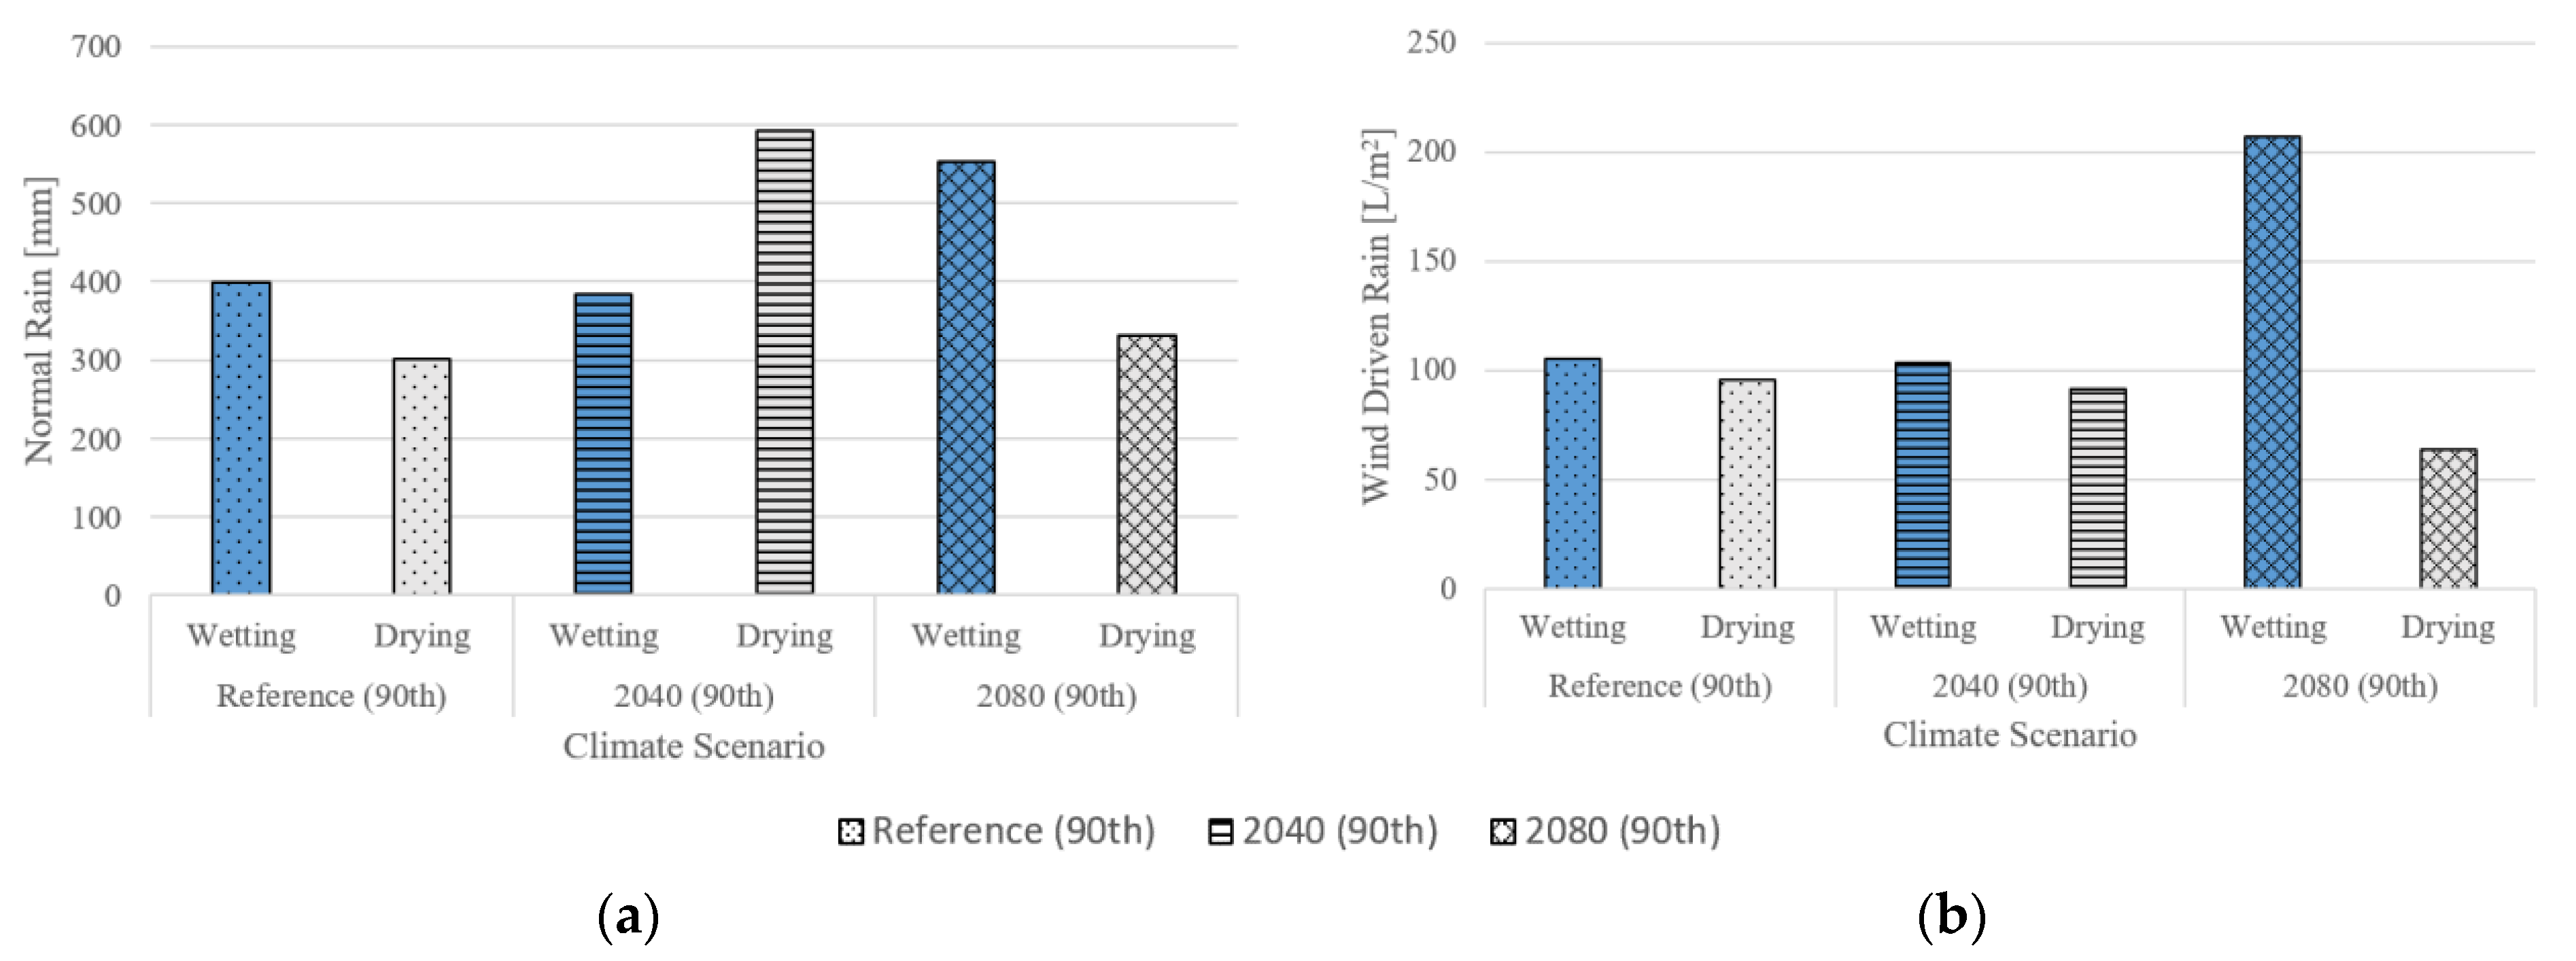
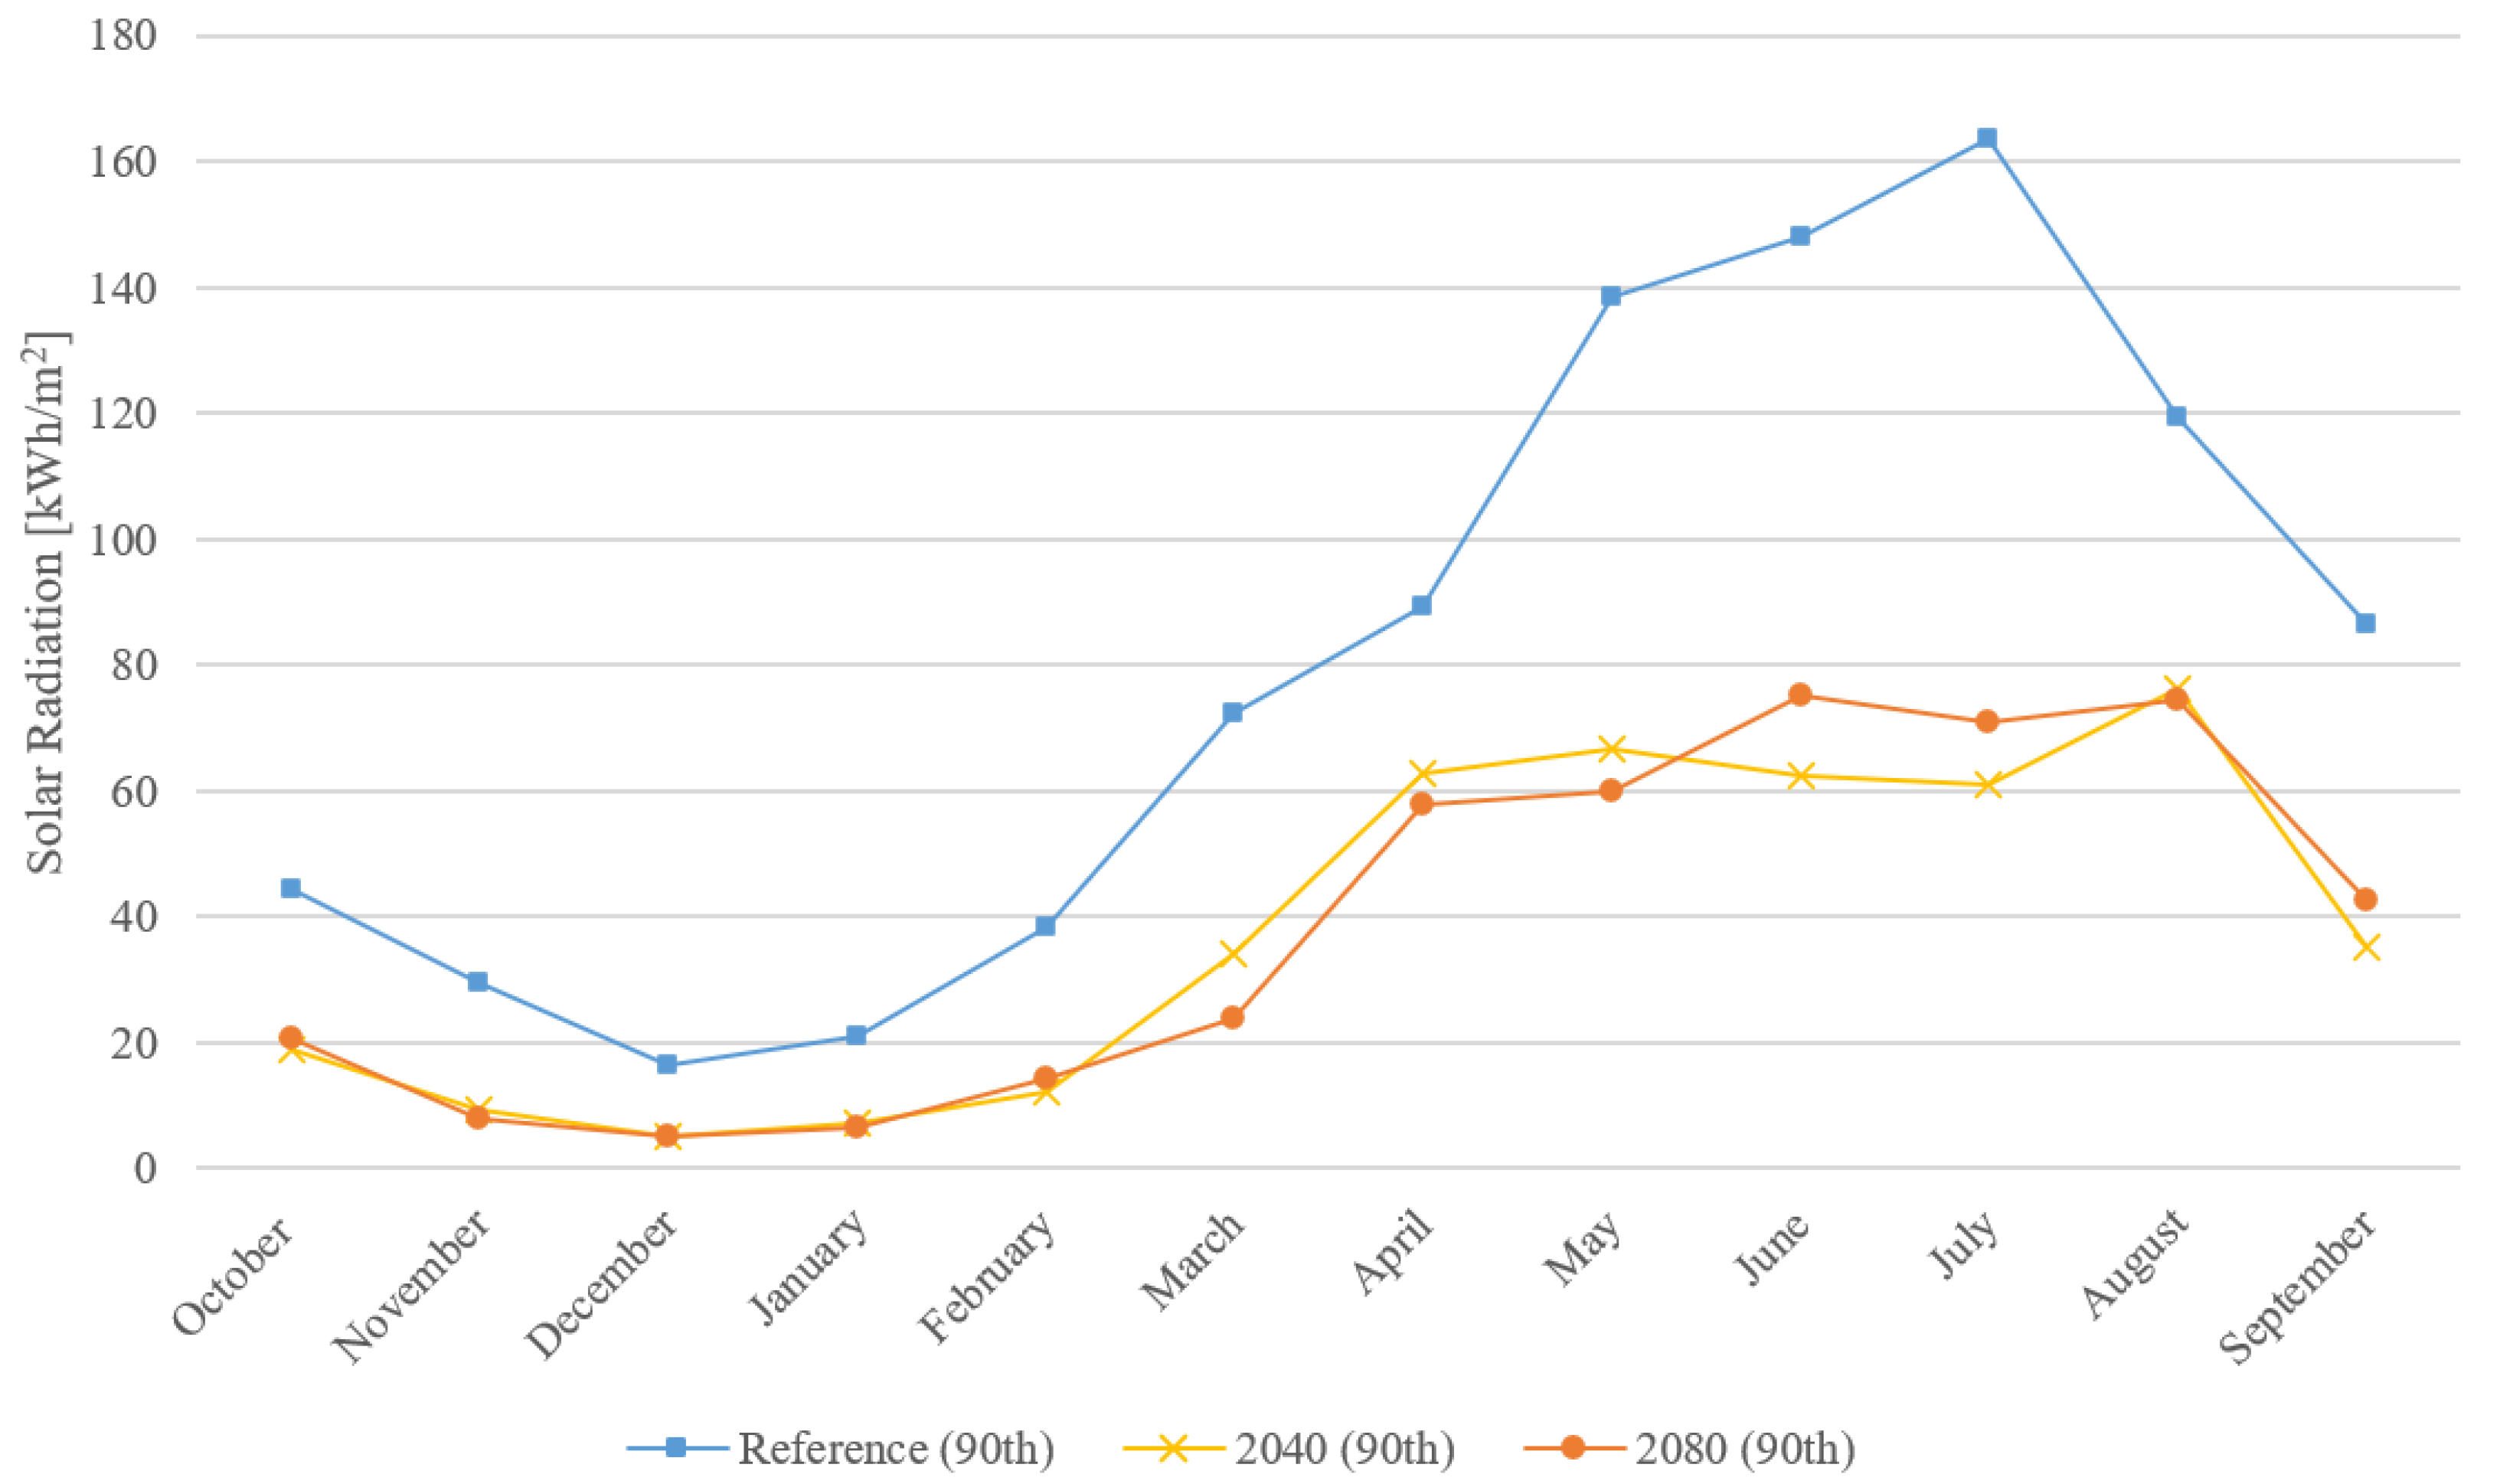
Figure 3, Figure 4 and Figure 5 summarise important differences between the investigated climate scenarios. Between reference and 2080 (90th) climates, the average yearly temperature increases by approximately 3 °C with summers becoming warmer. The range of temperatures also increases: reference climate has a difference of 33.2 °C between minimum and maximum temperatures, whereas 2080 (90th) climate has a 40.1 °C difference. Along with increasing temperatures, the annual WDR index also increases with time. The overall trends observed are cooler, wetter winters and hotter, drier summers. Future climate also results in higher relative humidity and significantly lower solar radiation.

3.2. Hygrothermal Simulations

3.2.1. Moisture Accumulation

In the reference climate, no assemblies showed an increase in total water content over the three simulation years with consistent wetting and drying cycles (Figure 6a). In the future 2080 climate, however, moisture content increased slightly with each year in all assemblies: the largest increase was approximately 2 kg for wood fibre between year 1 and year 2. Compared to the reference climate, total moisture content increases drastically with much higher variations in 2080 (Figure 6b). This is consistent with an annual WDR intensity increase from 202 to 271 L/m2 from reference to 2080 climate. It is difficult to compare total moisture content between assemblies as each insulation material is different in absorptivity. Although the calcium silicate insulation had higher absorptivity than wood fibre insulation, the wood fibre assembly had higher moisture content, due to the higher sorption isotherm of wood fibre in the hygroscopic range. Calcium silicate’s board adhesive (i.e., glue mortar) likely limited its water uptake inward compared to wood fibre.

3.2.2. Interstitial Condensation and Mould Risk

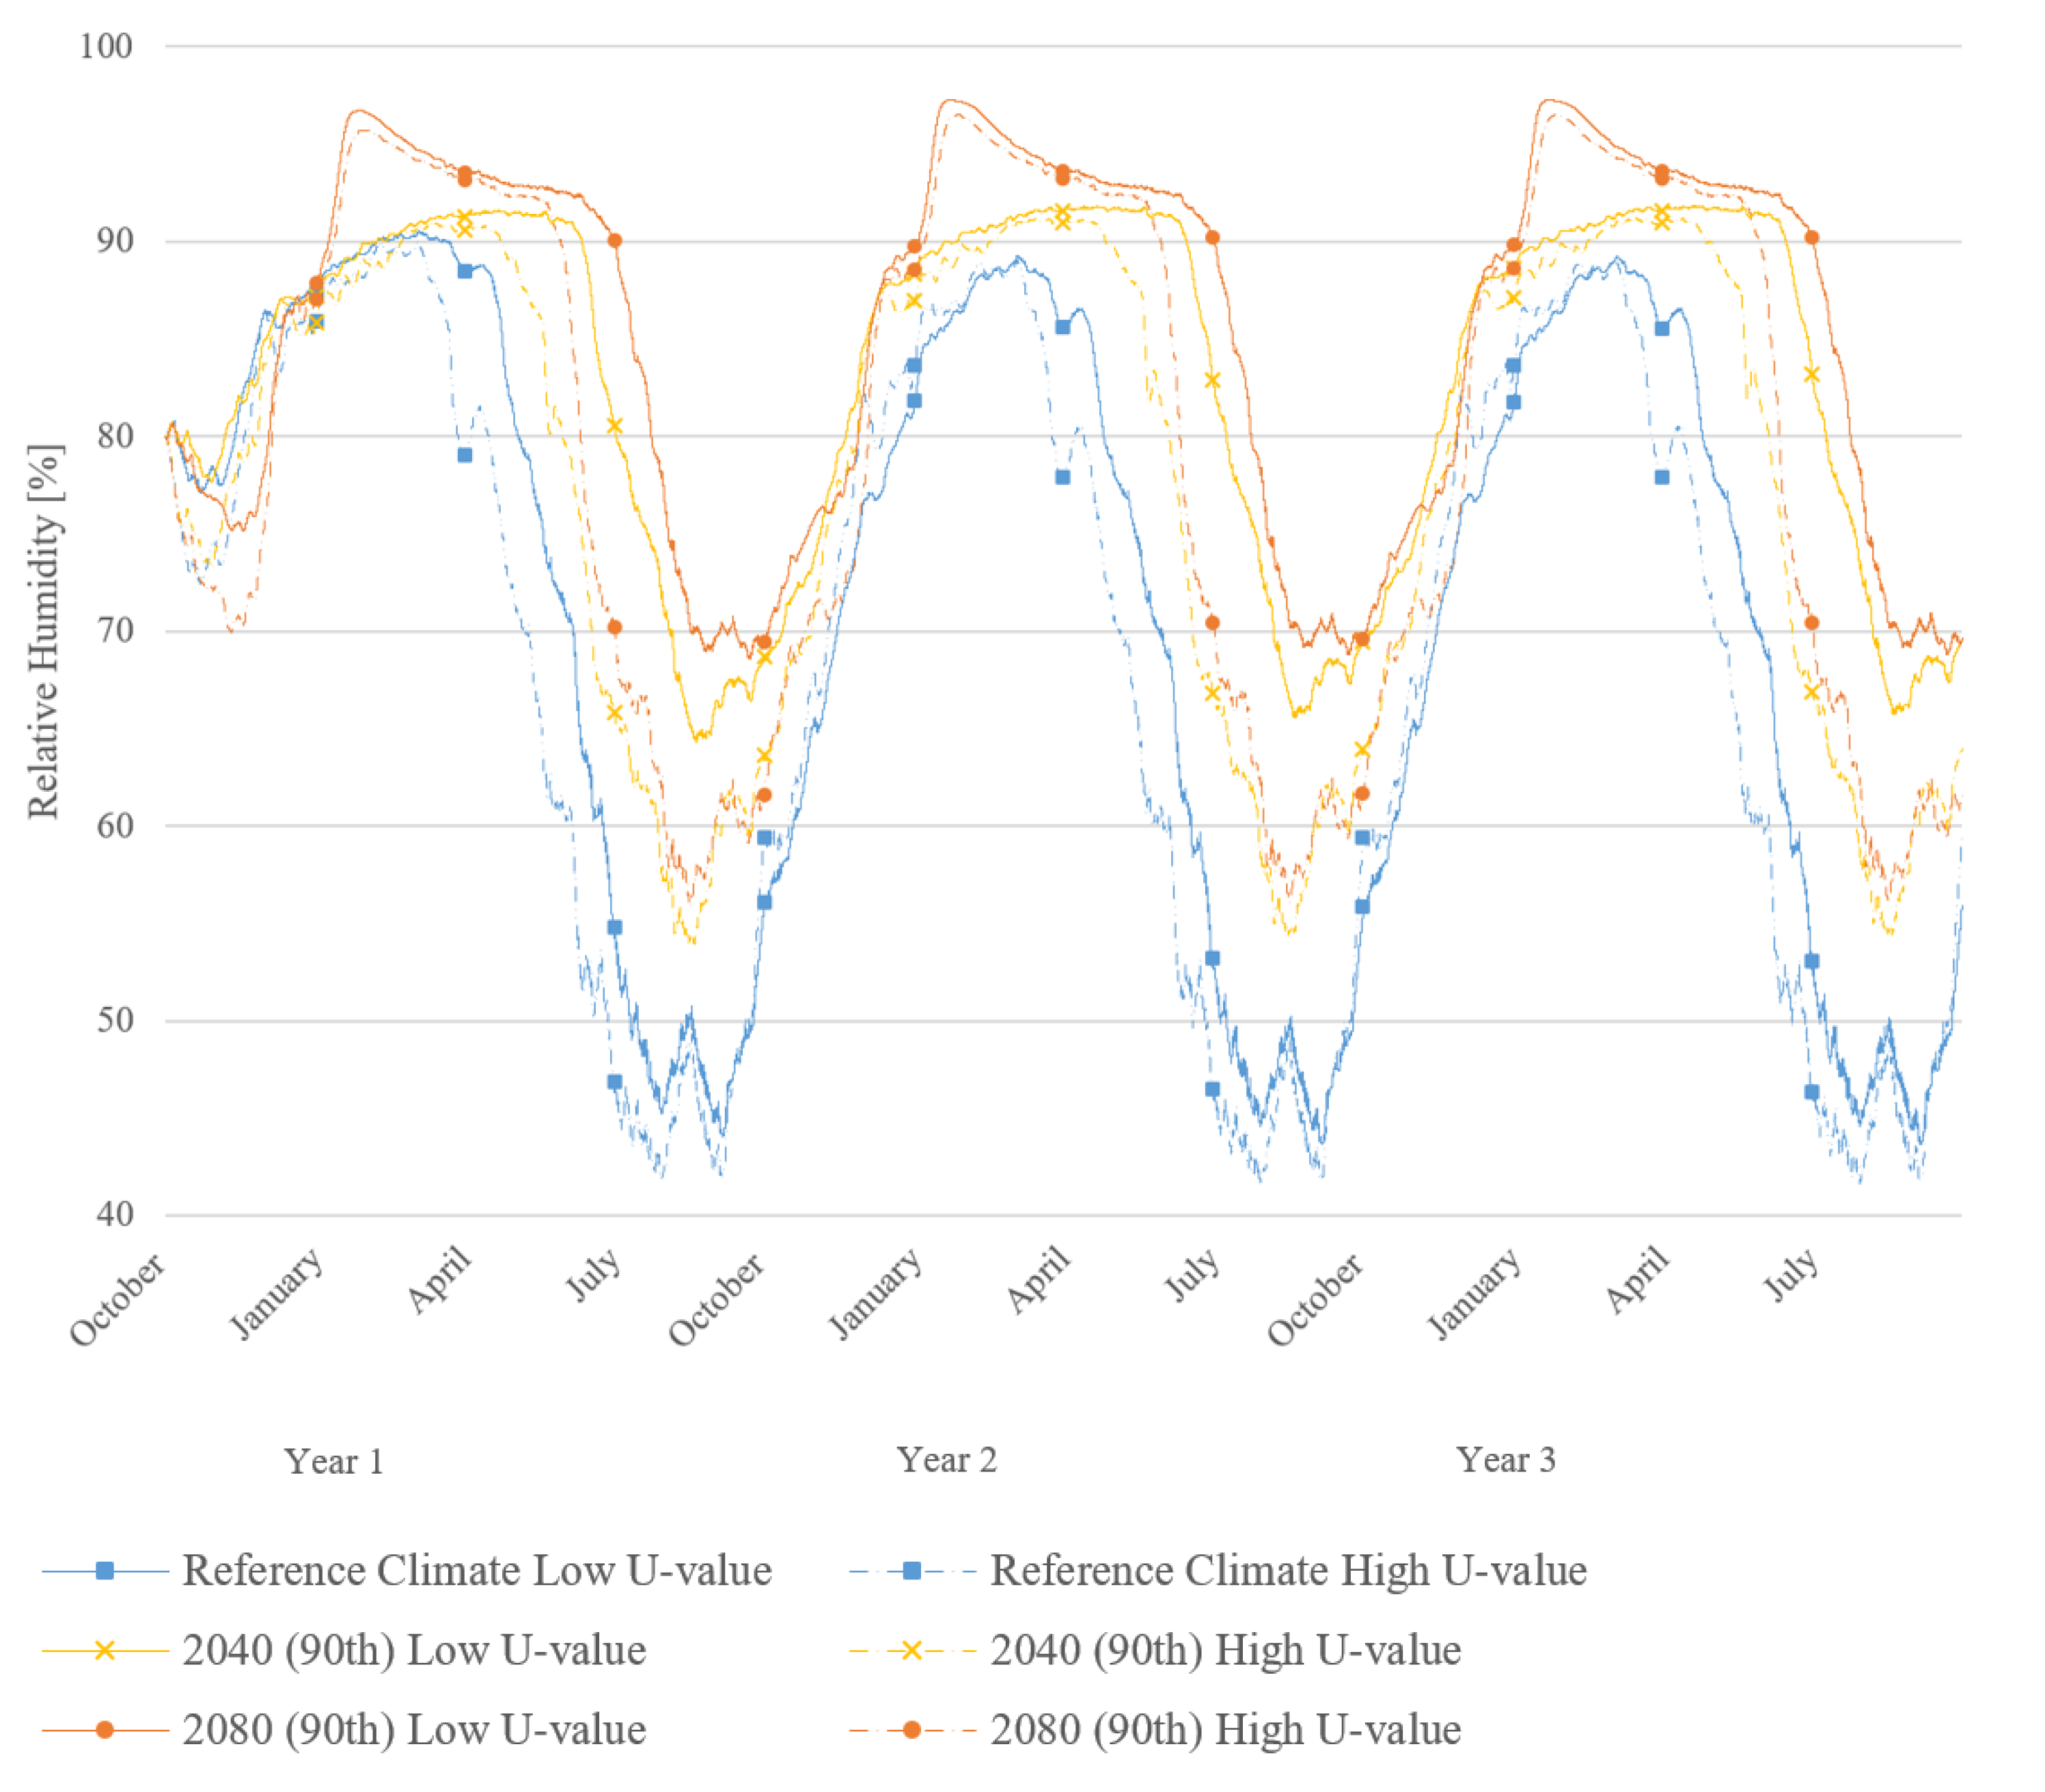
The interface between brick and insulation was the most critical for relative humidity observations. The thermal resistance of the added IWI leads to a lower temperature of the brick, which reduces drying capacity and creates a surface for potential condensation. The added IWI also adds to diffusion resistance, making it harder for walls to dry out. Using calcium silicate as an example, Figure 7 shows the interface RH for each climate scenario and both thermal performance targets. Low U-value assemblies (solid lines) show higher relative humidity than their thinner insulation and higher U-value counterparts (dotted lines). This was also true for the other two assemblies including the closed-cell phenolic foam. Overall, there is a clear increase in RH between reference (90th) and 2080 (90th) scenario represented by black and red lines.
During winter, all climates resulted in similar RH levels except for 2080 (90th) with 4% higher RH at peak. The biggest effect of changing climates is seen during summer months where variations of up to 30% are present and the assembly’s ability to dry decreases. This corresponds to increasing water content in the previous section. These trends were also observed in the phenolic foam and wood fibre assemblies.
In the reference climate, RH fluctuates between 40% (summer) and 90% (winter) with RH decreasing until year three (Figure 8). Calcium silicate and wood fibre assemblies’ performance are almost identical, whereas phenolic foam shows RH consistently above 60%. The mould index M is below 4 for the three years (Figure 9). The difference in mould index between high and low U-value is more marked for the phenolic foam compared with the other two assemblies analysed.
From the side-by-side comparisons, far-future climate shows increased risk for mould growth across all assemblies. This is aligned with rising RH levels and increased rain in future climates. In the far future, both wood fibre and phenolic foam assemblies stay above 80% RH throughout the year and present high risk for mould growth, with a mould index exceeding 5 on the first year of simulations for phenolic foam and approaching 6 (the maximum value) for wood fibre. Additionally, wood fibre hovers around 100% RH for most of the year, indicating potential risk of wood decay. Consistently higher RH in the summer months also delays drying and assemblies reach their driest point around one month later.
Although calcium silicate performs the best in comparison, with lower RH and no risk of condensation, a mould index of 5 was reached in the first year, increasing year-on-year. As U-values of all assemblies are identical, interface temperatures were roughly the same. In terms of insulation properties, calcium silicate had higher absorptivity than wood fibre insulation, which helped draw moisture inward away from the interface. In the far-future climate, the difference in insulation levels can be seen: thinner calcium silicate and wood fibre assemblies reduce RH levels in the summer by allowing more drying (no difference is seen in the phenolic foam insulation) compared to their thicker counterparts. The phenolic foam assembly provided a much higher vapour resistance compared with wood fibre and calcium silicate insulation, drastically reducing moisture movement across the assembly and thus resulting in higher RH at the interface.

3.2.3. Freeze-Thaw Risk

Ice content in the outer 1 cm of each assembly’s brick layer was monitored to identify freeze-thaw risk. A FT cycle in these results indicates periods where any amount of ice presence was detected between hours of no ice presence. It is worth noting that these results do not dictate actual damage occurring, as damage would rely on a material’s predisposition to freeze-thaw risk and a certain level of ice content. In Table 3, the existing brick-only condition had the lowest amount of ice content compared to retrofitted assemblies. Side-by-side comparisons of the assemblies in respective climate and U-value scenarios show similar performances between all wall types. This suggests that the outer portion of brick is uninfluenced by additional wall layers behind it but rather follows external rainfall patterns. There is a noticeable decrease in ice content (both duration of events and quantity) in the far future. The reduced insulation thickness (high U-value) resulted in lower outer layer ice content in reference and far-future climates. However, it should be noted that in the far-future climate scenario, the introduction of IWI resulted in higher ice contents than in the brick-only scenario. Although moisture content increases in 2080, outside temperatures remain above zero degrees during peak moisture events. In general, the London climate is classified as temperate and risk of damage due to freeze-thaw cycles will not increase in the future.

3.2.4. Summary of Results

Throughout the near and far-future climate scenarios, results show increased total assembly moisture, and increased risk of interstitial condensation and mould growth. This corresponds with rising temperature and increased moisture loads. Freeze-thaw risk, however, was seen to decrease over time.
The uninsulated brick had the least risk, followed by the calcium silicate assembly. In comparing assembly properties, a more absorbent insulation material showed highest resiliency against future moisture loads. From the two U-values modelled, a higher U-value of 0.6 W/(m2K) compared to 0.35 W/(m2K) resulted in lower risk in these categories across all assemblies. This was true especially for the calcium silicate and wood fibre assemblies where RH dropped at least 10% during drying months.

4. Discussion

A total of three solid wall insulation assemblies conforming to two U-value guidelines and original uninsulated brick were simulated for reference, near-future, and far-future climates. In simulations, thinner insulation assemblies dried more and resulted in lowest moisture risks. These results agree with findings from the literature mentioned in the introduction. Considering the reference climate, the difference in interface RH and mould index between assemblies of different U-value was found to be more marked for the phenolic foam assemblies. In the far future, this was seen most prominently in calcium silicate and wood fibre assemblies, where thinner insulation allowed more drying and reduced RH levels by at least 10% in the warmer months. On the other hand, the phenolic foam assembly showed almost no drying at either thickness. It is widely known that added thermal and vapour resistance changes walls’ moisture balances and results in higher moisture risks due to reduced drying and altered temperature and vapour pressure profiles [6,9]. For freeze-thaw risk, the effects of a warming climate and thinner insulation reduce the duration, number of cycles, and the total quantity of ice found in the masonry layer. A recent European study also found higher freeze-thaw risk in IWI assemblies and that warming is counteracting freeze-thaw risk increasing with winter WDR loads [44].
Even though results show uninsulated brick had lowest moisture risks, this is not a desirable construction to keep due to lower thermal performance, lower comfort, and likelihood of surface mould growth. For these reasons retrofit is on the agenda. Based on the results of this study, designing for the reference climate with U-value 0.35 W/(m2K) guided by Part L regulations is generally low in risk to moisture-related consequences. In the near-future climate, these risks remain low except for interface RH, which stays above 80% in winter. In the far-future scenario, designing to the current regulations would result in medium-to-high risks all around. It is worth considering thinner insulation of maximum 60 mm as suggested by the Bristolian Guide [35]. Coupled with the observed 2–3 °C average temperature increase in 2040–2080, a thinner insulation offers a valid balance of energy demand reductions and moisture performance. In addition to reduced moisture risk, thinner insulation may also increase uptake of solid wall retrofits due to reduced space disruption and easier installation [45].
From the analysis, calcium silicate outperformed phenolic foam and wood fibre insulation assemblies. The findings herein on the performance of calcium silicate insulation corroborate existing research: under reference climate conditions, hygrothermal simulations by Nielson et al. [16] and Knarud et al. [18] concluded preference for capillary-active and moisture-open materials. Similar guidance is found in IWI guidance documents [35]. From simulation results in this study, this performance is consistent with that under future climates as well. To stay consistent in assembly U-values, wall thicknesses were adjusted for this rather than by manufacturers’ standard sizing. The only case affected by this was calcium silicate, where the manufacturer’s maximum thickness was exceeded to reach the 0.35 W/(m2K) U-value. This material would be unable to achieve this thermal resistance with currently available thicknesses on the market. This, however, is not an issue with the previously recommended thinner insulation.
On practicality, the phenolic foam assembly was simulated considering the “dot and dab” installation technique. A popular alternative is mechanically fixing the insulation using timber battens. Both techniques introduce a small air layer and new wood material in the mechanically fixed case at the interface. The small (5 mm) air layer was not simulated; however, based on phenolic foam’s results, an air layer and/or timber battens would increase favourable conditions for mould growth (presence of oxygen and nutrients) and wood decay. Any air gaps and poorly sealed joints under a negative air pressure difference could allow spore movement towards the interior environment. If accurately installed, calcium silicate and wood fibre assemblies are fully bonded and it would be unlikely for mould to grow and reach the interior compared to what occurs with phenolic foam. Phenolic foam has lower thermal conductivity but clearly presents challenges when considering moisture in various buildups.
Current assembly designs do not show resilience towards projected future moisture loads and new strategies must be explored to address resilience within retrofits. Along with loosening U-value requirements, external water repellent layers have shown results in reducing moisture uptake in historic bricks [46]. Nevertheless, these preliminary findings should be used with caution as exterior treatments can cause further deterioration from rainwater infiltration (through cracks and joints), trapped moisture, and salt movement [47]. Alternatively, old brick walls can be repointed. A well-functioning lime-based mortar joint prevents rainwater intrusion and allows moisture to escape, especially if a hard cement mortar is currently used [48]. These alternative actions along with future innovations will become necessary if climate is to evolve as projected and should be a subject for further research.
Wind is a large parameter in determining the amount of WDR received by a facade. In this study, Met Office weather stations and UKCP18’s local projections allowed for the use of weather data collected in an urban centre. Although its high-resolution grid captures urban land use and subsequent urban heat island (UHI) effect in major cities such as London used in this study [49], wind is a variable further nuanced by microclimate. DELPHIN’s rain model for this study is not comprehensive enough to account for microclimate nuances such as adjacent buildings or obstructions. As this study was comparative and focused on the impacts of the changing climate, Computational Fluid Dynamics (CFD) would be a valuable extension to investigate WDR effects in an urban setting. CFD would also address varying impact velocities and droplet trajectories for complex geometries in urban surfaces [50]. On further climate work, the hourly data availability restricted this study to the RCP8.5 high-emissions scenario: further work should be done to develop hygrothermal simulation-compatible files for additional emissions scenarios in the UK. This will allow more accessibility and insights into moisture resilience. Additionally, the analysis considered a historic brick from a representative cluster of historic bricks of clay and loam; further analysis will consider the variability of material properties of the existing wall, combining the current climate files with a probabilistic approach to moisture risk assessment [51].

5. Conclusions

Reaching decarbonisation targets will require a major overhaul of England’s existing buildings. To preserve value associated with London’s rich heritage, the main energy-saving strategy of adding insulation must be done from the interior. With added IWI comes energy savings but also increased risk of moisture accumulation from condensation or lack of drying due to the altered construction. Consequences of moisture accumulation include mould growth, freeze-thaw of brick, and material decay. From the climate analysis, main observations were warming temperatures in all seasons, increased annual WDR, higher average relative humidity, and lower total solar radiation. All these climate factors played into wall assembly performance.
At time of writing, no studies existed which link exposure of WDR to moisture risks in IWI assemblies for future climates in a London context. Particularly novel to this study is the use of the newly released UKCP18 climate projections in hygrothermal simulation. This study aimed to understand how various IWI assemblies performed under near-extreme reference and future climates. Performance was assessed based on moisture accumulation, interface relative humidity, and moisture content in brick. Monitors were placed during simulation on the outer brick face and the interface between brick and insulation. The analysis revealed that:
  • current U-value standards have low moisture risk in the reference climate but will suffer high risks with the projected future moisture loads if unchanged;
  • thinner insulation assemblies performed better in all scenarios and should be allowed for solid wall retrofits;
  • calcium silicate (high absorptivity) performed best under future climate conditions; and
  • additional moisture interventions will be needed to reduce the high risks of future moisture loads.
If retrofits are to be future-proof, the conclusions above should be considered. Further studies should be undertaken, considering urban microclimate factors, additional climate years (i.e., a 50th percentile rainfall year), additional assemblies, as well as considering the variability of solid wall construction and material properties. This will add a more holistic picture of how traditional buildings can be adapted to be resilient and responsibly retrofitted.

Author Contributions

Conceptualization, J.L. and V.M.; methodology, J.L., V.M., S.A.O., and H.A.-M.; formal analysis, J.L. and V.M.; writing—original draft preparation, J.L.; writing—review and editing, J.L., V.M., S.A.O., and H.A.-M.; supervision, V.M. and H.A.-M. All authors have read and agreed to the published version of the manuscript.

Funding

The authors are grateful for the financial support from the Engineering and Physical Sciences Resource Council (EPSRC) Platform Grant EP/P022405/1.

Data Availability Statement

Publicly available UK Climate Projection 2018 datasets were analyzed in this study. This data can be found here: https://catalogue.ceda.ac.uk/uuid/d5822183143c4011a2bb304ee7c0baf7.

Conflicts of Interest

The authors declare no conflict of interest.

References

  1. HM Government. UK becomes First Major Economy to Pass Net Zero Emissions Law. Available online: https://www.gov.uk/government/news/uk-becomes-first-major-economy-to-pass-net-zero-emissions-law (accessed on 4 June 2020).
  2. CCC. Buildings Factsheet; Climate Change Committee: London, UK, August, 2014. [Google Scholar]
  3. HM Government. English Housing Survey 2018 to 2019: Headline Report. Available online: https://www.gov.uk/government/statistics/english-housing-survey-2018-to-2019-headline-report (accessed on 4 June 2020).
  4. Marincioni, V.; Gori, V.; de Place Hansen, E.J.; Herrera-Avellanosa, D.; Mauri, S.; Giancola, E.; Egusquiza, A.; Buda, A.; Leonardi, E.; Rieser, A. How Can Scientific Literature Support Decision-Making in the Renovation of Historic Buildings? An Evidence-Based Approach for Improving the Performance of Walls. Sustainability 2021, 13, 2266. [Google Scholar] [CrossRef]
  5. BSI. BS 5250:2011 Code of Practice for Control of Condensation in Buildings; British Standards Institution: London, UK, 2011. [Google Scholar]
  6. Odgaard, T.; Bjarløv, S.P.; Rode, C. Interior insulation—Experimental investigation of hygrothermal conditions and damage evaluation of solid masonry façades in a listed building. Build. Environ. 2018, 129, 1–14. [Google Scholar] [CrossRef] [Green Version]
  7. Marincioni, V.; Altamirano-Medina, H.; Ridley, I. Performance of Internal Wall Insulation Systems-Experimental Test for the Validation of a Hygrothermal Simulation Tool. In 10th Nordic Symposium of Building Physics; Building Physics, LTH, Lund University: Lund, Sweden, 2014. [Google Scholar]
  8. WHO. Damp and Mould: Health Risks Preventions and Remedial Actions; WHO: Geneva, Switzerland, 2009. [Google Scholar]
  9. Zhou, X.; Derome, D.; Carmeliet, J. Hygrothermal modeling and evaluation of freeze-thaw damage risk of masonry walls retrofitted with internal insulation. Build. Environ. 2017, 125, 285–298. [Google Scholar] [CrossRef]
  10. Blocken, B.B.; Carmeliet, J.J. A review of wind-driven rain research in building science. J. Wind. Eng. Ind. Aerodyn. 2004, 92, 1079–1130. [Google Scholar] [CrossRef]
  11. Straube, J.; Schumacher, C. Interior Insulation Retrofits of Load-Bearing Masonry Walls in Cold Climates. J. Green Build. 2007, 2, 42–50. [Google Scholar] [CrossRef]
  12. Karagiozis, A.N.; Salonvaara, M.; Holm, A.; Kuenzel, H. Influence of Wind-Driven Rain Data on Hygrothermal Performance. In Proceedings of the Eighth International IBPSA Conference, Eindhoven, The Netherlands, 11–14 August 2003. [Google Scholar]
  13. Abuku, M.; Janssen, H.; Roels, S. Impact of wind-driven rain on historic brick wall buildings in a moderately cold and humid climate: Numerical analyses of mould growth risk, indoor climate and energy consumption. Energy Build. 2009, 41, 101–110. [Google Scholar] [CrossRef] [Green Version]
  14. Bottino-Leone, D.; Larcher, M.; Herrera-Avellanosa, D.; Haas, F.; Troi, A. Evaluation of natural-based internal insulation systems in historic buildings through a holistic approach. Energy 2019, 181, 521–531. [Google Scholar] [CrossRef]
  15. Nielsen, A.; Møller, E.B.; Rasmussen, T.V.; de Hansen, E.J.P. Use of Sensitivity Analysis to Evaluate Hygrothermal Conditions in Solid Brick Walls with Interior Insulation. In Proceedings of the 5th International Building Physical Conference, Kyoto, Japan, 28–31 May 2012; pp. 377–384. [Google Scholar]
  16. De Mets, T.; Tilmans, A.; Loncour, X. Hygrothermal Assessment of Internal Insulation Systems of Brick Walls through Numerical Simulation and Full-Scale Laboratory Testing. Energy Procedia 2017, 132, 753–758. [Google Scholar] [CrossRef]
  17. Baker, P. Hygrothermal Modelling of Shrewsbury Flaxmill Maltings; Historic England: London, UK, 2015.
  18. Knarud, J.; Geving, S.; Kvande, T. Hygrothermal Simulations of Internally Insulated Massive Masonry Walls Exposed to Driving Rain in Cold Climate. In 10th Nordic Symposium on Building Physics; Building Physics, LTH, Lund University: Lund, Sweden, 2014; pp. 1141–1148. [Google Scholar]
  19. Kendon, E.; Fosser, G.; Murphy, J.; Chan, S.; Clark, R.; Harris, G.; Lock, A.; Lowe, J.; Martin, G.; Pirret, J.; et al. UKCP Convection-Permitting Model Projections: Science Report. 2019, No. September, 1–153. Available online: https://doi.org/https://www.metoffice.gov.uk/pub/data/weather/uk/ukcp18/science-reports/UKCP-Convection-permitting-model-projections-report.pdf (accessed on 25 May 2020).
  20. Orr, S.A.; Young, M.; Stelfox, D.; Curran, J.; Viles, H. Wind-driven rain and future risk to built heritage in the United Kingdom: Novel metrics for characterising rain spells. Sci. Total. Environ. 2018, 640–641, 1098–1111. [Google Scholar] [CrossRef]
  21. Nik, V.M.; Mundt-Petersen, S.; Kalagasidis, A.S.; De Wilde, P. Future moisture loads for building facades in Sweden: Climate change and wind-driven rain. Build. Environ. 2015, 93, 362–375. [Google Scholar] [CrossRef]
  22. Hao, L.; Del Pero, C.; Matiu, M.; Troi, A. Climate Change Impact on Hygrothermal Performance of Energy-Retrofitted Historic Buildings: Numerical Simulations of Internally Insulated Masonry Walls in South Tyrol. In Proceedings of the Adapt Northern Heritage Conference, Online, 5–6 May 2020. [Google Scholar]
  23. Cabrera, P.; Samuelson, H.W. Simulating Mold Risks under Future Climate Conditions. In Proceedings of the Building Simulation 2019, Rome, Italy, 2–4 September 2019. [Google Scholar]
  24. Little, J.; Ferraro, C.; Aregi, B. Assessing Risks in Insulation Retrofits Using Hygrothermal Software Tools Heat and Moisture Transport in Internally Insulated Stone Walls; Historic Environment Scotland: Edinburgh, UK, 2015.
  25. UK Met Office. UK Hourly Weather Observations. Available online: http://data.ceda.ac.uk/badc/ukmo-midas-open/data (accessed on 15 July 2020).
  26. Kehrer, M. WUFI Workshop NBI/SINTEF 2008 Radiation Effects on Exterior Surfaces. Available online: http://www.wufi.no/workshop-08/RadiationEffectsOnExteriorSurfaces_E.pdf (accessed on 15 July 2020).
  27. UK Met Office. UKCP18 Local Projections 2.2km Grid. Available online: http://data.ceda.ac.uk/badc/ukcp18/data/land-cpm/uk/2.2km/rcp85 (accessed on 15 July 2020).
  28. Berrizbeitia, S.E.; Gago, E.J.; Muneer, T. Empirical Models for the Estimation of Solar Sky-Diffuse Radiation. A Review and Experimental Analysis. Energies 2020, 13, 701. [Google Scholar] [CrossRef] [Green Version]
  29. Belcher, S.; Hacker, J.; Powell, D. Constructing design weather data for future climates. Build. Serv. Eng. Res. Technol. 2005, 26, 49–61. [Google Scholar] [CrossRef]
  30. Sontag, L.; Nicolai, A.; Vogelsang, S. Validierung der Solverimplementierung des Hygrothermischen Simulationsprogramms Delphin. Technical Report. Available online: http://nbn-resolving.de/urn:nbn:de:bsz:14-qucosa-128968 (accessed on 15 April 2020).
  31. Zhao, J.; Plagge, R.; Ramos, N.M.M.; Simões, M.L.; Grunewald, J. Application of clustering technique for definition of generic objects in a material database. J. Build. Phys. 2015, 39, 124–146. [Google Scholar] [CrossRef]
  32. BRE. Solid Wall Heat Losses and the Potential for Energy Saving: Classification of Solid Walls; Building Research Establishment: Watford, UK, 2016. [Google Scholar]
  33. Li, F.G.N.; Smith, A.; Biddulph, P.; Hamilton, I.G.; Lowe, R.; Mavrogianni, A.; Oikonomou, E.; Raslan, R.; Stamp, S.; Stone, A.; et al. Solid-wallU-values: Heat flux measurements compared with standard assumptions. Build. Res. Inf. 2015, 43, 238–252. [Google Scholar] [CrossRef] [Green Version]
  34. HM Government. Conservation of Fuel and Power: Approved Document Part L. Available online: https://assets.publishing.service.gov.uk/government/uploads/system/uploads/attachment_data/file/540327/BR__PDF__AD_L1B_2013_with_2016_amendments.pdf (accessed on 6 August 2020).
  35. STBA. A Guide to the Responsible Retrofit of Traditional Homes in Bristol Solid Wall Insulation A Bristolian’s Guide To; Sustainable Traditional Buildings Alliance: London, UK, 2015. [Google Scholar]
  36. Kingspan. Kooltherm K118 Insulated Plasterboard|Internal Wall Insulation|Kingspan|Great Britain. Available online: https://www.kingspan.com/gb/en-gb/products/insulation/insulation-boards/kooltherm/kooltherm-k118-insulated-plasterboard (accessed on 24 August 2020).
  37. Ecological Building Systems. Calsitherm Climate Board|Ecological Building Systems. Available online: https://www.ecologicalbuildingsystems.com/product/calsitherm-climate-board (accessed on 24 August 2020).
  38. Natural Building Technologies. Internal Wall Insulation Dry Lined—Natural Building Technologies. Available online: https://www.natural-building.co.uk/system/internal-wall-insulation-dry-lined/ (accessed on 24 August 2020).
  39. Vereecken, E.; Roels, S. Capillary Active Interior Insulation Systems for Wall Retrofitting: A More Nuanced Story. Int. J. Arch. Heritage 2016, 10, 558–569. [Google Scholar] [CrossRef]
  40. Palmer, J.; Terry, N. Solid Wall Insulation: Best Practice and Innovation; Department for Business, Energy & Industrial Strategy: London, UK, 2017. Available online: https://www.gov.uk/government/publications/understanding-best-practice-in-deploying-external-solid-wall-insulation-and-internal-wall-insulation-in-the-uk (accessed on 25 February 2021).
  41. Straube, J.; Burnett, E.F. Simplified Prediction of Driving Rain on Buildings. In Proceedings of the International Building Physics Conference, Eindhoven, The Netherlands, 18–21 September 2000. [Google Scholar]
  42. Hukka, A.; Viitanen, H.A. A mathematical model of mould growth on wooden material. Wood Sci. Technol. 1999, 33, 475–485. [Google Scholar] [CrossRef]
  43. Ojanen, T.; Viitanen, H.; Peuhkuri, R.; Vinha, J.; Salminen, K. Mold growth modeling of building structures using sensitivity classes of materials. In Proceedings of the 11th International Conference on Thermal Performance of the Exterior Envelopes of Whole Buildings, Buildings XI, Clearwater, Pinellas County, FL, USA, 5–9 December 2010. [Google Scholar]
  44. Vandemeulebroucke, I.; Calle, K.; Caluwaerts, S.; De Kock, T.; Bossche, N.V.D. Does historic construction suffer or benefit from the urban heat island effect in Ghent and global warming across Europe? Can. J. Civ. Eng. 2019, 46, 1032–1042. [Google Scholar] [CrossRef]
  45. Leeds Sustainability Institute. Thin Internal Wall Insulation: Measuring Energy Performance Improvements in Dwellings; Leeds Sustainability Institute: Leeds, UK, 2019. [Google Scholar]
  46. Zhao, J.; Meissener, F. Experimental investigation of moisture properties of historic building material with hydrophobization treatment. Energy Procedia 2017, 132, 261–266. [Google Scholar] [CrossRef]
  47. SPAB. A Guide to the Repair of Old Brick Walls. Available online: https://www.spab.org.uk/advice/guide-repair-old-brick-walls (accessed on 14 September 2020).
  48. Historic England. Repointing Brick and Stone Walls Guidelines for Best Practice; Historic England: London, UK, 2017.
  49. Lo, Y.T.E.; Mitchell, D.M.; Bohnenstengel, S.I.; Collins, M.; Hawkins, E.; Hegerl, G.C.; Joshi, M.; Stott, P.A. U.K. Climate Projections: Summer Daytime and Nighttime Urban Heat Island Changes in England’s Major Cities. J. Clim. 2020, 33, 9015–9030. [Google Scholar] [CrossRef]
  50. Blocken, B.; Carmeliet, J. Validation of CFD simulations of wind-driven rain on a low-rise building facade. Build. Environ. 2007, 42, 2530–2548. [Google Scholar] [CrossRef]
  51. Marincioni, V.; Marra, G.; Altamirano-Medina, H. Development of predictive models for the probabilistic moisture risk assessment of internal wall insulation. Build. Environ. 2018, 137, 257–267. [Google Scholar] [CrossRef]
Figure 1. Wall assemblies and climate scenarios combinations.
Minerals 11 00271 g001
Figure 2. Modelled assemblies (insulation thicknesses given in low/high format).
Minerals 11 00271 g002
Figure 3. Boxplots of weather variables in each climate scenario: (a) temperature; (b) relative humidity.
Minerals 11 00271 g003
Figure 4. Precipitation by wetting (October–March) and drying (April–September) months in each climate scenario: (a) normal rain in mm; (b) wind-driven rain in L/m2.
Minerals 11 00271 g004
Figure 5. Total solar radiation by month for the various climate scenarios.
Minerals 11 00271 g005
Figure 6. Assembly moisture content with low U-value assemblies and existing condition: (a) reference climate (90th percentile rain); (b) 2080 (90th percentile rain) climate.
Minerals 11 00271 g006
Figure 7. Calcium silicate assembly interface relative humidity with each climate scenario—low and high U-value assemblies.
Minerals 11 00271 g007
Figure 8. The 30-day moving average of interface relative humidity and temperature for low and high U-value assemblies: (a) reference climate (90th percentile); (b) future 2080 climate (90th percentile) with an 80% RH guideline for moisture risk.
Minerals 11 00271 g008
Figure 9. Mould index, M, for low and high U-value assemblies: (a) reference climate (90th percentile); (b) future 2080 climate (90th percentile), considering a worst-case scenario substrate (very sensitive, with almost no decline).
Minerals 11 00271 g009
Table 1. Weather variables required for simulation and availability.
Hourly Variable RequiredUnitsAvailable Time Resolution in Observed DataAvailable Time Resolution in UKCP18
Air Temperature°CHourlyHourly
PrecipitationmmHourlyHourly
Relative Humidity%HourlyDaily at 12 p.m.
Global Horizontal Radiation ShortwaveW/m2HourlyDaily at 12 p.m.
Diffuse Shortwave RadiationW/m2HourlyUnavailable
Atmospheric Counter RadiationW/m2UnavailableUnavailable
Wind Speedm/sHourlyDaily at 12 p.m.
Northward and Eastward Wind Vectors Given
Wind Direction° Clockwise from NorthHourly
Cloud IndexOktas [0, 8] converted to [0, 1]HourlyDaily at 12 p.m.
Table 2. Wall assemblies and material properties used in the simulations.
ρ [kg/m3]θpor [m3/m3]μ [-]Cp [J/kgK]Wsat [kg/m3]Aw [kg/m2s0.5]λ [W/mK]
Existing ConditionBrick ZG17150.35622.2920322.10.137-
Phenolic Foam [36]Brick ZG17150.35622.2920322.10.1370.54
Low-e Perforated Composite Foil12760.114600.01000113.000.23
Phenolic Foam350.987113.71470501.20.0090.02
Low-e Composite Foil12760.11494,384.51000113.000.23
Plasterboard10430.60611.31047356.00.3670.26
Skim Coat10430.60611.31047356.00.3670.26
Calcium Silicate [37]Brick ZG17150.35622.2920322.10.1370.54
Calcium Silicate KP Glue Mortar14100.46822.91059340.00.0040.60
Calcium Silicate Climate Board1870.9303.61100916.40.7660.06
Calcium Silicate KP Lime Plaster12500.52812.1999452.20.1340.57
Wood Fibre [38]Brick ZG17150.35622.2920322.10.1370.54
Mineral Fine Plaster (Light)5860.77912.61198360.00.0730.13
Wood Fibre Board1500.9813.02000600.00.0700.04
Gypsum Board8500.65010.0850551.00.2770.20
Table 3. Duration, freeze-thaw (FT) cycles, and total quantity of ice content in simulated assemblies for reference and far-future climate.
ExistingLow U-ValueHigh U-Value
Brick OnlyCalcium SilicatePhenolic FoamWood FibreCalcium SilicatePhenolic FoamWood Fibre
Reference ClimateHours with ice present9272727272725
Number of FT cycles3333335
Sum of ice content [kg/m3]24.1263.3266.0251.7201.6205.8192.5
2080 (90th) ClimateHours with ice present0182220121212
Number of FT cycles0333333
Sum of ice content [kg/m3]066.370.764.926.828.223.1
Publisher’s Note: MDPI stays neutral with regard to jurisdictional claims in published maps and institutional affiliations.