Abstract
This paper studies the effect of the type and concentration of selected frothers, the gas flowrate, and the pore size of the porous frit on the bubble sizes (Sauter mean diameter, SMD) of bubbling flow produced in a micro-flotation cell, and the determination of bubble size distribution (BSD) in the presence of the frothers. The commercial frothers polypropylene glycols (PPG 200, 400, and 600), tri propylene glycol (BTPG), triethylene glycol (BTEG), dipropylene glycol (BDPG), and Methyl Isobutyl Carbinol (MIBC) were used in the present investigation. The frother concentration varied from 1 to 1000 ppm. The flow rate varied in the range of 25 to 100 cm3/min. The pore sizes of the frit were selected as 10–16 μm, 16–40 μm, and 40–100 μm. Each frother exhibited its own unique ability in preventing coalescence of the bubbles in the order of BTEG < BDPG < PPG 200 < MIBC < BTPG < PPG 400 < PPG 600. The factorial experiments established that the type of the frother and its concentration have a major effect on the size of the bubbles. The bubbles decreased twice their size when the frother concentration was increased from 1 ppm to 1000 ppm. The pore size of the frit is a significant factor as well. The size of the bubbles can be reduced from about 10% to about 40% by decreasing the pores from 40–100 μm to 10–16 μm but the level of this decrease depends on the type of the frother. The increase of the flowrate from 25 cm3/min to 100 cm3/min produced bubbles smaller by 25% to 50% for the case of BTEG, BDPG, PPG 200, MIBC, BTPG, while a minimum of the bubble sizes was reached for the case of PPG 400 and PPG 600, beyond which the bubbles enlarged their size. The BSD in the presence of PPG 600 varied around 0.3 mm, whereas BTEG gave a wider BSD which indicated that the type of frother affected the bubble production. Our analysis shows that the first group of frothers adsorbs instantly on the bubbles, once they leave the porous frit, thus reaching equilibrium. PPG 400 and PPG 600 adsorb significantly slower on the bubbles, possibly not reaching equilibrium during their resident time.
1. Introduction
Flotation is a separation process based on selected (hydrophobic) particles to attach to bubbles [1]. Flotation kinetics and the particle-bubble collision frequency strongly depends on bubble size and bubble size distribution (BSD). Bubble size and BSD are most affected by frother type and concentration. In this manner, frother concentration has the strongest influence on the gas dispersion properties besides the effects of other parameters on bubble size. As well-known from the literature, bubble size decreases rapidly until a transition value, referred to as the critical coalescence concentration (CCC) [2,3]. Although at concentrations above the CCC, bubble size does not materially decrease, it does lead to increased water recovery to the froth with the attendant increase in unselective particle entrainment [4,5,6]. These effects of some frothers have already been well studied in the literature [2,3,4,5,6,7,8,9,10,11,12,13,14,15]. The bubble size distribution (BSD), through measurement of the so-called foam properties (gas hold-up, bubble numbers, and bubble size) is important in flotation practice. To evaluate this effect at the industrial scale, the bubble surface area is typically estimated from the gas rate and BSD measurements, where the complete BSD is compressed into a general value, i.e., the Sauter mean diameter (d32) [2,10,11]. As well known, Sauter mean bubble diameter (d32) and the mean bubble number diameter of the sample is calculated along with other parameters associated [12,13,14,15]. The bubbly (homogeneous) flow is characterized by small bubbles and narrow distribution of the equivalent diameters; the shifting from homogeneous to heterogeneous flow regime is achieved through the transition regime when the diameters variation domain becomes larger. However, upon reaching a heterogeneous regime, the flow is characterized by a combination of coalescence and coexistence of small and big deformed bubbles. The transition between homogeneous to heterogeneous flow determines radical modifications of the air-water dispersed system, reflecting simultaneously in the BSD, global gas hold up, and the rising velocity of the bubbles [16,17]. Some experimental results were obtained by varying different parameters such as air flowrate, liquid properties, and porous diffuser which revealed that the bubble column oscillating period decreases with the increase of the air flowrate [16,17].
It is generally accepted that the addition of a frother to water reduces the surface tension of the solution due to the amphiphilic nature of the reagent molecules. Thus, the surface tension of a solution is an indication of the surface activity of a frother. Frother that strongly reduces surface tension produces more stable froths [18,19,20,21,22]. The use of frothers in mineral flotation practice today is dominated by two nonionic frother families, alcohols (general formula: [CnH2n + OH] and polyglycols where [HO-(CnH2nO)m-H] and most commonly, propylene oxide, PO[C3H6O] or ethylene oxide, EO[C2H4O], i.e., polypropylene glycols [OH(C3H6O)nH] and ethylene glycols [(CH2OH)2], respectively [21,22,23,24,25,26]. This paper presents the results of the experimental investigations on the effect of commercial frothers PPG 600, PPG 400, PPG 200, BTPG, BDPG, BTEG, and MIBC concentration on bubble sizes at CCC. The effects of other parameters such as air flowrate and pore size of frit, the bubble sizes generated at different air flowrates, and frit pore sizes were analyzed under an optimum frother concentration. Bubbling properties and bubble size distribution were evaluated for each frother in the air-water phase. The role of surface tension and adsorption dynamics along with frother interfacial conformation on foam behavior was also studied.
2. Materials and Methods
In this study, the concentration of different frothers, namely, polypropylene glycols (PPG 200, 400, and 600), tri propylene glycol (BTPG), triethylene glycol (BTEG), dipropylene glycol (BDPG), and isobutyl alcohol (MIBC), obtained from BASF, Germany, on the bubble size distribution were determined. The chemical structures of these frothers were reported in our previous study [7]. All the measurements were conducted at constant room temperature, 23 ± 1 °C. Glassware was rinsed with ethylene alcohol (99% purity, MERCK) and washed with distilled water followed by steam cleaning and drying in a clean oven. To ensure that the frothers were dispersed in solutions, each frother solution was stirred at 500 rpm for 4 min.
2.1. Determination of Surface Tension Isotherms
Before the bubble size measurements, the surface tension values of each frother were determined as a function of concentration under the original pH value of 6.7 ± 0.02 by the Du-Noüy ring method. The surface tension measurements were carried out using Krüss K6 tensiometer (KRÜSS GmbH, Hamburg, Germany).
The procedure for the measurements is explained as follows: The maximum force that occurs upon moving the platinum-iridium ring through the phase boundary is measured when the ring is aligned vertically to the ring plane. And, the surface tension is determined by stretching the lamella until detachment from the liquid [27]. In these measurements, the stock solutions of each frother type at a concentration of 10000 ppm (1 g/100 mL) were prepared with pure water at 23 ± 1 °C, and the standard solutions at 10, 20, 30, 40, 50,100, 140, 180, 200, 280, and 360 ppm were prepared from the stock solutions before each measurement. And, the surface tension isotherms were determined from these standard solutions.
2.2. Bubble Size Measurements
The bubble size measurements for the selected frothers were carried out as a function of frother concentration (ppm), air flowrate, and frit pore size using the set-up shown in Figure 1. In this setup, a micro-flotation cell, 30 mm in diameter and 220 mm in height, with 155 cm3 volume was used. At least 10 images were captured for each frother concentration (1, 2, 3, 5, 10, 20, 30, 40, 50,100, 200, 300, 400, 500, 700, and 1000 ppm) at only one location of the cell around 5 cm above the plane of the frit. This location was selected based on the volume of the solution and the sizes of the cell as well. Thus, the bubble diameters were determined using free ImageJ software (version 1.8.0). These values were then used to calculate the Sauter Mean Diameter (d32) (SMD) with an accuracy of 0.05 mm by Equation (1):
Vp and Ap are the volume and area of the bubbles, respectively.
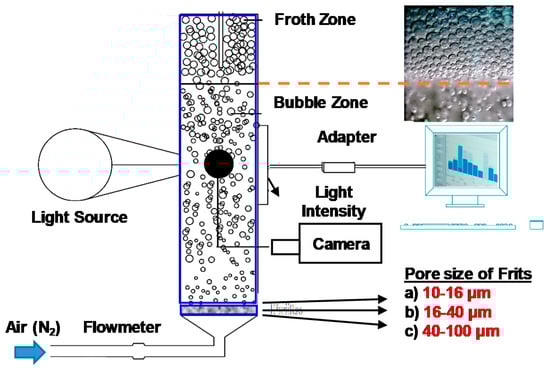
Figure 1.
Schematic representation of bubble size measurements (Retrieved from ref. [7]).
Although the bubble size is entirely determined over the frit zone and can be assumed as the same throughout the rest of the cell, it seems possible to collect a representative picture of the bubble with no respect to the sampling location but in practice, it may result in different values. Keeping this in mind, the sampling location was kept the same throughout the whole experiment to achieve reproducible results. The column cell was filled with aqueous solutions of tested frothers. And, the representative images of bubbles were captured by a digital camera (BushmanCMOS 8 Led Microscope, Bushman Equipment Inc., Menomonee Falls, WI, USA) with a 50X magnification rate while the light was sent through this column.
All the experiments were conducted at room temperature of 23 ± 1 °C. And, the mixing speed was taken as 500 rpm. The effect of frit pore size on bubble size was investigated with three different frit types as 10–16 µm, 16–40 µm, and 40–100 µm at air volumes of 25, 50, 75, and 100 cm3/min using nitrogen as a carrier gas. The Jg values for each air volume were 3.54, 7.07, 10.61 and 14.15 cm/s, respectively.
2.3. Kinetics of Frother Adsorption on Rising Bubbles
A theory on the kinetics of frother adsorption on rising bubbles is developed (see the Appendix A) as a part of the whole picture of the joined effect of frother, flow rate, and pore size of the the porous frit. The basic concept of the theory is the following: A bubble is moving with speed U in a liquid containing frother with bulk concentration C0. The frother adsorbs on the bubble surface by diffusion control. Therefore, there is stationary adsorption of the frother described by the second law of Fick with the account for the convection [28]. Hence, the frother concentration profile C(r) (r is radial coordinate) near the bubble surface is developed in a diffusion boundary layer with thickness δ. The latter depends on the speed U of the bubble, the frother diffusion coefficient D, and the radius of the bubble . Beyond δ (at r > δ), C(r) = C0. One obtains the diffusion flux on the surface of the bubble in terms of the first law of Fick with respect to the subsurface frother concentration Cs, by solving this equation. The thickness of the diffusion boundary layer δ = f(, D, U, θ) is a part of this solution. The latter one is a function of the azimuthal angle θ, therefore we average upon this angle, thus obtaining the average thickness of the diffusion boundary layer δ = f1(, D, U). Furthermore, we used the Henry adsorption isotherm to substitute Cs and C0 with the equilibrium average adsorption Γeq and the temporal average adsorption Γ and replace the diffusion flux with the first derivative of the adsorption dΓ/dt. The boundary condition is zero adsorption at t = 0 s. When we solve this equation we obtain the dependence of Γ versus the time t at a given velocity U.
The adsorption parameters of the frothers are obtained by means of the adsorption model of Ivanov described in refs. [7,29]. The bulk diffusion coefficients of the frothers were calculated using the procedure described in ref. [30], whereas the velocities of the bubbles were calculated employing the equation given in ref. [31]. It is based on the experimental data of the average bubble diameter obtained in the present work. The kinetics of frother adsorption on the rising bubble at the CCC value of each frother was calculated in this manner.
3. Results and Discussion
3.1. Surface Tension Measurements
The equilibrium surface tension data are available for many commercial frothers in the literature, however, a few studies involve the quantitative impact of this information. For example, a study in the literature showed that while negligible variations on surface tension values of n-hexane concentrations (from 72.8 mN/m to around 70 mN/m) were measured in the range of 10−6 to 10−4 M by the Du-Nouy ring method, a significant decrease was obtained above this concentration range for the air/water interface [28]. Moreover, almost the same trend for the same type of frothers was found with dynamic surface tension as a function of concentration [29]. It was found from another study [30] that increasing molecular weight resulted in higher surface tension values for the frothers of similar molecular structures (DF-1012 > DF-250 > DF-200). Approximately the same character was also reported for other types of frothers [25,31,32,33,34].
Thus, the results for seven different frothers used in this study also showed that the order of surface tension values followed the same trend as their molecular weights reported in our previous study [7].
PPG 600 < PPG 400 < BTPG < MIBC < PPG 200 < BDPG < BTEG.
As can be understood from the afore-mentioned results presented in Figure 2a and reported in the literature [7] that the surface tension of frothers can be determined with several methods but the results will be in the same trend regardless of the method. Meanwhile, the formation of bubble coalescence reported in our previous study (Figure 2b) followed the same trend with respective surface tension values which then led us to consider the structural properties of frothers during the evaluation of frothers during comparison of their bubble size characteristics [7].
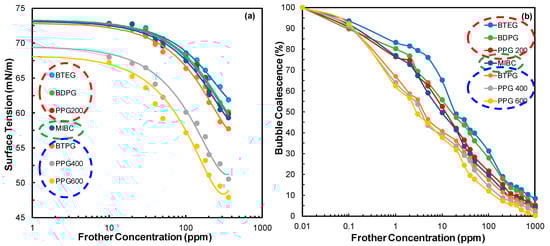
Figure 2.
Results for (a) surface tension measurements (b) bubble coalescence of frothers [7].
3.2. Bubble Size Measurements
As mentioned in “Materials and Methods” section, the bubble coalescence in the presence of different frother types was measured against their light intensities as a function of concentration where the bubble sizes were determined as SMD (d32) by representative images. In these studies, the measurement time was selected as 60 s under the same conditions as the micro-flotation column tests.
3.2.1. Effect of Air Flowrate
In the first series of tests, the effect of frother concentration on the SMD was investigated while air flowrate was selected as 50 cm3/min which is the most preferred flowrate in micro-flotation experiments [7], and the results are shown in Figure 3a. In addition to the SMD as a function of frother concentration, the representative images of bubbles for critically selected four concentrations are shown in Figure 3b.
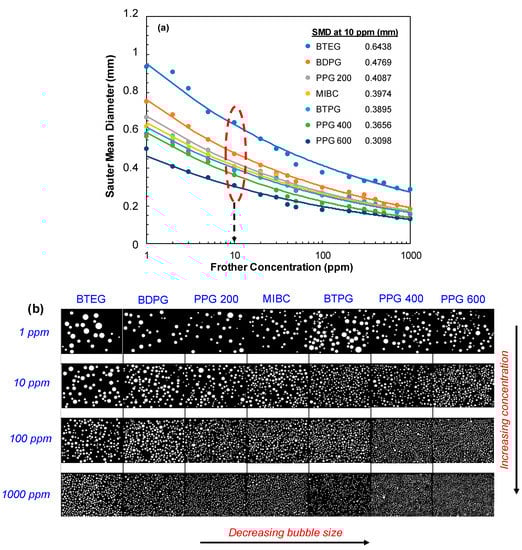
Figure 3.
(a) Effect of frother concentration on the SMD of bubbles (Frit pore size: 10–16 µm, air flowrate: 50 cm3/min) (b) Images of bubbles as a function of concentration.
As mentioned in previous sections, the bubble sizes were determined by processing the bubble images captured on micro-flotation cells from a single imaging point with ImageJ software. Many studies in the literature can be found for determining the bubble sizes with different methods and consequently the CCC of frothers. For example the use of UCT bubble size meter and HUT bubble size analyzer was studied to determine the CCC values of three frothers (DF-1012, DF250, and DF200) [12]; the authors found that while the CCC values intersected at almost the same value of 0.04 mol/dm3 for DF250, the measured SMD was found around 1 mm for UCT and 2 mm for HUT. Although there are many parameters to be considered for explaining this difference, the authors attributed it to the use of different flotation machines and the quality of water used throughout experiments. This critical knowledge was considered in all tests to obtain reproducible and accurate results as mentioned in the Materials and Methods section.
In another recent publication, the CCC was determined by linear regression of SMD values calculated from air bubble images [35]. It was found that the CCC of frothers (Ethylene glycol butyl ether (118.17 g/mol), Diethylene glycol butyl ether (162.23 g/mol), Triethylene glycol butyl ether (206.28 g/mol)) were inversely proportional to their molecular weights as 140.62, 136.27, and 105.20 ppm, respectively. This point of view directed us to evaluate the order of frothers by presenting the results based on their structures.
As shown in Figure 3a, while a negligible difference in bubble size was obtained for PPG 600 over 10 ppm concentration, a gradual and significant decrease was obtained for other frother types at higher concentrations up to 1000 ppm; this is in line with the previously reported critical coalescence concentration results [7]. Meanwhile, 10 ppm was generally found as the critical breakpoint for all frother types where the size of the bubbles became almost stable at higher concentrations. Therefore, if we consider the SMD sizes in that particular concentration, the order of frothers presented the same trend with their surface tension characteristics which were ordered as a function of molecular weight within each group (For instance BTPG < BDPG < BTEG). Accordingly, while the highest SMD was obtained with PPG 600 at lower concentrations, it gradually increased for BTEG.
PPG 600 < PPG 400 < BTPG < MIBC < PPG 200 < BDPG < BTEG.
On the other hand, the effect of air flowrate was investigated in a series of tests at 25, 75, and 100 cm3/min flowrate values. In these tests, considering its stability condition, the frother concentration was selected as 50 ppm for all types of frothers. The results presented in Figure 4a indicated that increasing the flowrate would produce bubbles with a smaller diameter proportional to its molecular weight. In other words, the SMD of BTEG was found 0.40 mm at 25 cm3/min, gradually decreased to 0.35, 0.32, and 0.30 mm whereas the flowrates became 50, 75, and 100 cm3/min, respectively. A similar trend was reported in the literature for different frothers and fluid types. For example, it was shown that the SMD of around 17 mm for 5 mm/s gas injection rate gradually decreased to 10 mm upon increasing it to 50 mm/s [13]. In this manner, the pore size is another parameter where the resultant bubble sizes were in proportion to that discussed in the next section. The representative images of bubbles in the form of air flowrate are shown in Figure 4b.
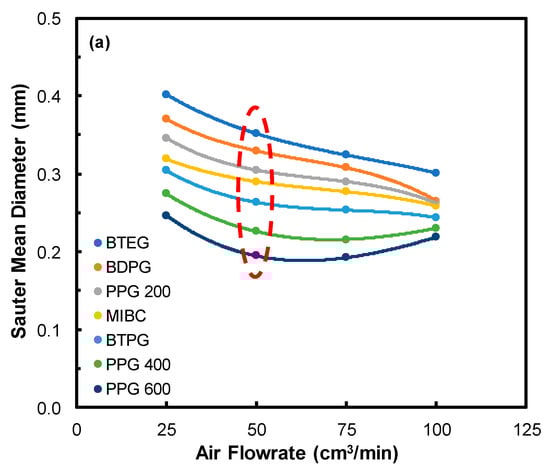
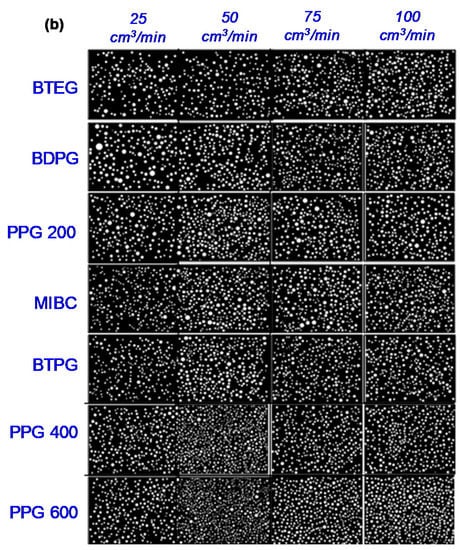
Figure 4.
(a) Effect of air flowrate on the SMD of bubbles (Frit pore size: 10–16 µm; frother concentration: 50 ppm), (b) Images of bubbles as a function of air flowrate.
3.2.2. Effect of Frit Pore Size
Frit pore size is one of the most influential parameters for determining bubble sizes. Therefore, besides frother concentration, the pore size should also be considered for evaluating bubble characteristics and consequently flotation of fine particles. Accordingly, in addition to the first series of tests carried out with 10–16 µm frit, another series of tests with frits of 16–40 µm and 40–100 µm were performed. Likewise, in the previous series, the frother concentration was taken as 50 ppm while the amount of flowrate was kept at 50 cm3/min. The results of these tests are shown in Figure 5. As can be seen in Figure 5, the SMD of bubbles were varied in proportion to the frit pore size regardless of frother type. For example, the SMD of BTEG was 0.516 mm for the frit of 40–100 µm and decreased to 0.443 and 0.350 mm for frits of 16–40 µm and 10–16 µm, respectively.
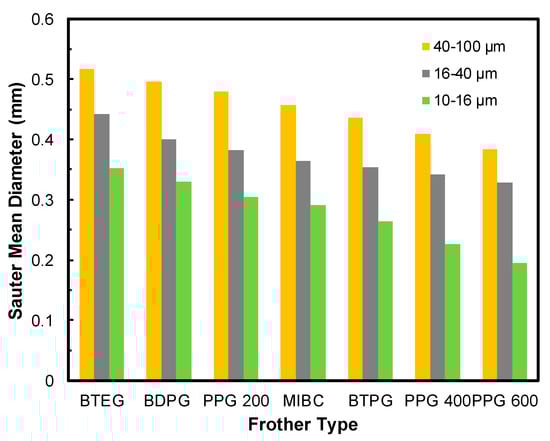
Figure 5.
Effect of frit pore size on SMD of bubbles.
3.3. Bubble Size Distribution (BSD)
As mentioned before, bubble size distribution (BSD) is one of the most important factors in flotation and depends on frother type and concentration, air flowrate, and frit pore size. Figure 6 shows the bubble size distribution with respect to frother type at constant frother concentration (50 ppm), air flowrate (50 cm3/min), and frit pore size (10–16 µm). As seen from Figure 6, depending on frother type, the bubbles produced in the presence of frothers appeared at lower sizes. For example, while the BSD in the presence of PPG 600 accumulated between 0–0.3 mm and the d50 of BSD was determined at 0.1901 mm, BTEG gave the highest BSD variation between 0–0.9 mm, and the d50 of BSD was 0.4222 mm. Also, the same order of frothers was obtained when BSD was considered in the presence of frothers together with the previous findings for SMD values at a constant concentration of 10 ppm for each frother (Figure 6). Accordingly, the following order of the BSD for frothers was obtained based on the results seen in Figure 6:
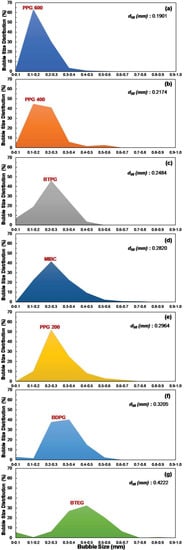
Figure 6.
Effect of frother type on BSD at 50 ppm frother concentration, 50 cm3/min air flowrate, and 10–16 µm frit pore size: (a) PPG 600 (b) PPG 400 (c) BTPG (d) MIBC (e) PPG 200 (f) BDPG (g) BTEG.
PPG 600 < PPG 400 < BTPG < MIBC < PPG 200 < BDPG < BTEG.
3.4. Kinetics of Frother’s Adsorption on Rising Bubbles at CCC
The CCC values of the frothers were measured under dynamic conditions [7]. The average residence time of the bubbles in the liquid part of the cell after their production is in the range of 1 to 2 s. Is this amount of time sufficient for the frother to adsorb on the bubbles’ surface to such a degree that it can prevent the bubble coalescence? The surface tension isotherm and calculated adsorption parameters of each frother [7] can be used to determine the equilibrium adsorption value for each frother at its CCC. Therefore, it is curious to know how fast each frother reaches its equilibrium adsorption value. The basic equation of the convective diffusion of frother on the surface of a rising bubble (or falling particle) is given by Equation (2) [36]:
where Γ is the instant frother’s adsorption on the bubbles’ surface, Γeq is its equilibrium adsorption, D is its bulk diffusion coefficient, t is time, is the radius of the bubble, K is its equilibrium adsorption constant, , is the Peclet number giving the ratio between the convection and the diffusion, and U is the velocity of the bubble. To calculate the adsorption Γ versus time using Equation (3) we calculated the value of the bulk diffusion coefficient of each frother in the way reported in ref. [37]. Also, the values for R at the CCC value of each frother were taken from Figure 3. The velocity of the bubble rising was calculated employing Equation (3) [38]:
where g is the acceleration due to gravity, ρL is the density of the liquid (water), de is the equivalent bubble diameter, and μL is the dynamic viscosity of the liquid (water).
The basic parameters needed to calculate the adsorption kinetics of the frothers on the surfaces of the rising bubbles at the CCC of each frother are given in Table 1. Figure 7 presents the adsorption of frothers on the surface of the rising bubble versus time at CCC of the frothers. One can see that PPG 200 and MIBC are the fastest adsorbing frothers. PPG 200 needs 6 ms to reach equilibrium adsorption, while MIBC needs 17 ms. The next fast adsorbing frohers are BTEG (20 ms), BDPG (44 ms), and BTPG (210 ms). All these frothers reach an equilibrium state in their adsorption layer on the surfaces of the rising bubbles keeping in mind that the resident time of the bubbles in the liquid part of the froth cell is in the range of 1 to 2 s. The PPG 400 (9.7 s) and PPG 600 (15.9 s) are the slowest adsorbing frothers, hence, do not reach an equilibrium state as seen in Figure 7. Therefore, their real adsorption on the bubbles’ surfaces is smaller compared to the equilibrium one corresponding to CCC at equilibrium. It is interesting to note a significant difference between the behavior of PPG 200 and PPG 400 and PPG 600 on the surface of the bubble (see Figure 4). The only difference between them is in the length of the polypropylene oxide chain, which causes a significant difference in their performance within the adsorption layer. To clarify more the origin of this observation a correlation with the Gibbs elasticity of the adsorption layer should be sought.

Table 1.
Parameters required to calculate the adsorption kinetics of the frothers on the surfaces of the rising bubbles at the CCC of each frother (Bubble diameters is derived from Figure 3a).
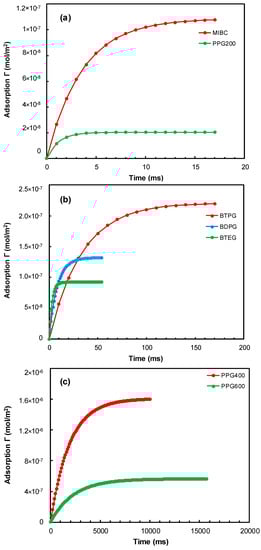
Figure 7.
Adsorption of the frothers on the surface of rising bubbles versus time at CCC of (a) MIBC and PPG 200; (b) BTPG, BDPG, and BTEG; (c) PPG 400 and PPG 600.
Yet, this smaller adsorption is sufficient to prevent bubble coalescence. The frothers in the order of increasing time to reach equilibrium can be presented by the following series:
The dependence of the bubble size on the flow rate and the pore size of the porous frit is part of a larger physical picture on the combined effect of the frother, flow rate, and pores. Here, it was tried to demonstrate the whole picture by providing all these experimental results. However, if one visualizes only bubble size, Pore size, and flow rate, the results might look trivial. Regarding the frother structure, it is related to the adsorption parameters and the kinetics of adsorption of the frother, as already presented in Table 1.
Figure 8 shows the CCC values of the frothers versus time reaching adsorption equilibrium. As seen in Figure 8, there is a direct correlation between the adsorbing rate of the frothers and their CCC values. While the fastest adsorbing frothers namely PPG 200, MIBC, BTEG, BDPG, and BTPG have higher CCC values, PPG 400 and PPG 600 which are the slowest adsorbing frothers have lower CCC values.
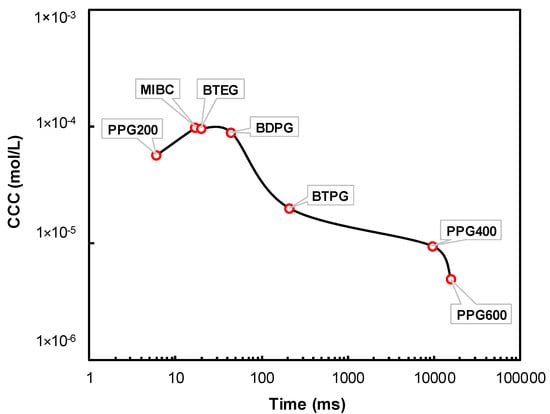
Figure 8.
Correlation between CCC values of the frothers and time for reaching adsorption equilibrium.
These findings complement the results shown in Figure 4a, which shows that the bubble size decreases with the increase of the gas flow rate in the case of MIBC, BTPG, PPG 200, BDPG, and BTEG, but in the case of PPG 400 and PPG 600, the bubble size reaches a minimum at a certain level of the gas flow rate, beyond which the bubble size increases. The first group of frothers (MIBC, BTPG, PPG 200, BDPG, and BTEG) adsorb instantly on the bubbles once they leave the porous frit, while the second group of frothers (PPG 400 and PPG 600) adsorbs substantially slower on the bubbles. One can see that with the increase of the gas flow rate these frothers have a smaller time to adsorb on the bubbles, which make their adsorption layers scarcer. Therefore, their ability to prevent coalescence decreases above a certain gas flow rate.
If we consider the order of frothers in terms of the time to reach an equilibrium, it can be concluded that bubbles covered with PPG 200, MIBC, BTEG, BDPG, and BTPG have equilibrated adsorption layers with full coverage in contrast to the bubbles covered with either PPG 400 or PPG 600, whose adsorption layers are non-equilibrated. Nevertheless, the latter ones produce the smallest bubbles out of all frother types. This could be explained with the properties of their adsorption layers, which most probably form a 2D net on the air/water interface as already presented in our previous study [9]. The increase of the bubble flow rate in the presence of PPG 400 and PPG 600 certainly causes a scarcer adsorption layer, which is not able to prevent sufficiently the bubble coalescence below a certain level.
It can be concluded from the results that, in particular, the frothers of the polyglycol family, namely PPG 600 and PPG 400, gave finer bubble size distribution compared to the alcohol family or other types of frothers, as seen in Figure 6. This can be attributed to the fact that the first group of frothers adsorbs instantly on the bubbles, once they leave the porous frit, thus reaching equilibrium. On the other hand, PPG 600 and PPG 400 adsorb significantly slower on the bubbles, possibly not reaching equilibrium during their resident time. The results obtained from this study will help us understand the chemical and physical factors affecting the production of bubbles.
4. Conclusions
In this study, the Sauter Mean Diameter (SMD) and The bubble size distribution (BSD) of different commercial frothers (PPG 200, 400, and 600, BTPG, BTEG, BDPG, and MIBC) were investigated based on the bubble images captured at each frother concentration. In addition to the effect of concentration, the effects of air flowrate and frit pore size were also investigated. The results of these tests showed that while the highest SMD value of 0.6438 mm was found for BTEG, the lowest SMD value of 0.3098 mm was found for PPG 600 at a critical concentration of 10 ppm for almost all types of frothers. The SMD of other frother types also followed an order based on their molecular weight likewise their surface tension values. The results for the effects of air flowrate showed that while the highest values were obtained for the lowest flowrate of 25 cm3/min, it gradually decreased with increasing the flowrate up to 100 cm3/min regardless of frother type. Likewise, the effect of frit pore size was found to show a reverse trend with air flowrate such that the lowest SMD values corresponded to the lowest frit pore size of 10–16 µm whereas higher values were obtained at 40–100 µm pore size. The BSD of frothers also followed the same order obtained for SMD values; the finest distribution was obtained for PPG 600 and gradually exhibited a coarser distribution for BTEG. The kinetics of frother’s adsorption on the surfaces of rising bubbles was studied theoretically. It was established that PPG 200, MIBC, BTEG, BDPG, and BTPG, in accordance with their surface tension data, reach adsorption equilibrium within milliseconds (weak frothers), while PPG 400 and PPG 600 reach adsorption equilibrium in 9.7 s and 15.4 s (strong frothers); the latter frothers indicate non-equilibrated adsorption layers in the froth column.
In sum, these results showed that tuning the flotation conditions such as type of frother, air flowrate, frit type, and concentration would be very effective in adjusting bubble size which in turn affects the flotation recovery of fine valuable particles from the pulp.
Author Contributions
Experimental methodology, O.G., K.B., O.O., F.B.; validation, S.I.K., N.A.G.; investigation, O.G., K.B., O.O.; resources, O.G., O.O., F.B., M.S.Ç.; original draft preparation, O.G. and O.O.; writing—review and editing, O.G., O.O., S.I.K., M.S.Ç.; supervision, O.O., M.S.Ç.; project administration, M.S.Ç. All authors have read and agreed to the published version of the manuscript.
Funding
This project has received funding from the European Union’s Horizon 2020 research and innovation program Fine Future under grant agreement No 821265.
Data Availability Statement
Not applicable.
Conflicts of Interest
The authors declare no conflict of interest.
Nomenclature to the Appendix
| Speed of bubble | |
| Diffusion coefficient of frother | |
| Radius of the bubble | |
| Frother bulk concentration | |
| Frother concentration at the bubble surface | |
| Peclet number | |
| Henry adsorption constant | |
| Thickness of diffusion boundary layer | |
| Equilibrium adsorption | |
| Temporal adsorption | |
| Henry adsorption constant |
Appendix A. Brief Derivation of the Equation of the Convective Adsorption of the Frothers on the Rising Bubbles
The very derivation of Equation (2) is long and complex. We will outline the basic concepts and the most important points of this derivation. We have a bubble moving with speed in a liquid containing frother with bulk concentration . The frother adsorbs on the bubble surface by diffusion control. Hence, the first and second laws of Fick will play a basic role here. The frother concentration profile C(r) (r is radial coordinate) near the bubble surface will be developed in a diffusion boundary layer with thickness δ. δ depends on the speed of the bubble, the frother diffusion coefficient , and the radius of the bubble . Beyond δ (at r > δ), C(r) = . The process of adsorption is stationary. Hence the equation originating from the second law of Fick accounting for the convection is to be solved for the region
In spherical coordinates () accounting for the symmetry along Equation (A1) can be presented as:
After this, there are several mathematical transformations including streamlines function ψ(r, θ) in dimensionless forms. As a result, it appears that the concentration profile C(r) is developed within a given distance δ from the surface called the diffusion boundary layer and δ = f(a, D, U, θ). The latter can be averaged upon θ thus obtaining:.
where the diffusion boundary layer average upon the azimuthal angle is:
We have as well and the Peclet number , which gives the ratio between the convection and diffusion. The average thickness of the diffusion boundary layer can be given . As far as we operate with frothers at their CCC, their adsorption layers are scarce and it is justified to use the Henry adsorption isotherm:
Hence we have: , .
We can present Equation (A3) as:
The convective diffusion flux on the surface of the bubble presented in Equation. (A5) can be presented as a differential equation with regard to the adsorption :
The solution of Equation (A7) is Equation (2).
References
- Guven, O.; Celik, M.S.; Drelich, J.W. Flotation of methylated roughened glass particles and analysis of particle-bubble energy barrier. Miner. Eng. 2015, 79, 125–132. [Google Scholar] [CrossRef]
- Cho, Y.S.; Laskowski, J.S. Effect of flotation frothers on bubble size and foam stability. Int. J. Miner. Process. 2002, 64, 69–80. [Google Scholar] [CrossRef]
- Nesset, J.E.; Finch, J.A.; Gomez, C.O. Operating variables affecting the bubble size in forced-air mechanical flotation machines. In Proceedings of the 9th Mill Operators’ Conference 2007, Fremantle, WA, Australia, 19–21 March 2007; pp. 55–65. [Google Scholar]
- Zhang, W.; Nesset, J.E.; Finch, J.A. Water recovery and bubble surface area flux in flotation. Can. Metall. Q. 2010, 49, 353–362. [Google Scholar] [CrossRef]
- Welsby, S.D.D. Pilot-Scale Froth Testing at Highland Valley Copper. In Proceedings of the 46th Annual Meeting of the Canadian Mineral Processors Conference, Ottawa, ON, Canada, 21–23 January 2014; pp. 301–314. [Google Scholar]
- Zangooi, A.; Gomez, C.O.; Finch, J.A. Mapping frother distribution in industrial flotation circuits. Miner. Eng. 2017, 113, 36–40. [Google Scholar] [CrossRef]
- Guven, O.; Batjargal, K.; Ozdemir, O.; Karakashev, S.I.; Grozev, N.A.; Boylu, F.; Çelik, M.S. Experimental procedure for the determination of the critical coalescence concentration (CCC) of simple frothers. Minerals 2020, 10, 617. [Google Scholar] [CrossRef]
- Gomez, C.O.; Finch, J.A.; Muñoz-Cartes, D. An approach to characterise frother roles in flotation. In Proceedings of the 8th International Mineral Processing Seminar Procemin, Santiago, Chile, 30 November–2 December 2011; pp. 223–231. [Google Scholar]
- Karakashev, S.I.; Grozev, N.A.; Batjargal, K.; Guven, O.; Ozdemir, O.; Boylu, F.; Çelik, M.S. Correlations for easy calculation of the critical coalescence concentration (CCC) of simple frothers. Coatings 2020, 10, 612. [Google Scholar] [CrossRef]
- Vazirizadeh, A.; Bouchard, J.; Chen, Y. Effect of particles on bubble size distribution and gas hold-up in column flotation. Int. J. Miner. Process. 2016, 157, 163–173. [Google Scholar] [CrossRef]
- Kracht, W.; Rebolledo, H. Study of the local critical coalescence concentration (l-CCC) of alcohols and salts at bubble formation in two-phase systems. Miner. Eng. 2013, 50, 77–82. [Google Scholar] [CrossRef]
- Grau, R.A.; Laskowski, J.S. Role of frothers in bubble generation and coalescence in a mechanical flotation cell. Can. J. Chem. Eng. 2006, 84, 170–182. [Google Scholar] [CrossRef]
- Mohagheghian, S.; Elbing, B.R. Characterization of bubble size distributions within a bubble column. Fluids 2018, 3, 13. [Google Scholar] [CrossRef]
- Maldonado, M.; Desbiens, A.; del Villar, R.; Girgin, E.; Gomez, C. On-line estimation of bubble size distributions using Gaussian mixture models. In Proceedings of the V International Mineral Processing Seminar, Santiago, Chile, 22–24 October 2008; pp. 389–398. [Google Scholar]
- Kowalczuk, P.B.; Drzymala, J. Physical meaning of the Sauter mean diameter of spherical particulate matter. Particul. Sci. Technol. 2016, 34, 645–647. [Google Scholar] [CrossRef]
- Orpina, G.; Pincovschi, I.; Baran, G. Hidro-gazo-dinamica sistemelor de aerare echipate cu generatoare de bule. Ed. Politech. Press Buch. 2009, 5, 108–128. [Google Scholar]
- Mândrea, L.; Oprina, G.; Chihaia, R.A.; El-Leathey, A.; Mirea, R. Theoretical and Experimental Study of Gas Bubbles Behavior. Int. J. Model. Optim. 2017, 7, 145–151. [Google Scholar] [CrossRef][Green Version]
- Klimpel, R.R.; Hansen, R.D. Frothers. In Reagents in Mineral Technology; Somasundaran, P., Ed.; CRC Press: Boca Raton, FL, USA, 1988; pp. 385–409. [Google Scholar]
- Somasundaran, P.; Moudgil, B.M. Surfactant Science Series, Vol. 27: Reagents in Mineral Technology; Marcel Dekker Inc.: New York, NY, USA, 1988; p. 755. [Google Scholar]
- Gupta, A.K.; Banerjee, P.K.; Mishra, A. Effect of frothers on foamability, foam stability, and bubble size. Coal Prep. 2007, 27, 107–125. [Google Scholar] [CrossRef]
- Klimpel, R.R.; Isherwood, S. Some industrial implications of changing frother chemical structure. Int. J. Miner. Process. 1991, 33, 369–381. [Google Scholar] [CrossRef]
- Laskowski, J.S.; Woodburn, E.T.E. Frothing in Flotation II; Gordon and Breach: Amsterdam, The Netherlands, 1998; p. 371. [Google Scholar]
- Laskowski, J.S.; Tlhone, T.; Williams, P.; Ding, K. Fundamental properties of the polyoxypropylene alkyl ether flotation frothers. Int. J. Miner. Process. 2003, 72, 289–299. [Google Scholar] [CrossRef]
- Wills, B.A.; Finch, J.A. Froth Flotation. In Wills’ Mineral Processing Technology; Elsevier: Amsterdam, The Netherlands, 2016; Volume 12, pp. 265–380. [Google Scholar]
- Tan, Y.H.; Zhang, W.; Finch, J.A. Frother structure-property relationship: Effect of polyethylene glycols on bubble rise velocity. Miner. Eng. 2018, 116, 56–61. [Google Scholar] [CrossRef]
- Zhang, W.; Nesset, J.E.; Rao, R.; Finch, J.A. Characterizing frothers through critical coalescence concentration (CCC)95-hydrophile-lipophile balance (HLB) relationship. Minerals 2012, 2, 208–227. [Google Scholar] [CrossRef]
- Kangal, M.O.; Bulut, G.; Guven, O. Physicochemical characterization of natural wollastonite and calcite. Minerals 2020, 10, 228. [Google Scholar] [CrossRef]
- Sweet, C.; Van Hoogstraten, J.; Harris, M.; Laskowski, J.S. The effect of frothers on bubble size and frothability of aqueous solutions. In Processing of Complex Ores–Proc. 2nd UBC-Mc Gill Int. Symp; Finch, J.A., Holubec, I., Eds.; Metallurgical Society of CIM: Montreal, QC, Canada, 1997; pp. 235–245. [Google Scholar]
- Comley, B.A.; Harris, P.J.; Bradshaw, D.J.; Harris, M.C. Frother characterisation using dynamic surface tension measurements. Int. J. Miner. Process. 2002, 64, 81–100. [Google Scholar] [CrossRef]
- Grau, R.A.; Laskowski, J.S.; Heiskanen, K. Effect of frothers on bubble size. Int. J. Min. Process. 2005, 76, 225–233. [Google Scholar] [CrossRef]
- Cao, L.; Chen, X.; Peng, Y. The effect of aliphatic alcohol frothers on the dispersion of oily collector. Miner. Eng. 2020, 157, 106552. [Google Scholar] [CrossRef]
- Cao, L.; Chen, X.; Peng, Y. The effect of polyglycol-type frothers on the interfacial characteristics of oily collector dispersion. Miner. Eng. 2020, 157, 106579. [Google Scholar] [CrossRef]
- Castro, S.; Miranda, C.; Toledo, P.; Laskowski, J.S. Effect of frothers on bubble coalescence and foaming in electrolyte solutions and seawater. Int. J. Miner. Process. 2013, 124, 8–14. [Google Scholar] [CrossRef]
- Finch, J.A.; Nesset, J.E.; Acuña, C. Role of frother on bubble production and behaviour in flotation. Miner. Eng. 2008, 21, 949–957. [Google Scholar] [CrossRef]
- Szyszka, D. Critical Coalescence Concentration (CCC) for surfactants in aqueous solutions. Minerals 2018, 8, 431. [Google Scholar] [CrossRef]
- Levich, V.G. Physicochemical Hydrodynamics; Prentice-Hall: Englewood Cliffs, NJ, USA, 1962; p. 512. [Google Scholar]
- Karakashev, S.I.; Ivanova, D.S.; Angarska, Z.K.; Manev, E.D.; Tsekov, R.; Radoev, B.; Slavchov, R.; Nguyen, A.V. Comparative validation of the analytical models for the Marangoni effect on foam film drainage. Coll. Surf. A 2010, 365, 122–136. [Google Scholar] [CrossRef]
- Park, S.H.; Park, C.; Lee, J.; Lee, B. A Simple Parameterization for the Rising Velocity of Bubbles in a Liquid Pool. Nucl. Eng. Technol. 2017, 49, 692–699. [Google Scholar] [CrossRef]
Publisher’s Note: MDPI stays neutral with regard to jurisdictional claims in published maps and institutional affiliations. |
© 2021 by the authors. Licensee MDPI, Basel, Switzerland. This article is an open access article distributed under the terms and conditions of the Creative Commons Attribution (CC BY) license (http://creativecommons.org/licenses/by/4.0/).