
Influence of Strain Rate, Temperature and Chemical Composition on High Silicon Ductile Iron


Rise Swecast AB, SE-550 02 Jönköping, Sweden
Minerals 2021, 11(4), 391; https://doi.org/10.3390/min11040391
Submission received: 19 February 2021
/
Revised: 1 April 2021
/
Accepted: 3 April 2021
/
Published: 8 April 2021
(This article belongs to the Special Issue Crystallization and Growth of Graphite)
Abstract
:Today, the use of solution hardened ductile iron is limited by brittleness under certain conditions. If chassis components are subjected to loads having high strain rates exceeding those imposed during tensile testing at sub-zero temperatures, unexpected failure can occur. Therefore, it is the purpose of this review to discuss three main mechanisms, which have been related to brittle failure in high silicon irons: intercritical embrittlement, the integrity of the ferritic matrix and deformation mechanisms in the graphite. Intercritical embrittlement is mainly attributed to the formation of Mg- and S-rich grain boundary films. The formation of these films is suppressed if the amount of free Mg- and MgS-rich inclusions is limited by avoiding excess Mg and/or by the passivation of free Mg with P. If the grain boundary film is not suppressed, the high silicon iron has very low elongations in the shakeout temperature regime: 300 to 500 °C. The integrity and strength of the ferrite are limited by the reduced ordering of the silicumferrite with increasing silicon content, once the “ordinary” ferrite is saturated at 3% silicon, depending on the cooling conditions. Finally, the graphite damaging mechanisms are what dictate the properties most at low temperatures (sub −20 °C).
1. Introduction
High yield strength, high ductility, low hardness variation, and thus, advantageous machinability of high silicon iron (HSI), also known as solid solution strengthened ferritic spheroidal graphite iron, are examples of its advantages over conventional pearlite/ferritic ductile iron. Unfortunately, the use of HSI grades EN-ISO-GJS-450-18, 500-14 and 600-10 (EN1653) is endowed with a ductile-to-brittle transformation that is above all tied to their silicon content as well as their chemical composition. In addition, a brittle-to-ductile transformation can also occur at low temperature if one increases the deformation velocity from the normal strain rate at tensile tests to levels that are realistic for components in service. This can cause component failure if they are subjected to high strain rates at sub-zero temperatures. Therefore, it is the intention of this review to discuss how the deterioration in mechanical properties at different strain rates and at different temperatures (RT to −20 °C) can lead to more stable and predictable mechanical properties e.g., by micro-alloying or through process optimization.
2. Dynamic Failure of Cast Irons
In 1998, the main failure mode data for conventional ferritic, pearlitic and pearlitic–ferritic castings for low- and high-cycle fatigue studies conducted between 1975 and 1995 in Japan, were summarized [1]. For high-cycle fatigue, micro-shrinkages are the main mode of fracture along with abnormal graphite and dross. For low-cycle fatigue, fracture starts from different defects related to strength, surface state and graphite structure of the castings. The over-representation of micro-shrinkage-borne failure in some of the fatigue studies can be a direct consequence of Y2 blocks (25 mm thick) that are often poured for the various fatigue investigations. The lack of runner systems and filters employed in industrial castings in Y2 blocks often leads to micro-shrinkages below the stem of the Y-section. Consequently, if fatigue bars are extracted there, these will often contain micro-shrinkages. These imperfections are influenced by the feeding of the casting, the hardness of the mold, the carbon equivalent (CEs = C + Si/3 and CEL = C + Si/4 + P/2), the freezing ratio, piping in the feeder, the filtering and solidification gradient [2]. Here, two accepted definitions for the carbon equivalent exist (CE): CEs at the solidus temperature and CEl at the liquidus temperature. The use of La either in the Mg-treatment alloy [3] or in the inoculant [4] has been successful in reducing shrinkage imperfections in conventional ductile iron. The best investigations will extract all dynamic test bars from the base of the Y2 block that are often free from micro-shrinkages and relate the static properties to test bars extracted above the dynamic test bars in the same Y2 block. When this was done for R = 0.1 and 20 Hz loading in push–pull, which was interrupted at 4 million cycles, outstanding fatigue limits were extracted from the Wöhler curve (not shown) for HSI grade GJS-500-14 of 358MPa compared to only 170 MPa for GJS-400-18, as shown in Table 1 [5]. Here, the Mg/P ratio is more than 3 for HSI and less than 1.5 for GJS-400-18.
3. Effect of Elongation and Impact Properties on High Silicon Ductile Iron
For HSI, high elongation is not necessarily related to high impact properties, as seen to the right in Figure 1 [6]. Based on the elongation data to the left in Figure 1, GJS-500-14 was produced with 3.5 to 4.5% Si and GJS-600-10 was produced with 4 to 5% Si if the specification limits stipulated in EN1653 were followed [6]. HSI castings with 4 to 5% Si partially adhering to GJS-600-10 were nearly independent of key casting process parameters like nodularity, nodule count and carborn eqivalent, CE, when determining, ultimate tensile stress (UTS or Rm), yield strength (Rp) and elongation (A%) [7,8]. The metallurgical parameters or mechanisms that are significant for tensile strength remain elusive. For GJS-600-10 HSI, the use of adapted runners and filters was paramount in achieving the required elongations [8]. Conversely, the impact data in Figure 1 indicate that mimicking the elongation-only approach entails significant risk. For actual components, the implication of this is that the GJS-500-14 process window would be limited to between 3.5 and 3.8% Si for thinner components and between 3.5% and 4% Si for larger components (diameter 200 mm). The GJS-600-10 would then be best avoided.
4. Deformation Mechanisms Related to High Silicon Ductile Iron
Fortunately, complacency has never been the hallmark of the ferrous casting community, which has led to extensive investigation of deformation loading and microstructural mechanisms. Elongation and impact properties are on the opposite sides of the strain rate scale. The high strain rates imposed by Charpy V testing developed for steel and the slow strain rates that are commonly used in tensile testing have little or no practical implication for the actual component. Nevertheless, instrumented Charpy V elucidated the crack initiation and propagation energy in a load–deflection curve for different heat treatments of ferritic irons at low temperatures [9]. Further insight into the properties of the final component is available by fracture toughness testing, but its sample preparation is too costly and time consuming even if the results are relevant to the castings used. Therefore, high-speed tensile testing, high-frequency fatigue testing and the Rosberg drop test have been implemented for the evaluation of HSI and conventional cast irons [10].
The high-speed tensile test provides data on different strain rates, which are very helpful in the simulation and prediction of the final properties. To resolve the paradigm imposed by conflicting elongation and impact properties for HSI, Ikeda has made the most contributions to deciphering how high-speed tensile tests with various strain rates are relevant for actual components. In Table 2, all relevant strain rates for impact testing, tensile testing and components are shown. Unfortunately, Ikeda [11,12,13] is particularly keen on using the R parameter in his reporting, which makes the identification of strain rate effects at certain temperatures difficult if not impossible. R = T·ln(A/έ), where T is temperature in kelvin, A is a rate constant = 108 s−1 and έ is strain rate. The most striking result with HSI and other ductile irons is that they have more than 800MPa nominal bend stress for strain rates below 10 s−1 at −20 °C [11]. A strain rate of 10 s−1 corresponds to a loading experienced for a chassis in a crash test. For GJS-500-14 bend tests, predominantly ductile fracture occurred for strain rates between 10−4 and 4.0 × 10⁻² s−1, with the onset of brittle fracture occurring at strain rates from 1 s−1 [14] to 2.5 × 10⁻¹ s−1 [11]. The Rosberg test is a convenient method to study energy absorption of the cast material without the extensive sample preparation found within instrumented Charpy V testing [10].
5. Graphite Degeneracy of High Silicon Iron
The HSI inherent risk to form chunky graphite, spike graphite and exploded graphite increases for Si and other alloying elements like Ni. Out of these, chunky graphite can make the yield strength equal to the ultimate tensile strength, which is particularly embrittling. The most common strategy to counter chunky graphite is to add Sb and balance this with Ce. Here, Auger electron Spectroscopy (AES) found that the graphite nodules were encapsulated by an Sb shell 1 to 4 nm thick, which hindered the diffusion of carbon [15]. Another radiographic investigation using Ce141 isotopes in ductile iron found that Ce was enriched on the dendrite arms [16,17], which limits C diffusion and binds subversive elements. Of course, the Sb enrichment must be carefully controlled and balanced to the subversive elements, but if this is performed, the degenerate graphite is often avoided.
6. Graphite Morphology and Fatigue Strength
Once the surface graphite is larger than 100 μm, it is unlikely that the runout fatigue level (107 cycles) will be fulfilled, which was demonstrated by the evaluation of hypereutectic graphite [18]. Furthermore, the rotating fatigue strength for ordinary ductile iron is approximately 100 MPa higher when one compares graphite sizes of 32 μm with 90 μm [18]. Therefore, large graphite formation must be suppressed to ensure satisfactory fatigue strengths.
Recently, graphite onion skin formation has been tied to crack propagation, which affects the integrity of the graphite shell [19,20]. This loose outer shell of graphite around the graphite nodule itself (not shown), in which the shell de-bonds from the nodule core, has been proposed as a major failure mechanism with the aid of an in situ tensile stage in a Field Emission Gun-Scanning Electron Microscope (FEG–SEM) for ferritic–pearlitic ductile iron [19] and for GJS-350-22 ferritic ductile irons using various strain rates [20]. Another subsequent damaging micromechanism is a disintegration mechanism, which involves nodule core crack initiation and growth [20]. However, it is stressed that damaging micromechanisms involve graphite nodule damage mechanisms and various matrix damage mechanisms [19]. For fully pearlitic ductile irons, onion skin formation is already irreversible under elastic loading where crack initiation in the matrix is also observed [19]. Conversely, for GJS-350-22, ferritic ductile irons produce the irreversible damage at the yield strength initiated simultaneously by onion skin formation in the graphite nodules and by crack initiation in the ferritic matrix at the matrix–spheroid interface [20]. Further graphite nodule damage then becomes dependent on the strain rate when slip lines are observed in the matrix [20]. For high strain rates of 10−2 s−1, the graphite failure is distributed 50:50 between the onion skin and disintegration mechanisms [20]. For lower strain rates of 10−3 and 10−4 s−1, the graphite failure is distributed 80:20 between the onion skin and disintegration mechanisms. However, for the lowest strain rate, the disintegration mechanism occurs before the onion skin mechanism even if they are distributed 50:50 between each other.
Previously, graphite nodule decohesion from the matrix, plastic deformation of the matrix (with and without micro-segregation) and the influence of grain boundary films have been widely theorized to describe the failure mechanism of ductile iron amongst the scientific community. It seems like the onion skin is a growth-related mechanism that occurs in the final stages of solidification. From dark field scanning transmission electron microscopy of the graphite surface region, it can be observed that the inner part towards the center of the nodule has a different structure (growth along the C-axis of the graphite crystal lattice) compared to the 1 and 2 μm outer shell [21]. This structure difference was proposed to be due to the change in the solid-state carbon diffusion from the solid matrix to the graphite nodule, but it may depend on the chemical composition and cooling rate [21]. Of course, the onion skin and the effect of enclosed iron inside the nodule need to be better related to low-temperature performance of the casting.
7. Thermal Conductivity of High Silicon Iron
Unfortunately, the increase in silicon also leads to lower thermal conductivity, which increases the thermal gradient between the surface and the bulk of the casting. This leads to localization and concentration of damages and early crack initiation in a study on thermal cycling [22]. The fact that HSI has lower thermal conductivity is often overlooked. There is a recommendation that wider feeder necks should be used for HSI to improve feeding. The lower thermal conductivity of HSI of around 0.3 W/cmK at room temperature is much less than for ordinary ferrite irons. In fact, HSI thermal conductivity of 0.8, 0.42 and 0.29 W/cmK at 100, 500 and 1000 °C is only slightly higher than that for MgO of 0.36, 0.16 and 0.07 [23]. For dynamic loading, this could have the implication that heat is accumulated in the intergranular region to a larger extent than that of the ordinary cast irons. For HSI inclusion, clustering at the cell boundary is especially detrimental. The coefficient of thermal expansion is also especially low around 400 to 500 °C for HSI and GJS-500-7 for thinner section sizes [24]. However, there are little data on how the lower thermal conductivity or the coefficient of thermal expansion affects the mechanical properties or how these can be predicted with casting simulations. Micro-segregation should also benefit from this lower thermal conductivity. The thermal conductivity was also insensitive for up to 50% pearlite between RT and 400 °C [25].
8. Intergranular and Transgranular Embrittlement
To ensure operational reliability, an understanding of embrittlement phenomena is essential [26]. For many ferrous materials like ductile irons, cell/grain boundary films are commonly tied to embrittlement. Here, the main micro-shrinkage porosities in ductile iron have been located to the previous austenite grain boundaries with Electron backscatter diffraction (EBSD) investigation [27]. However, the embrittlement of HSI is not fully understood. Therefore, several explanations have been sought.
The most striking degradation in mechanical properties occurs at around 400 °C (673 K) for most ductile irons when they are tested between RT and 700 °C. Since 673 K is the shakeout temperature region of most iron castings, one should reflect on how any deformation suffered by the castings at 673 K would affect its integrity in static and dynamic loading situations. For static properties and low strain rates, any imposed shakeout damage to the castings integrity at 673 K is likely to go unnoticed. However, if the shakeout deformation at 673 K is high enough, it could partially explain why cast irons under-perform at higher deformation rates and dynamic loading. For GJS-500-14 compositions, it has been demonstrated that >10% elongations exist below 200 °C, as seen in Figure 2 [26,28]. This suggests that shakeout of HSI grades needs to be conducted below 200 °C or above 600 °C to be sure that cold cracking is avoided. Here, damage mechanisms like cold breakage of graphite, grain boundary films and tearing should be investigated on a sub-micro level.
Ferritic ductile iron sand mold castings, with annealing cycles at 1203 K for 3 h and 993 K for 3 h to yield a ferritic state, were tested between 200 and 500 °C and all had intergranular fracture at 673 K, as seen in Figure 3 [29]. Only the castings from the metal permanent molds with rapid cooling were free from intergranular fracture. This suggests that the use of chills should be effective at suppressing this failure mode. Note that the graphite size and the ferrite grain size were interrelated and impossible to separate.
A detailed SEM investigation of embrittlement fracture at low temperature points to intergranular fracture owing to P-rich inclusions as the dominant mechanism down to −20 °C [30]. At −40 °C, a mixture of intergranular and transgranular fracture in regions enriched in P elucidated by advanced etching and SEM was the dominant mechanism [30]. The detailed SEM study included aged and as-cast specimens with 0.07% P. For the aged specimen, the P ejection at 450 °C around silicumcarbides was proposed as the main embrittling mechanism.
In a study on thermal cycling of ferritic ductile iron containing 3, 4 and 4.3% Si, several microstructural observations were made [22]. The main argument is that silicon alloying reduces the boundary strength of the ferritic matrix. The elevated solid solution hardening degree of the ferrite matrix with increasing silicon not only leads to a transition from dimple to cleavage fracture, but an equally important narrowing of the morphology of the eutectic cell wall. This concentrates AES-elucidated Mg-, Ce- and P-rich inclusions and the metallic Mg films on the cell boundary more densely [22]. The direct consequence of this morphological digression is that the casting process tolerance at silicon levels approaching the saturation level for the Body-Centered Cubic (BCC) ferrite, i.e., above 4.3% Si, becomes extremely confined.
Another effect of increasing Si leads to an extensive increase in eutectic cell area and length for HSI compared to the GJS-500-7 and GJS-400-18 material, as seen in Table 3 [26]. Here, ferritic–pearlitic castings were free from 673 K embrittlement, and 3.9% Si HSI had less than 5% elongation between 300 and 500 °C. For the latter, GJS-400-18 iron lower carbon equivalents also led to increased inclusion clustering; owing to the temperature difference between the liquidus and solidus temperature [31]. Unfortunately, no 673 K properties were investigated for this GJS-400-18, but at very low temperatures (−75 °C), fracture initiated around the graphite instead of in Mg-rich inclusions at the grain boundary [31].
For normal ferritic iron, the encountered 673 K embrittlement was shown to be dependent on strain rate, chemical composition and temperature [32,33]. For the low strain rate of 2.8 × 10⁻⁴, the lowest ductility was obtained at 400 °C (673 K), while for a higher strain rate of 1.4 × 10⁻², the lowest ductility was at 500 °C (773 K) [32]. For other ferritic irons tested at low 4.4 × 10⁻⁵ and 8.3 × 10⁻⁵ strain rates, the lowest ductility was obtained at around 400 °C (673 K), but for higher strain rates of 2.0 × 10⁻², the lowest ductility was obtained at around 550 °C (823 K) [33]. Consequently, for normal ferritic irons, the drop below 10% elongation (with intergranular fracture) occurred between 300 °C (573 K) and 500 °C (773 K) for low strain rates of 4.4 × 10⁻⁵ to 2.8 × 10⁻⁴ [32,33]. For high strain rates of 1.4 × 10⁻² and 2 × 10⁻², the drop below 10% elongation (with intergranular fracture) occurred between 400 °C (573 K) and 680 °C (973 K) [31,32].
The 673 K embrittlement was related to the Mg-assisted sulfur segregation. At low temperatures, the mobility of sulfur is too low to cause embrittlement [33]. Above 455 °C it boils, and above 490 °C, the movement of grain boundaries and dislocations is thermally activated [33]. However, any fading of the iron will lead to the dissociation of Mg and S with MgO formation at the grain boundary [33]. If these grain boundary MgOs elucidated by AES are ripened by, e.g., Mg fading through a long holding time, they can alter the fracture mode in HSI from intergranular to radial cleavage [28]. Here, low sulfur contents facilitate higher Mg contents before the onset of 673 K embrittlement, but >0.045% Mg directly leads to 673 K embrittlement. The sum of Mg and 4.5 S < 0.07 also avoided 673 K embrittlement for conventional ferritic iron [34]. For ferritic irons susceptible to 673 K embrittlement with high S and Mg, these survived fewer zero-tension load cycles in low-cycle fatigue than irons alloyed with Ni and Mo alloys along with low Mg and S.
9. Alleviating Intercritical Embrittlement in High Silicon Iron
To restore the mechanical properties at 673 K, a few approaches can be adopted:
Out of these approaches, fast cooling with permanent molds was the only method that avoided 673K embrittlement for EN-GJS-600-10 compositions with more than 4.3% silicon. For HSI poured into permanent molds, elongations above 10% were achieved for 680 °C annealed HSI compositions between 4 and 5% silicon with around 0.15 Mn, 0.065% P, 0.007% S and 0.02% Mg [37]. These properties were attributed to a fineness of the microstructure having a nodule count of >1000/mm2 and compositional homogeneity with low silicon micro-segregation resulting from the rapid solidification. Here, the chemical composition contained 0.02% Mg and 0.06% P, and hypereutectic compositions were used. However, when the annealing temperature was increased to 780 °C, detrimental twinning caused cleavage, indicating that the matrix had transformed to an ordered state. In another metal mold investigation, good microstructures for a 15 mm casting with a startling 5.2% silicon content were achieved [38]. The study also included a phase map that indicated that white formation was avoided with hypereutectic compositions. For ordinary ductile irons cast in a grey iron mold, a preheating temperature of 450 °C was required to avoid shrinkages [39]. These studies suggest that hot shakeout, chills and a minimal use of Mg could be effective for suppressing embrittlement in ordinary HSI.
Exceeding 0.045 Mg has been directly detrimental for GJS-600-10 HSI [23] and sometimes even for GJS-500-14 [18]. For samples having close to GJS-450-18 properties at RT, they all had elongations below 10% when tensile-tested at 400 °C [23]. In the study, micro-shrinkages/micro-voids and inclusions at the cell boundaries all increased once the Mg threshold was exceeded. To counter the effect of these inclusions, P-doping has been patented in USA to bind Mg to clustered inclusions and is effective to a certain degree. It has also been shown that Ce and possibly Mg interact around the primary dendrites in a pioneering radiographic study of Ce141 isotopes in ductile iron [16,17]. However, without Ce and P, it is likely that any metallic Mg in the confined cell boundary that prevails for high silicon contents can suffer internal oxidation when subjected to extended solidification times. Therefore, there is a suggestion to adhere to Mg/P < 1.5 to suppress free Mg in the HSI grain boundaries [6]. However, for conventional irons and HSI, it is vital that P, Mg and S are controlled individually. Internal data (company data) have shown that GJS-600-10 with 15 to 20% elongations is possible if the S content is limited. For HSI with Ce in the inoculant or the treatment alloy, 673K embrittlement occurred [28]. How La nodulizers [3] or La-based inoculant that thins the columnar solidification zone [4] affects 673K embrittlement is unclear. Unfortunately, no clear data were included on the ferrite grain size or grain boundary area and length.
The 30% to 40% cold rolling deformation (area reduction) of the casting after annealing could nearly eliminate intergranular failure around the soft ductile irons with low Mn contents [40]. For this deformation level, elongations between 10 and 15% at 673 K were achieved for HSI with its graphite having an elongated shape factor of 2 [40]. However, for higher Mn contents around 0.3 % and GJS-500-7, only a hot rolling deformation of 30% led to a marginal increase in elongation from 5% to 7% with retained intergranular embrittlement [41].
10. Dross Formation in High Silicon Iron
Dross imperfections can occur for all ductile irons if oxygen interacts with the melt. Using a testing device for dross-generating behavior for iron melts, it could be seen that the Mg level was more significant than the silicon clogging having more than 0.045 Mg suppressed mold filling [42]. Furthermore, the test showed that the 4% Si alloy had “the better” filling behavior than the 2.5% Si alloy in terms of filling speed. Ingate turbulence is very important to suppress in the melt handling since this leads to dross that reduces fatigue strength.
11. Alloying Strategies for High Silicon Iron
The solid solution hardening of Si is limited to around 4.3% [42,43,44]. Around and above this level, the elongation falls sharply. Furthermore, micro-segregation of Si and other alloys in the last-to-freeze areas between two nodules with SEM line scanning revealed elevated Si contents of around 4.5% [45]. The impact of a few alloying additions for GJS-500-14 and GJS-600-10 is summarized in Table 4 and Table 5. For GJS-500-14 in Table 5 [46], it is apparent that the variation in silicon content makes any clear distinctions difficult in discerning the alloying additions, such as Cr, Mn, Mo and Nb or even for P and S. However, up to 4% Co and 3% Ni (Table 4) can be added to HSI without metallurgical risk in HSI [47]. The use of Ni alloying has been successful in increasing the fatigue limit over 200 MPa [47].
For GJS 600-10, the experiments have been repeated and are reported in terms of what systems comply to EN1653 [48]. It is noteworthy that alloying additions like Mo and Cu that stabilized pearlite had elongations of around 17% to 18%. From the preparation of the melt, it is apparent that a quality treatment alloy and inoculant was used with a well-designed mold with a filtered runner system [48,49].
In Table 5, it is evident that 0.4 to 0.5% Cu alloying is successful in achieving both GJS-500-14 and GJS-600-10 properties. For varying section sizes less than 0.22%, Cu should be used to ensure that the pearlite content stays below 5% [50]. Further evidence of the power of pearlite stabilization was elucidated in a study on how chill formation affected the tensile and fatigue properties of GJS-400-18 [51]. Here, GJS-600-10 properties and a fatigue limit in excess of 300 MPa at 107 cycles were achieved for 30 mm wide Y2 blocks. The fracture origins were exclusively graphite clusters or micro-shrinkages with an average size of 189 µm. This was coupled to a nodule count of 120 Nodules/mm2 and a limited graphite diameter below 100 µm. No nodularity evaluation was provided, but about 20% vermicular graphite could be seen from their microstructures. The fatigue limit in excess of 300 MPa was possibly related to well-distributed chill pearlite in the microstructure [51]. This could have been further stabilized by ε-Cu formation that occurs for >0.2% Cu [52]. Here, the solubility of Cu is limited in ferrite and results in a very thin Cu-rich phase with low diffusion permeability for carbon, providing high kinetic stabilization of pearlite.
12. Microcomposite Structurization of Ferrite in High Silicon Iron
The equilibrium conditions that apply for the ferrite when alloyed with silicon are the most overlooked aspects of HSI research. The equilibrium solubility limit for silicon in ferrite is 3 wt% in pure iron, as seen in Figure 4, after which, the thermodynamic activity of carbon in the ferrite decreases [43]. How this reduction in carbon activity affects the diffusion of carbon in BCC in the presence of Si can be found elsewhere [53]. Above 3% Si, spinodal decomposition of the ferrite into conventional ferrite (α-phase) and silicumferrite (α1-phase) was detected in the Fe–Si system almost 40 years ago in 1967 [54] and more recently for Fe-6.7% Si [55]. For HSI, TEM detected that silicumferrite (α1-phase) or B2 phase formation appeared at 3.95% Si and had increased in amount at 5.36% Si where DO3 also domains (α2-phase) appeared (see Figure 4) [45].
Unfortunately, the ordered silicumferrite (α1, even called DO3 [47]) distributed in the ferrite matrix is incredibly small at low silicon levels and requires very high magnification and advanced chemical and thermal etching (see Figure 5) or transmission electron microscopy (TEM) to be elucidated. The implication of the heterogenization of ferrite in silicon cast irons (Fe-Si-C) was discussed in 1978 [54]. In which, it was mentioned that P increased or participated in the heterogenization of ferrite. The greatest embrittlement occurred at 475 °C and was attributed to several “horophyillic” elements at the grain boundaries. “Horophyillic” has never existed in the English language [56], but horopter (a term within optics), where points are considered single [56]. In plain English, these become elements of low solubility in ferrite, which are prone to grain boundary segregation. The combination of having high Si, P and N concentration in ferrite and heat treatment in the region of 450–520 °C was particularly embrittling due to the limited mobility of Si in ferrite at this temperature [54]. At low temperatures, ferrite alloyed with 2–3% Si could be susceptible to binodal separation of the ferrite [54]. For 3.6% Si HSI, the microcomposite structurization of ferrite is affected by over-aging, which leads to silicumferrite (α1) clusters and their twinning at elevated silicon levels in the ferrite close to the graphite nodules. These clusters and their twinning (as seen in Figure 5) should be directly embrittling since they are close to the nodule interface. The 860 °C normalized recrystallized “relief” ferrite has been observed where the silicumferrite (α1) clusters and their twinning has been reduced (seen as dots in Figure 5) in HSI. However, it is uncertain if any established matrix damaging mechanism describes or incorporates the effect of silicumferrite (α1) in the as-cast state or any clustering and their twinning or the effect of recrystallized “relief” ferrite within the ferrite microstructure. Maximum tensile strength occurred at 4.2% Si where the elongation exceeded 10%; then, the microstructure contained 25% silicumferrite (α1) [43]. Thereafter, the tensile properties and the elongations declined, leading to 500 MPa UTS and 4% elongation at 4.8% Silicon. This shows that the elongation degradation at around 4.3% Si reported by Stets et al. in 2013 [42] was already indicated by Silman in 2006 [43].
For different Si concentrations, the spinodal decomposition occurs at different temperatures [44]. To describe this further, phase diagrams, as seen in Figure 4 [44], are helpful. In Figure 4, spinodal decomposition can occur at around 300 °C to 400 °C for 3% to 3.5% silicon, respectively [44]. Here, it is logical to assume that this spinodal decomposition is masked by the shakeout process for as-cast industrially produced GJS-450-18 HSI. However, if these are annealed at around 300–350 °C, then spinodal layering can be detected [44].
For 3.5% to 4.2% silicon, hypereutectoid decomposition of the elevated temperature ferrite (α2-phase even called B2 phase [57]) occurs at 400–500 °C prior to spinodal decomposition of the ferrite with slow cooling. This leads to a microcomposite structure of the ferrite, where the harder Si-rich silicumferrite (α1) rods are around 200–400 nm thick and about 4–5 µm long is enveloping the softer and tougher ferrite (α) [44].
For over 4.2% silicon and slow cooling, the ordered arrangement of phases is violated, and a brittle structure resembling over-aged microstructures results in spherical inclusion clusters that are also twinned [44].
For rapid cooling, a supersaturated ferrite is obtained that is sensitive to aging during annealing [44]. However, with higher temperature normalization, it would seem likely that the supersaturated ferrite is partially or fully recrystallized [43,54], which could lead to a more advantageous microstructural development. However, for ambient cooling, no significant effect on Si micro-segregation is obtained [45]. For hypoeutectic HSI, a heat treatment was effective in refining the HSI structure with annealing in the austenite region (around 900 °C), annealing in the ferrite region (around 750 °C) and aging (around 320 °C) [44]. For eutectic compositions having 4.3% Si, these required annealing in the austenite region (around 1000 °C) and hardening and aging/tempering (around 320 °C) [44]. It is likely that intercritical austempered ductile iron (ADI) and high-temperature ADI heat treatments could also be effective means for microstructural refinement of HSI with Si contents above 4% Si. For grey iron permanent molds and rapid cooling, GJS-450-18, GJS-500-14 and GJS-600-10 were achieved [58]. Generally, several permanent mold materials have been employed to reveal the static properties of HSI [58].
In relation to spinodal decomposition of the ferrite in HSI, this is also affected by Cu and Mo alloying. For Cu alloying, there is an intensification of the spinodal layering of the harder Si-rich silicumferrite (α1) phase and the softer and tougher ferrite (α) as well as the segregation of dispersed copper (ε-phase) [44]. The former mechanism profoundly affects the brittle silicumferrite (α1) phase by copper dissolving into it, and this leads to the formation of (Fe, Cu) 3Si complex compound [44]. This is explained by the similarities of solid solution-based Cu3Si and the solid solution (Fe3Si) silicumferrite (α1) phase. For Mo alloying, its diffusion-suppressing properties increase the formation of dispersed copper (ε-phase), which increases the solubility of Fe in copper, leading to an increased degree of precipitation hardening of the ferrite.
13. Advanced Metallurgy of High Silicon Ductile Iron
The elucidation of the complex HSI microstructure requires more advanced color etching and Electron probe micro-analyzer (EPMA) procedures to fully expose thin films, prior austenite grain boundaries and possible carbide formation [59,60]. The various thin films are inconsistent in appearance depending on their thickness [59]. Very thin films (0–0.04 μm) are transparent, thin films (0.04–0.5 μm) respond differently to color etching and thick films (>0.5 μm) are often unresponsive to color etching or are opaque [59]. The B2 and DO3 phases have been verified with TEM diffraction patterns for 5.3% HSI [47]. However, no images of the microstructure were provided, which makes further analysis difficult.
14. Conclusions
This review has presented various strategies to achieve more stable and predictable mechanical properties in HSI. Three main mechanisms have been identified that lead to brittle failure in high-silicon irons: intercritical embrittlement, the integrity of the ferritic matrix and deformation mechanisms in graphite. Intercritical embrittlement is mainly attributed to the formation of Mg- and S-rich grain boundary films. The formation of these films is suppressed if the amount of free Mg- and MgS-rich inclusions is limited by avoiding excess Mg and/or by the passivation of free Mg with P.
Funding
This research was funded by the Swedish Foundry Association, grant number 2019–2031.
Data Availability Statement
Not applicable.
Conflicts of Interest
The author declares no conflict of interest.
References
- Morino, K.; Nisitani, H.; Nishimura, F. Study on Factors Controlling Low Cycle Fatigue Life. JSME Int. J. Ser. A 1998, 41, 243–251. [Google Scholar] [CrossRef] [Green Version]
- Flinn, R.A.; Reeseand, J.D.; Spindler, W.A. Risering of ductile iron. AFS Trans. 1955, 63, 720–725. [Google Scholar]
- Skaland, T. A new method for chill and shrinkage control in ladle treated ductile iron. Foundry Trade J. 2004, 178, 396–400. [Google Scholar]
- Siclari, R.; Margaria, T.; Berthelet, E.; Fourmann, J.; Koch, M. Micro-shrinkage in ductile Iron/mechanism and solution. In Proceedings of the 66th World Foundry Conference Instanbul, Istanbul, Turkey, 6–9 September 2004; pp. 863–873. [Google Scholar]
- De la Torre, U.; Loizaga, A.; Lacaze, J.; Sertucha, J. As cast high silicon ductile irons with optimised mechanical properties and remarkable fatigue properties. Mater. Sci. Technol. 2014, 30, 1425–1431. [Google Scholar] [CrossRef] [Green Version]
- Kanno, T. Problems and Improvements on the Production of Large Casting with Hi–Si Ductile Iron. Int. J. Met. 2018. [Google Scholar] [CrossRef]
- Hartung, C.; Logan, R.; Plowman, A.; Wilkinson, D.; Hoel, E.G.; Ott, E. Research on Solution Strengthened Ferritic Ductile Iron (SSFDI) Structure and Properties Using Different Treatment and Inoculation Materials. Int. J. Met. 2020, 14, 1195–1209. [Google Scholar] [CrossRef]
- Hammersberg, P.; Hamberg, K.; Borgström, H.; Lindkvist, J.; Björkegren, L.-E. Variation of Tensile Properties of High Silicon Ductile Iron. Mater. Sci. Forum 2018, 925, 280–287. [Google Scholar] [CrossRef] [Green Version]
- Nishi, S.; Kobayashi, T.; Taga, S. The effect of microstructure on the toughness of ferritic nodular cast iron. J. Mater. Sci. 1976, 11, 723–730. [Google Scholar] [CrossRef]
- Menk, W. A New High Strength High Ductile Nodular Iron. Mater. Sci. Forum 2018, 925, 224–230. [Google Scholar] [CrossRef] [Green Version]
- Ikeda, T.; Umetani, T.; Kai, N.; Noda, N.A.; Sano, Y. Strain rate & T insensitiveness of notch-bend strength for high Si ductile cast iron. ISIJ Int. 2016, 56, 868–874. [Google Scholar]
- Ikeda, T.; Umetani, T.; Kai, N.; Ogi, K.; Noda, N.A.; Sano, Y. Influence of %Si, strain rate & T on toughness & strength of SSF D. Mater. Trans. 2016, 57, 2132–2138. [Google Scholar]
- Ikeda, T.; Umetani, T.; Kai, N.; Ogi, K.; Akagi, D.; Noda, N.A.; Sano, Y. Notch strength of high silicon ductile cast iron and wide applicability to structural design (Japanese). Trans. JSME 2017, 83, 1–12. [Google Scholar]
- Ahmad, M.; Lindkvist, J.; Andersson, M. Influence of strain rate on ductile versus brittle fracture for ductile cast iron EN-GJS-500-14 in V-notch three-point bending tests. MATEC Web Conf. 2018, 188, 02019. [Google Scholar] [CrossRef]
- Johnson, W.C.; Kovacs, B.V. The effect of additives on the eutectoid transformation of ductile iron. Metall. Trans. 1978, 9, 219–229. [Google Scholar] [CrossRef]
- Guiva, V.A.; Lyubchenko, A.P.; Mozharov, M.V. Distribution of Cerium in Magnesium Cast Iron. Met. Sci. Heat Treat. 1970, 12, 994–997. [Google Scholar] [CrossRef]
- Spindler, W.A.; Flinn, R.A. Ductile Iron Cerium Distribution Determination by Autoradiographic Technique. AFS Trans. 1962, 86, 1017–1028. [Google Scholar]
- Sofue, M.; Okada, S.; Sasaki, T. High Quality Ductile Cast Iron with Improved Fatigue Strength. AFS Trans. 1978, 86, 173–182. [Google Scholar]
- Iacoviello, F.; di Bartolomeo, O.; di Cocco, V.; Piacente, V. Damaging micromechanisms in ferritic–pearlitic ductile cast irons. Mater. Sci. Eng. 2008, 478, 181–186. [Google Scholar] [CrossRef]
- Di Cocco, V.; Iacoviello, F.; Cavallini, M. Damaging micromechanisms characterization of a ferritic ductile cast iron. Eng. Fract. Mech. 2010, 77, 2016–2023. [Google Scholar] [CrossRef]
- Ghassemali, E.; Hernando, J.C.; Stefanescu, D.M.; Dioszegi, A.; Jarfors, A.E.; Dluhoš, J.; Petrenec, M. Revisiting the graphite nodule in ductile iron. Scr. Mater. 2019, 161, 66–69. [Google Scholar] [CrossRef]
- Lin, H.M.; Lui, T.S.; Chen, L.H. Effect of cyclic heating on ductility deterioration of high silicon ferritic spheroidal graphite cast iron by salt bath. Int. J. Cast Met. Res. 2003, 16, 487–495. [Google Scholar] [CrossRef]
- Cheng, C.P.; Lui, T.S.; Chen, L.H. Effect of Residual Magnesium Content on Thermal Fatigue Cracking Behavior of High-Silicon Spheroidal Graphite Cast Iron. Metall. Mater. Trans. A 1999, 30, 1549–1558. [Google Scholar] [CrossRef]
- Matsushita, T.; Ghassemali, E.; Saro, A.G.; Elmquist, L.; Jarfors, A.E.W. On Thermal Expansion and Density of CGI and SGI Cast Irons. Metals 2015, 5, 1000–1019. [Google Scholar] [CrossRef] [Green Version]
- Jalava, K.; Soivio, K.; Laine, J.; Orkas, J. Effect of Silicon and Microstructure on Spheroidal Graphite Cast Iron Thermal Conductivity at Elevated Temperatures. Int. J. Met. 2018, 12, 480–486. [Google Scholar] [CrossRef]
- Shiao, F.T.; Lui, T.S.; Chen, L.H.; Chen, S.F. Eutectic Cell Wall Morphology and Tensile Embrittlement in Ferritic Spheroidal Graphite Iron. Metall. Mater. Trans. A 1999, 30, 1775–1784. [Google Scholar] [CrossRef]
- Ghassemali, E.; Jarfors, A.E.; Diószegi, A. On the Formation of Micro-Shrinkage Porosities in Ductile Iron Cast Components. Metals 2018, 8, 551. [Google Scholar] [CrossRef] [Green Version]
- Chen, S.F.; Lui, T.S.; Chen, L.H. The effect of phosphorus segregation on the intermediate-temperature embrittlement of ferritic, spheroidal graphite cast iron. Met. Mater. Trans. A 1994, 25, 557–561. [Google Scholar] [CrossRef]
- Chao, C.G.; Lui, T.S.; Hon, M.H. The Effect of Microstructure of Ferritic Spheroidal Graphite Cast Irons on Intergranular Fracture at Intermediate Temperatures. Metall. Trans. A 1989, 20, 431–436. [Google Scholar] [CrossRef]
- Bak, C.; Degois, M.; Schissler, J.M. Scanning Electron Microscope Examination of the Embrittlement of Ferritic Ductile Cast Iron. AFS Trans. 1980, 88, 301–312. [Google Scholar]
- Shiao, F.T.; Lui, T.S.; Chen, L.H.; Song, J.M. The relationship between inclusion clustering and embrittlement of ferritic spheroidal graphite cast iron at intermediate low temperatures. Int. J. Cast Met. Res. 2001, 14, 137–145. [Google Scholar] [CrossRef]
- Yanagisawa, O. Tensile and Fatigue Strength and Fracture of Spheroidal Graphite Cast Iron with Ferritic Matrix in the Temperature Range between Room Temperature and 500 °C. J. Jpn. Foundrymen’s Soc. 1980, 52, 331–336. [Google Scholar]
- Wright, R.N.; Farrell, T.R. Elevated temperature brittleness of ferritic ductile iron. Trans. Am. Foundrymen’s Soc. 1985, 93, 853–866. [Google Scholar]
- Li, D.; Sloss, C. Brittleness at Medium Temperatures of Spheroidal Graphite, Mixed Graphite, and Compacted Graphite High-Silicon Molybdenum Cast Irons. AFS Trans. 2015, 123, 243–253. [Google Scholar]
- Raymond, F.T. Ferritic Ductile Cast Iron for Elevated Temperature Applications; General Electric Company: New York, NY, USA, 1993. [Google Scholar]
- Li, D.; Nelson, L.R. Ferritic High-Silicon Cast Irons; Wescast Ind. Inc.: Stratford, ON, Canada, 2008. [Google Scholar]
- Toshitsugu, O.I.; Minoru, F. Mechanical Properties of Rapidly Solidified High Silicon Ductile Cast Iron of Hypereutectic Composition. J. Jpn. Foundrymen’s Soc. 1981, 53, 233–239. [Google Scholar]
- Ohide, T.; Ohira, G. On the Rapid Cooled Structure of High Silicon Cast Iron. J. Jpn. Foundrymen’s Soc. 1980, 52, 17–21. [Google Scholar]
- Jafar, K.-A.; Behnam, A.-A. Influence of Mold Preheating and Silicon Content on Microstructure and Casting Properties of Ductile Iron in Permanent Mold. J. Iron Steel Res. Int. 2011, 18, 34–39. [Google Scholar]
- Chao, C.G.; Lui, T.S.; Hon, M.H. The Effect of Triaxial Stress Field on Intermediate Temperature Embrittlement of Ferritic Spheroidal Graphite Cast Irons. Metall. Trans. A 1988, 19, 1213–1219. [Google Scholar] [CrossRef]
- Lin, Y.F.; Lui, T.S.; Chen, L.H. Study on the relationship between intermediate-temperature embrittlement and triaxial stress induced by the ellipsoidal graphite in hot-rolled ferritic spheroidal graphite cast iron. Metall. Mater. Trans. A 1995, 26, 1101–1106. [Google Scholar] [CrossRef]
- Stets, W.; Löblich, H.; Gassner, G.; Schumacher, P. Solution Strengthened Ferritic Ductile Cast Iron Properties, Production and Application. Int. J. Met. 2014, 8, 35–40. [Google Scholar] [CrossRef]
- Sil’man, G.I.; Kamynin, V.V.; Kharitonenko, S.A. Effect of silicon on the structure and properties of high-strength spherulitic iron. Met. Sci. Heat Treat. 2006, 48, 268–271. [Google Scholar] [CrossRef]
- Silman, G.I. Special features of microcomposite structurization of ferrite in iron with elevated silicon content. Met. Sci. Heat Treat. 2009, 51, 522–527. [Google Scholar] [CrossRef]
- Franzen, D.; Weiß, P.; Pustal, B.; Bührig-Polaczek, A. Influence of aluminium on silicon microsegregation in solution strengthened ductile iron. Mater. Sci. Technol. 2019, 35, 687–694. [Google Scholar] [CrossRef]
- Riebisch, M.; Weiß, P.; Cremer, C.; Aboulkhair, I.; Bührig-Polaczek, A. Properties and microstructure of copper-alloyed solid solution-strengthened ductile iron. Mater. Sci. Technol. 2018, 34, 725–730. [Google Scholar] [CrossRef]
- Weiß, P.; Tekavčič, A.; Bührig-Polaczek, A. Mechanistic approach to new design concepts for high silicon ductile iron. Mater. Sci. Eng. A 2018, 713, 67–74. [Google Scholar] [CrossRef]
- Doris, C.M. Research of Metallurgical Influences onto Mechanical Properties and Microstructure of Modern Cast Irons with Higher Silicon-Content. Diploma Thesis, Montanuniversität Leoben, ÖGI, Leoben, Austria, 2016. Available online: https://pure.unileoben.ac.at/portal/files/1876268/AC13288838n01vt.pdf (accessed on 6 April 2021).
- Rilwan, O. High Strength Solution-Strengthened Ferritic Ductile Cast Iron. Master’s Thesis, Alto University, Espoo, Finland, 2015. Available online: http://urn.fi/URN:NBN:fi:aalto-201509184417 (accessed on 6 April 2021).
- Riebisch, M.; Sönke, H.G.; Pustal, B.; Bührig-Polaczek, A. Influence of carbide-promoting elements on the pearlite content and the tensile properties of high silicon ssdi ductile iron. Int. J. Met. 2018, 12, 106–112. [Google Scholar] [CrossRef]
- Sameshima, D.; Nakamura, T.; Horikawa, N.; Oguma, H.; Endo, T. The Effects of Fracture Origin Size on Fatigue Properties of Ductile Cast Iron with Small Chill Structures. J. Solid Mech. Mater. Eng. 2009, 3, 440–448. [Google Scholar] [CrossRef] [Green Version]
- Sil’man, G.I.; Kamynin, V.V.; Tarasov, A.A. Effect of copper on structure formation in cast iron. Met. Sci. Heat Treat. 2003, 45, 254–258. [Google Scholar] [CrossRef]
- Simonovic, D.; Ande, C.K.; Duff, A.I.; Syahputra, F.; Sluiter, M.H.F. Diffusion of carbon in bcc Fe in the presence of Si. Phys. Rev. B 2010, 81, 054116. [Google Scholar] [CrossRef] [Green Version]
- Sil’man, G.I.; Zhukov, A.A. Heterogenization of ferrite in silicon cast irons. Met. Sci. Heat Treat. 1978, 20, 541–544. [Google Scholar] [CrossRef]
- Wittig, J.E.; Frommeyer, G. Deformation and fracture behavior of rapidly solidified and annealed iron-silicon alloys. Metall. Mater. Trans. A 2008, 39, 252–265. [Google Scholar] [CrossRef] [Green Version]
- Horopter, N. OED Online. Oxford University Press (Subscription Service). Available online: https://www.oed.com/view/Entry/88545?rskey=I7vLgF&result=2 (accessed on 26 September 2019).
- Hofmann, S.; Lejček, P. Segregation at special grain boundaries in fe-si alloy bicrystals. J. Phys. Colloq. 1990, 51, C1-179–C1-184. [Google Scholar] [CrossRef]
- Riebisch, M.; Seiler, C.; Pustal, B.; Bührig-Polaczek, A. Microstructure of as-cast high-silicon ductile iron produced via permanent mold casting. Int. J. Met. 2019, 13, 112–120. [Google Scholar] [CrossRef]
- Vazehrad, S.; Elfsberg, J.; Diószegi, A. Study of microstructure and silicon segregation in cast iron using color etching and electron microprobe analysis. Mater. Charact. 2015, 104, 132–138. [Google Scholar] [CrossRef]
- Ruxanda, R.E.; Stefanescu, D.M.; Piwonka, T.S. Microstructure Characterization of Ductile Thin Wall Iron Castings. AFS Trans. 2002, 110, 1131–1247. [Google Scholar]
Figure 1.
Impact and elongation with temperature for high silicon iron (HSI). Adapted from [6].
Figure 1.
Impact and elongation with temperature for high silicon iron (HSI). Adapted from [6].
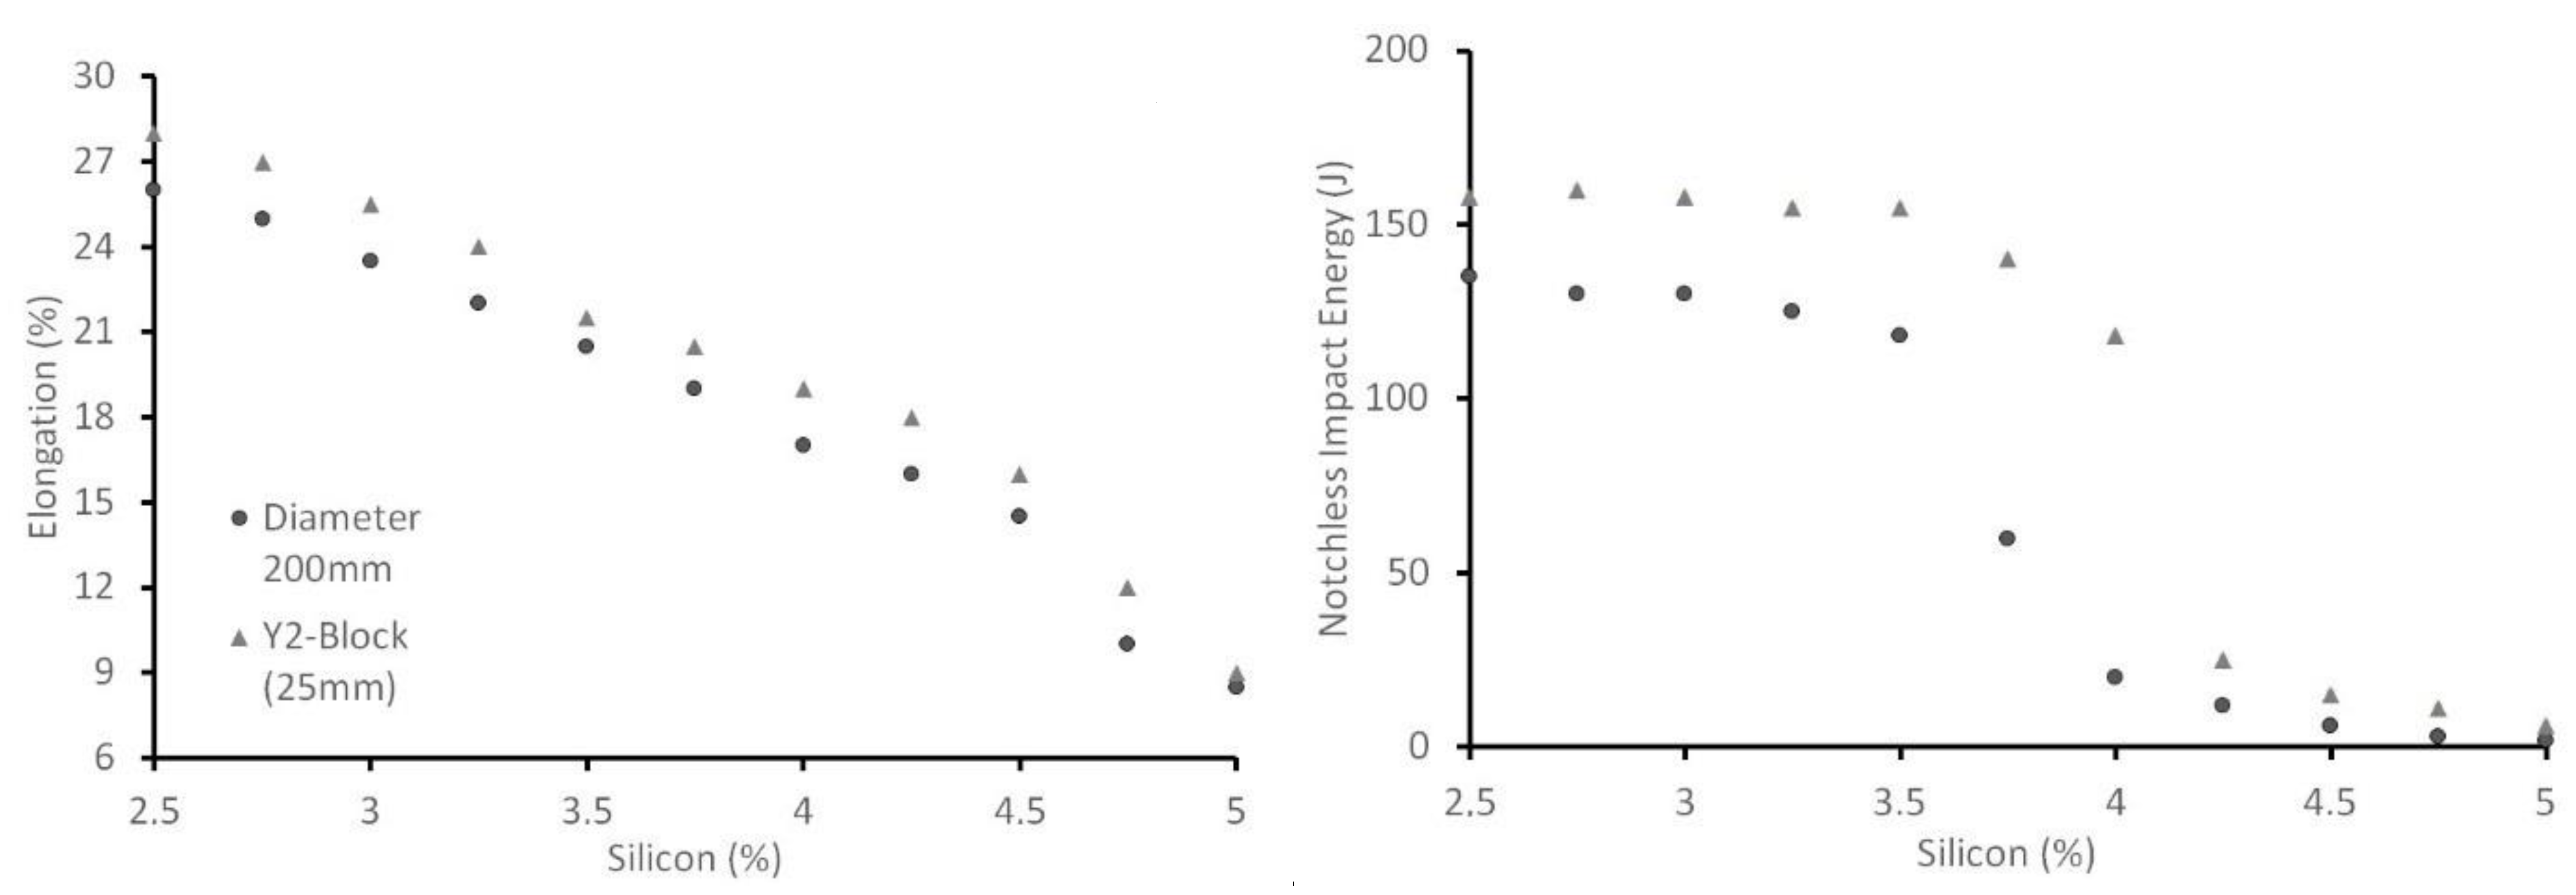
Figure 2.
Elongation with temperature for GJS-500-7 (2.7% Si) and GJS-500-14 (3.7% Si) [26].
Figure 2.
Elongation with temperature for GJS-500-7 (2.7% Si) and GJS-500-14 (3.7% Si) [26].
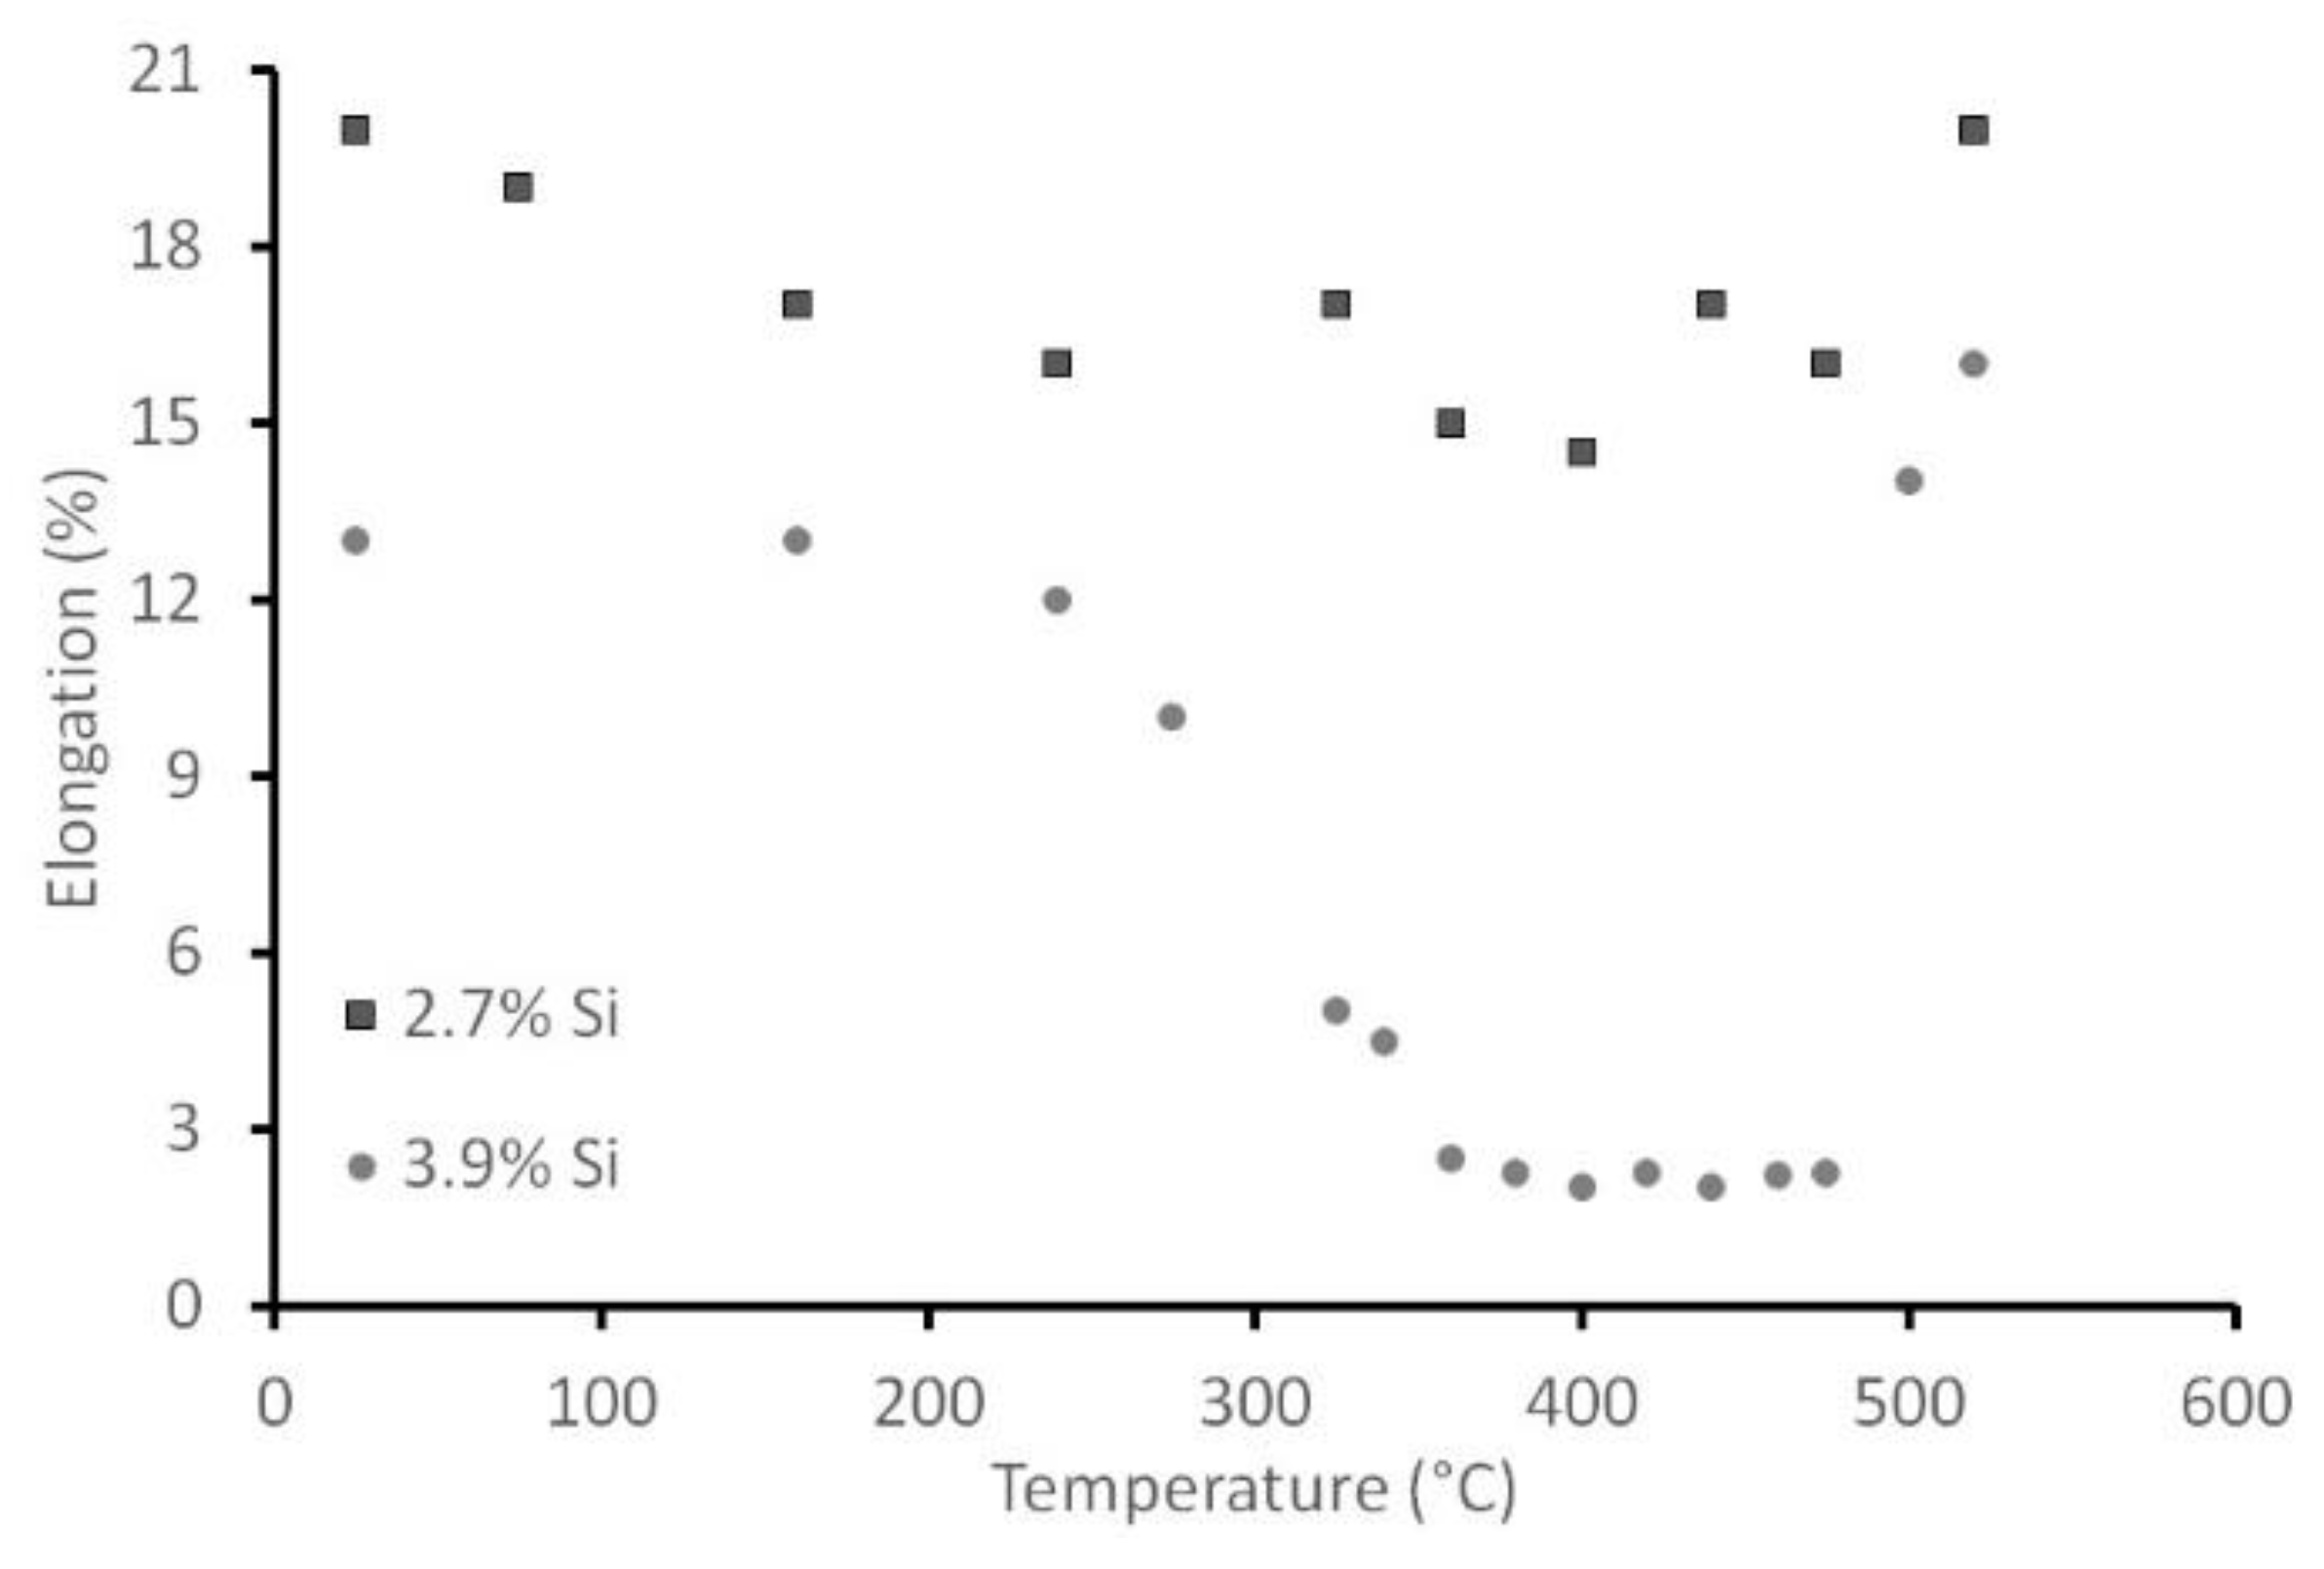
Figure 3.
Elongation at 673 K (400 °C) for different thicknesses and molds. Adapted from [29].
Figure 3.
Elongation at 673 K (400 °C) for different thicknesses and molds. Adapted from [29].

Figure 4.
Phase diagrams for the Fe-Si-C system. Adapted from [54].
Figure 4.
Phase diagrams for the Fe-Si-C system. Adapted from [54].
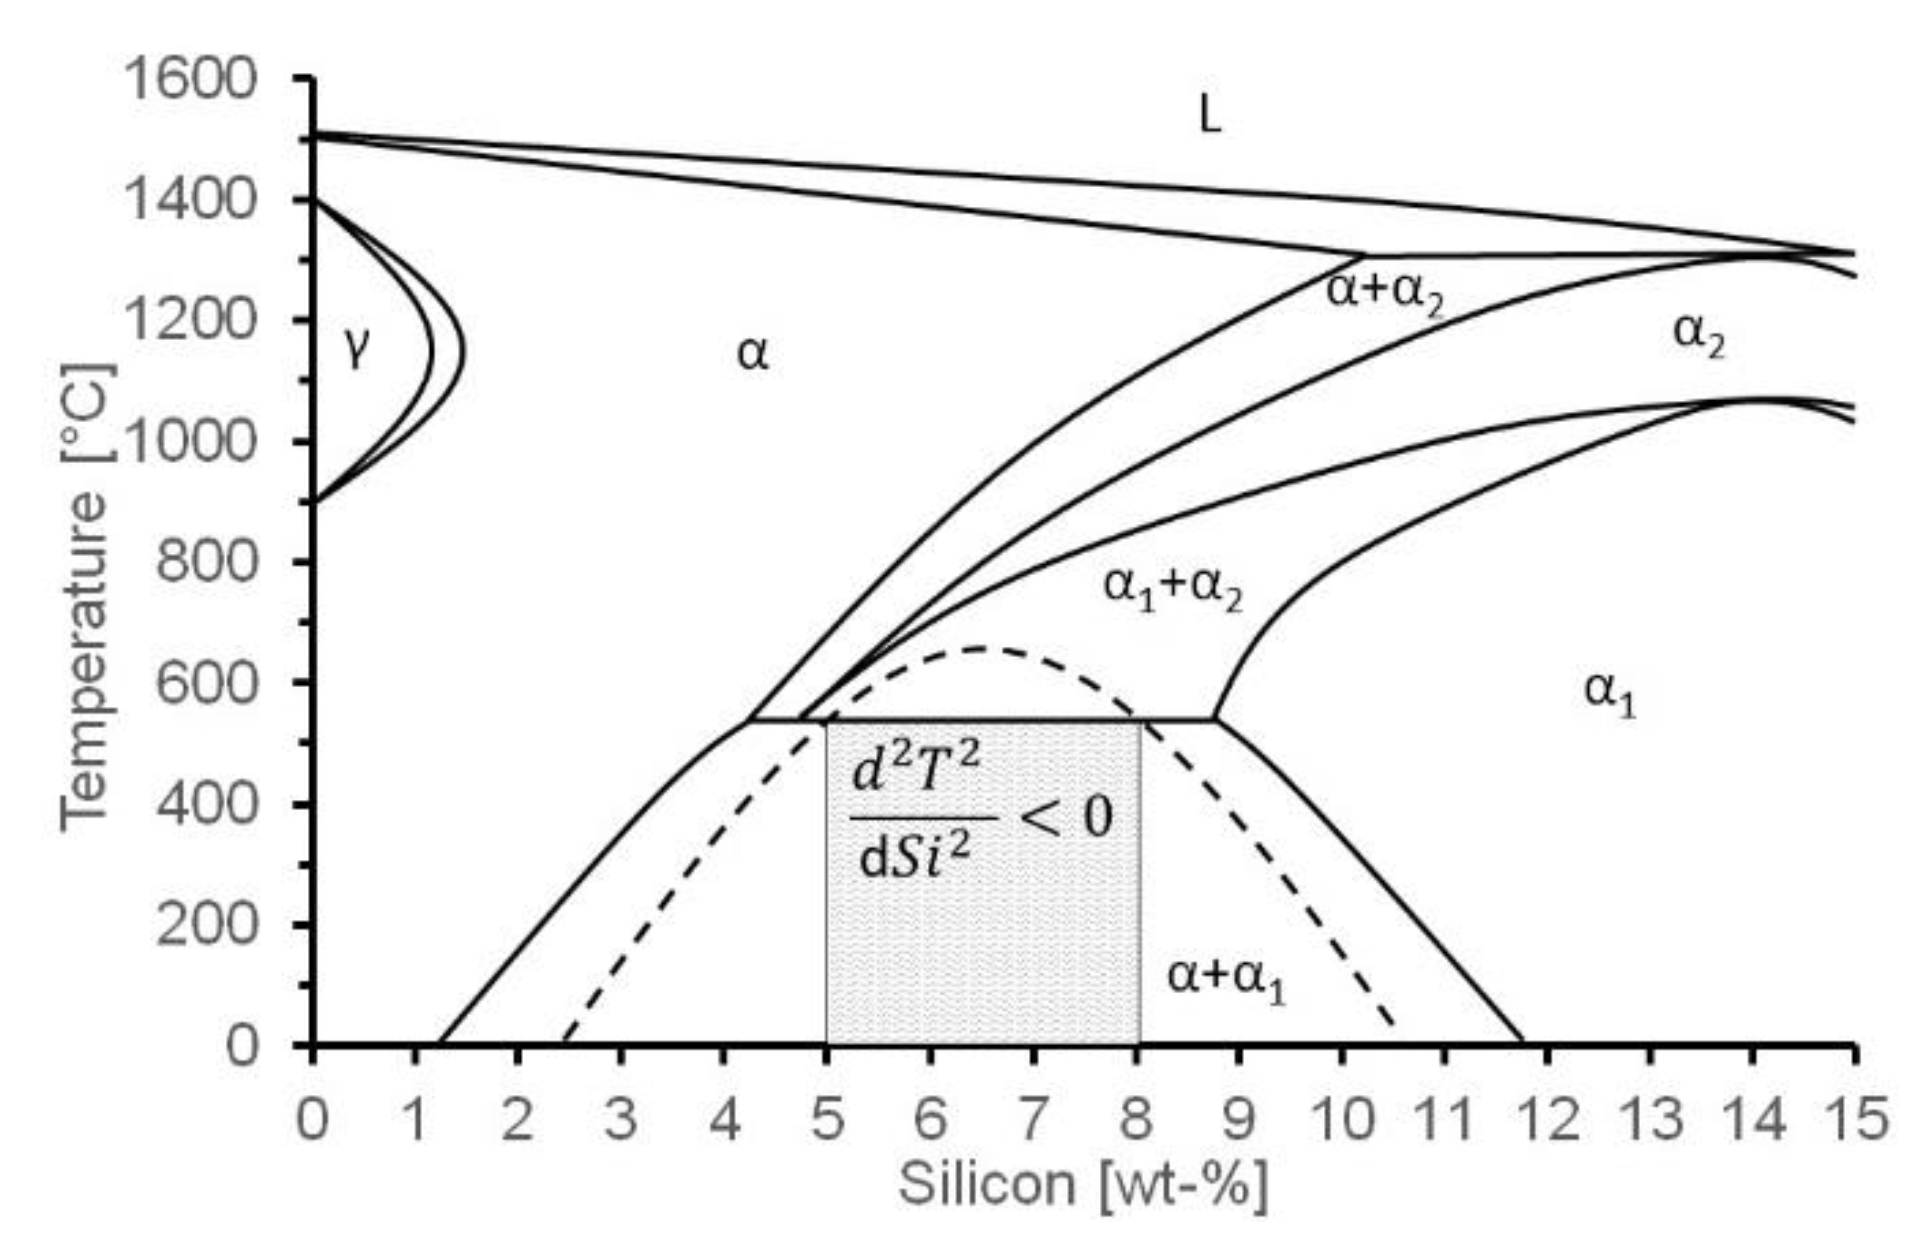
Figure 5.
Ferrite (α) and silicumferrite (α1) layering for 3.7% Si HSI after Kallings etching, inspired from the procedure reported in [54], courtesy of Mattias Lundberg RISE (top). GJS-500-14 HSI etched in 3% nital (typical microstructure of HSI) courtesy of Vasilios Fourlakidis JU (bottom).
Figure 5.
Ferrite (α) and silicumferrite (α1) layering for 3.7% Si HSI after Kallings etching, inspired from the procedure reported in [54], courtesy of Mattias Lundberg RISE (top). GJS-500-14 HSI etched in 3% nital (typical microstructure of HSI) courtesy of Vasilios Fourlakidis JU (bottom).


Table 1.
Compositions subjected to R = 0.1 and 20 Hz loading in push–pull [5].
Table 1.
Compositions subjected to R = 0.1 and 20 Hz loading in push–pull [5].
| ID | C | Si | Mn | P | S | Cr | Ni | Cu | Al | Mg |
|---|---|---|---|---|---|---|---|---|---|---|
| HSI | 3.41 | 3.78 | 0.19 | 0.015 | 0.006 | 0.04 | 0.07 | 0.07 | 0.004 | 0.048 |
| GJS 400-18 | 3.69 | 2.18 | 0.14 | 0.027 | 0.006 | 0.03 | 0.027 | 0.06 | 0.009 | 0.038 |
Table 2.
Different strain rates and R parameters for components. Adapted from [13].
Table 2.
Different strain rates and R parameters for components. Adapted from [13].
| Application | Strain Rate | Temperature | R Parameter |
|---|---|---|---|
| Tensile testing | 10−4 to 10−5 s−1 | RT | 6864 to 8923 |
| Component use | 10−2 s−1 | −20 °C to RT | ~4500 to ~5500 |
| Crash test | 101 s−1 | RT | ~4500 |
| Impact testing | 102 s−1 | −40 °C to RT | 3524 to 4118 |
Table 3.
Eutectic cell wall area & length. Adapted from [26]. GR, Graphite; GB, Grain boundary.
Table 3.
Eutectic cell wall area & length. Adapted from [26]. GR, Graphite; GB, Grain boundary.
| ID | GR Area (%) | Gr Spacing (µm) | Gr Diam. (µm) | Grain Size (µm) | GB Area (µm2) | GB Length (µm) |
|---|---|---|---|---|---|---|
| GJS400-18 | 14.3 | 73.2 | 52.0 | 44.2 | 1130 | 40 |
| GJS500-7 | 13.6 | 70.6 | 40.4 | 40.3 | 7800 | 137 |
| GJS500-14 | 14.8 | 71.2 | 48.2 | 41.2 | 9350 | 167 |
Table 4.
Summary of alloying trails on EN-GJS-500-14. Adapted from [46].
Table 4.
Summary of alloying trails on EN-GJS-500-14. Adapted from [46].
| Type | C | Si | Mn | Mg | Pearlite (%) | Nodularity (%) | Nodules/mm2 | CE | Rp | Rm | A % | Part |
|---|---|---|---|---|---|---|---|---|---|---|---|---|
| 4.0Si | 3.02 | 4.02 | 0.17 | 0.028 | 4.05 | 76 | 415 | 2 | 422 | 548 | 16.85 | Y2 |
| 0.5Mn | 2.95 | 3.82 | 0.52 | 0.045 | 3.93 | 88 | 421 | 6 | 434 | 562 | 16.89 | Y2 |
| 0.3Mo | 2.85 | 4.21 | 0.18 | 0.036 | 3.92 | 90 | 443 | 0.3 | 444 | 574 | 16.2 | Y2 |
| 0.2Nb | 2.89 | 3.88 | 0.19 | 0.04 | 3.88 | 87 | 414 | 0 | 446 | 570 | 17.77 | Y2 |
| 0.1Cr | 2.88 | 4.26 | 0.18 | 0.036 | 3.97 | 87 | 564 | 0.8 | 439 | 565 | 18.31 | Y2 |
| 4.0Si | 3.02 | 4.02 | 0.17 | 0.028 | 4.05 | 72 | 242 | 2.4 | 417 | 539 | 18.45 | Y4 |
| 0.5Mn | 2.95 | 3.82 | 0.52 | 0.045 | 3.93 | 86 | 268 | 4.5 | 427 | 555 | 17.19 | Y4 |
| 0.3Mo | 2.85 | 4.21 | 0.18 | 0.036 | 3.92 | 81 | 261 | 4.6 | 436 | 563 | 13.61 | Y4 |
| 0.2Nb | 2.89 | 3.88 | 0.19 | 0.04 | 3.88 | 83 | 240 | 0 | 439 | 565 | 17.01 | Y4 |
| 0.1Cr | 2.88 | 4.26 | 0.18 | 0.036 | 3.97 | 82 | 361 | 2.6 | 432 | 554 | 15.15 | Y4 |
| 4.0Si | 3.02 | 4.02 | 0.17 | 0.028 | 4.05 | 72 | 136 | 4.4 | 412 | 524 | 12.19 | Cyl. |
| 0.5Mn | 2.95 | 3.82 | 0.52 | 0.045 | 3.93 | 74 | 105 | 6.1 | 419 | 529 | 9.16 | Cyl. |
| 0.3Mo | 2.85 | 4.21 | 0.18 | 0.036 | 3.92 | 68 | 95 | 3.2 | 426 | 532 | 6.93 | Cyl. |
| 0.2Nb | 2.89 | 3.88 | 0.19 | 0.04 | 3.88 | 79 | 106 | 4 | 428 | 544 | 12.52 | Cyl. |
| 0.1Cr | 2.88 | 4.26 | 0.18 | 0.036 | 3.97 | 71 | 159 | 3.9 | 424 | 534 | 10.64 | Cyl. |
CE, Carbon Eqivalent. Rm, Ultimate Tensile Stress. Rp, yield strength. A%, Elongation.
Table 5.
Summary of alloying trails on EN-GJS-600-10. Adapted from [48].
Table 5.
Summary of alloying trails on EN-GJS-600-10. Adapted from [48].
| Type | C | Si | Mn | P | S | Mg | Pearlite (%) | Nodularity (%) | Nodules/mm2 | CEV | Rp | Rm | A% |
|---|---|---|---|---|---|---|---|---|---|---|---|---|---|
| 1.0Co | 3.08 | 4.37 | 0.17 | 0.010 | 0.003 | 0.029 | 0 | 93 | 393 | 4.18 | 498 | 630 | 15 |
| 2.0Co | 3.07 | 4.22 | 0.17 | 0.011 | 0.004 | 0.031 | 4.5 | 97 | 314 | 4.13 | 486 | 623 | 17.3 |
| 0.5Mn | 3.06 | 4.36 | 0.46 | 0.005 | 0.006 | 0.041 | 0 | 98 | 420 | 4.15 | 501 | 628 | 17.2 |
| 1.0Mn | 3.05 | 4.31 | 0.88 | 0.004 | 0.008 | 0.038 | 2.2 | 98 | 283 | 4.13 | 503 | 629 | 17 |
| 1.0Ni | 3.02 | 4.16 | 0.11 | 0.007 | 0.007 | 0.032 | 0.6 | 75 | 281 | 4.06 | 480 | 602 | 11.8 |
| 1.3Ni | 3.01 | 4.36 | 0.12 | 0.004 | 0.007 | 0.038 | 0.9 | 97 | 383 | 4.1 | 524 | 677 | 13.7 |
| 0.03P | 3.1 | 4.29 | 0.38 | 0.032 | 0.01 | 0.04 | 0.4 | 98 | 264 | 4.19 | 497 | 616 | 17.7 |
| 0.5Cu | 2.99 | 4.26 | 0.13 | 0.015 | 0.003 | 0.035 | 0 | 97 | 379 | 4.06 | 502 | 620 | 17.8 |
| 0.7Cu | 3.11 | 4.26 | 0.26 | 0.034 | 0.007 | 0.038 | 9.1 | 99 | 271 | 4.19 | 418 | 632 | 14.6 |
| 0.5Mo | 2.96 | 3.95 | 0.12 | 0.006 | 0.005 | 0.039 | 6.9 | 96 | 329 | 3.95 | 492 | 591 | 17.3 |
| 1.0Mo | 3.12 | 3.93 | 0.11 | 0.006 | 0.006 | 0.037 | 18 | 98 | 267 | 4.11 | 464 | 600 | 15.9 |
| 0.4Cu | 2.79 | 4.32 | 0.17 | 0.043 | 0.011 | 0.033 | 17 | 80 | 404 | 3.89 | 454 | 596 | 18.4 |
| 4.4Si | 2.79 | 4.37 | 0.11 | 0.027 | 0.011 | 0.033 | 0 | 80 | 230 | 3.9 | 505 | 612 | 13.6 |
| 4.3Si | 2.74 | 4.39 | 0.29 | 0.018 | 0.003 | 0.03 | <2 | 86 | 286 | 3.96 | 498 | 612 | 17.8 |
| 2.0Co | 2.7 | 4.38 | 0.29 | 0.017 | 0.003 | 0.03 | <4 | 88 | 352 | 3.96 | 510 | 649 | 19 |
| 4.0Co | 2.65 | 4.36 | 0.30 | 0.016 | 0.002 | 0.03 | <4 | 88 | 392 | 3.96 | 525 | 686 | 19.5 |
CE, Carbon Eqivalent. Rm, Ultimate Tensile Stress. Rp, yield strength. A%, Elongation.
Publisher’s Note: MDPI stays neutral with regard to jurisdictional claims in published maps and institutional affiliations. |
© 2021 by the author. Licensee MDPI, Basel, Switzerland. This article is an open access article distributed under the terms and conditions of the Creative Commons Attribution (CC BY) license (https://creativecommons.org/licenses/by/4.0/).
Share and Cite
MDPI and ACS Style
Borgström, H. Influence of Strain Rate, Temperature and Chemical Composition on High Silicon Ductile Iron. Minerals 2021, 11, 391. https://doi.org/10.3390/min11040391
AMA Style
Borgström H. Influence of Strain Rate, Temperature and Chemical Composition on High Silicon Ductile Iron. Minerals. 2021; 11(4):391. https://doi.org/10.3390/min11040391
Chicago/Turabian StyleBorgström, Henrik. 2021. "Influence of Strain Rate, Temperature and Chemical Composition on High Silicon Ductile Iron" Minerals 11, no. 4: 391. https://doi.org/10.3390/min11040391
Note that from the first issue of 2016, this journal uses article numbers instead of page numbers. See further details here.