Abstract
This research aimed to optimize the experimental conditions of biodesulfurization of sulfide ore and to evaluate the flame-retardant effect after desulfurization under optimal conditions. Six experimental factors were determined: particle size of ore sample, ambient temperature, rotary speed of the shaking table, volume of bacteria liquid, concentration of leaching aid (Tween80), and pH value of acidizing ore sample. Desulfurization efficiency was used as the main characterization index of the desulfurization effect in optimization studies. Particle size of ore sample, rotary speed of the shaking table, and volume of bacteria liquid inoculated were selected as significant factors by a Plackett–Burman experiment. Modeling, optimization, and analysis of the interactive effects of these factors, notably between particle size and bacteria liquid, were performed using a Box–Behnken design with response surface methodology. The optimum operating conditions were found to be: particle size of 120 to 140 mesh, rotary speed of 175 rpm, and bacteria liquid of 111 mL. Under these conditions, a significant rise of 8.1% was seen in 5-day average desulfurization efficiency. The 5-day oxidation weight gain rate of desulfurized ore was 2.73%, while that of the control group was 4.78%. The results show that, after optimized desulfurization, the surface oxidizability and spontaneous combustion tendency of the ore are reduced.
1. Introduction
Copper, nickel, lead, and other precious metals can be mined from sulfide ores. Sulfide ore oxidizes and produces heat because of its interactions with oxygen. As the heat produced by oxidation of the ore pile is greater than the heat radiated externally, the stored heat causes the temperature of the accumulated sulfide ore to eventually rise. There is spontaneous combustion in the sulfide ore when the temperature exceeds the ignition point [1,2]. The physicochemical processes of thermal runaway, which occur due to the accelerating oxidation reaction of sulfide ore and oxygen in the air even under atmospheric conditions, are referred to as “spontaneous combustion of sulfide ore stockpiles” [3]. Previous studies have reported that there are spontaneous combustion risks in about 20–30% of pyrite and 5–10% of nonferrous metal or polymetallic sulfide mines in China [4,5], and many metal mining areas have been harmed by the spontaneous combustion of sulfide ore [6,7]. One of the most common mine hazards is fire caused by spontaneous combustion of sulfide ore, which not only leads to considerable economic loss but also puts underground workers’ lives in danger [8,9,10]. As a result, there is a growing focus on research into developing methods to investigate spontaneous combustion disasters. Some progress has been made so far in the research areas of the process, propensity estimation, and prevention of spontaneous combustion of sulfide ores [2,11,12,13,14,15]. The spontaneous combustion of sulfide ore must satisfy three elements: spontaneous combustion tendency, sufficient oxygen supply conditions, and heat gathering environment [16]. At present, the mainstream flame-retardant technology for sulfide ore mainly solves the latter two elements, such as using ventilation technology to improve the heat dissipation efficiency of ore piles and spraying the surface of ore piles with an inhibitor (which consists of foaming agent, foam-stabilizing agent, gelling agent, and cross-linking agent in gel foam materials [17]) to isolate oxygen. Froth flotation has been used to reduce the sulfur contents of tailings [18]. It has been proven that it is feasible to reduce the spontaneous combustion tendency of sulfide ore through microbial desulfurization. Biodesulfurization technology can overcome the disadvantages of other technology, such as by its simple operation, cheap raw materials, mild reaction conditions, and less environmental pollution. Moreover, its application is suitable in a more diverse working environment.
Microbial desulfurization technology has been widely used in the fields of petroleum desulfurization [19], biogas desulfurization [20], and coal desulfurization [21] to reduce the emission of SO2 and the environmental impact. However, research on the microbial desulfurization law and desulfurization effect optimization of sulfide ores is still lacking. Therefore, further research is required not only to promote biological flame-retardant methods for sulfide ores but also to generate some new ideas for relevant research fields in the prevention of sulfide ore spontaneous combustion. Bacterial strains such as Acidithiobacillus ferrooxidans and Acidithiobacillus thiooxidans have been used in bioleaching over the years, and they have made significant contributions [22]. Owing to their success in the field of bioleaching, they are currently utilized in the field of ore desulfurization, which not only reduces the spontaneous combustion tendency of raw ore but also reduces the generation of acid mine water in contaminated mines. In the field of sulfide ore biodesulfurization, some researchers separated pyrite and chalcopyrite from quartz and calcite after interaction with bacterial cells and bacterial biomass [23] and explored the effect of pH buffers on microbial desulfurization efficiency [24]. Previous studies have reported on the use of surfactants to enhance the desulfurization effect, promote contact between bacteria and the ore, and improve the leaching of sulfide ores [25]. At present, most of the microorganisms used in ore leaching are autotrophic bacteria, which only need simple inorganic materials, eliminating the need for complex organic matter in the leaching process. Among the main microorganisms used in ore desulfurization are Thiobacillus thiooxidans, Thiobacillus ferrooxidans, Acidithiobacillus caldus, and Sulfolobus acidocaldarius.
Response surface methodology (RSM) is a visual, nonlinear, and multivariable optimization method based on the multiple regression method, combining specific statistical methods to solve nonlinear and multivariable problems and provide visual analysis results. It is a commonly used tool in the fields of environmental engineering, food chemistry, mechanical engineering, and biological science, which aids researchers in total device optimization and optimal product design at the level of experimental variables. In this experiment, RSM was used to optimize the desulfurization process of sulfide ore, which ensured the simplicity and accuracy of model parameter calculation within a limited time. By this methodology, the regression equation of each factor and response value can be obtained, the relationship between each factor can be visualized, and high-order design and simulation can be carried out step by step, which has advantages in optimizing test conditions.
The above is also the key problems that this article will focus on. Therefore, pyrite was used as an experimental material in this study. Firstly, a Plackett–Burman experimental design was used to screen out the significant factors affecting microbial desulfurization; secondly, the best factor level combination was found by a Box–Behnken experimental design; finally, a microbial sulfur leaching test was carried out with the optimized combination or non-optimized combination, and then an oxidation weight gain experiment was carried out on the sulfide ore after desulfurization. The above three experiments verify the accuracy of the experimental conclusions of this article. This research has important theoretical significance and lays a foundation for subsequent practical applications.
2. Materials and Methods
2.1. Sources of Ore Samples
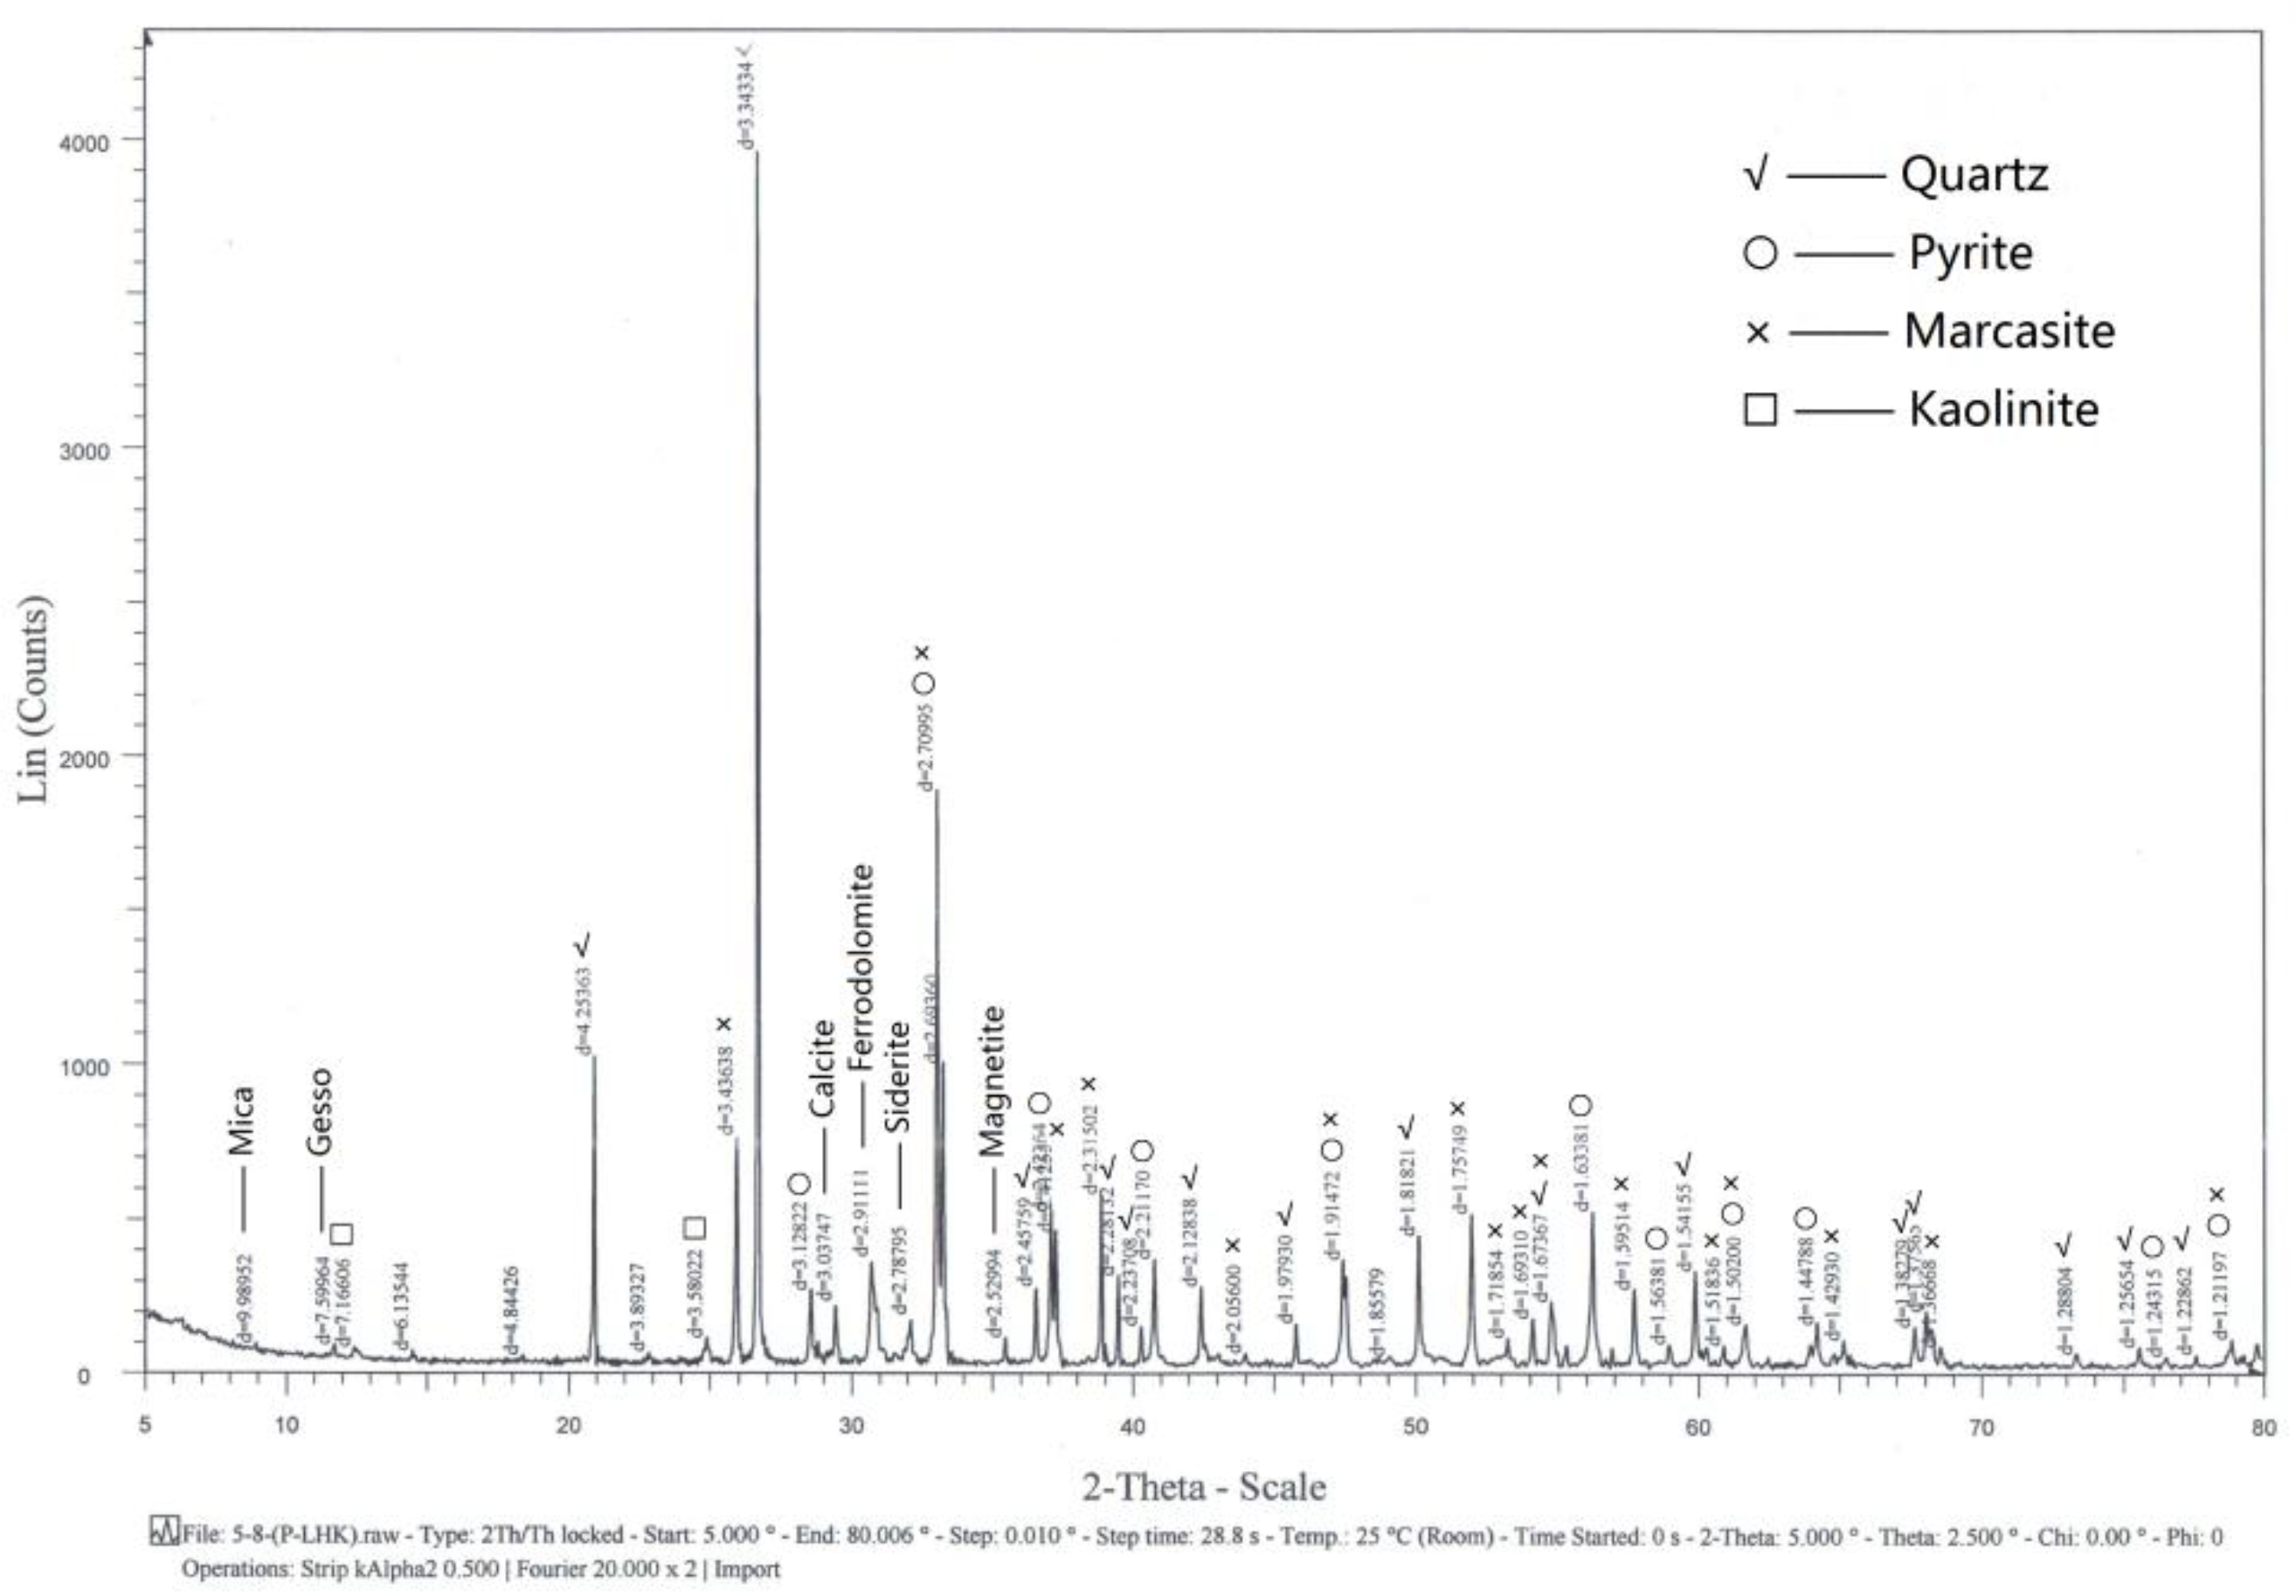
The ore samples used in this study were collected from Tongshan, Anhui Province. The Tongshan deposit is a medium ore-body, which is an Fe-Cu-Au-Ag polymetallic skarn deposit. The ore types of the mining area are mainly copper-bearing pyrite and copper-bearing magnetite. Since the 1990s, many cases of accidents due to spontaneous combustion of sulfide ore have been reported, which have resulted in the waste of ore resources and economic losses. The samples were characterized by X-ray diffraction. The results in Figure 1 show that their main components were pyrite, marcasite, quartz, calcite, kaolinite, mica, gesso, ferrodolomite, siderite, and magnetite.
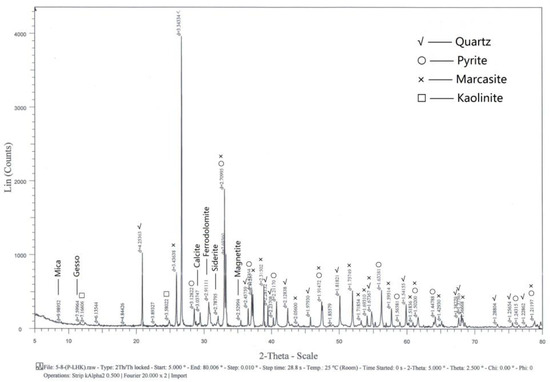
Figure 1.
XRD patterns of the ore samples.
2.2. Bacteria and Media
The primary strain for the experiment was Acidithiobacillus caldus, which was obtained from School of Minerals Processing and Bioengineering, Central South University. The medium used to cultivate and domesticate the bacteria was a 9K liquid medium, which included 3 g (NH4)2SO4, 0.1 g KCl, 0.5 g K2HPO4, 0.5 g MgSO4·7H2O, and 0.1 g Ca(NO3)2. Ten percent of the bacteria were inoculated, and 2 g of sulfide mineral powder was added to every 100 mL medium and incubated at 45 ℃ for 7 days until the bacteria count was 5.35 × 10⁷ cells/mL. All chemicals were of analytical grade.
2.3. Analytical Techniques
The total sulfur concentration in the solution was determined by Inductively Coupled Plasma Optical Emission Spectrometry (ICP-OES), and the desulfurization effect was determined by 5-day average desulfurization efficiency (mg/d), which was calculated by Formula (1).
The standard curve of sulfur was established before sample determination. According to the measuring range of the instrument, six points were set on the standard curve: 0, 20, 40, 60, 80, and 100 mg/L, and the correlation coefficient of the linear regression equation of the curve was above 0.999. To eliminate contaminants in the solution, all test samples were centrifuged at 8000 rpm for 5 min, and the supernatant was obtained, followed by a 100-fold dilution. All experiments were carried out in triplicate, and arithmetic averages were used throughout the data analysis and calculations.
𝑃𝑖 = (𝛼𝑖 − 𝛼0)/𝑖 × V
In this formula:
- 𝑃𝑖 = the desulfurization efficiency on day 𝑖, in mg/d;
- 𝑖 = reaction days, in d;
- 𝛼𝑖 = sulfur concentration in bacteria solution after 𝑖 days of desulfurization, in mg/L;
- 𝛼0 = sulfur concentration in bacteria solution before desulfurization, in mg/L; and
- V = volume of desulfurization solution, in L.
2.4. Optimization of Microbial Desulfurization of Sulfide Ore
2.4.1. Plackett–Burman Design
A Plackett–Burman design was used to determine the significant factors that influence the desulfurization effect. The six experimental factors selected were particle size of ore sample, ambient temperature, rotary speed of the shaking table, volume of bacteria liquid, concentration of leaching aid, and pH value of the acidizing ore sample. In our previous study, different types of leaching aid were compared, and Tween80 proved to be the best [25]. Therefore, Tween80 was chosen as the leaching aid in this experiment. Each variable was assessed at two coded levels, −1 or +1, as shown in Table 1. According to the experimental design, 20 g of ore sample was taken for acidification treatment to reduce the surface pH. After standing for an hour, the upper acid solution was extracted and the ore samples were dried at room temperature. After that, the desulfurizing solution was prepared by mixing the cultured bacteria solution with a 9K medium at a ratio of 1:1 and leaching aid added. Then, 20 g of ore was mixed with the desulfurization solution and put onto a shaking table with the corresponding temperature and speed for five days. At the beginning and end of desulfurization, a small amount of medium was taken to determine the sulfur concentration.

Table 1.
Two levels of each variable.
2.4.2. Response Surface Methodology Analysis
According to the significant factors found in the Plackett–Burman design, five groups of the steepest climbing tests were designed to obtain the best value range and center point of significant factors to ensure the effectiveness of the fitting method.
As per the three significant factors and center points identified by the above experiments, a Box–Behnken design of three factors and three levels (−1, 0, +1) was further carried out. We conducted 15 experimental designs generated by Design-Expert. The results obtained were used to evaluate the optimized condition of the sulfur removal.
2.5. Verification Experiment of Microbial Leaching Flame Retardancy
The spontaneous combustion tendency of sulfide ore was identified by the oxidation weight gain to verify whether the optimized conditions reduce the spontaneous combustion tendency of sulfide ore. The oxidation weight gain rate of sulfide ore in 5 days was used as an index to measure the spontaneous combustion tendency of ore samples at ambient temperature.
2.5.1. Bioleaching Experiment
Three groups were set up for the experiment; the optimization group (Group 1), the non-optimization group (Group 2), and the control group (Group 3). In the optimization group, conditions were set based on the optimization results of the previous experiment; in the control group, the bacteria liquid was changed to an equal amount of ultrapure water, and samples were placed on the same shaker table for five days. Each group was replicated five times to determine desulfurization efficiency and surface desulfurization rate.
2.5.2. Oxidation Weight Gain Experiment
Three groups comprising dried ore samples and untreated ore samples (the fourth group) were weighed. Then, 50 g of each was evenly spread onto petri dishes with a diameter of 7.5 cm and incubated at a constant temperature of 40 ℃ and the humidity set at 90% for 5 days. The quality of each group of ore samples was weighed and recorded every 12 h. Triplicate samples were taken for the measurements of oxidation weight gain rate.
The calculation of oxidation weight gain rate of ore samples is given in Formula (2).
𝑃𝑖 = ∆W/W0 = (Wi − W0)/W0 × 100%
In this formula:
- Pi = the oxidation weight gain rate on day i, in %;
- ∆W = the added weight on day i, in g;
- Wi = the ore sample weight on day i, in g; and
- W0 = the initial weight of ore sample, in g.
3. Results
3.1. Optimization Results of Microbial Desulfurization Process for Sulfide Ore
3.1.1. Plackett–Burman Experimental Design and Results
A Plackett–Burman experimental design with 12 runs and 11 factors was selected (Table 2). In the table, A–F represent experimental factors listed in Table 1 while G–K represent blank items.

Table 2.
Design matrix for desulfurization factors and corresponding responses from the experiment.
The above data were imported into Design-Expert for notability analysis. The analysis of variance (ANOVA) results of the experiment are shown in Table 3.

Table 3.
Model summary statistics for quadratic model of 5-day average desulfurization efficiency (R1).
The p-value of the model was less than 0.05, which indicated that the fitting of the model was reliable. The F value and p-value of the factors in the Plackett–Burman experiment are as shown in Table 3. The importance of the experimental factors was ranked as A > C > D > F > E > B, and significance levels (α = 0.05 and p < 0.05) were taken as criteria for significant factors. A (particle size of ore sample), C (rotary speed of the shaking table), and D (volume of bacteria liquid) were selected for optimization.
Our results showed that the factors and response value (R1) were fitted. The 5-day average biodesulfurization efficiency with independent factors was measured using Formula (3).
R1 = 26.80551 + 8.59692A + 1.07841B + 7.79959C + 6.54156D + 1.26975E − 5.79084F
3.1.2. Design and Results of the Steepest Climbing Test
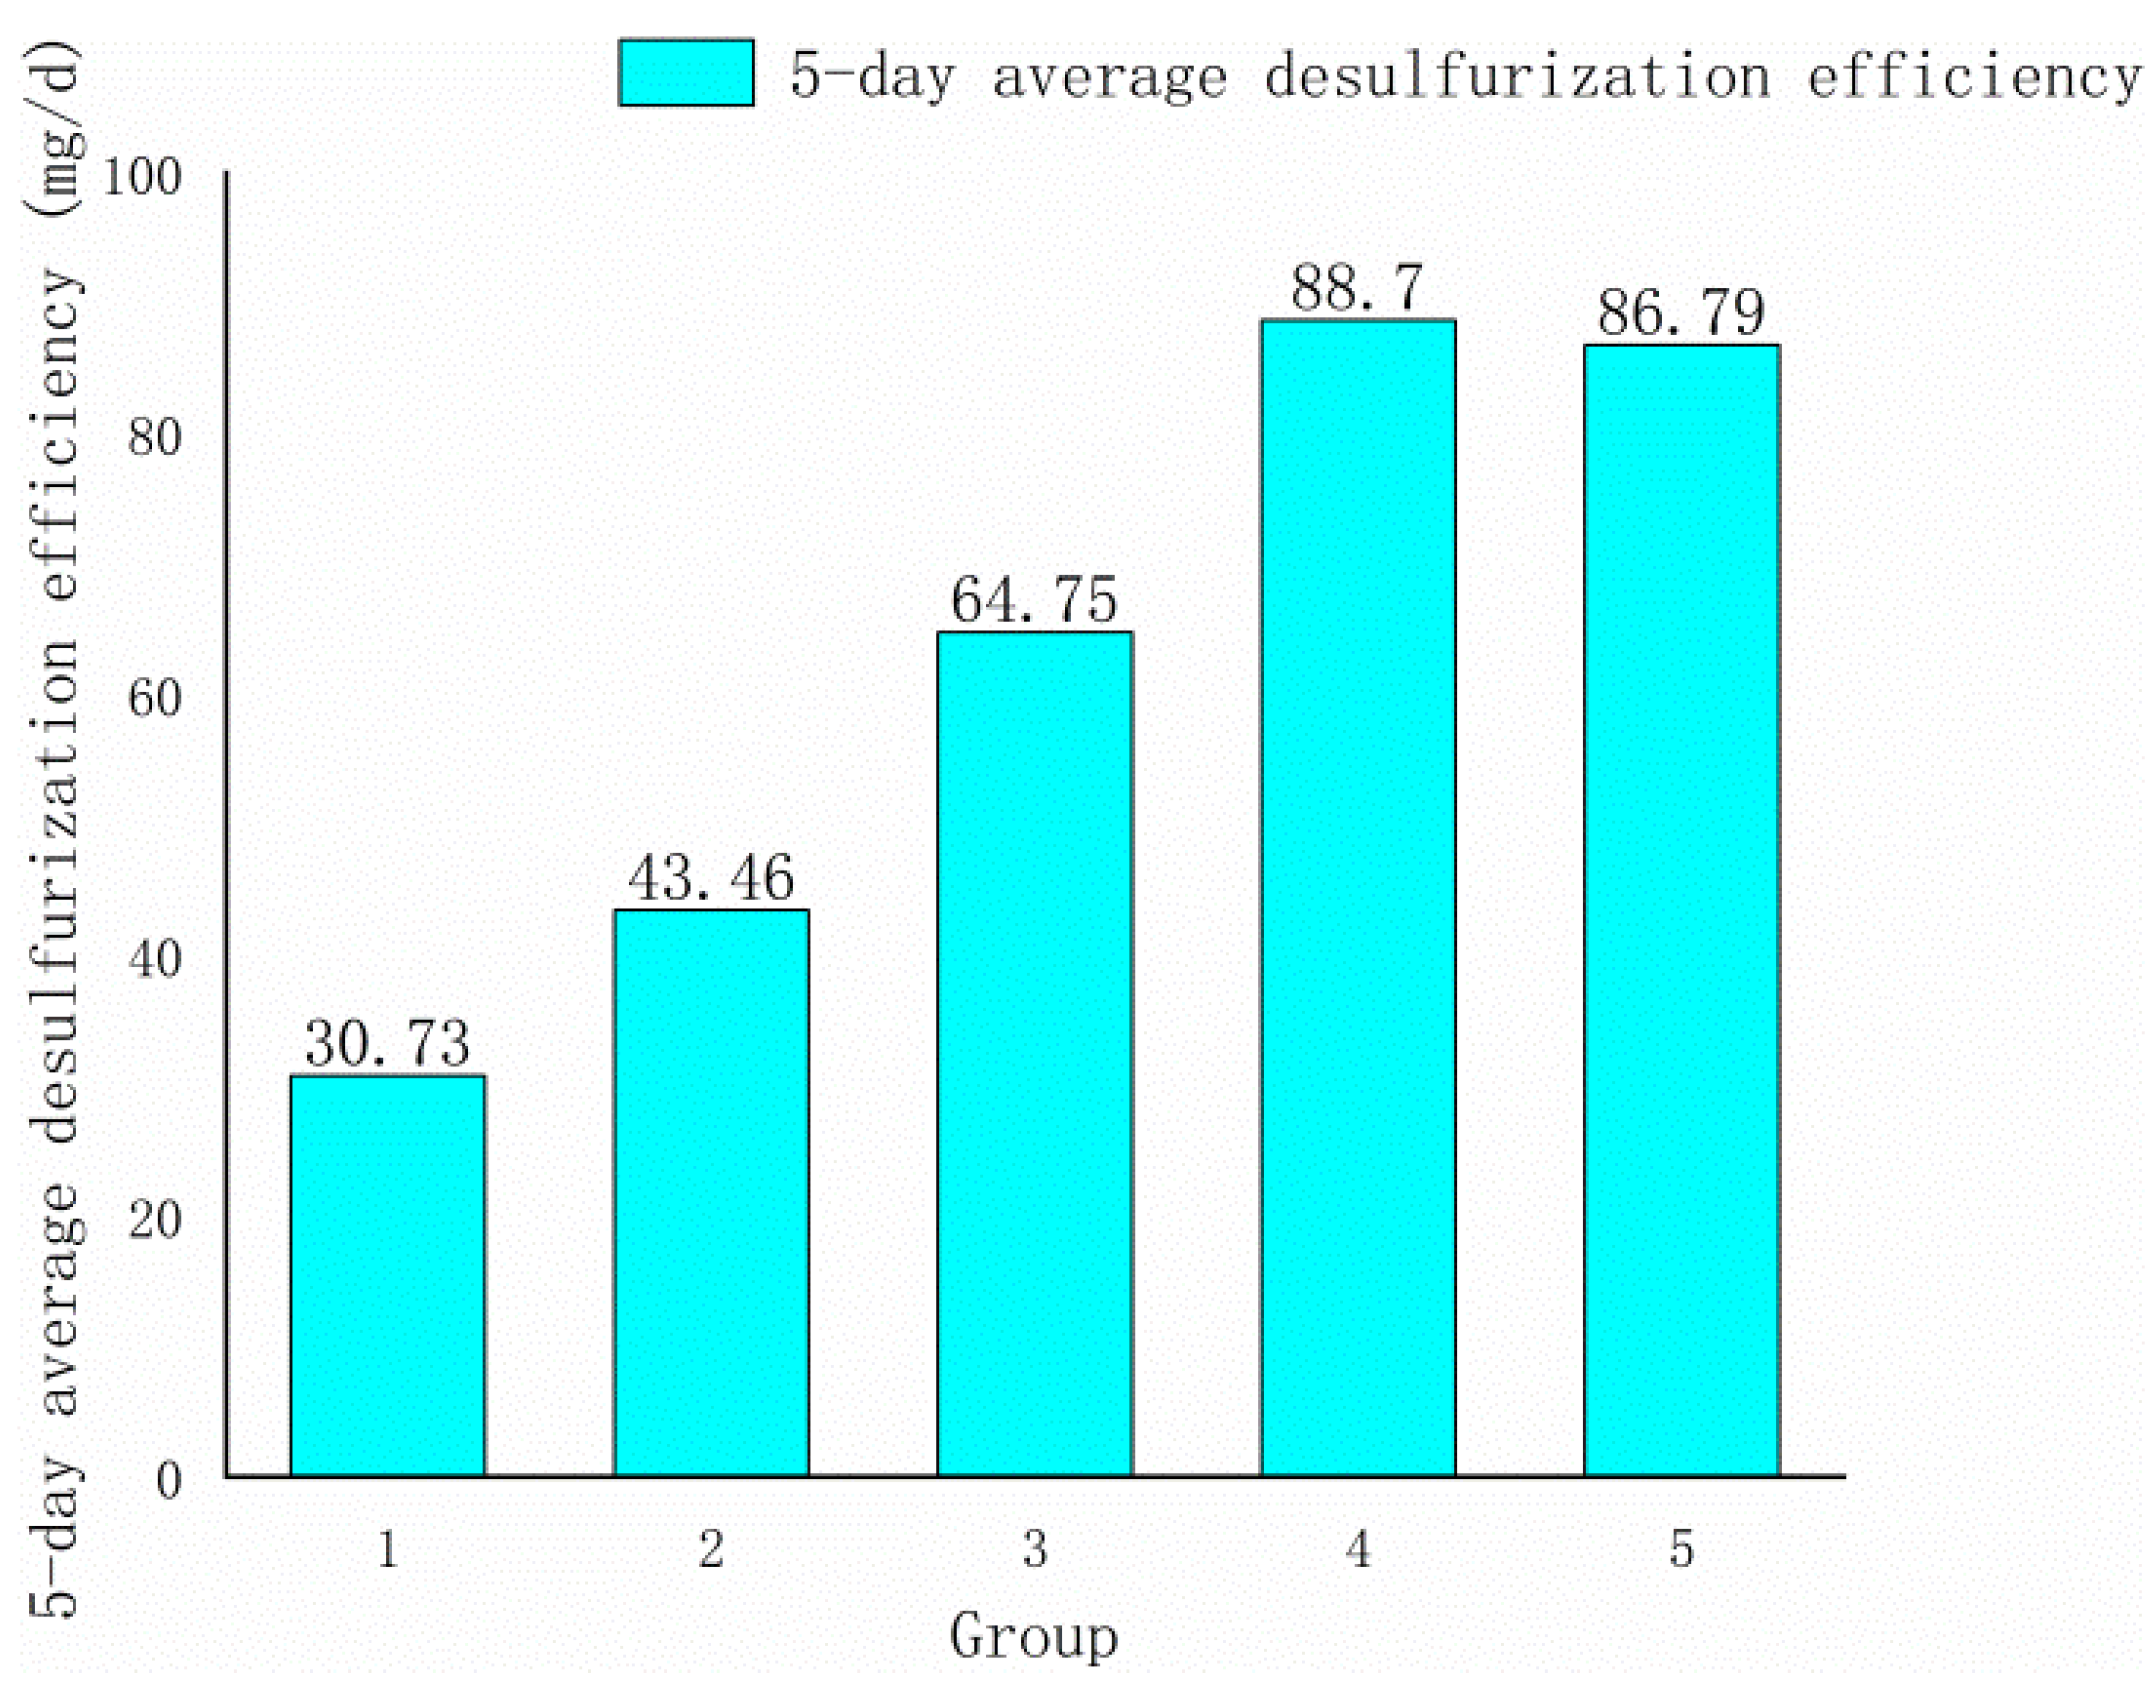
Factors A, C, and D all had positive effects on response value, according to Formula (3). As a result, the climbing directions of these three variables were positive in the steepest climbing experiment, and their levels steadily increased. The ore sample particle size phase length was set to 20 mesh, the rotation speed was set to 10 rpm, and the bacteria liquid volume was set to 10 mL based on the impact value. The experimental design and result are as shown in Table 4 and Figure 2.

Table 4.
The steepest climbing test results.
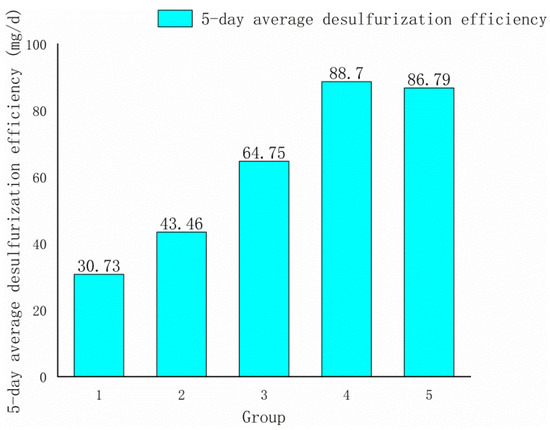
Figure 2.
Histogram of the steepest climbing test results.
3.1.3. Box–Behnken Design
As shown in Figure 2, the fourth group’s 5-day average desulfurization efficiency was the highest, hence the fourth group’s condition was selected as the response surface’s center point. The levels of the central point were set as follows: the particle size of the ore sample was 120–140 mesh, the shaker rotation was 170 rpm, and the bacteria liquid volume was 110 mL.
Three levels of −1, 0, and +1 were set for the three factors, among which the zero level (0) was set according to the center point of the response surface. The Box–Behnken experimental level design is shown in Table 5.

Table 5.
Levels of different process variables in coded and uncoded form for biodesulfurization.
We set blocks = 1 and runs = 15 and took the 5-day average desulfurization efficiency as response value R1. The design and results of the Box–Behnken experiment are as shown in Table 6.

Table 6.
Experimental conditions of Box–Behnken design for biodesulfurization.
Fitting of Quadratic Model and Design of Experiment
Using the above data for model fitting analysis, the multiple quadratic regression equation of the response value and these three factors was obtained as follows.
R1 = 105.69144 + 7.32937A + 6.47691C + 0.68650D − 0.45338AC − 1.40323AD + 0.52935CD − 15.01851A2 + 0.89353C2 − 2.25202D2
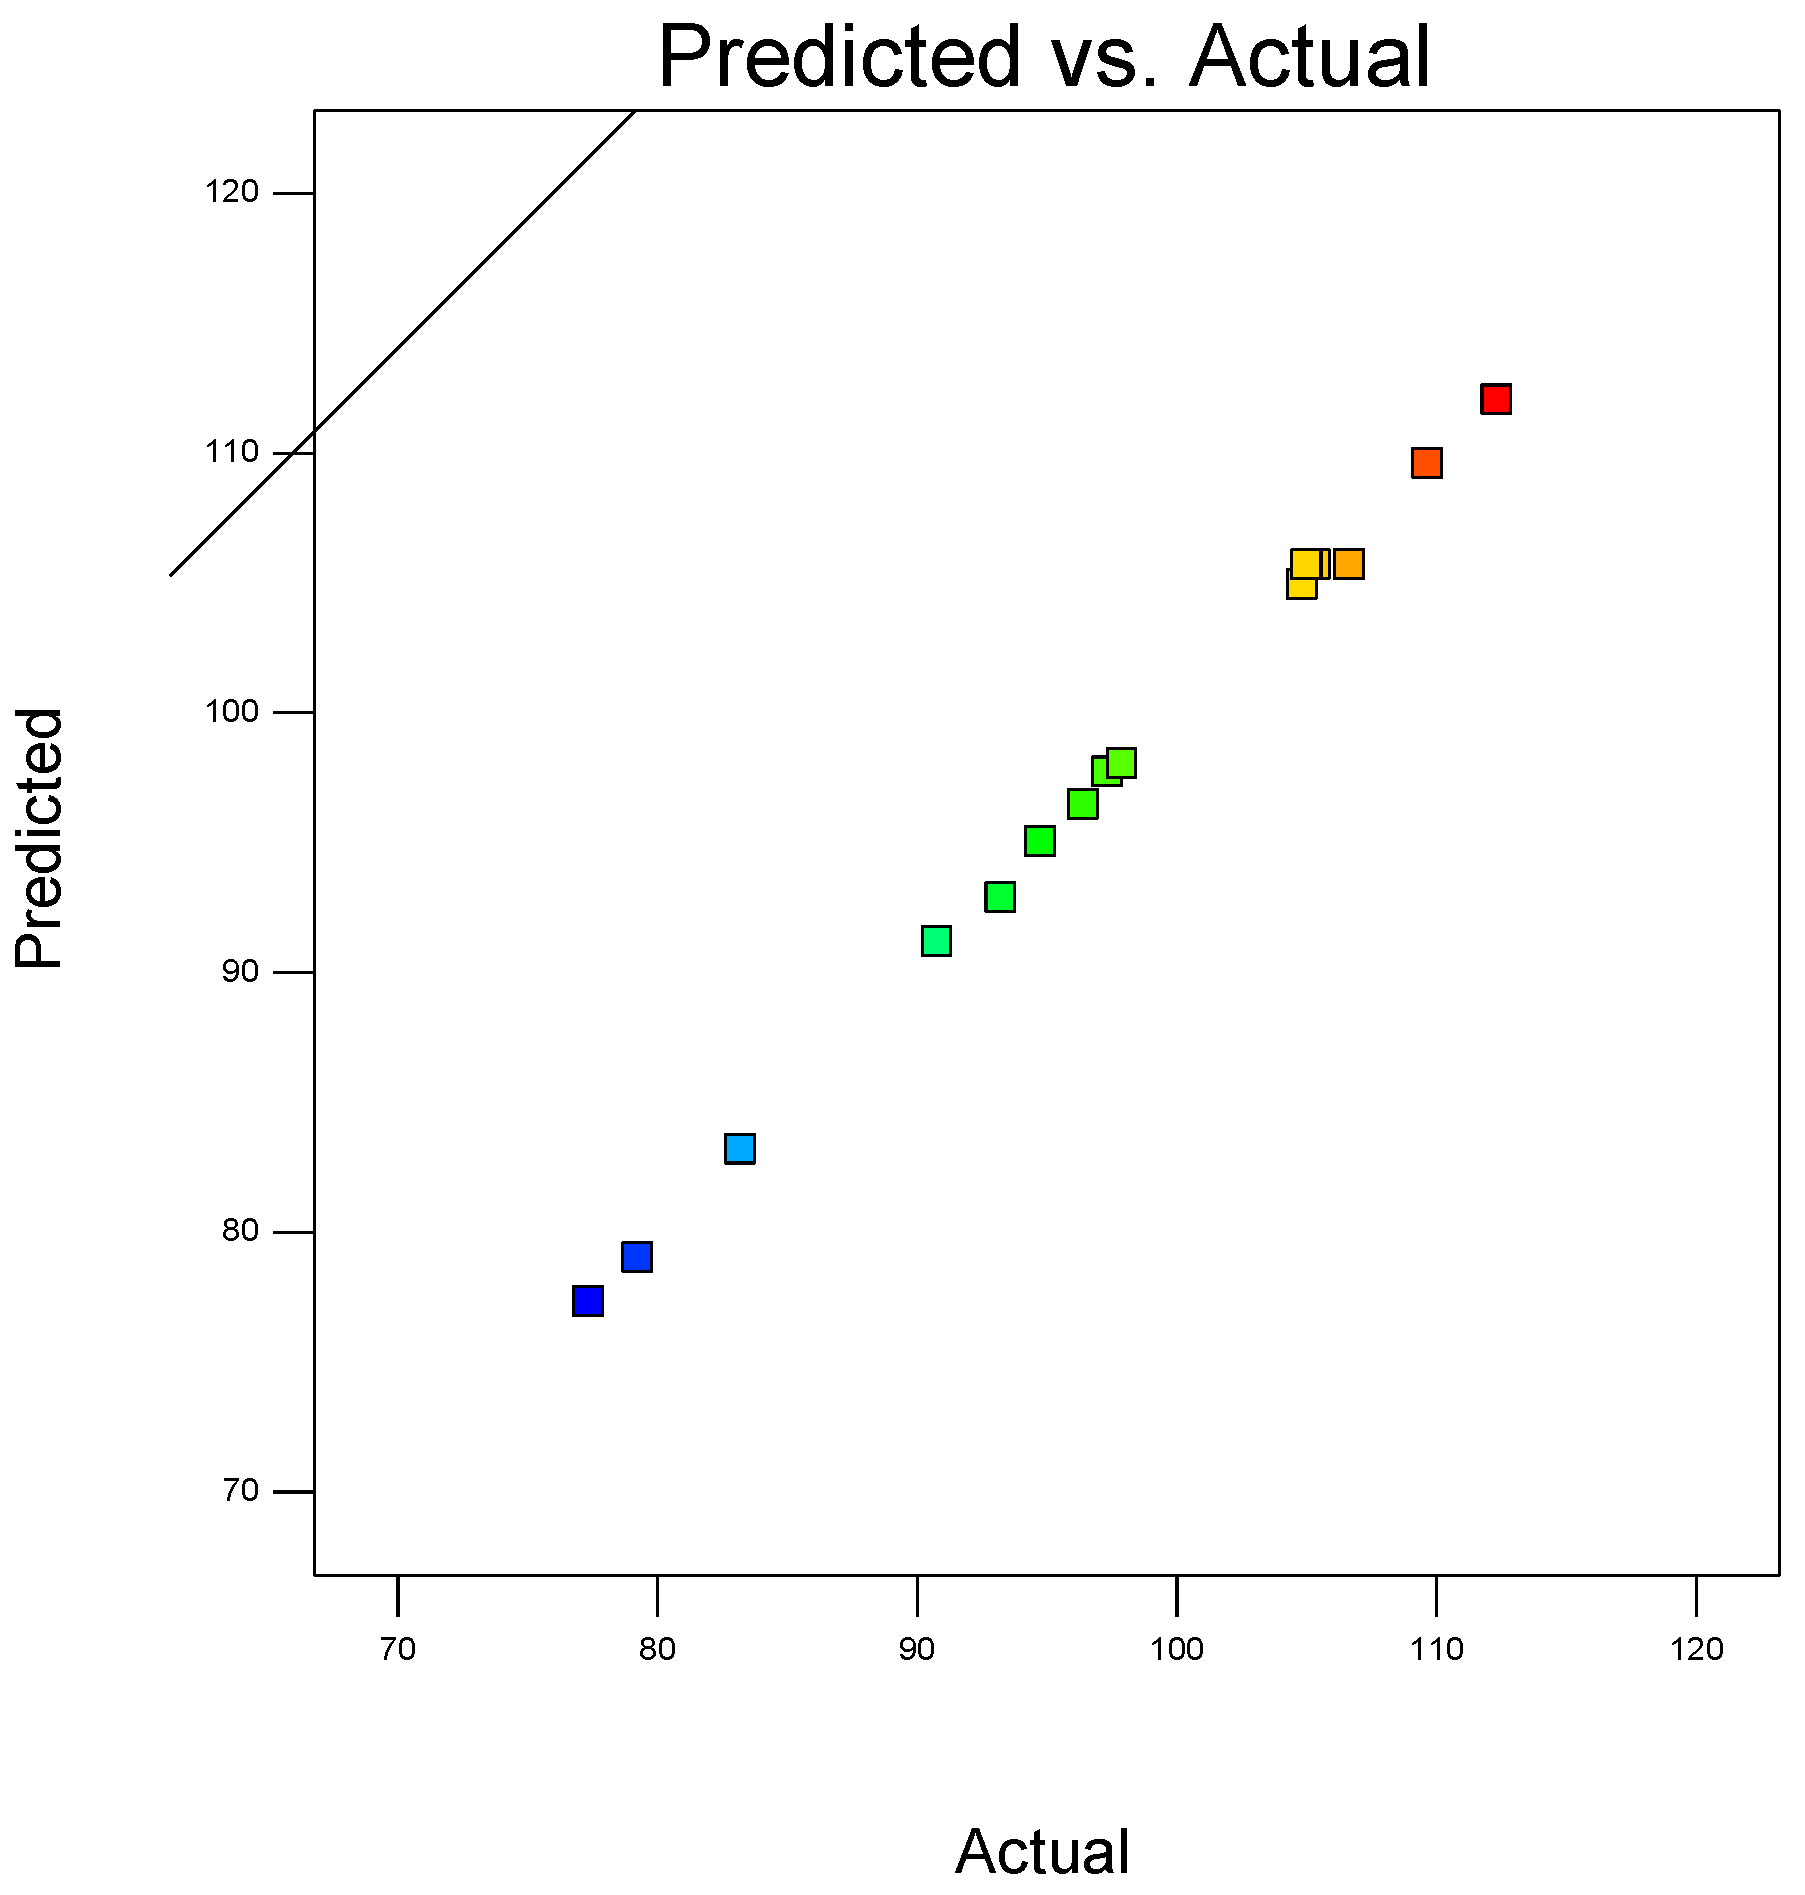
In a coordinate system, the abscissa represented the actual measured 5-day average desulfurization efficiency, and the ordinate represented the 5-day average desulfurization efficiency predicted by the above regression equation. The corresponding relationship between the actual value and the predicted value drawn in the coordinate system is shown in Figure 3.
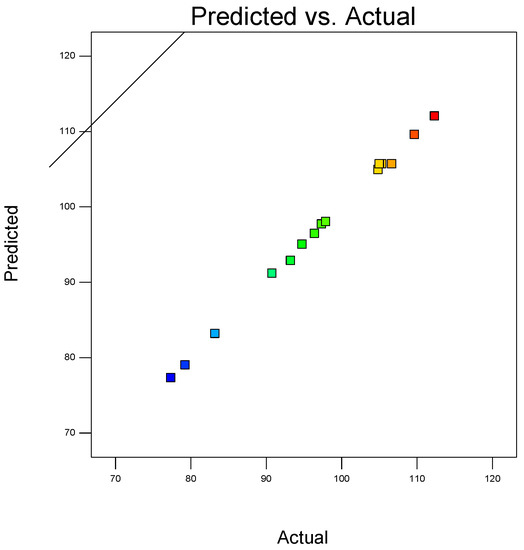
Figure 3.
The corresponding relationship between the actual value and the predicted value.
Analysis of Variance for Response Surface Quadratic Model
The significance of experimental factors, their interaction, and the ANOVA results of the Box–Behnken experimental design are shown in Table 7.

Table 7.
Analysis of variance for response surface quadratic model.
Table 7 shows the F value (406.94) and p-value (<0.0001) of the response surface model. The results showed that the fitting of the whole model was significantly reliable and had statistical significance. The results were in accordance with the Plackett–Burman analysis of variance, which revealed that the p-values of particle size (A), rotation speed (C), and volume of bacterial liquid (D) were all less than 0.05, with the p-values of A and C being the most significant (0.0001). This indicated that the effect of ore sample size and rotation speed on the 5-day average desulfurization efficiency was more significant than that of bacterial liquid volume. The p-value of AD was less than 0.05, indicating that the interaction between ore sample size and bacterial liquid volume had a significant effect on the response value. The p-values of A2 and D2 were less than 0.05, which showed that the quadratic term of ore sample size and bacterial liquid volume had a significant effect on the response value. The model’s lack of fit had a p-value greater than 0.05, indicating that it was not significant.
The correlation coefficient R2 of the model was 0.9986, which corresponded with 99.86% of the experimental prediction data, indicating that the model was well-correlated. The adjusted determination coefficient (Adj) R2 of the model was 0.9962, which also proved that the model was significant.
Graphical Analysis of Biodesulfurization
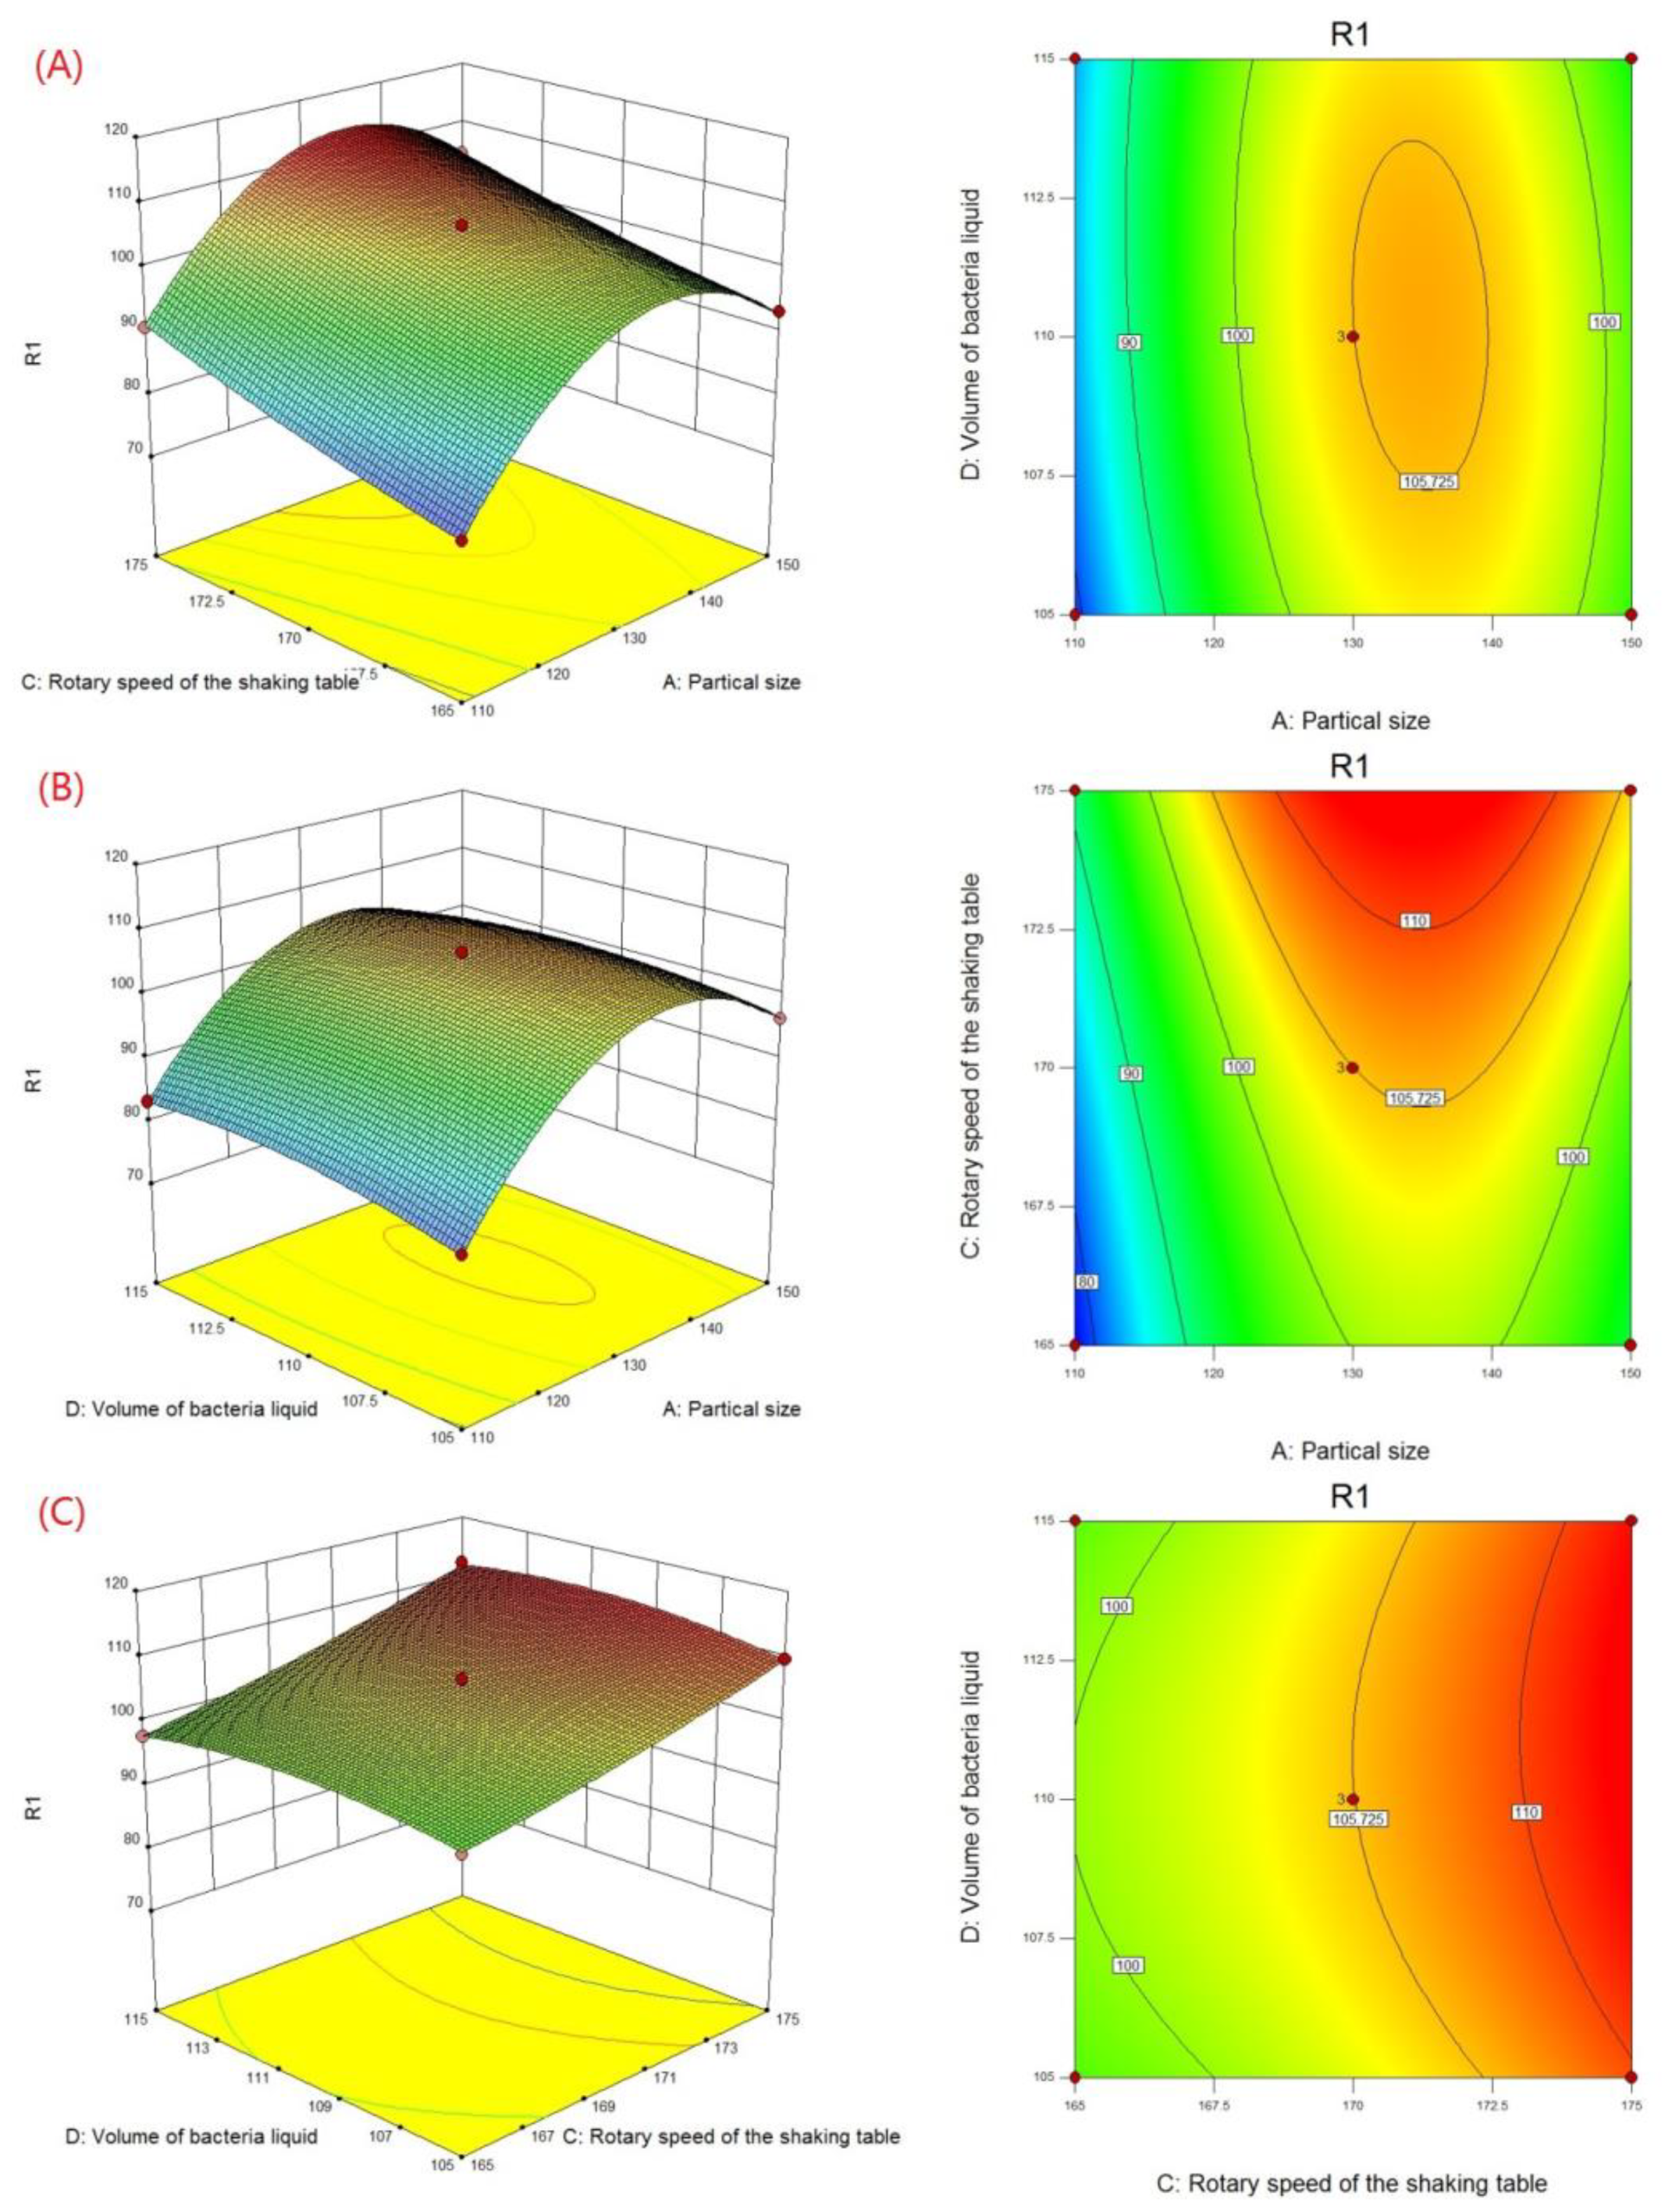
According to the Box–Behnken experimental results in Table 7, a 3D response surface and contour map (Figure 4) was generated by Design-Expert, which describes the change of the response value under the interaction of two factors. The curvature and color of the response surface reflect the significant degree of influence of the two factors on the response value, while the shape and color of the contour reflect the strength of the interaction between the two factors.
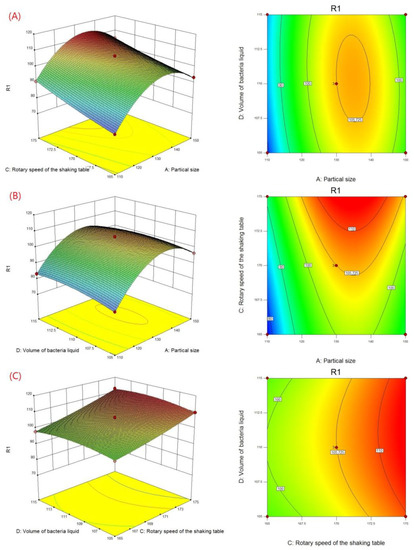
Figure 4.
Three-dimensional plots and contour plots showing the effect of (A) particle size and rotary speed of shaking table, (B) particle size and volume of bacteria liquid, and (C) rotary speed of shaking table and volume of bacteria liquid on biodesulfurization.
The contour line was almost a straight line at a lower level of ore sample particle size (Figure 4A), indicating that the interaction between the particle size and the rotation speed was not apparent, and particle size had a greater effect on desulfurization efficiency than rotation speed. With the increase in the particle size level, the contour line gradually curved, which showed that this interaction increased the speed of the shaking table. When the particle size was close to the 0 level and the rotation speed was close to the +1 level, the color of the graph was the deepest, indicating that the performance was at its peak.
In addition, the results from Figure 4B show the contour line, describing the interaction between ore size and bacterial liquid volume as elliptical. This indicated that there was a significant interaction on desulfurization efficiency. The interaction became stronger and then weakened as their level increased. The color was the deepest when the particle size and the amount of bacterial liquid were all near the 0 level. This also caused an increase in desulfurization efficiency.
The most obvious feature was that the response surface was close to the plane (Figure 4C), indicating that the interaction between the rotation speed of the shaking table and the volume of bacterial liquid was insignificant. Moreover, the contour line was approximately parallel to the vertical axis, which showed that the influence of the rotation speed was greater than that of the other factor.
By restraining the level range of factors, the level combination of various factors under the maximum 5-day average desulfurization efficiency was found as follows: ore particle size of 120–140 mesh, shaking table speed of 175 rpm, and bacterial liquid volume of 111 mL.
3.2. Results of Microbial Leaching Verification Experiment
3.2.1. Desulfurization Efficiency and Surface Desulfurization Rate
The 5-day average desulfurization efficiencies of Groups 1 and 2 are shown in Table 8.

Table 8.
Five-day average desulfurization efficiency of bacterial desulfurization.
The surface sulfur content of the four groups of ore samples is shown in Table 9.

Table 9.
Surface sulfur content of ore samples.
Group 1 had a desulfurization efficiency of 114.25 mg/d, while Group 2 had a desulfurization efficiency of 94.49 mg/d, as seen in Table 9. Additionally, Table 8 shows that the surface desulfurization rate of optimized Group 1 was 13.8% whereas that of Group 2 was 9.0% based on Formula (1). The surface desulfurization rate was increased by 53.3%, which demonstrated a significant improvement in the desulfurization effect.
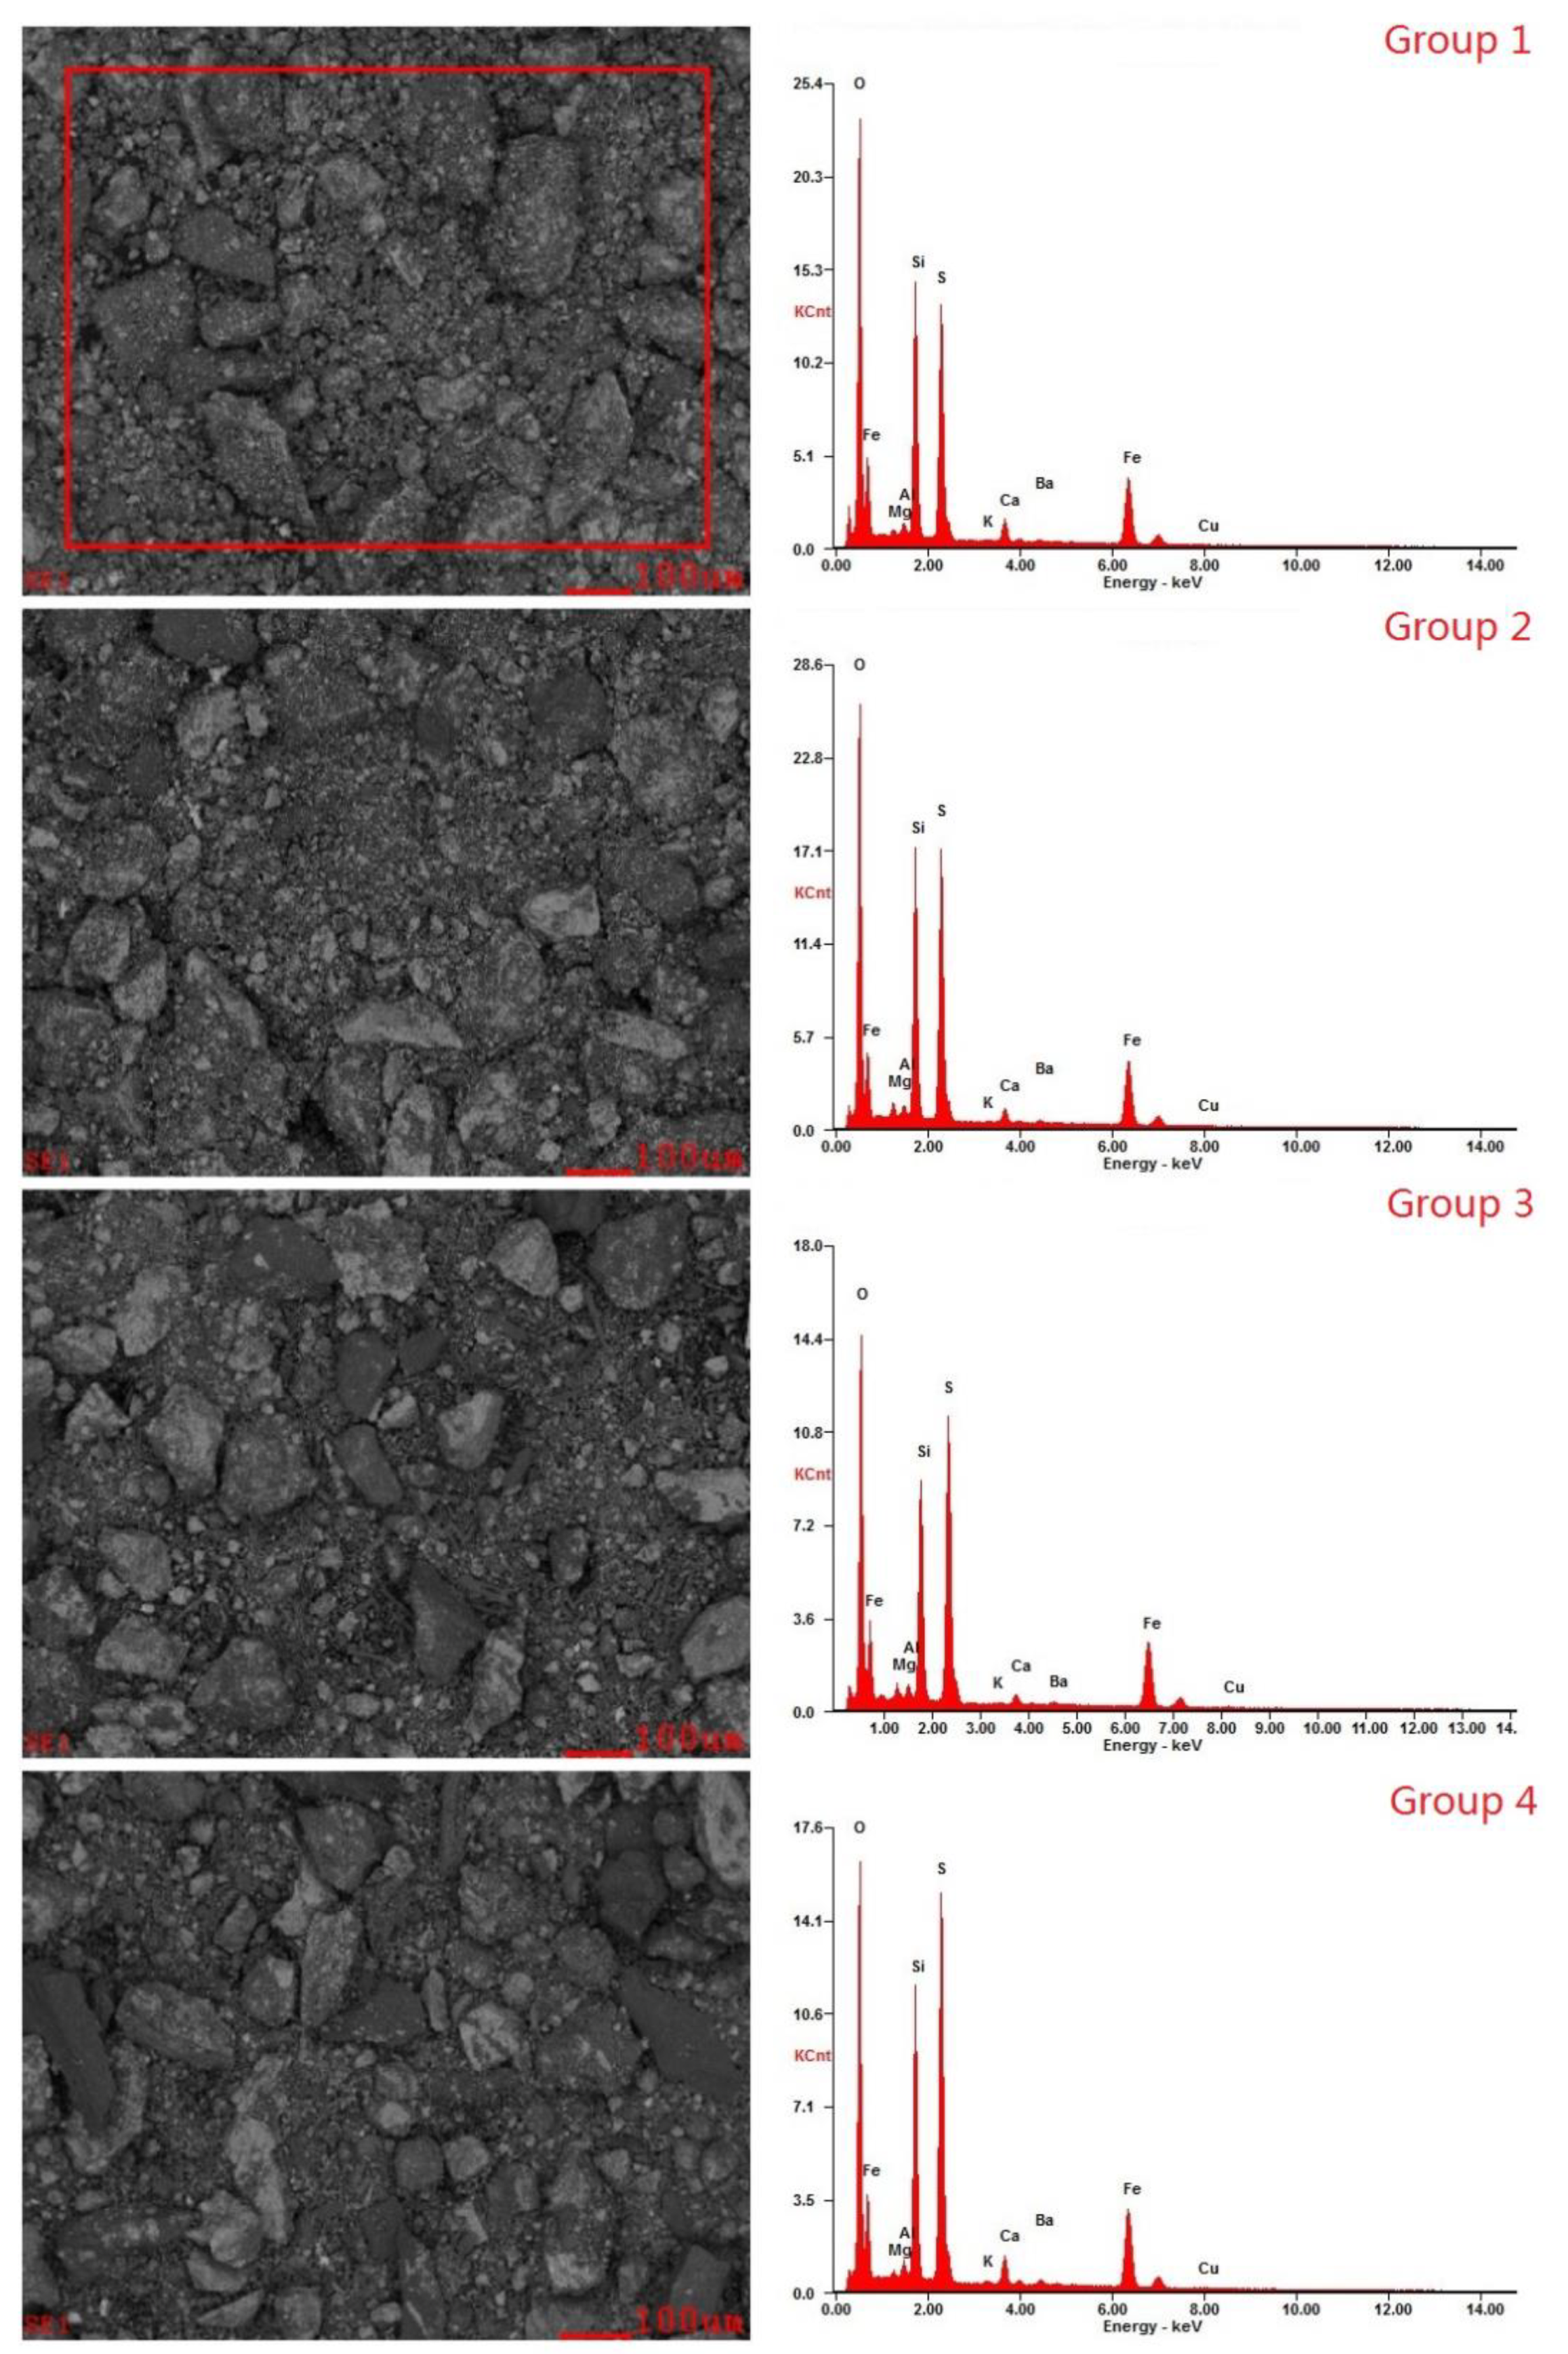
The energy spectrum and backscatter diagram (Figure 5) were made using Energy Dispersive Spectrometry (EDS). Comparing the results of Groups 1 and 2 with those of the original ore Group 4, it was found that after desulfurization, the contents of S, Si, and other elements decreased on the ore surface, and the particle size of the ore also decreased, which indicates that the bacteria acted on the surface of the ore sample and reacted with the solid sulfide on the surface.
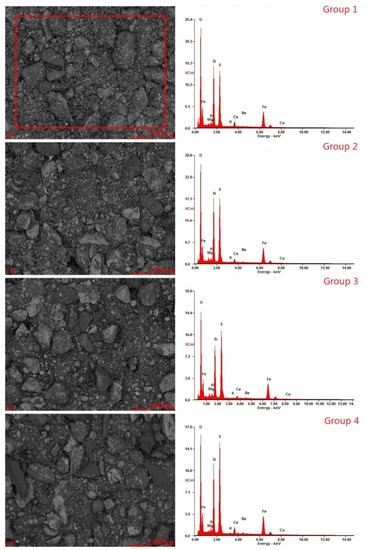
Figure 5.
The energy spectrum and backscatter diagram.
3.2.2. Results of Oxidation Weight Gain Experiment
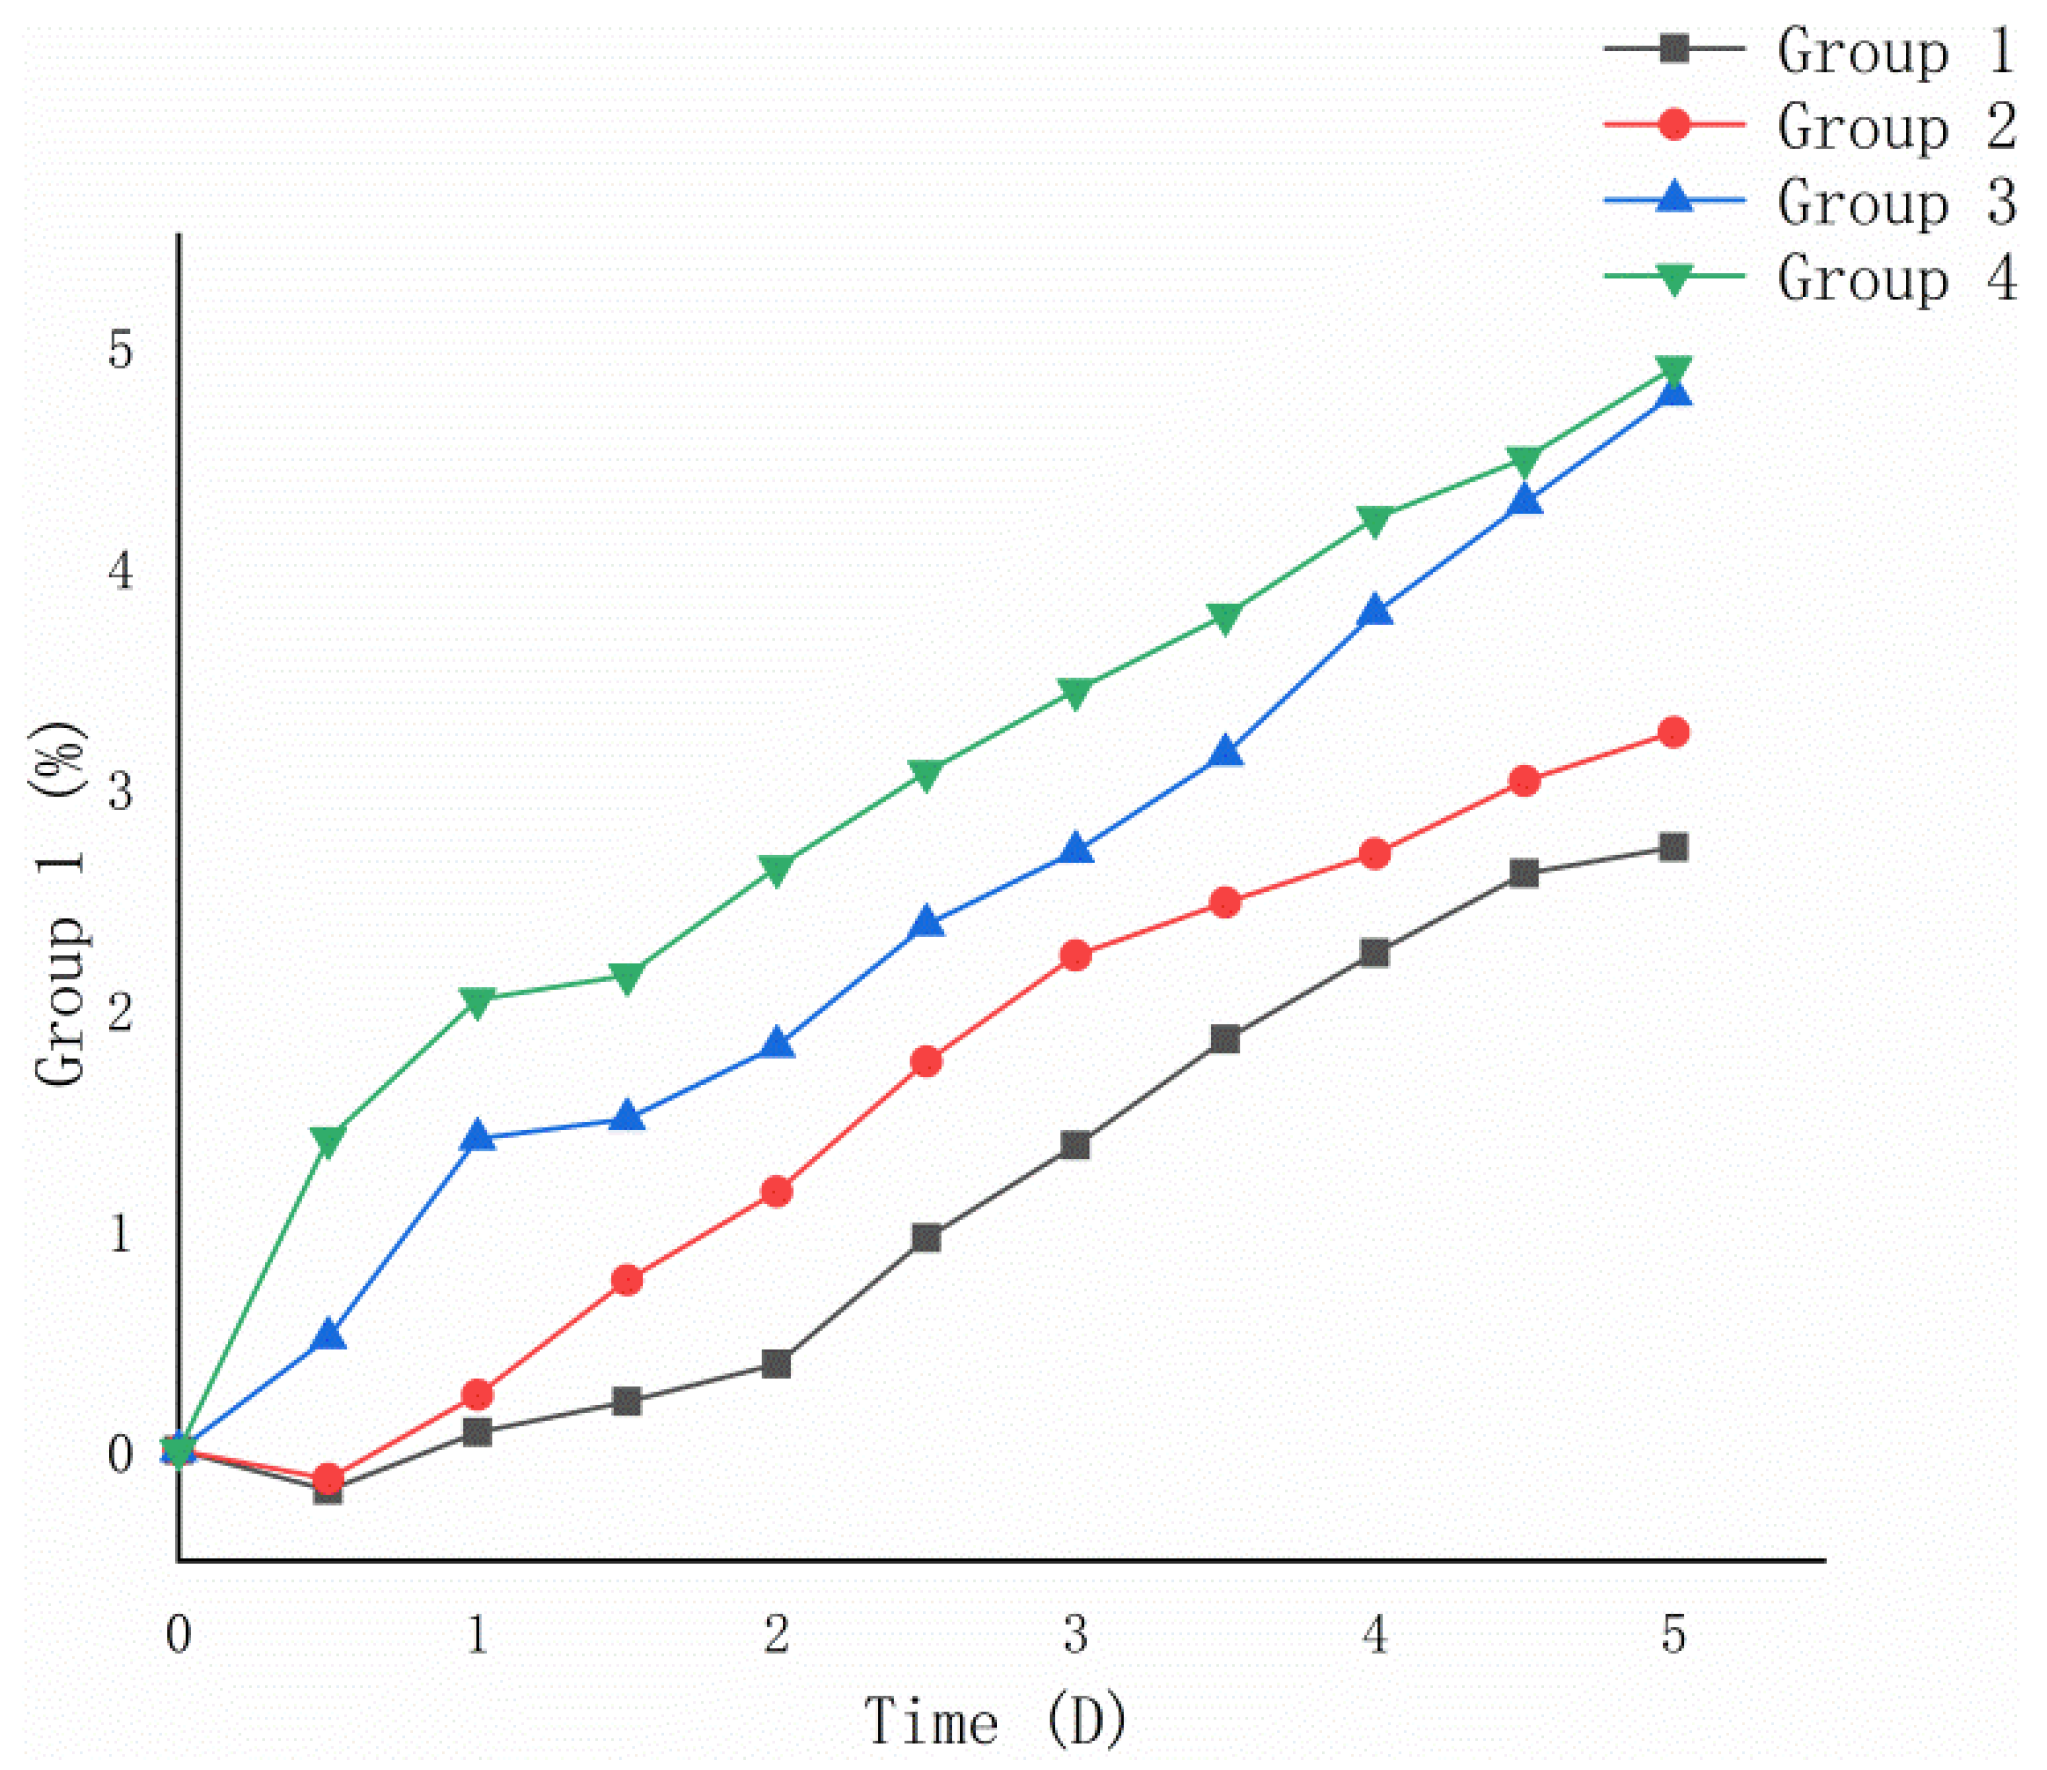
From Figure 6, it can be seen that the 5-day oxidation weight gain rates of Groups 1 and 2 after bacterial desulfurization treatment were lower than those of Groups 3 and 4 without desulfurization treatment. Calculated from Formula (2), the 5-day oxidation weight gain rate of optimized Group 1 (2.73%) was lower than that of non-optimized Group 2 (3.25%), and that of the control Group 3 (4.78%) was close to the original Group 4 (4.90%).
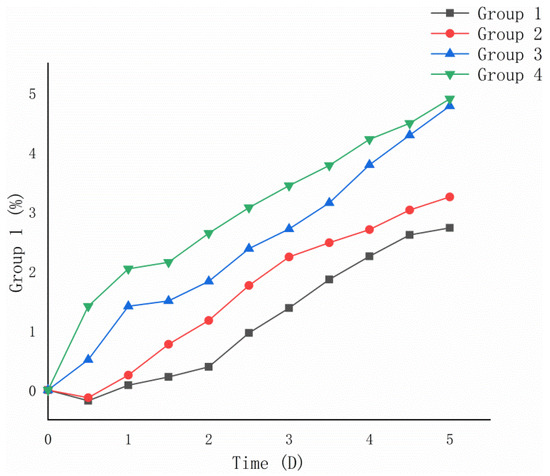
Figure 6.
Variation trend of oxidation weight gain rate of ore samples.
4. Discussion
Optimizing the factors of biodesulfurization can improve the desulfurization rate. In this study, by optimizing the three factors the surface desulfurization rate was increased by 53.3%. In previous studies, the surface desulfurization rate was also significantly improved by optimizing the single factor of surfactant concentration [25]. In this study, six desulfurization-related factors were considered, three of which were optimized, and the effect was more prominent. Previous studies have shown that the leaching efficiency can be improved through the combined leaching of different ores [26,27], which is to improve the leaching of other elements by increasing the concentration of iron ions in the solution. The sulfide ore used in this study is mainly pyrite. In previous studies [28,29,30], Acidithiobacillus caldus was mainly used in biometallurgy, for low-grade ores with low sulfur content. Sulfide ores with high sulfur concentration were desulfurized in this study, which is more conducive to improving desulfurization efficiency because it is more suited to the action of Acidithiobacillus caldus.
Among the three factors optimized by response surface methodology (RSM) in this study, the particle size of sulfide ore proved to be the most significant factor, because the finer the mineral, the larger the contact area with the bacterial solution. Our results showed that desulfurization efficiency first increases and then decreases as shaker speed increases. This suggests that higher spinning speed increases the interaction potential between microorganisms and sulfide ore, promoting desulfurization. However, at high speeds, the interruption of cells occurs, resulting in low desulfurization [31]. The volume of the bacterial solution determines the content of bacteria and culture medium. The greater the volume of bacteria liquid, the higher the desulfurization efficiency, but, in this study, too much bacterial liquid reduced the efficiency of biological desulfurization. In previous studies [31,32,33], RSM was used to optimize some factors affecting the reaction. The main selected factors were generally temperature, pH, concentration, and stirring speed, which is similar to the content of this study.
The weight increase caused by oxidation was greatly decreased in this experiment by removing sulfur from the surface of minerals. The high sulfur concentration of ore has been proven in previous studies to play a significant role in triggering spontaneous combustion and severe acid mine drainage [34]. Wang et al. (2013) in their work found that after desulfurization, the weight gain rate due to oxidation is reduced, and the spontaneous combustion point increased, reducing the risk of spontaneous combustion [35]. Therefore, it can be concluded that using microorganisms to desulfurize sulfide ore can effectively inhibit the oxidation reaction on the surface of the ore, thereby reducing the heat release, aggregation on the surface, and the possibility of spontaneous combustion of the ore. Optimizing the experimental conditions of microbial desulfurization effectively increases the desulfurization efficiency and ore surface desulfurization rate, and the optimized desulfurization has a better result in inhibiting the oxidation reaction on the ore surface, which meets this experiment’s impact expectations.
Microbial desulfurization technology is a hot research topic now. This technology is widely used in coal and oil fields, but it is rarely used in the field of ore desulfurization. Before large-scale application, there is still a lot of research work to be done, such as on the laws of the desulfurization process, optimization of bacterial reaction conditions, etc. There is a need to expand the scale of the experiment step by step, from shake flask, to stirring, to column leaching. Therefore, a lot of experiments and analysis still need to be carried out, which will be applied in the field of mine safety as soon as possible.
5. Conclusions
The spontaneous combustion and biodesulfurization leaching of sulfide ore were investigated in this study, with the bioleaching conditions being optimized. This was done to increase the sulfide ore’s final desulfurization effect and to ensure the feasibility and reliability of biodesulfurization technologies in the field of sulfide ore flame retardants. Three significant factors were selected from six experimental factors by a Plackett–Burman experiment.
A steepest climbing experiment to determine the level of the center point of the response surface was conducted. The results showed that the response surface model was well-fitted. The response surface visual analysis revealed interactions between the three experimental factors: particle size, shaking table speed, and volume of bacteria liquid, with the interaction between particle size and bacterial liquid volume being the most significant. The optimal combination was found by constraining the level range of factors. In the verification experiment carried out under the optimized conditions, the average value of desulfurization efficiency was 114.28 mg/d, which was consistent with the prediction, and the average desulfurization efficiency after 5 days of optimization had increased by 8.1% compared with the previous one.
Through a Box–Behnken experiment, it was found that after optimization, the 5-day average desulfurization efficiency and surface desulfurization rate were significantly improved. The results of 5-day oxidation weight gain were as follows: optimized group 2.73%, non-optimized group 3.25%, and original group 4.90%. These results suggest that optimized treatment can effectively inhibit the oxidation reaction on the ore surface, reduce the possibility of ore spontaneous combustion, and produce a better flame-retardant effect.
Author Contributions
Conceptualization, J.T., Y.F., Z.W., S.Z., E.K.S., W.P., and H.L.; methodology, J.T., and Y.F.; software, Y.F.; validation, J.T., Y.F., H.J., and R.Y.; formal analysis, W.P. and Z.W.; writing—original draft preparation, J.T. and E.K.S.; writing—review and editing, J.T. and E.K.S.; visualization, J.T., Y.F., and R.Y.; funding acquisition, H.L. All authors have read and agreed to the published version of the manuscript.
Funding
This research was funded by the National Key R&D Program of China, grant number 2018YFC1801804, National Natural Science Foundation of China, grant number 51504298, and Natural Science Foundation of Hunan Province, grant number 2017JJ3160.
Conflicts of Interest
The authors declare no conflict of interest.
References
- Wu, C.; Li, Z.J. A simple method for predicting the spontaneous combustion potential of sulphide ores at ambient temperature. Min. Technol. 2005, 114, 125–128. [Google Scholar] [CrossRef]
- Yang, F.Q.; Wu, C.; Li, Z.J. Spontaneous combustion tendency of fresh and pre-oxidized sulfide ores. J. Cent. South Univ. 2014, 21, 715–719. [Google Scholar] [CrossRef]
- Liu, H.; Wang, Z.; Zhong, J.; Xie, Z. Early detection of spontaneous combustion disaster of sulphide ore stockpiles. Teh. vjesnik Tech. Gaz. 2015, 22, 1579–1587. [Google Scholar]
- Yang, F.Q.; Wu, C.; Hu, H.H.; Li, Z.J.; Liu, H. Fire-extinguishing techniques research on spontaneous combustion of a sulfide iron ore dump in mining stope. In Proceedings of the 2008 International Symposium on Safety Science and Technology, Beijing, China, 24–27 September 2008; pp. 869–874. [Google Scholar]
- Wu, C.; Li, Z.J.; Yang, F.Q. Risk forecast of spontaneous combustion of sulfide ore dump in a stope and controlling approaches of the fire. Arch. Min. Sci. 2008, 53, 565–579. [Google Scholar]
- Stachulak, J. Computerized fire monitoring, criteria, techniques and experience at inco limited. CIM Bull. 1990, 83, 59–67. [Google Scholar]
- Wang, X.R. Exploring Conditions Leading to Self-Heating of Pyrrhotite-Rich Materials. Ph.D. Thesis, McGill University, Montréal, QC, Canada, 2007. [Google Scholar]
- Wu, C.; Li, Z.J.; Li, M. Chemical Thermodynamic Mechanism of Sulfide Ores during Oxidization and Self-Heating Process; School of Resources and Safety Engineering, National Research Center of Safety Science and Technology for Metal Mines, Central South University: Changsha, China, 2007. [Google Scholar]
- Ngabe, B.; van der Spuy, J.E.; Finch, J.A. Estimating activation energy from a sulfide self-heating test. Miner. Eng. 2011, 24, 1645–1650. [Google Scholar] [CrossRef]
- Liu, H.; Wu, C.; Shi, Y. Locating method of fire source for spontaneous combustion of sulfide ores. J. Cent. South Univ. 2011, 18, 1034–1040. [Google Scholar] [CrossRef]
- Gunawan, R.; Zhang, D.K. Thermal stability and kinetics of decomposition of ammonium nitrate in the presence of pyrite. J. Hazard. Mater. 2009, Vol.165, 751–758. [Google Scholar] [CrossRef]
- Li, Z.J.; Shi, D.P.; Wu, C.; Wang, X.L. Infrared thermography for prediction of spontaneous combustion of sulfide ores. Trans. Nonferrous Met. Soc. China 2012, 22, 3095–3102. [Google Scholar] [CrossRef]
- Li, Z.J.; Yang, F.Q.; Wu, C. Investigation of the propensity of sulfide concentrates to spontaneous combustion in storage. J. Loss Prev. Process. Ind. 2011, 24, 131–137. [Google Scholar]
- Ninteman, D.J. Spontaneous Oxidation and Combustion of Sulfide Ores in Underground Mines: A Literature Survey; U.S. Government Printing Office: Washington, DC, USA, 1978.
- Yang, F.Q.; Wu, C.; Cui, Y.; Lu, G.A. Apparent activation energy for spontaneous combustion of sulfide concentrates in storage yard. Trans. Nonferrous Met. Soc. China 2011, 21, 395–401. [Google Scholar] [CrossRef]
- Wu, C. Fault tree analysis of spontaneous combustion of sulphide ores and its risk assessment. J. Cent. South Univ. 1995, 2, 77–80. [Google Scholar] [CrossRef]
- Li, Z.J.; Niu, J.; Zhou, H.B.; Yang, D.J. Study on foamed gel and its sulfide ore spontaneous combustion retardancy. China Saf. Sci. J. 2015, 25, 57–61. [Google Scholar]
- Alam, R.; Shang, J.Q. Effect of operating parameters on desulphurization of mine tailings by froth flotation. J. Environ. Manag. 2012, 97, 122–130. [Google Scholar] [CrossRef] [PubMed]
- Grossman, M.J.; Lee Prince, R.C.; Garrett, K.K.; George, G.N.; Pickering, I.J. Microbial desulfurization of a crude oil middle-distillate fraction: Analysis of the extent of sulfur removal and the effect of removal on remaining sulfur. Appl. Environ. Microbiol. 1999, 65, 181–188. [Google Scholar] [CrossRef]
- Fernandez, M.; Ramirez, M.; Perez, R.M. Hydrogen sulphide removal from biogas by an anoxic biotrickling filter packed with pall rings. Chem. Eng. J. 2013, 225, 456–463. [Google Scholar] [CrossRef]
- Celik, P.A.; Aksoy, D.O.; Koca, S.; Koca, H.; Cabuk, A. The approach of biodesulfurization for clean coal technologies: A review. Int. J. Environ. Sci. Technol. 2019, 16, 2115–2132. [Google Scholar] [CrossRef]
- Liao, R.; Yu, S.C.; Wu, B.Q.; Zhao, C.X.; Lin, H.; Hong, M.X.; Wu, H.Y.; Yang, C.R.; Zhang, Y.S.; Xie, J.P.; et al. Sulfide mineral bioleaching: Understanding of microbe-chemistry assisted hydrometallurgy technology and acid mine drainage environment protection. J. Cent. South Univ. 2020, 27, 1367–1372. [Google Scholar] [CrossRef]
- Patra, P.; Natarajan, K.A. Microbially enhanced removal of pyrite and chalcopyrite from oxide gangue minerals with. Reference to desulfurization of tailings. Miner. Metall. Process. 2004, 21, 169–178. [Google Scholar] [CrossRef]
- Liu, X.R.; Su, C.; Jiang, S.C.; Liu, Y.J. Influences of ph buffers on the growth of acidithiobacillus thiooxidans and biodesulfurization efficiency. Adv. Mater. Res. 2013, 2749, 508–511. [Google Scholar] [CrossRef]
- Pan, W.; Jin, H.M.; Liu, Z.Z.; Tang, J.H.; Cheng, S.Y. Experimental and theoretical study on strengthening leaching of sulfide ores by surfactants. Process Saf. Environ. Protect. 2020, 137, 289–299. [Google Scholar] [CrossRef]
- Liu, S.T.; Hong, M.X.; Wang, X.X.; Yang, B.J.; Lin, H.; Lin, M.; Wang, J.; Qiu, G.Z. Pretreatment with acidic ferric sulfate leaching promotes the bioleaching of bornite. Hydrometallurgy 2020, 196, 10. [Google Scholar] [CrossRef]
- Cao, L.B.; Huang, Z.H.; Sun, X.; Jin, K.; Chang, K.X.; Qin, W.Q.; Qiu, G.Z.; Wang, J.; Zhang, Y.S. Comparison of leaching of bornite from different regions mediated by mixed moderately thermophilic bacteria. J. Cent. South Univ. 2020, 27, 1373–1385. [Google Scholar] [CrossRef]
- Shen, L.; Wang, J.J.; Liu, H.W.; Yin, H.Q.; Liu, X.D.; Qiu, G.Z.; Liu, Y. Effect of introduction of exogenous strain leptospirillum ferriphilumysk on functional gene expression, structure, and function of indigenous consortium during pyrite bioleaching. J. Cent. South Univ. 2020, 27, 1453–1465. [Google Scholar] [CrossRef]
- Bulaev, A.G. Effect of organic carbon source on pyrite biooxidation by moderately thermophilic acidophilic microorganisms. Microbiology 2020, 89, 301–308. [Google Scholar] [CrossRef]
- Liu, Y.; Wang, J.J.; Hou, H.J.; Chen, G.; Liu, H.W.; Liu, X.D.; Shen, L. Effect of introduction of exogenous strain acidithiobacillus thiooxidans a01 on structure and function of adsorbed and planktonic microbial consortia during bioleaching of low-grade copper sulfide. Front. Microbiol. 2020, 10, 11. [Google Scholar] [CrossRef] [PubMed]
- Khatoon, H.; Rai, J.P.N. Optimization studies on biodegradation of atrazine by bacillus badius abp6 strain using response surface methodology. Biotechnol. Rep. 2020, 26, e00459. [Google Scholar] [CrossRef] [PubMed]
- Bian, H.; Wan, J.; Muhammad, T.; Wang, G.H.; Sang, L.; Jiang, L.L.; Wang, H.D.; Zhang, Y.J.; Peng, C.; Zhang, W.; et al. Computational study and optimization experiment of nzvi modified by anionic and cationic polymer for cr(vi) stabilization in soil: Kinetics and response surface methodology (rsm). Environ. Pollut. 2021, 276, 11. [Google Scholar] [CrossRef]
- Guo, J.; Wei, J.; Huang, F.Y.; Massey, I.Y.; Luo, J.Y.; Yang, F. Optimization of microcystin biodegradation by bacterial community yfmcd4 using response surface method. Chemosphere 2021, 274, 129897. [Google Scholar]
- Lu, W.; Lin, C.; Ma, Y.; Huang, S.; Si, C.; Liu, Y.; Li, J. Characteristics and potential environmental consequence of weathered materials in the surface layer of a spontaneously combusting mine spoil stockpile. Appl. Geochem. 2010, 25, 496–501. [Google Scholar] [CrossRef]
- Wang, H.J.; Xu, C.S.; Wu, A.X.; Ai, C.M.; Li, X.W.; Miao, X.X. Inhibition of spontaneous combustion of sulfide ores by thermopile sulfide oxidation. Miner. Eng. 2013, 49, 61–67. [Google Scholar] [CrossRef]
Publisher’s Note: MDPI stays neutral with regard to jurisdictional claims in published maps and institutional affiliations. |
© 2021 by the authors. Licensee MDPI, Basel, Switzerland. This article is an open access article distributed under the terms and conditions of the Creative Commons Attribution (CC BY) license (https://creativecommons.org/licenses/by/4.0/).

