1. Introduction
Since its inception, froth flotation has undergone tremendous change as research tries to address the industrial challenges. The scale of flotation machines is ever changing from the 1 L batch flotation cell, that is the workhorse within many flotation laboratories, to large industrial mechanical cells, approaching volumes of 600 m3. In addition, flotation technology is constantly evolving resulting in interesting new flotation machines. Research into the chemistry of froth flotation has also made large strides resulting in a plethora of collectors, depressants, frothers, etc. for the user to choose from. Within a constantly changing framework, industrial flotation engineers and operators need to achieve increasing throughputs and better product qualities, while struggling with ore variability and equipment maintenance. It is clear from this that applying a rigorous characterization of flotation circuits and determining optimization opportunities based on circuit models is vital to the success of an industrial operation.
Mineral recovery in froth flotation is generally accepted to follow first-order kinetics. Gorain [
1] performed extensive research on the variation of the flotation rate within a variety of industrial flotation cells of different types and sizes, air rates, impeller speeds and froth depths. It was concluded that the differences in the rate constant seen within the experimental program was due to a change in either ore floatability (
P), bubble surface area flux (
Sb), or the loss of recovery induced by the froth phase (
Rf), as shown in Equation (1).
Substituting the rate constant into the recovery equation of a perfectly mixed reactor results in Equation (2), which predicts the recovery of floatable species,
i.
Within Equation (2), the bubble surface area flux (
Sb) and residence time (
τ) are based on known calculations that are quite simple to perform. That is, however, not the case for the ore floatability (
P) and froth recovery (
Rf). The ore floatability depends on numerous particle and mineral properties, such as but not limited to: particle size, degree of liberation, reagent coverage, mineral composition [
2]. The complex behavior of an ore is often simplified by dividing the species into discrete floatability components, each assigned an average floatability (
P) and a mass fraction (m
i) [
3,
4,
5,
6].
The definition of froth recovery (R
f) is the mass flow rate of particles recovered to the concentrate via selective bubble attachment over the mass flow rate of attached particles at the pulp froth interface [
7,
8]. Numerous attempts have been employed to physically measure the froth recovery with limited success [
7,
8,
9,
10]. For the reasons expressed above, ore floatability and froth recovery are usually fitted and therefore depend on the quality of the metallurgical and hydrodynamic survey.
Equation (2) deals with selective mineral recovery; however, within a separation process, non-selective entrainment of species is unavoidable. Recovery by entrainment (
RE) is known to be proportional to the amount of water recovered, as depicted by Equation (3) [
11,
12,
13,
14,
15].
If Equations (2) and (3) are combined, Equation (4) is obtained which provides a recovery equation incorporating selective and non-selective processes for a specific component,
i [
2,
16,
17].
The prediction of recovery by entrainment relies solely on the water recovery, therefore a model predicting the water recovery is needed to capture the flotation performance. Water recovery was predicted by the relationship presented in Equation (5) [
18].
The aim of this paper is to use the data generated from a metallurgical survey conducted on the reverse flotation of iron ore in the “coarse” Brucutu circuit to calibrate the floatability component model. This model will then be used to assess the current behavior of the process and identify any optimization opportunities. Lastly, the calibrated model will be used to perform simulations focusing solely on circuit reconfiguration to maximize hematite grade and recoveries in the final concentrate. This study will provide unprecedented information and insight into the process behavior and will assist metallurgists with decision making.
3. Results
This section will present and discuss the results from the survey campaign and simulation scenarios regarding Fe2O3 and SiO2 only. This will be divided into three main sections, namely: gas dispersion, metallurgical performance, and simulation scenarios.
3.1. Gas Dispersion
The coarse flotation circuit consists of dated Wemco #164 and #144 flotation cells with self-aerating mechanisms. The air flow induced is mostly a function of impeller speed and, therefore, hydrodynamic measurements are very important as they provide an indication of mechanism wear. These measurements are usually neglected within self-aerated cells leading to poor dispersion as well as poor detection and/or maintenance planning.
Figure 2 displays the measured bubble size and gas hold-up as a function of the measured superficial gas velocity.
Figure 2a indicates that the superficial gas velocities ranged between 0.8 cm/s and 1.2 cm/s which is within the expected range [
19,
20,
21] apart from Scavenger 1 cell 1 and 2 which operated at ± 0.5 cm/s; this can be considered as low. The Sauter mean bubble diameter (d
32) ranged from 1 mm to 2 mm which is within the expected range [
19,
20,
21]. For the most part, all measurements fall onto a common linear operating line where an increase in superficial gas velocity results in an increase in bubble size. As noted before, cell 1 and 2 of Scavenger 1 significantly deviates from the observed trend and this is possibly an indication of a faulty and/or wore out mechanism.
Figure 2b indicates that the measured gas hold-up ranged between 10% and 20% which is within what one would normally expect [
19,
20,
21].
3.2. Metallurgical Performance
3.2.1. Fe2O3 and SiO2 Behavior
The main objective within an iron ore flotation circuit is to depress the hematite (Fe
2O
3) while selectively recovering the quartz (SiO
2), in a reverse flotation operation.
Figure 3 highlights the relation between size and recovery for both Fe
2O
3 and SiO
2 and this is fundamental to the performance of an iron ore operation as it highlights the relative floatability of both hematite and quartz. The induced selectivity can be seen in
Figure 3, as the hematite recovery-by-size is much lower than the quartz recovery-by-size, therefore allowing an effective split.
Figure 3a highlights that the recovery of quartz follows the classical n-shaped recovery behavior, typical of a floating species, i.e., a drop-off in fine recovery due to poor collision efficiency and a drop-off in coarse recovery due high probabilities of detachment [
22,
23,
24]. It is important to note that the relative performance for 1A Ro1 highlights lower recoveries since it is a single flotation cell. Characterization of the 1A Ro1 performance is very important to the operation, as the tail produced by the flotation cell reports directly to final tail.
The hematite behavior reported in
Figure 3b is much more complicated. To aid the discussion, the data will be discussed based on particles being larger or smaller than 50 µm. This size (50 µm) is important as it has been highlighted by many researchers as the size at which entrainment becomes insignificant [
13,
25,
26].
If the behavior of particles larger than 50 µm is observed in
Figure 3b, it can be seen that there is still significant recovery in these size classes which is unexpected for a specie recovered by non-selective entrainment only. It is thought that this phenomenon can be explained by the presence of composite particles of quartz and hematite (poor liberation) within the coarser size fractions [
15].
The focus is now shifted to particles smaller than 50 µm with special emphasis on the sub 45 µm size fraction. It is commonly accepted that recovery by entrainment will exhibit a linear relationship with water recovery, as first proposed by Lynch [
11]. Due to the classification of solids with respect to water in both the pulp and froth phases, this relationship is expected to be less than 1:1, the slope being related to the entrainability (ENT) factor. For the measured −45 µm hematite recovery, this relationship was not observed, and many of the experimental points showed hematite mass recovery being higher than that of water as shown in
Figure 4.
In a similar plot to
Figure 4, Lima [
15] demonstrated that sub 38 µm Fe-bearing mineral recovery never exceeded that of water. Most hematite particles are liberated at a relatively coarse size, around 100 µm, and therefore, poor liberation is not a plausible explanation of why particles of sub 45 µm did not follow the measured water recovery. Since this observation was made, further investigations by Vale into this phenomenon has attributed this to short residence times within the starch conditioning tanks. This leads to the hematite experiencing true flotation mainly by electrostatic interaction with the amine collector. This is a significant conclusion and highlights the importance of performing metallurgical characterizations of the circuit within a reasonable frequency.
3.2.2. Circuit Performance
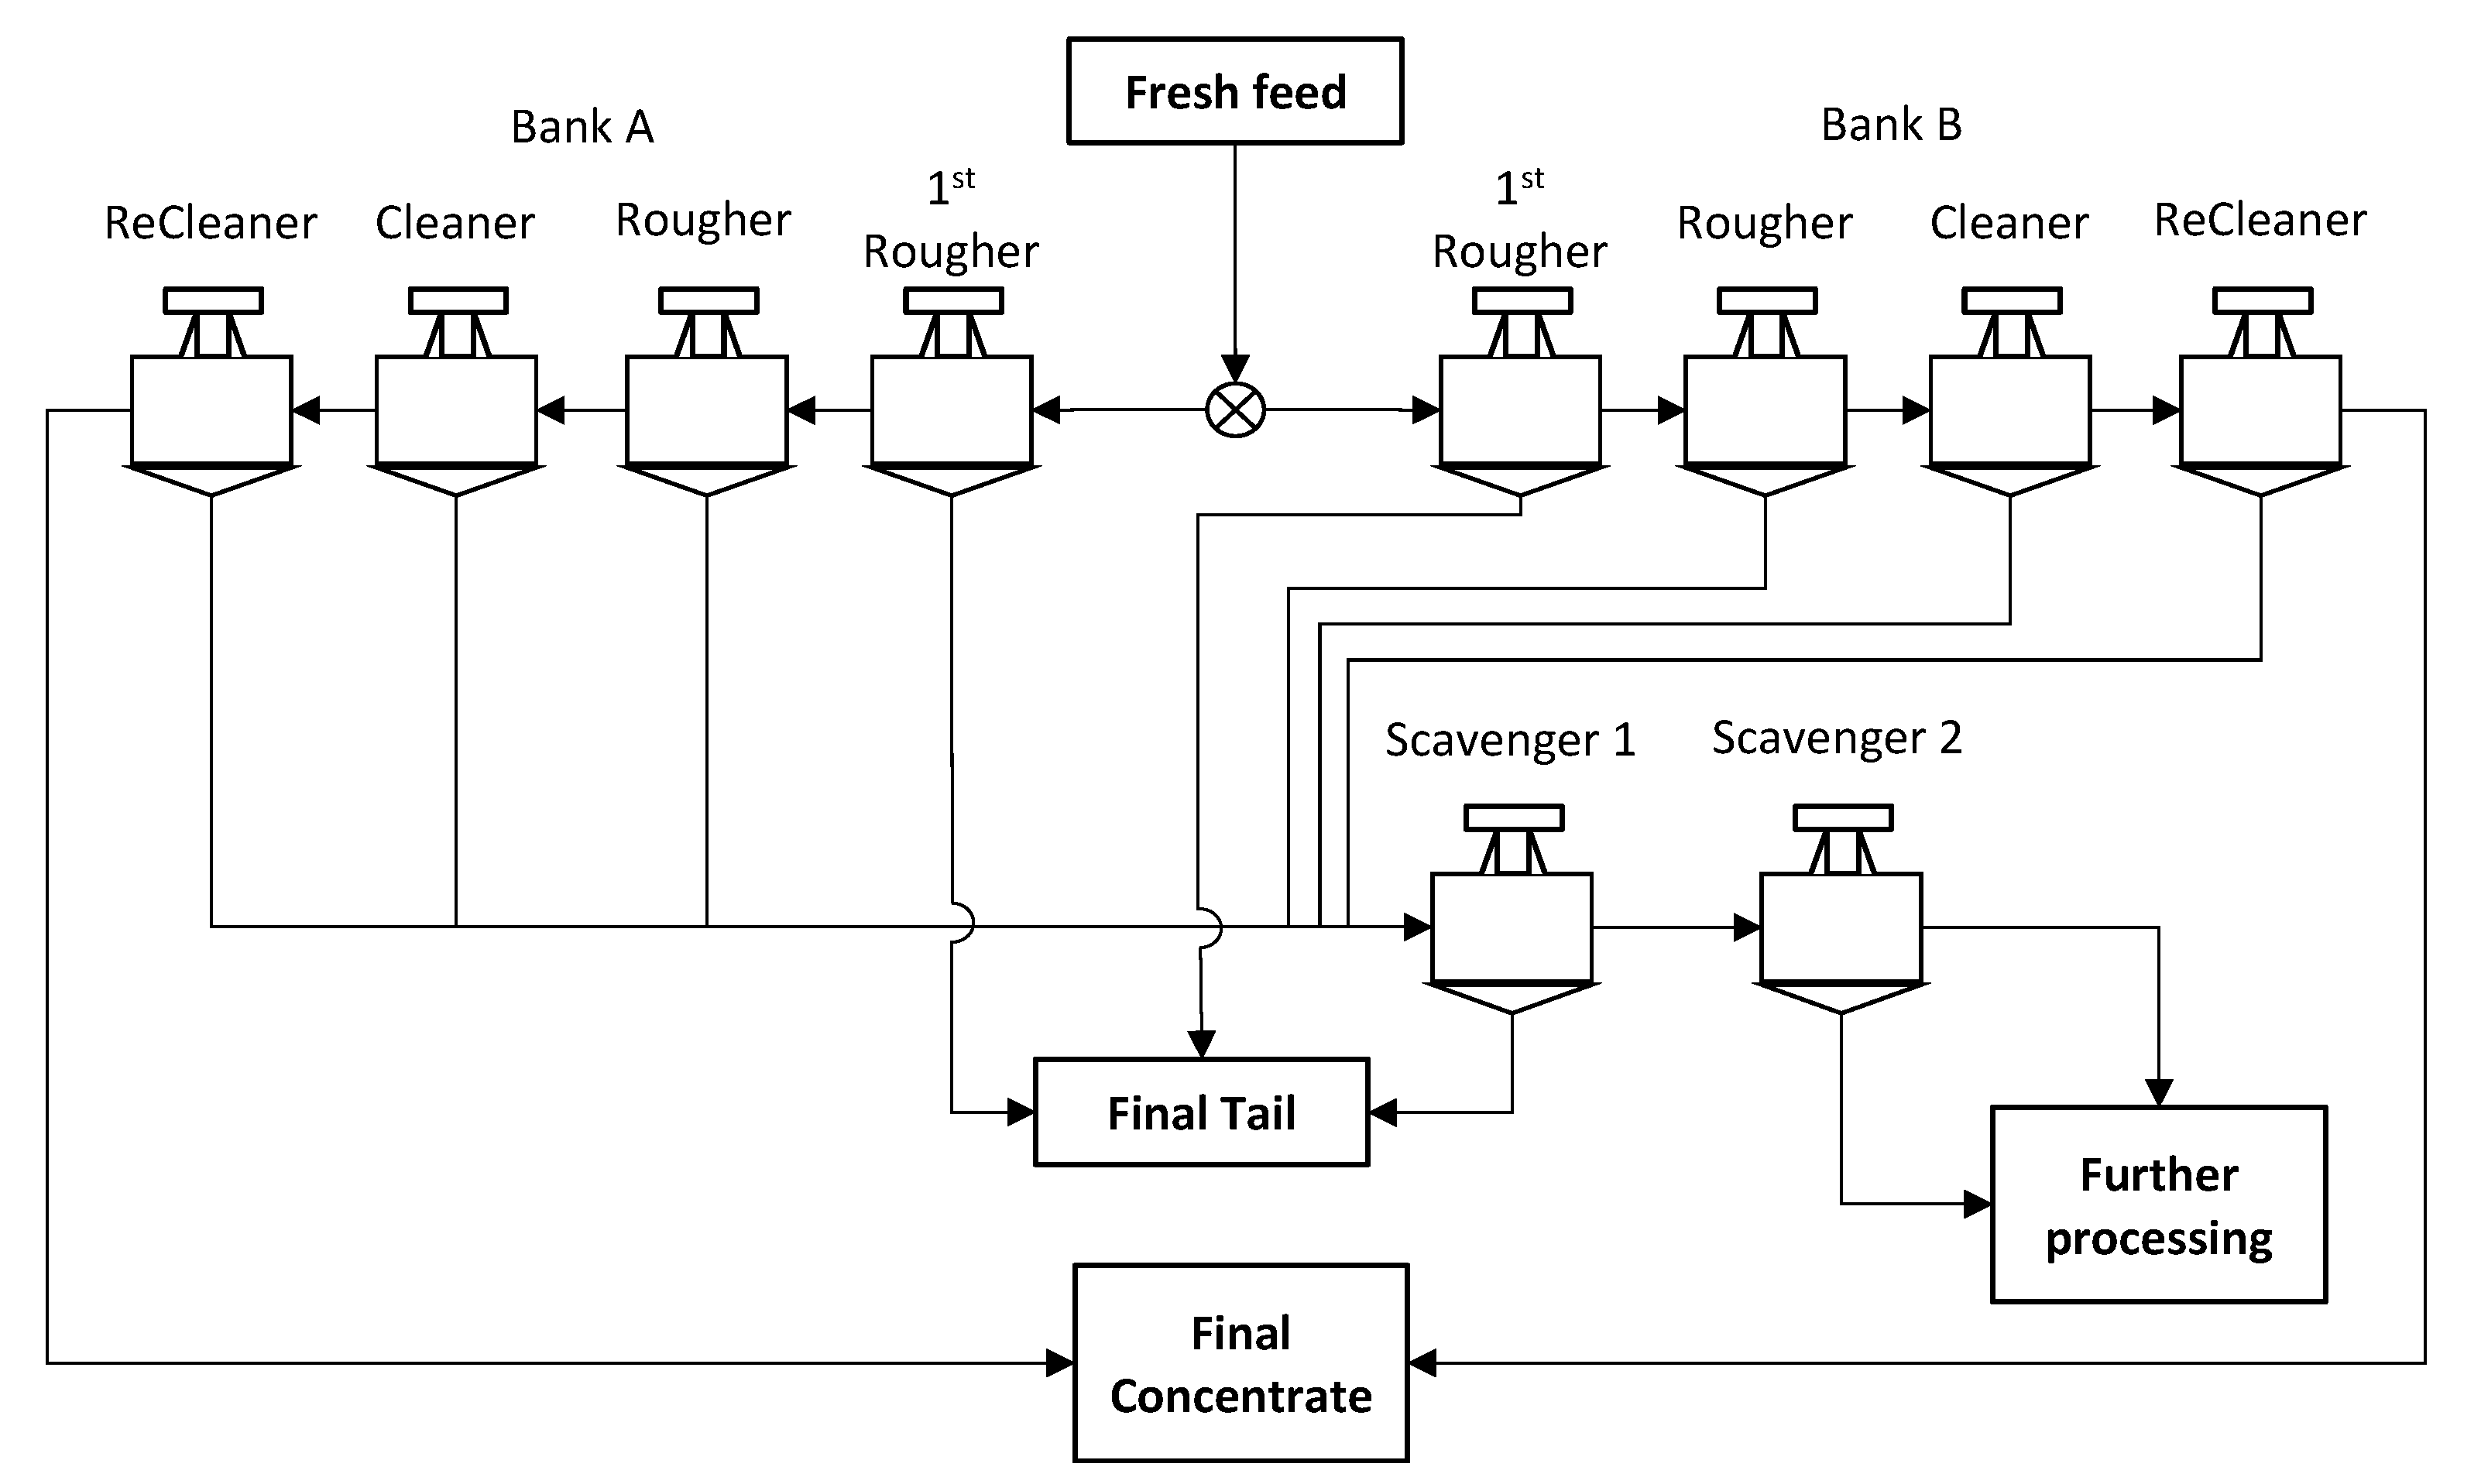
The observations regarding the overall circuit performance can be divided into three basic themes, namely: bank A and B rougher 1 tail, mainline residence time, and scavenger residence time. In the current circuit configuration, the froth product from the 1st rougher of each bank reports to the final tail. Based on the plant feed, the hematite recovery is 2.7% and 4.8% for the first rougher cell of bank A and B, respectively. Expressed in this manner, these hematite losses seem quite reasonable. However, as illustrated in
Figure 5, based on the distribution in the final tail with regards to where it originates from, nearly 36% of the hematite losses in the final tail originates from the first rougher tail of bank A and B.
Figure 6 displays the recovery/time plots for the flotation banks.
Figure 6a suggests that the residence time in the mainline (where mainline refers to the roughers, cleaners, and recleaners) is around 38 min and 45 min for bank A and B, respectively. A long residence time within the mainline is beneficial for quartz recovery, which is an important driver, but it is also results in more hematite losses to the froth. It can be seen from
Figure 6a that the quartz recovery plateaus at a residence time of ±25 min. The remaining flotation time (25 min to 40 min) has virtually no effect on the quartz recovery but drastically increases the amount of hematite recovered to the froth product. This highlights the importance of residence time of the mainline within an iron ore operation. The reasoning behind having a long residence time to obtain SiO
2 grades lower than 1 wt% in the final concentrate, thus producing a premium product that ultimately sells for a higher price, is valid. However, this is usually accompanied by higher hematite losses. This trade-off is of critical importance within the circuit.
Figure 6b highlights that the residence time of scavenger 2 is nearly twice that of scavenger 1 (21 min compared to 40 min). The short residence time within scavenger 1 is beneficial as it allows the process to exploit the floatability differences of quartz and hematite. Scavenger 1 recovers nearly 90% of the quartz fed to it which leaves a small fraction of quartz left to be recovered by scavenger 2, even though, it has a much longer residence time. The benefit of the short residence time in scavenger 1 can be seen as this bank only recovers 15% of the hematite fed to it whereas scavenger 2 recovers nearly 60%. As mentioned previously, residence time is an important parameter that should be used to exploit the relative differences in the kinetics of quartz and hematite, and this carries through to the scavenger circuit. The relatively short residence time of scavenger 1 still recovers most of the quartz (90%) while minimizing hematite losses to only 15%.
3.3. Simulation Results
As demonstrated by
Figure 5, the hematite losses that can be contributed to the rougher 1 tail of bank A and B is around 36% of the total hematite lost to the final tail. Aiming at decreasing these hematite losses, scenario 1 will evaluate the value of rerouting the rougher 1 tail from both bank A and B to the feed of scavenger 1.
Figure 7 indicates that, by rerouting the rougher 1 tail of both bank A and B to the feed of the scavengers, a significant decrease in hematite losses to the final tail can be realized. The recovery of hematite to the final tail decreases from 14.8% to 10.5% indicating a recovery gain of around 4%. This is further illustrated by the drop of hematite grade within the final tail by nearly 4.5 wt%. It should be noted that this does decrease the scavenger 1 residence time, and therefore, the quartz recovery in this bank drops from 84% to 79%. However, the excess residence time available in scavenger 2 will ensure that the quartz recovery over both scavenger banks remains constant.
In the current circuit configuration, the scavenger 2 concentrate forms part of the feed to a subsequent concentrating step. The long residence time of the scavenger 2 bank has been mentioned a few times; however, due to this, it produces a concentrate containing 98.6 wt% hematite and 1.0 wt% quartz (virtually the final concentrate quality). This leads to the scenario 2 simulation which has an option A and B. Option A reroutes the scavenger 2 concentrate to a final concentrate because the chemical analysis indicated that no further processing is needed. Option B reroutes the scavenger 2 concentrate to the feed of the mainline to address the residence time concerns in the mainline highlighted previously. The results of these simulations are shown in
Figure 8.
It comes as no surprise that the hematite recovery increased significantly as the hematite within the scavenger 2 concentrate is now reporting to the final concentrate of line 1. It is important to note that the selling price of the final product is very dependent on the quartz grade, and therefore, it makes sense that the operation is conservative in defining its operating strategy. However, due to the long residence time within scavenger 2, adding this stream to the final concentrate poses no risk and significantly increases the hematite recovery. Interestingly, option B, which is recycling this stream to the feed of the plant, shows marginally better performance compared to option A. Initially, this might not make sense; however, this a result of managing the mainline residence time. Shorter residence times, which is what the addition of this stream to plant feed is causing, allows one to efficiently exploit the difference in hematite and quartz floatability resulting in an overall better split in the mainline. The volume of this stream is relatively small, and therefore, the resultant benefit is also small; however, it does highlight the importance of this concept. Scenario 3 will explore this idea in more detail.
It should be noted that the simulations performed within scenario 3 are done solely to explore the concept of excess scavenger and mainline residence time. The calibrated FCM relies on many assumptions, for instance, constant froth recovery, and therefore will not reflect the actual process performance. However, perfectly predicting the process behavior is not necessarily the point of using the FCM, rather it gives engineers a means to test hypotheses. If these prove to be significant in the simulator, a rigorous testing campaign should be used to validate the behavior of the process.
Figure 9 displays the simulation results of shortening the scavenger bank residence time. This was done by reducing the number of scavenger cells that are online. The important output variables are the quartz grade and hematite recovery to the final concentrate as well as the volumetric flow rate of the recirculating stream.
Figure 9a highlights the increasing volumetric flow rate of the recirculating stream (scavenger concentrate) as the overall scavenger residence time is decreased. This increases the volumetric feed to the mainline which leads to a decrease in the residence time within the mainline. The resulting improvement in quartz and hematite behavior is seen in
Figure 9b. This improvement is a direct result of a more efficient separation within the mainline, i.e., shorter residence times reduce the entrainment of hematite to the froth while the quartz recovery remains unaffected. This clearly illustrates the benefit of operating with a recycle within an iron ore flotation circuit; however, it should be noted that there are process concerns. Firstly, if the scavenger residence time is too short, the process will be difficult to control. Due to the exponential response in the volumetric flow of the recycle even small process changes (increases in throughput is one example) can drastically affect this stream and subsequently the volume balance across the process. Secondly, the recycle stream is dependent on the quality of the ore fed to the plant and significant changes in the quartz feed grade (for instance) coupled with a scavenger residence time that is too short will result in a large change in the volume of the recycle stream, thus affecting process stability and control. To mitigate these risks, most iron ore flotation circuits are designed with excess scavenger residence time which can counteract the benefits of running a recycle while adding unnecessary process complexity. This illustrates the benefit of this work, as it significantly contributes to the collaboration between engineers and operators while also aiding the understanding of this relationship.


