Article

Temporal–Spatial Separation of Cu from Mo in the Jiama Porphyry Copper–Polymetallic Deposit, Southern Tibet, China

1
MNR Key Laboratory of Metallogeny and Mineral Assessment, Institute of Mineral Resources, Chinese Academy of Geological Sciences, Beijing 100037, China
2
Chengdu Center, China Geological Survey, Chengdu 610081, China
*
Author to whom correspondence should be addressed.
Minerals 2021, 11(6), 609; https://doi.org/10.3390/min11060609
Submission received: 27 April 2021 / Revised: 29 May 2021 / Accepted: 4 June 2021 / Published: 7 June 2021

Abstract

:
Jiama is a super-large porphyry copper–polymetallic deposit located in the Gangdese metallogenic belt of southern Tibet. The deposit consists of a combination of a polymetallic skarn, Cu–Mo mineralization at the contact between the Jiama Porphyry and hornfels, and distal Au mineralization in fault. The current metal reserves are 7.4 Mt Cu, 0.6 Mt Mo, 1.8 Mt Pb–Zn, 6.65 Moz Au, and 360.32 Moz Ag, with a skarn to porphyry–hornfels host-rock ratio of ~3:1. Based on detailed field and laboratory investigations, this paper indicates that: (i) the skarn and porphyry–hornfels orebodies are almost entirely preserved; (ii) the emplacement age of the Cu-bearing plutonic rocks is earlier than the plutons containing elevated Mo assays; (iii) the permeability of the wall rocks gradually decreases in an upward direction; (iv) the fluid temperature during the precipitation of Cu was higher than that of the Mo mineralization; (v) the lithospheric pressure during the precipitation of Cu and Mo was the same; (vi) the laser Raman spectroscopy shows that the fluid carrying the Cu was rich in magnetite, hematite, and anhydrite, and the fluid carrying Mo was rich in pyrite, CO2, and CH4; and (vii) the SR–XRF mapping shows that the concentration of Cu in the mineralizing fluid was high and that of Mo was low when Cu was deposited. Conversely, the concentration of Cu was relatively low and the concentration of Mo was relatively high during deposition of the Mo. This study also shows that the temporal and spatial separation of Cu and Mo in the porphyry copper–polymetallic deposit at Jiama was associated with the emplacement of the Jiama Porphyry. Transportation of mineralized fluid was controlled by the permeability of the wall rocks, and deposition of the metals related to changes along a redox front and pressure releases during hydrothermal brecciation at the roof of the Jiama Porphyry.

1. Introduction

The Jiama deposit is ~68 km east of Lhasa City in the Gangdese metallogenic belt of southern Tibet. The area has been extensively studied in terms of the geology, tectonic structures, petrology, geochronology, geochemistry, and ore genesis [1,2,3,4,5,6,7,8,9,10,11,12].
Zheng et al. [10,13] discussed the distribution of metals in skarn at Jiama, and recognized a metal zonation that extends from a central Cu–Mo zone outward to Cu (–Mo), Pb–Zn (–Cu), and Au zones. They proposed that the zonation is related to lateral passages of fluids where metals are precipitated with drops in temperature or pressure in the skarn. However, continued mining and drilling has delineated the zonation in a vertical orientation from an early upper-level of Cu mineralization to a late lower-level Mo mineralization at the contact of the Jiama Porphyry with hornfels. This indicates that the mineralizing fluids migrated in a vertical direction.
Hydrothermal metallogenesis is usually controlled by changes in the temperature of mineralizing fluid, leading to precipitation of a succession of metals [14]. This depends largely on the fluid’s temperature and Gibbs free energy (or free enthalpy), which predicts whether a reaction will be spontaneous in the forward or reverse direction or whether it is at equilibrium. In such conditions Cu should be present on the periphery of the Mo-rich zone that formed prior to the Cu-rich zone.
The spatial zonation of Cu and Mo is recorded in various places, such as at the Dexing, Qulong, Bingham Canyon, West Pebble deposits, etc. [15,16,17,18,19,20,21]. However, the nature of the temporal succession and spatial distribution of Cu and Mo has not been studied in any detail.
This contribution examines the unusual early upper-level Cu and late lower-level Mo zonation present along the contact between the Jiama Porphyry and hornfels at Jiama. Based on detailed field investigations, fluid inclusion studies (including SR–XRF mapping of fluid inclusions), and laser Raman spectroscopy, differences in the physicochemical conditions of the interpreted ore-forming fluid during precipitation of Cu and Mo have been determined. Moreover, the nature of the transport and precipitation of metals are studied with a discussion of factors that may have caused the temporal and spatial separation of metals in the deposit.

2. Geological Setting and Ore Deposit Geology

Numerous studies have investigated the tectonic structures, plutonic rocks, and ore deposits in the Gangdese metallogenic belt, which is part of the Lhasa Terrane in Tibet [22,23,24,25,26,27,28,29,30,31,32,33,34,35,36]. The terrane is ~2000 km long, up to 500 km wide, and bound to the north by the Bangonghu–Nujiang Suture and south by the Indus–Yarlung Zangbo Suture (Figure 1a). The Jiama deposit is ~68 km east of Lhasa city (Figure 1a), and is the largest and most extensively explored porphyry copper–polymetallic deposit in Tibet.
The rocks exposed at Jiama are the Early to Middle Jurassic andesite, tuff, and lensoidal limestone of the Yeba Formation, limestone of the Late Jurassic Duodigou Formation, sandstone and shale of the Early Cretaceous Linbuzong Formation, quartz sandstone, siltstone, and black shale of the Chumulong Formation, and the locally important Quaternary alluvium (Figure 1b).
There are limited exposures of plutonic rocks in the Jiama area, and those intersected in drill holes are stocks and dykes intruding hornfels in the Copper Mountain–Zegulang area (Figure 1b). The plutonic rocks are mafic to felsic and include dolerite, porphyritic quartz diorite, porphyritic granodiorite, porphyritic monzonite to quartz monzonite, and porphyritic monzogranite. The mafic rocks are the oldest and are locally mineralized in Cu, and the felsic rocks are associated with Mo mineralization [38]. Both the mafic and felsic plutonic phases are included here in the Jiama Porphyry.
The southern part of the Lhasa Terrane is affected by the collision of the Indian and Eurasian plates, and is characterized by major eastward trending strike–slip faults associated with secondary NW-trending thrusts. The major structures in the Jiama area are the Jiama–Kajunguo Thrust, with a top to the southwest movement, and a nappe structure with movement from the southwest to the northeast in the Copper Mountain–Bulanggou–Mogulang region. The thrusts are associated with a series of overturned folds, including the Hongta Anticline, Xiagongpu Syncline, and Niumatang Anticline that hosts the Jiama deposit. The nappe covers an area of around ~4 km2 (Figure 1b; [1]).
The rocks at Jiama consist of skarn at the contact between the Jiama Porphyry and hornfels, along detachment fault between shale and sandstone in the Linbuzong Formation, and in limestone of the Duodigou Formation. The deposit is at an altitude of around 4500 m, has a roughly planar geometry, strikes NW, and dips NE (Figure 1b). The upper part of the orebody dips steeply (60°–80°) to the NE, and its lower part dips more gently (10°–30°) to the NE (Figure 2 and Figure 3). The orebody is ~3 km long, 2.5 km wide, and is open to the NE at depth of around 1000 m.
The orebody at the contact between the porphyry and hornfels is a cylindrical body controlled by multiple stages of magmatism. The orebody strikes NW–SE with a subvertical dip for over 1200 m, and is hosted by hornfelsed clastic units in the Linbuzong Formation (Figure 2 and Figure 3; [10]).

3. Relationship between Cu and Mo Mineralization at the Contact between the Jiama Porphyry and Hornfels

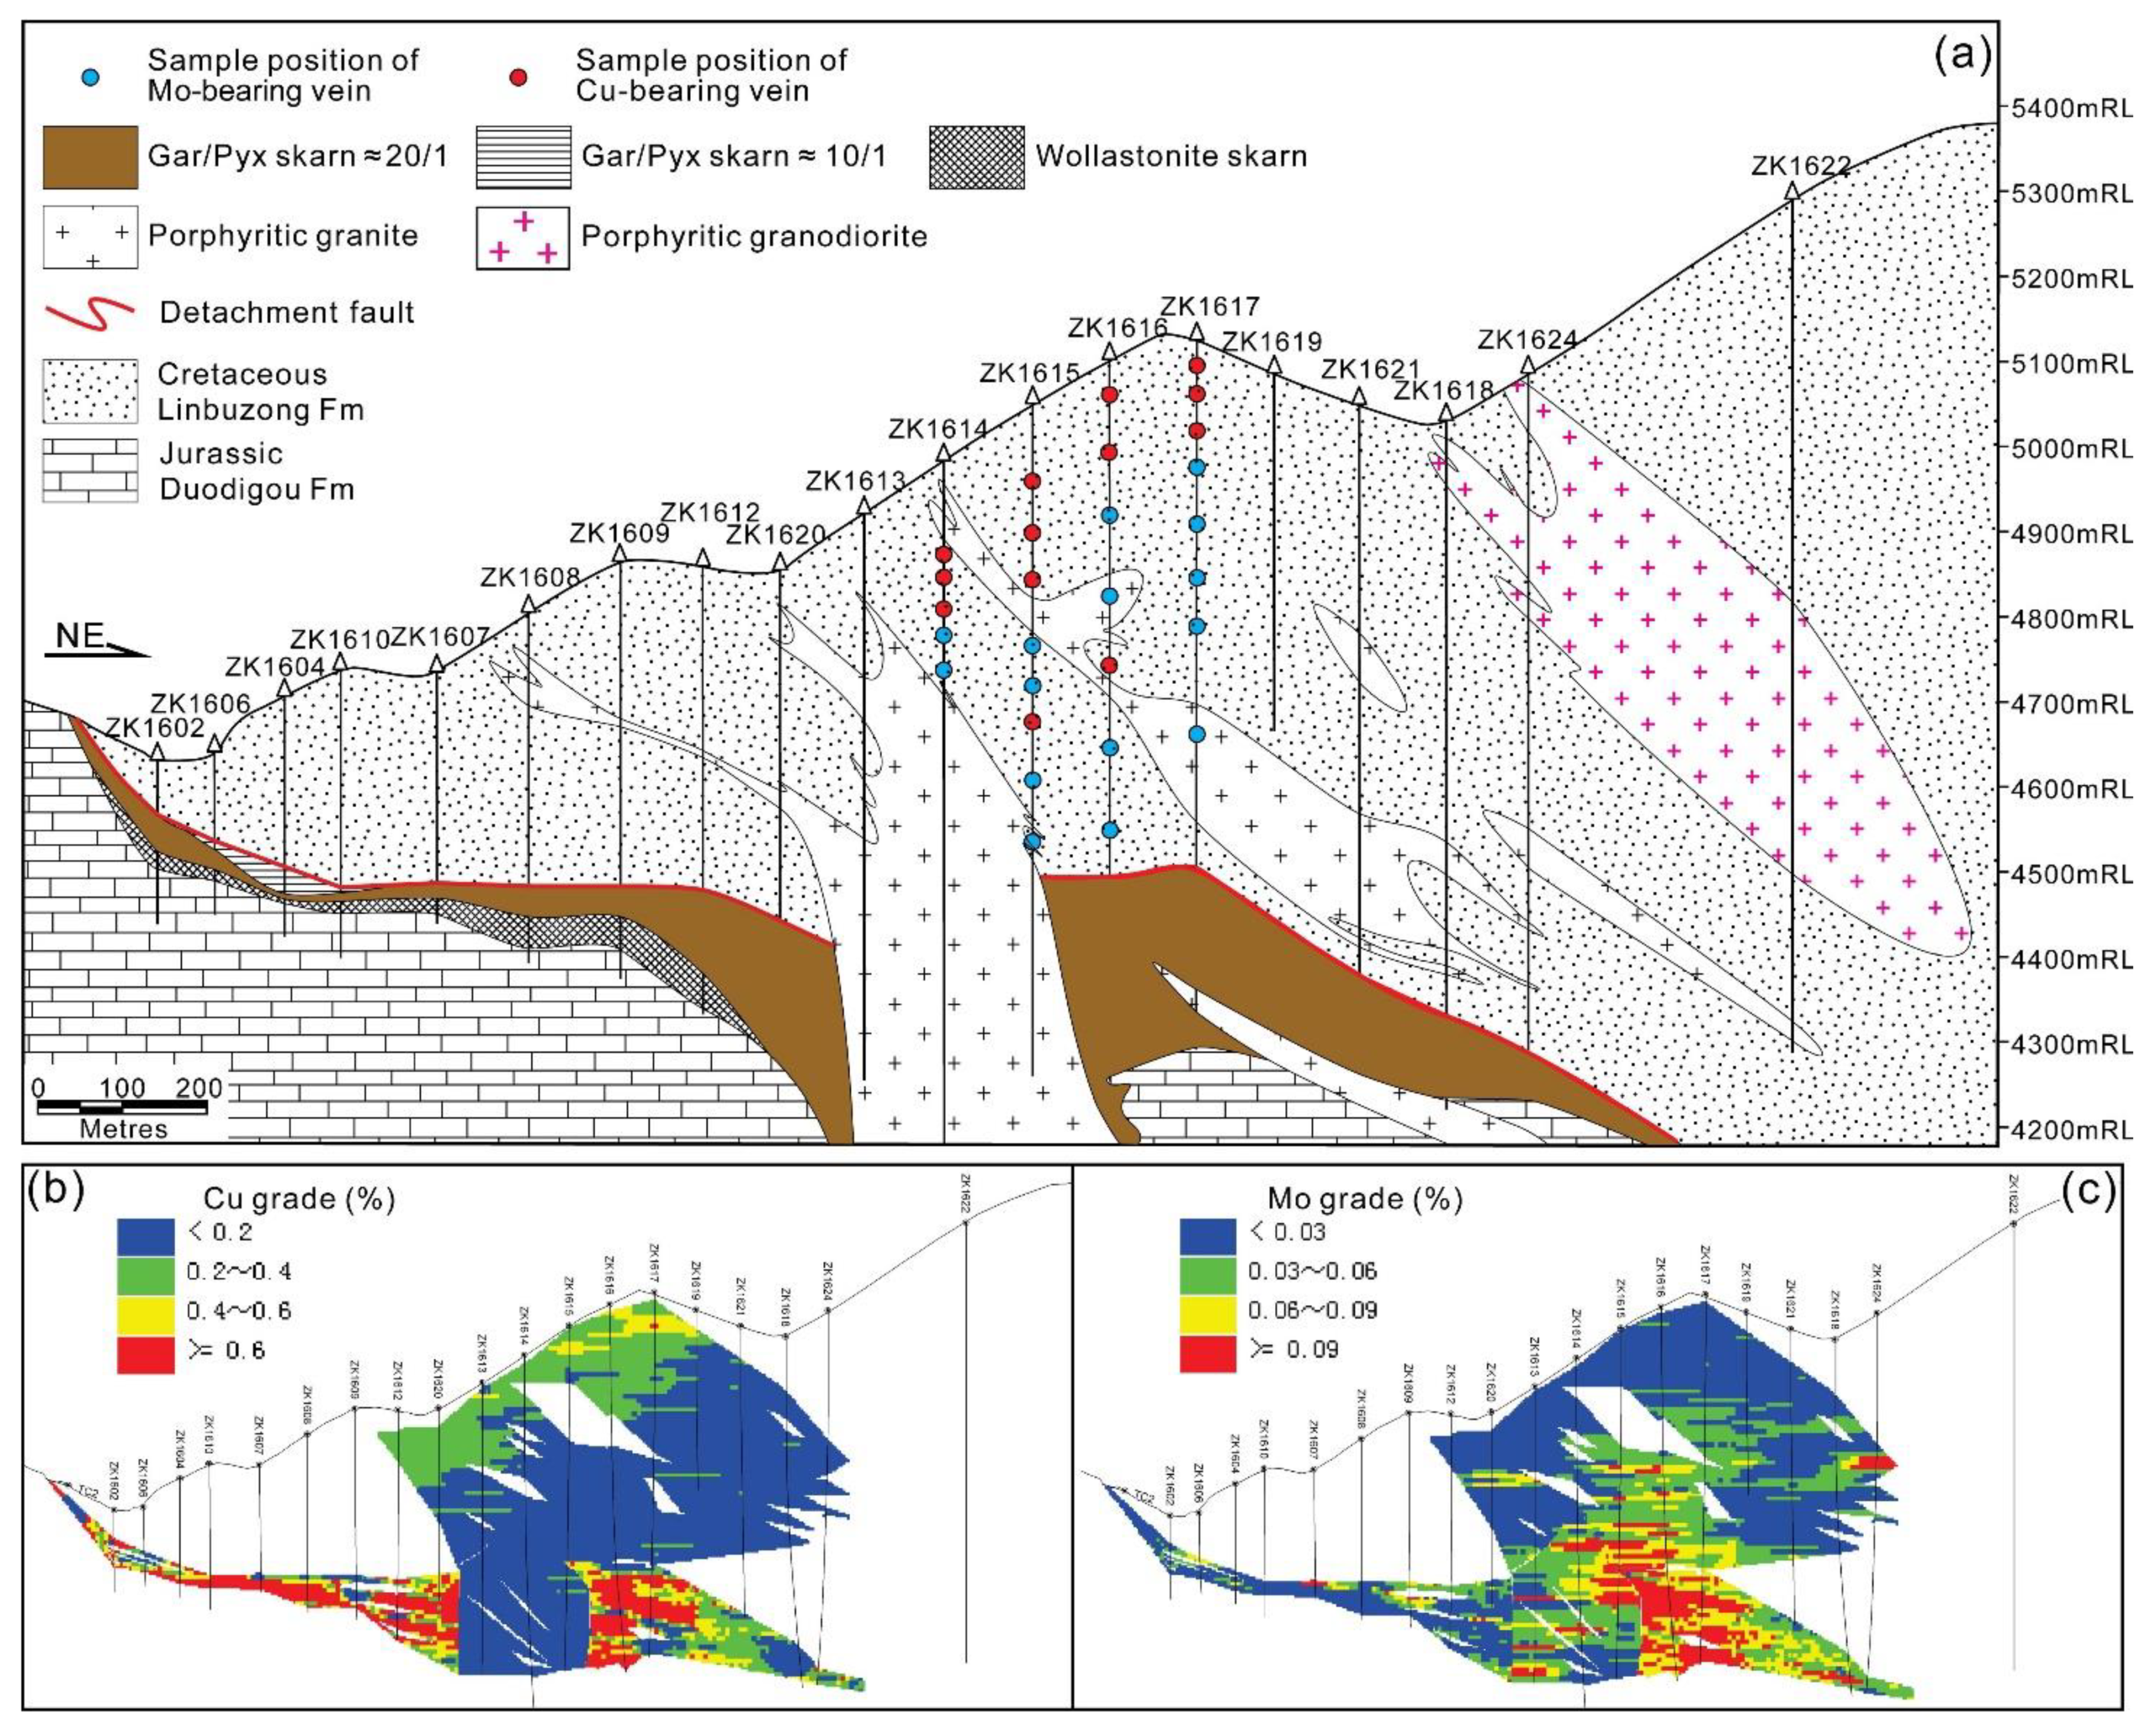
3.1. Spatial Relationships

The porphyry–hornfels orebody formed during fracturing related to fluid overpressure at the top of the magma chamber during the emplacement of the porphyry. This resulting in the development of a cylindrical-shaped fracture zone allowing passage of overpressured mineralized fluids [9,39].
The maximum vertical thickness of the orebody is 940 m. At an elevation >4800 m, the orebody is 200–400 m thick, contains 0.3–0.5% Cu and <0.03% Mo, and is hosted by biotite hornfels and the porphyry (Figure 4). The orebody is 400–570 m thick at an elevation of <4800 m, with an average grade >0.06% Mo and <0.2% Cu (Figure 2b,c and Figure 3b,c). The host rocks are felsic and diopside hornfels and the porphyry (Figure 4).

3.2. Temporal Relationships

Detailed logging and over 100 samples of drill hole were collected from the Jiama area for petrological studies. The study indicates that the porphyry–hornfels orebody can be divided into two relatively separate an early Cu and a later Mo mineralizing events (as mentioned above). This includes a progression of: Cu–I → Cu–II → Mo–I → Mo–II → Cu–III → Mo–III stages. These are discussed below, starting from the relatively oldest stage progressing to the youngest.

3.2.1. Characteristics of the Cu Stages

The Cu–I and Cu–II stages in the progression represent the main Cu mineralizing event at Jiama. The Cu–I stage consists of fine-grained disseminated chalcopyrite, pyrite, and a small amount of quartz, hosted by banded biotite hornfels associated with framboidal albite. The Cu–II stage consists of crosscutting <1 mm thick pyrite–chalcopyrite–quartz veins, which cuts the disseminated sulfides of the first stage (Figure 5a–d,j–l).
The Cu–III stage crosscuts the main Mo stages and is earlier than the last Mo stage. This stage is characterized by subvertical quartz–pyrite–chalcopyrite veins that are up to 10 mm wide, contain medium-grained chalcopyrite, and are commonly characterized by a miarolitic cavities (Figure 5e–f).

3.2.2. Characteristics of the Mo Stages

The first Mo stage is represented by <10 mm thick quartz–molybdenite veins that are straight and dip <40° NE. The molybdenite is fine-grained and commonly concentrated at the contact between the veins and wall rocks (Figure 5g).
The second (Mo–II) stage is the main Mo mineralizing event forming a stockwork or conjugate set of <10 mm thick quartz–molybdenite veins, which dip 40°–70° N and ENE (Figure 5h). The veins are irregular, and mineralization is richest where veins are narrow or at their intersections containing medium-sized molybdenite.
The third (Mo–III) stage consists of irregular quartz–molybdenite veins with dips of generally >70° with widths of <10 mm (Figure 5f,i). The molybdenite grains are medium-sized and either disseminated in the veins or in a linear distribution along the center of the veins. This is also an important Mo stage that crosscuts the Mo-II stage.

4. Fluid Inclusions Study

4.1. Sample Selection

The focus of the fluid inclusion study is the paragenesis of the Cu–II, Cu–III, Mo–I, Mo–II, and Mo–III stages using quartz crystals from each stage. Representative samples of the porphyry–hornfels orebody were uniformly selected from the No. 16 cross-section through the center of the orebody and includes 13 drillhole core samples from the Cu stages and 15 from the Mo stages (Figure 2a).

4.2. Analytical Methods

4.2.1. Petrography and Microthermometry

Petrographic observations of the rock samples were completed using 0.3-mm-thick double-sided polished sections and a LEIKA DM2500P microscope with a magnification of 100–1000 times. The inclusion type, shape, size, filling percentage, and other characteristics were recorded.
Fluid inclusion phase changes during heating and freezing cycles were determined on a dual-purpose heating–freezing stage at the Department of Geology, Chengdu University of Technology, Chengdu, China. Firstly, the fluid inclusions were classified under a LEIKA DM2500P microscope, and the inclusions with a clear gas–liquid boundary that were suitable for microthermometry were selected. Then, the temperature was measured on a Linkam-THMS600 heating–freezing microscope (temperature range: −196 °C–+600 °C), produced in England. Between −120 °C and −70 °C, the determination accuracy is 0.5 °C. The accuracy of determination at −70 °C–+100 °C is 0.2 °C. The accuracy of determination at 100 °C–500 °C is 2 °C. During the test, the rate of temperature rise/fall is between 0.5 °C–15 °C min−1, and the rate near the phase transition point decreases to 0.2 °C–1 °C min−1.

4.2.2. Laser Micro-Raman Spectra Analyses

Laser Raman spectroscopy analysis of fluid inclusions was conducted at the Chengdu Institute of Geology and Mineral Resources, Chinese Geological Survey, Chengdu, China. The experimental instrument is a Renishaw RM2000 laser Raman probe, made in England. Experimental conditions: temperature: 23 °C, Ar ion laser (514.5 nm), laser power: 40 mw, scanning speed: 10 s/3 times superposition, spectrometer slit: 10 um.

4.2.3. SR–XRF Analyses

Trace elements were analyzed by SR–XRF mapping and in situ sampling of single inclusions at the Institute of High Energy Physics, Chinese Academy of Sciences, Shanghai, China. The analytical instrument is synchrotron radiation X-ray fluorescence microprobe (SR–XRF), and the experimental method is micro-beam X-ray fluorescence analysis (μ–XRF). In situ nondestructive analysis is carried out to test the element composition and its two-dimensional distribution characteristics in the sample. The X-ray source used in the experiment comes from a 4W1B beam line focused by a K-B mirror in the Shanghai Synchrotron Radiation Facility (SSRF). The electron energy of BEPC storage ring is 2.2 GeV, the beam intensity is 60–120 mA, the photon energy is 14.04 keV, the spot size is about 2 μm × 2 μm, and its spatial resolution is up to 2 μm. The detection limit is 10−10–10−12 g, and the relative concentration is 10−6. The magnification of the microscope in the microscopic observation system is 140 times, and the energy resolution of the detector is 140 eV. The NIST SRM612 and NIST SRM614 glass samples synthesized by the National Bureau of Standards were used to correct the test results.

4.3. Analytical Results

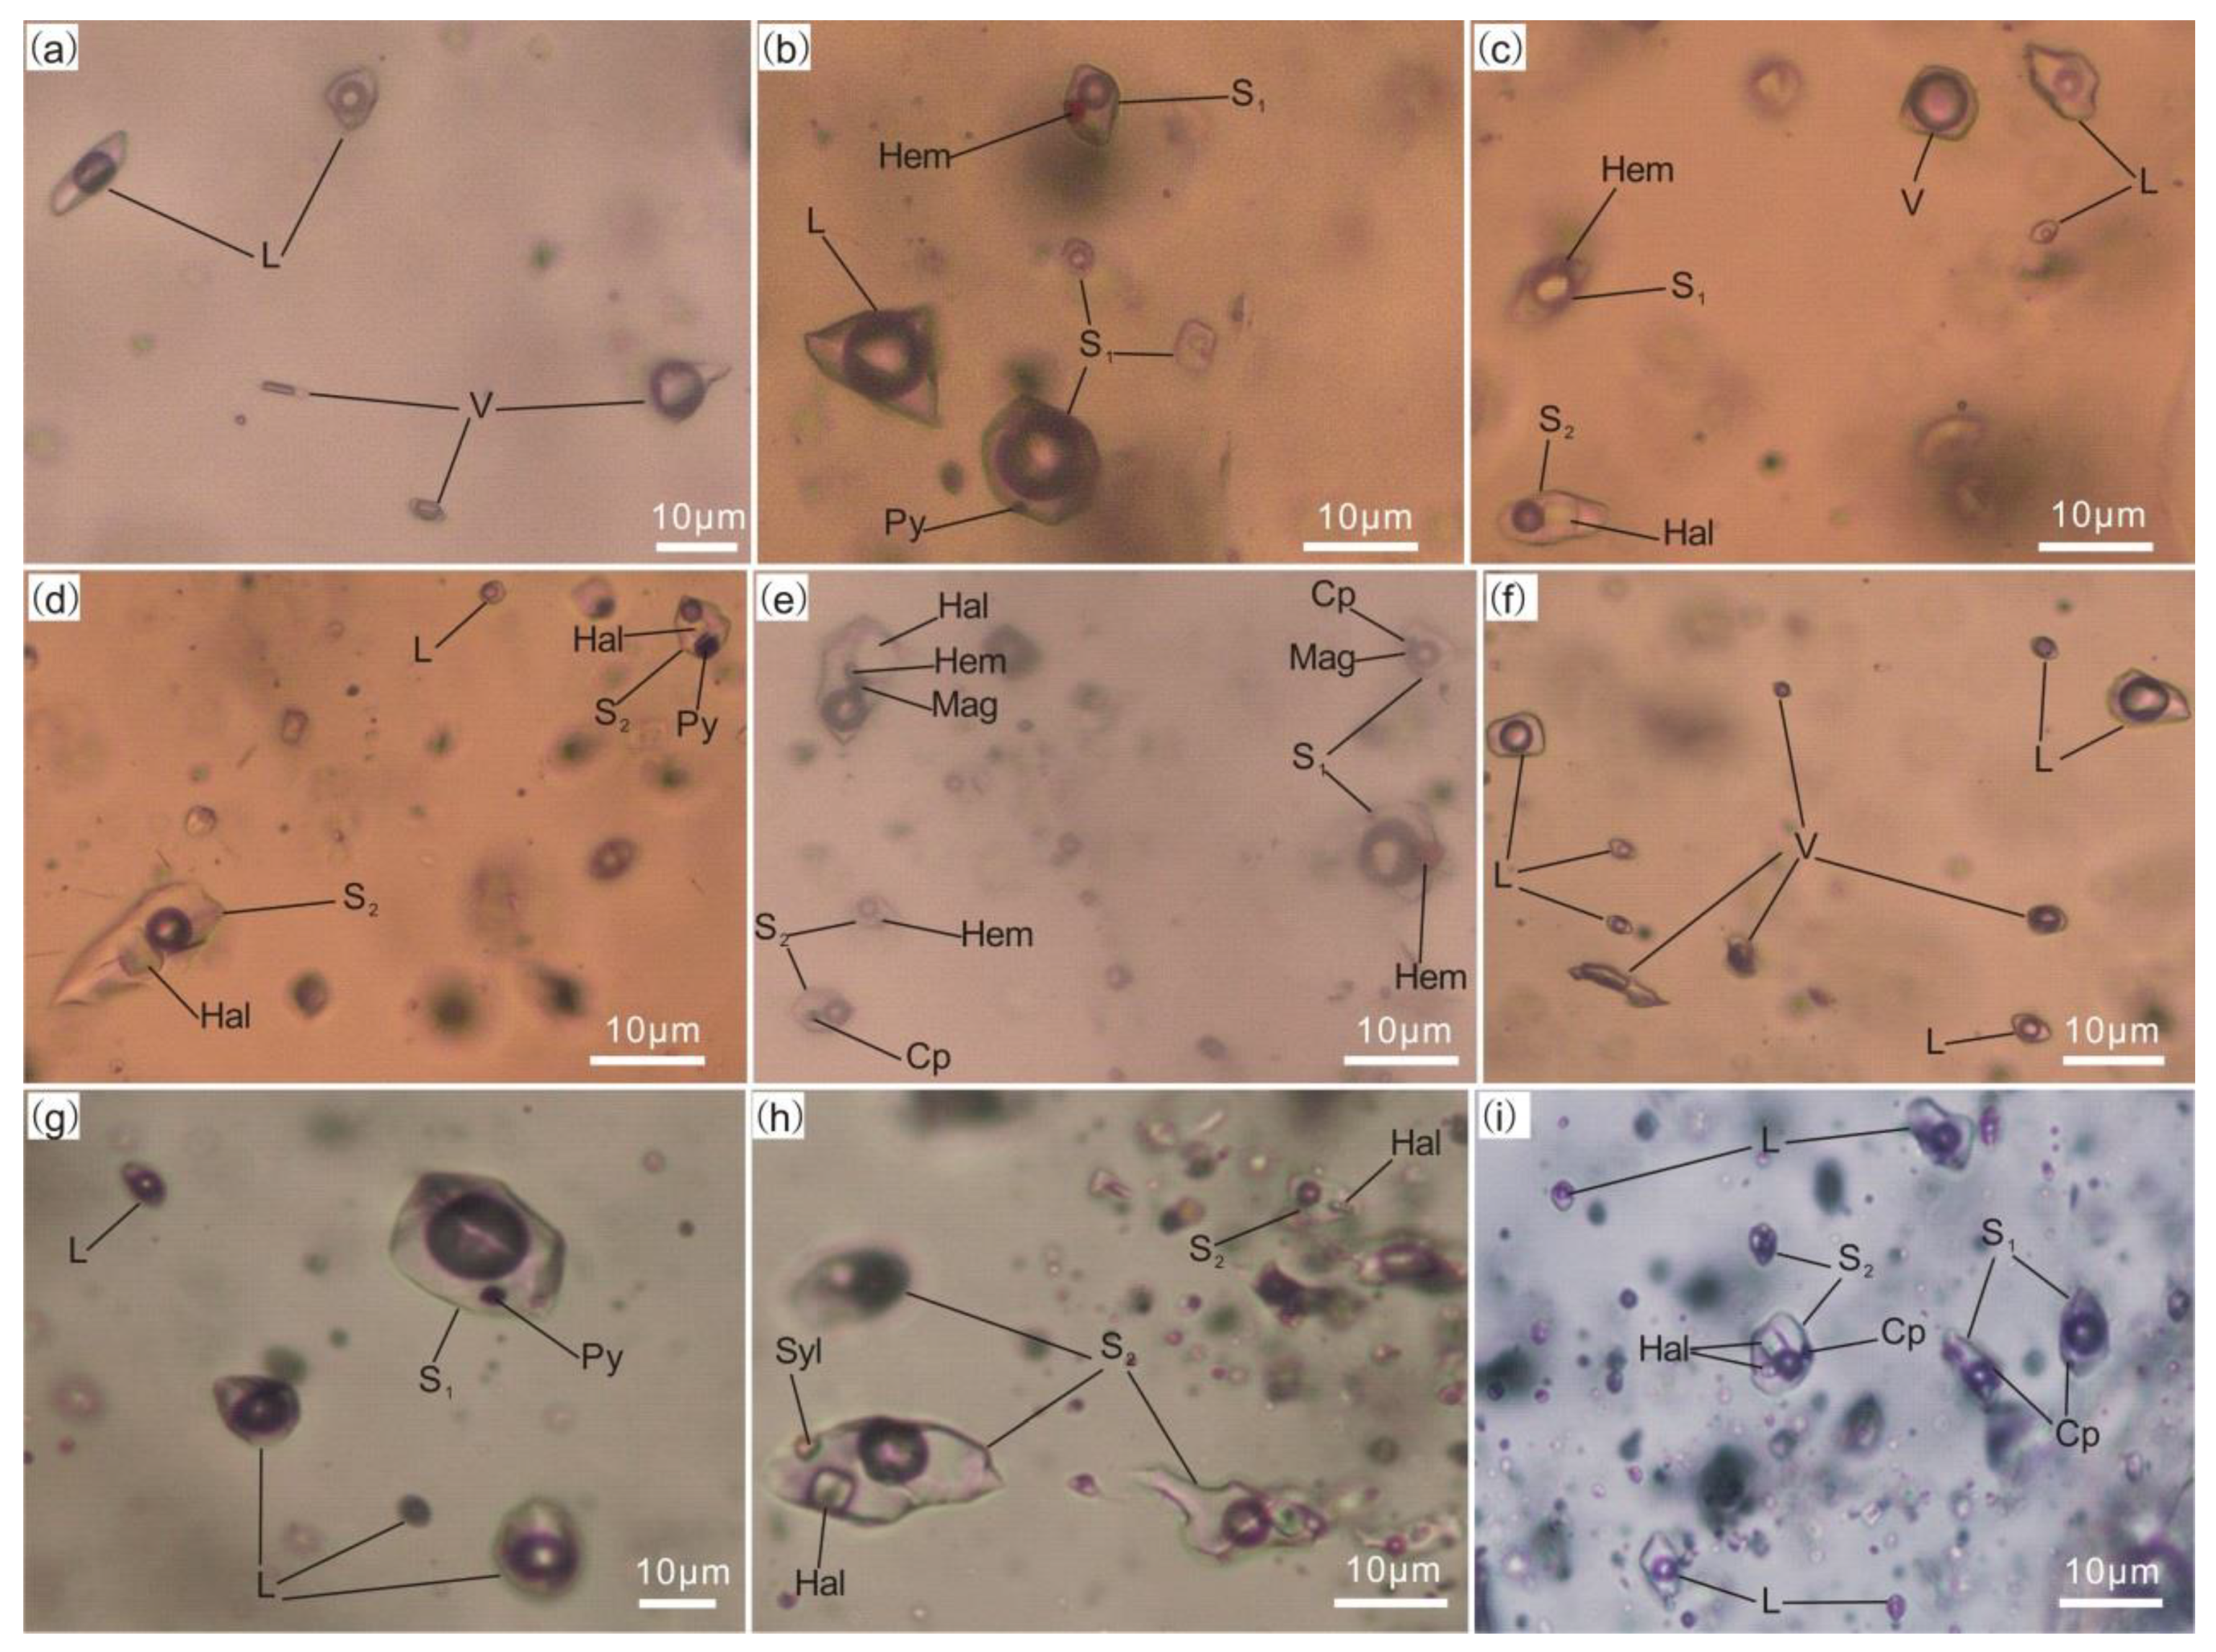
4.3.1. Petrography and Microthermometry

Fluid inclusions in quartz from the porphyry–hornfels include liquid (L), vapor (V), and solids (S) based on their phase state and percentage of vapor–liquid filling at room temperature. The L-type inclusions contain vapor and liquid phases at room temperature with 10–50% vapor. The inclusions are 5–40 μm in diameter, irregular or oval, and negative crystals (Figure 6a–d,f,g,i). The temperature at which Cu-stage inclusions convert to homogeneous as a liquid upon heating is 229°–478°. The temperature at which Mo-stage inclusions convert to homogeneous as a liquid upon heating is 189°–427° (Table 1).
The V-type inclusions are two-phase vapor–liquid inclusions at room temperature, with 60–80% vapor. The inclusions are 5–35 μm in size and mostly irregular, spindle-like, and rectangular (Figure 6c,f). The temperature at which V-type inclusions convert to homogeneous as vapor upon heating in Cu stage and Mo stage is 328°–415° (Table 1).
The S-type inclusions are multi-phase fluid inclusions containing vapor–liquid–solid at room temperature. The S-type inclusions can be divided into S1 and S2 types based on their daughter minerals. The S1-type inclusions are 10–25 μm in size, generally irregular in shape, and negative crystal. Vapor constitutes 35–60% of the inclusion, which contains only opaque irregular, triangular, or cubic daughter minerals. The grain size of the daughter minerals is <8 µm (Figure 6b,c,e,g,i). The S2-type inclusions are <40 μm in size, generally irregular in shape, and negative crystal. The vapor constitutes <30% of the inclusion that contains halite, sylvite, hematite, anhydrite, pyrite, magnetite, and chalcopyrite (Figure 6c,d,h,i).
Fluid inclusions in the quartz veins from the Cu stage are mainly isolated or linearly distributed, with some veins showing a scattered distribution. The inclusions are irregular or spindle-like in shape and generally small (commonly 10 to 20 μm in size). The inclusions are predominantly L-type, which account for ~65% of the total fluid inclusions, followed by the V- (~25%) and S- (10%) types. The S1-type inclusions account for ~80% of the S-type, and contain daughter minerals such as hematite, magnetite, anhydrite, and chalcopyrite. The S2-type inclusions are rare, accounting for ~3% of the total S-type inclusions (Figure 6b–e).
Fluid inclusions in quartz veins from the Mo stage are relatively large (~15 μm). L-type inclusions (~60%) are the most common in this stage, with lesser S-types (~25%) and V-types (~15%). The S-type inclusions are mainly S2-type, accounting for ~20% of the total, and contain daughter minerals such as in inclusions from the Cu-bearing veins, although daughter minerals such as magnetite, hematite, and anhydrite, as well as oxidized minerals, are markedly lower in the Mo-bearing veins than in the Cu-bearing ones (Figure 6g–i).
The temperature, pressure, and salinity estimates for the different fluid inclusion types are presented in Table 1.

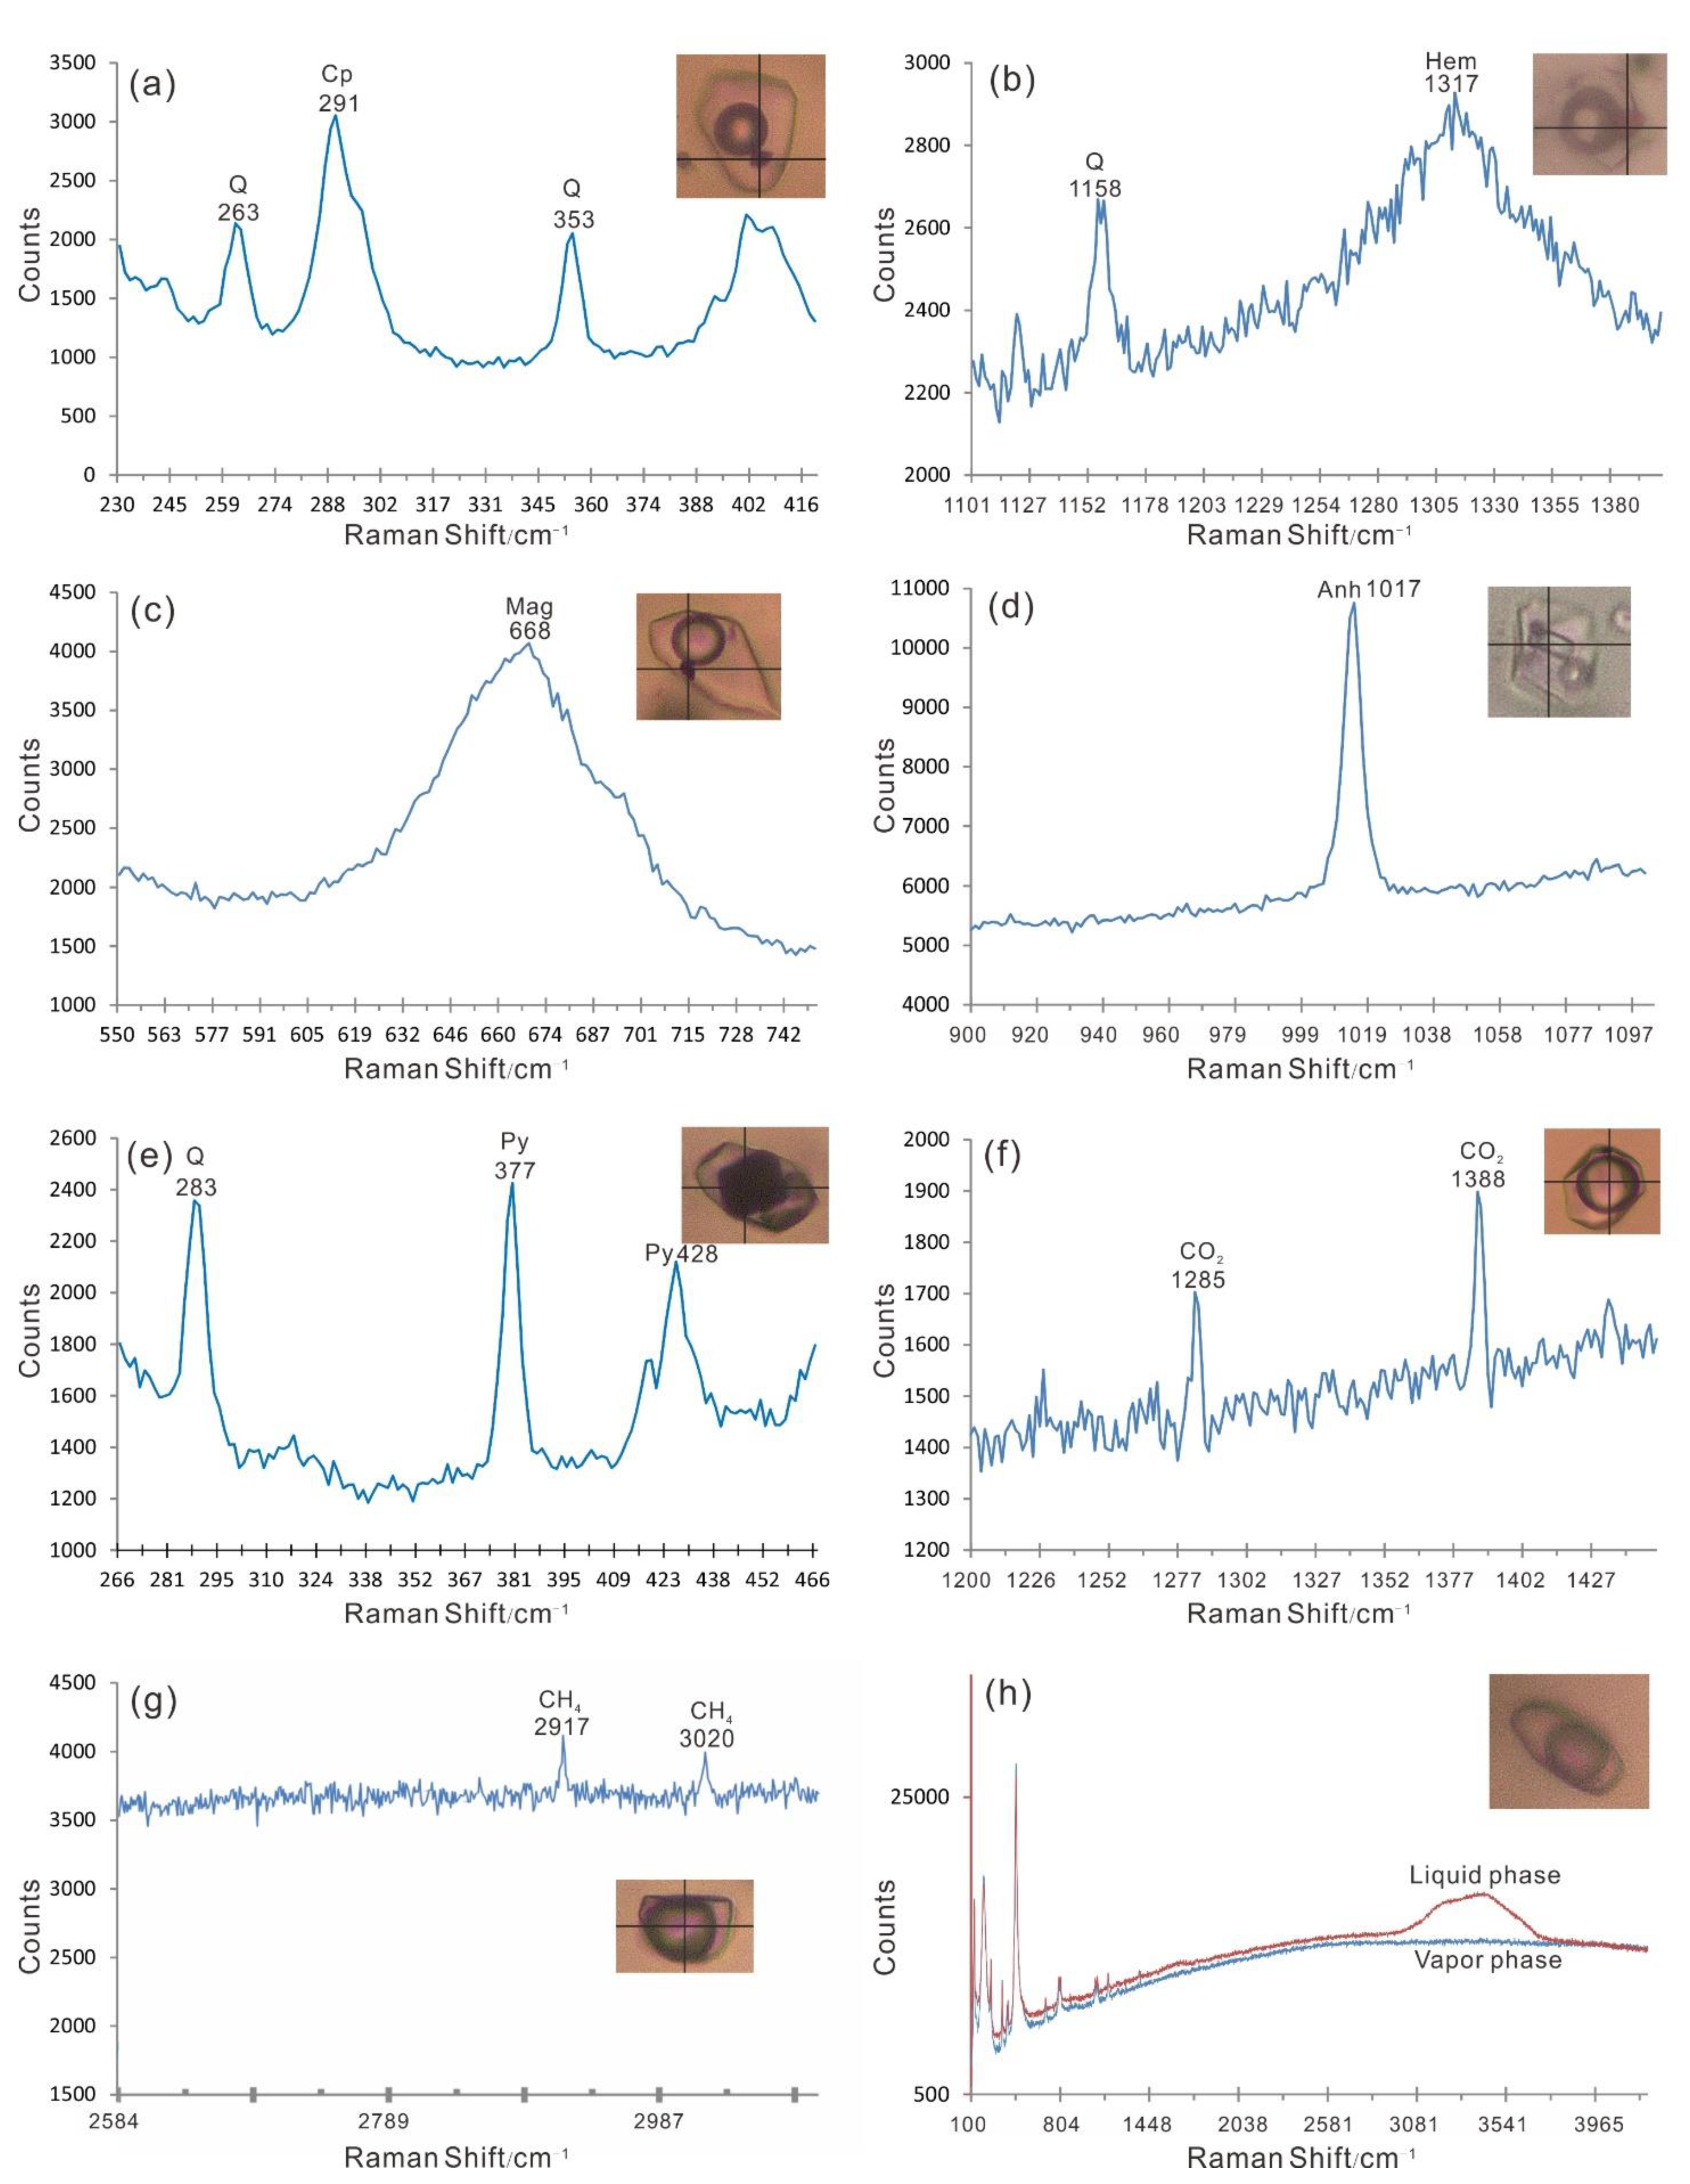
4.3.2. Laser Micro-Raman Spectra

The Raman spectrum analysis was conducted at room temperature on daughter minerals in the Cu- and Mo-bearing quartz veins. Chalcopyrite, hematite, magnetite, anhydrite, and pyrite were identified by fitting the Raman shift curve (Figure 7a–e; [40]. In combination with detailed microscopic identifications, the daughter minerals were found to be predominantly distributed in the Cu-stage quartz veins, and rarely in the Mo-stage quartz veins. Carbon dioxide peaks were detected in 10 V-type inclusions of the Cu stage, but CH4 peaks were not detected (Figure 7f). Carbon dioxide peaks were also detected in five V-type inclusions of the Mo stage, and three of these inclusions have CH4 peaks (Figure 7g). In addition, broad H2O peaks were detected in L-type inclusions from the quartz veins of the Cu and Mo stages (Figure 7h).

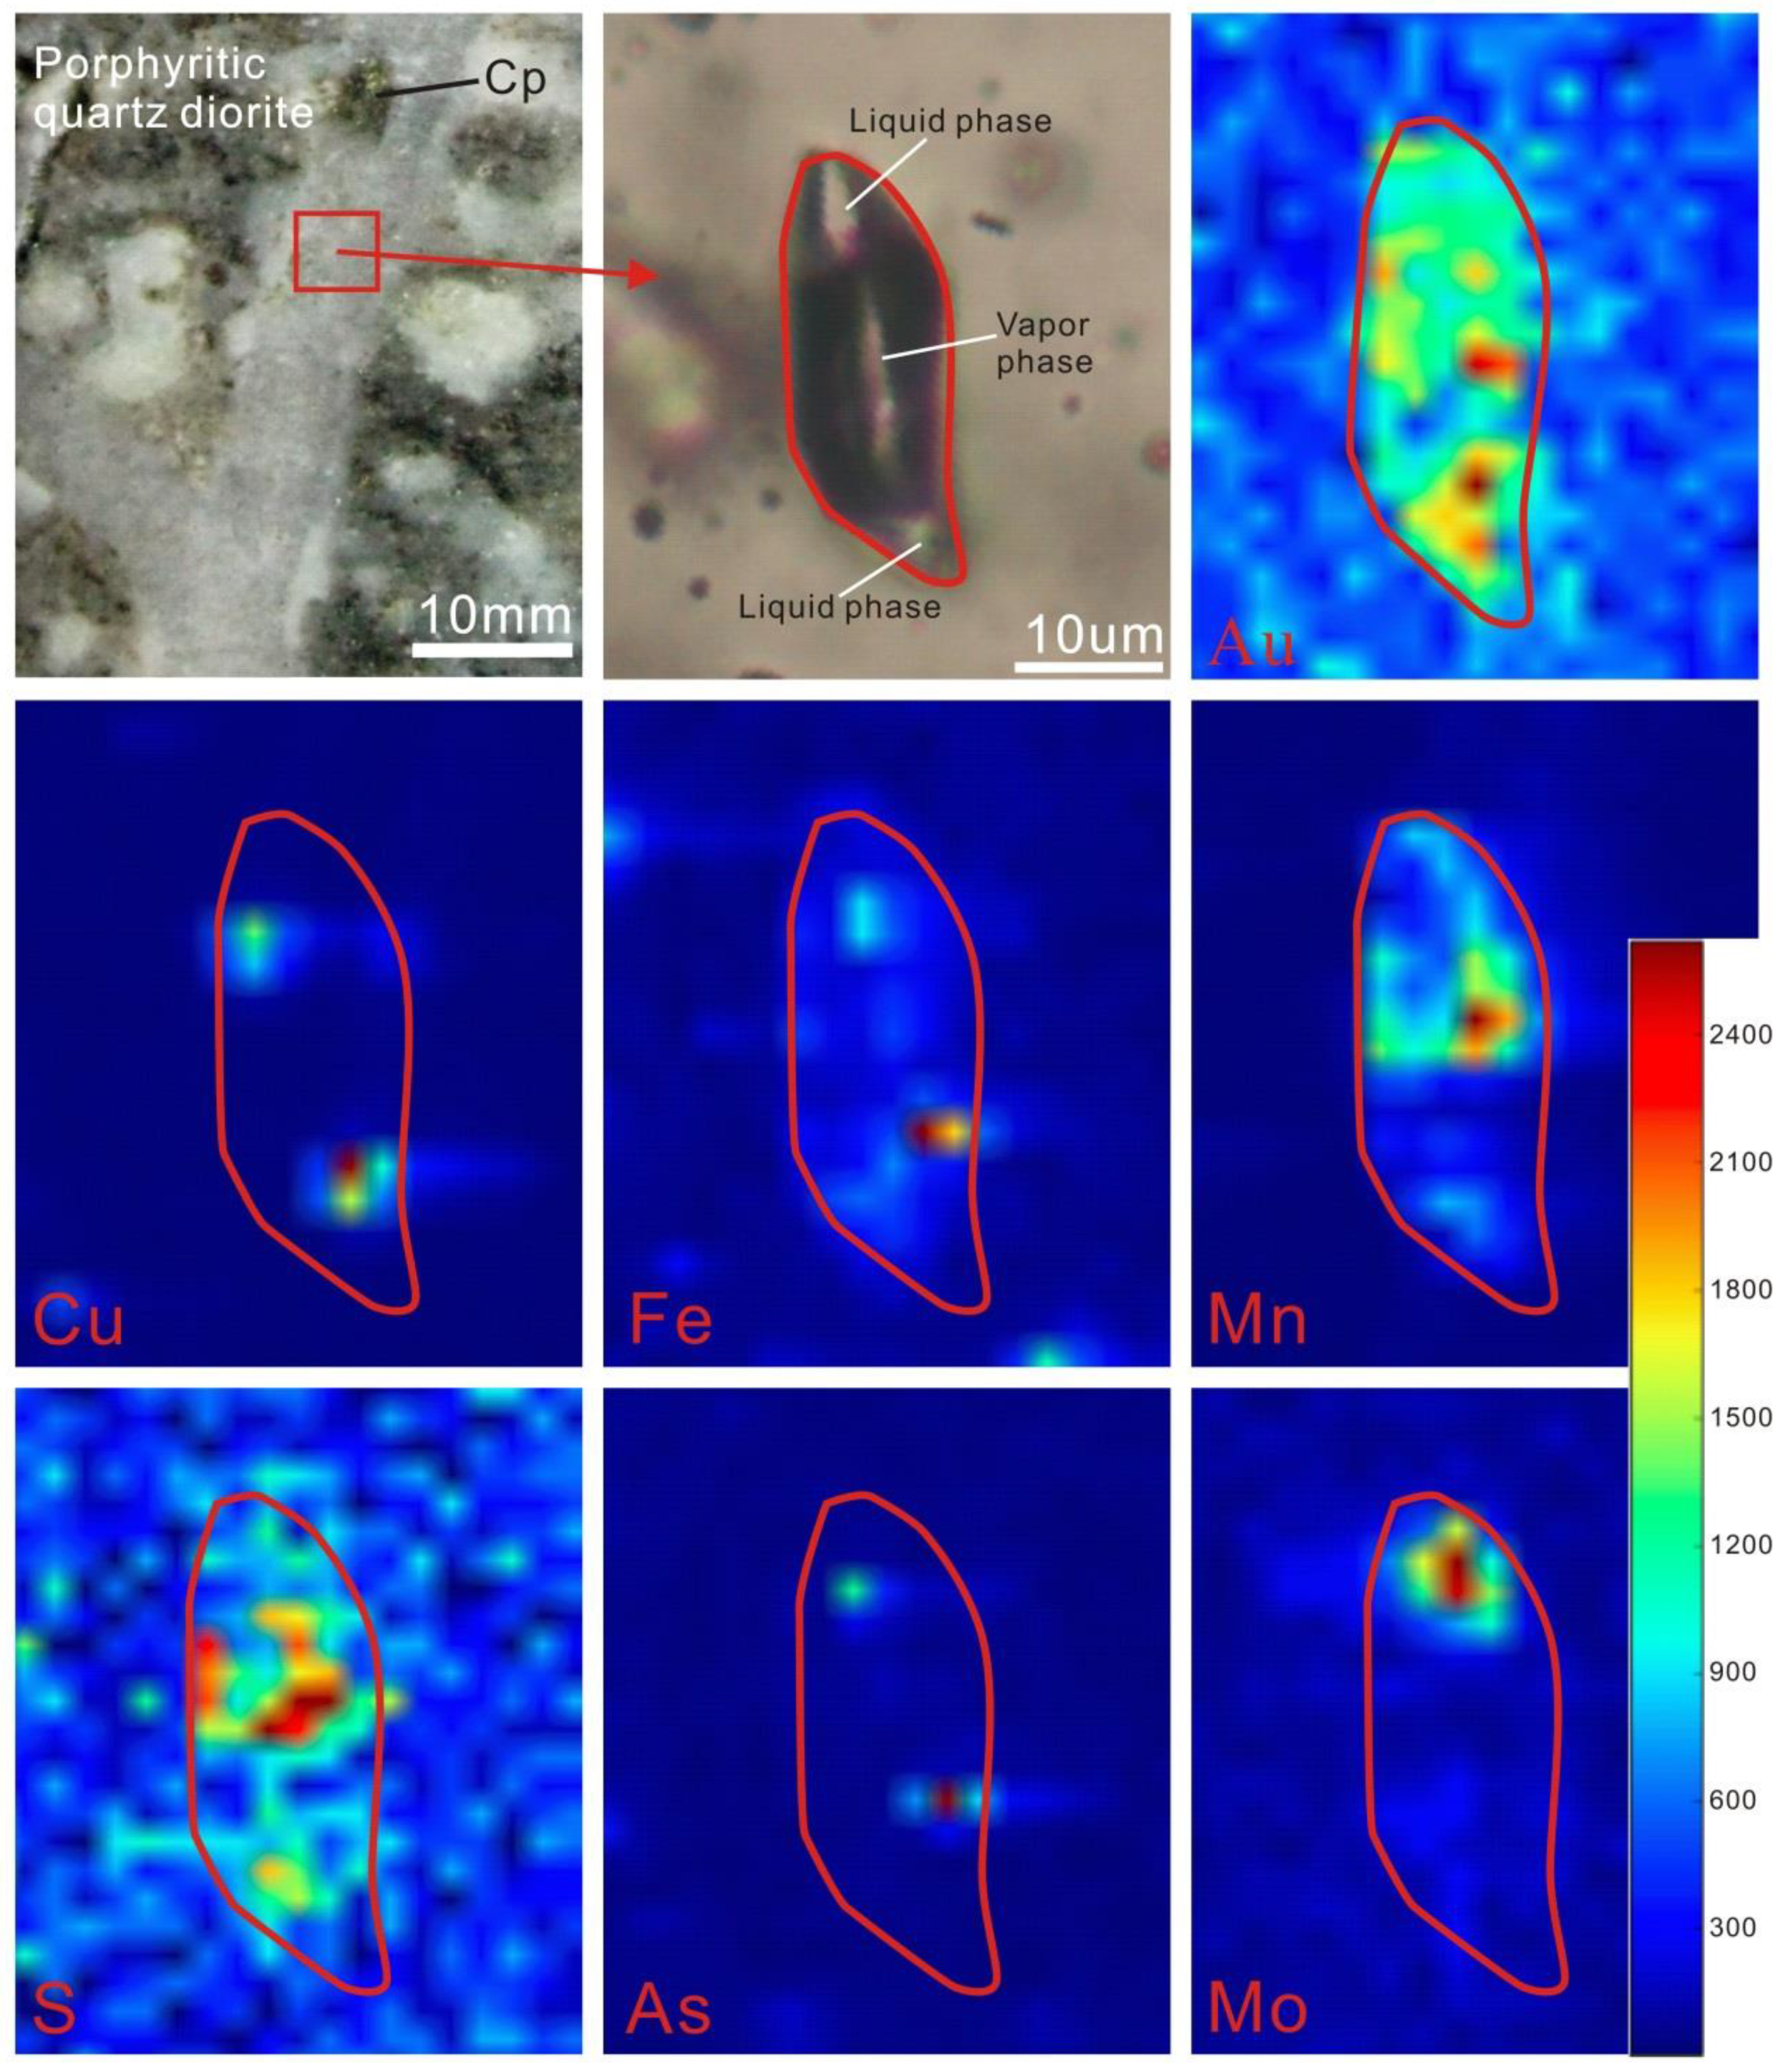
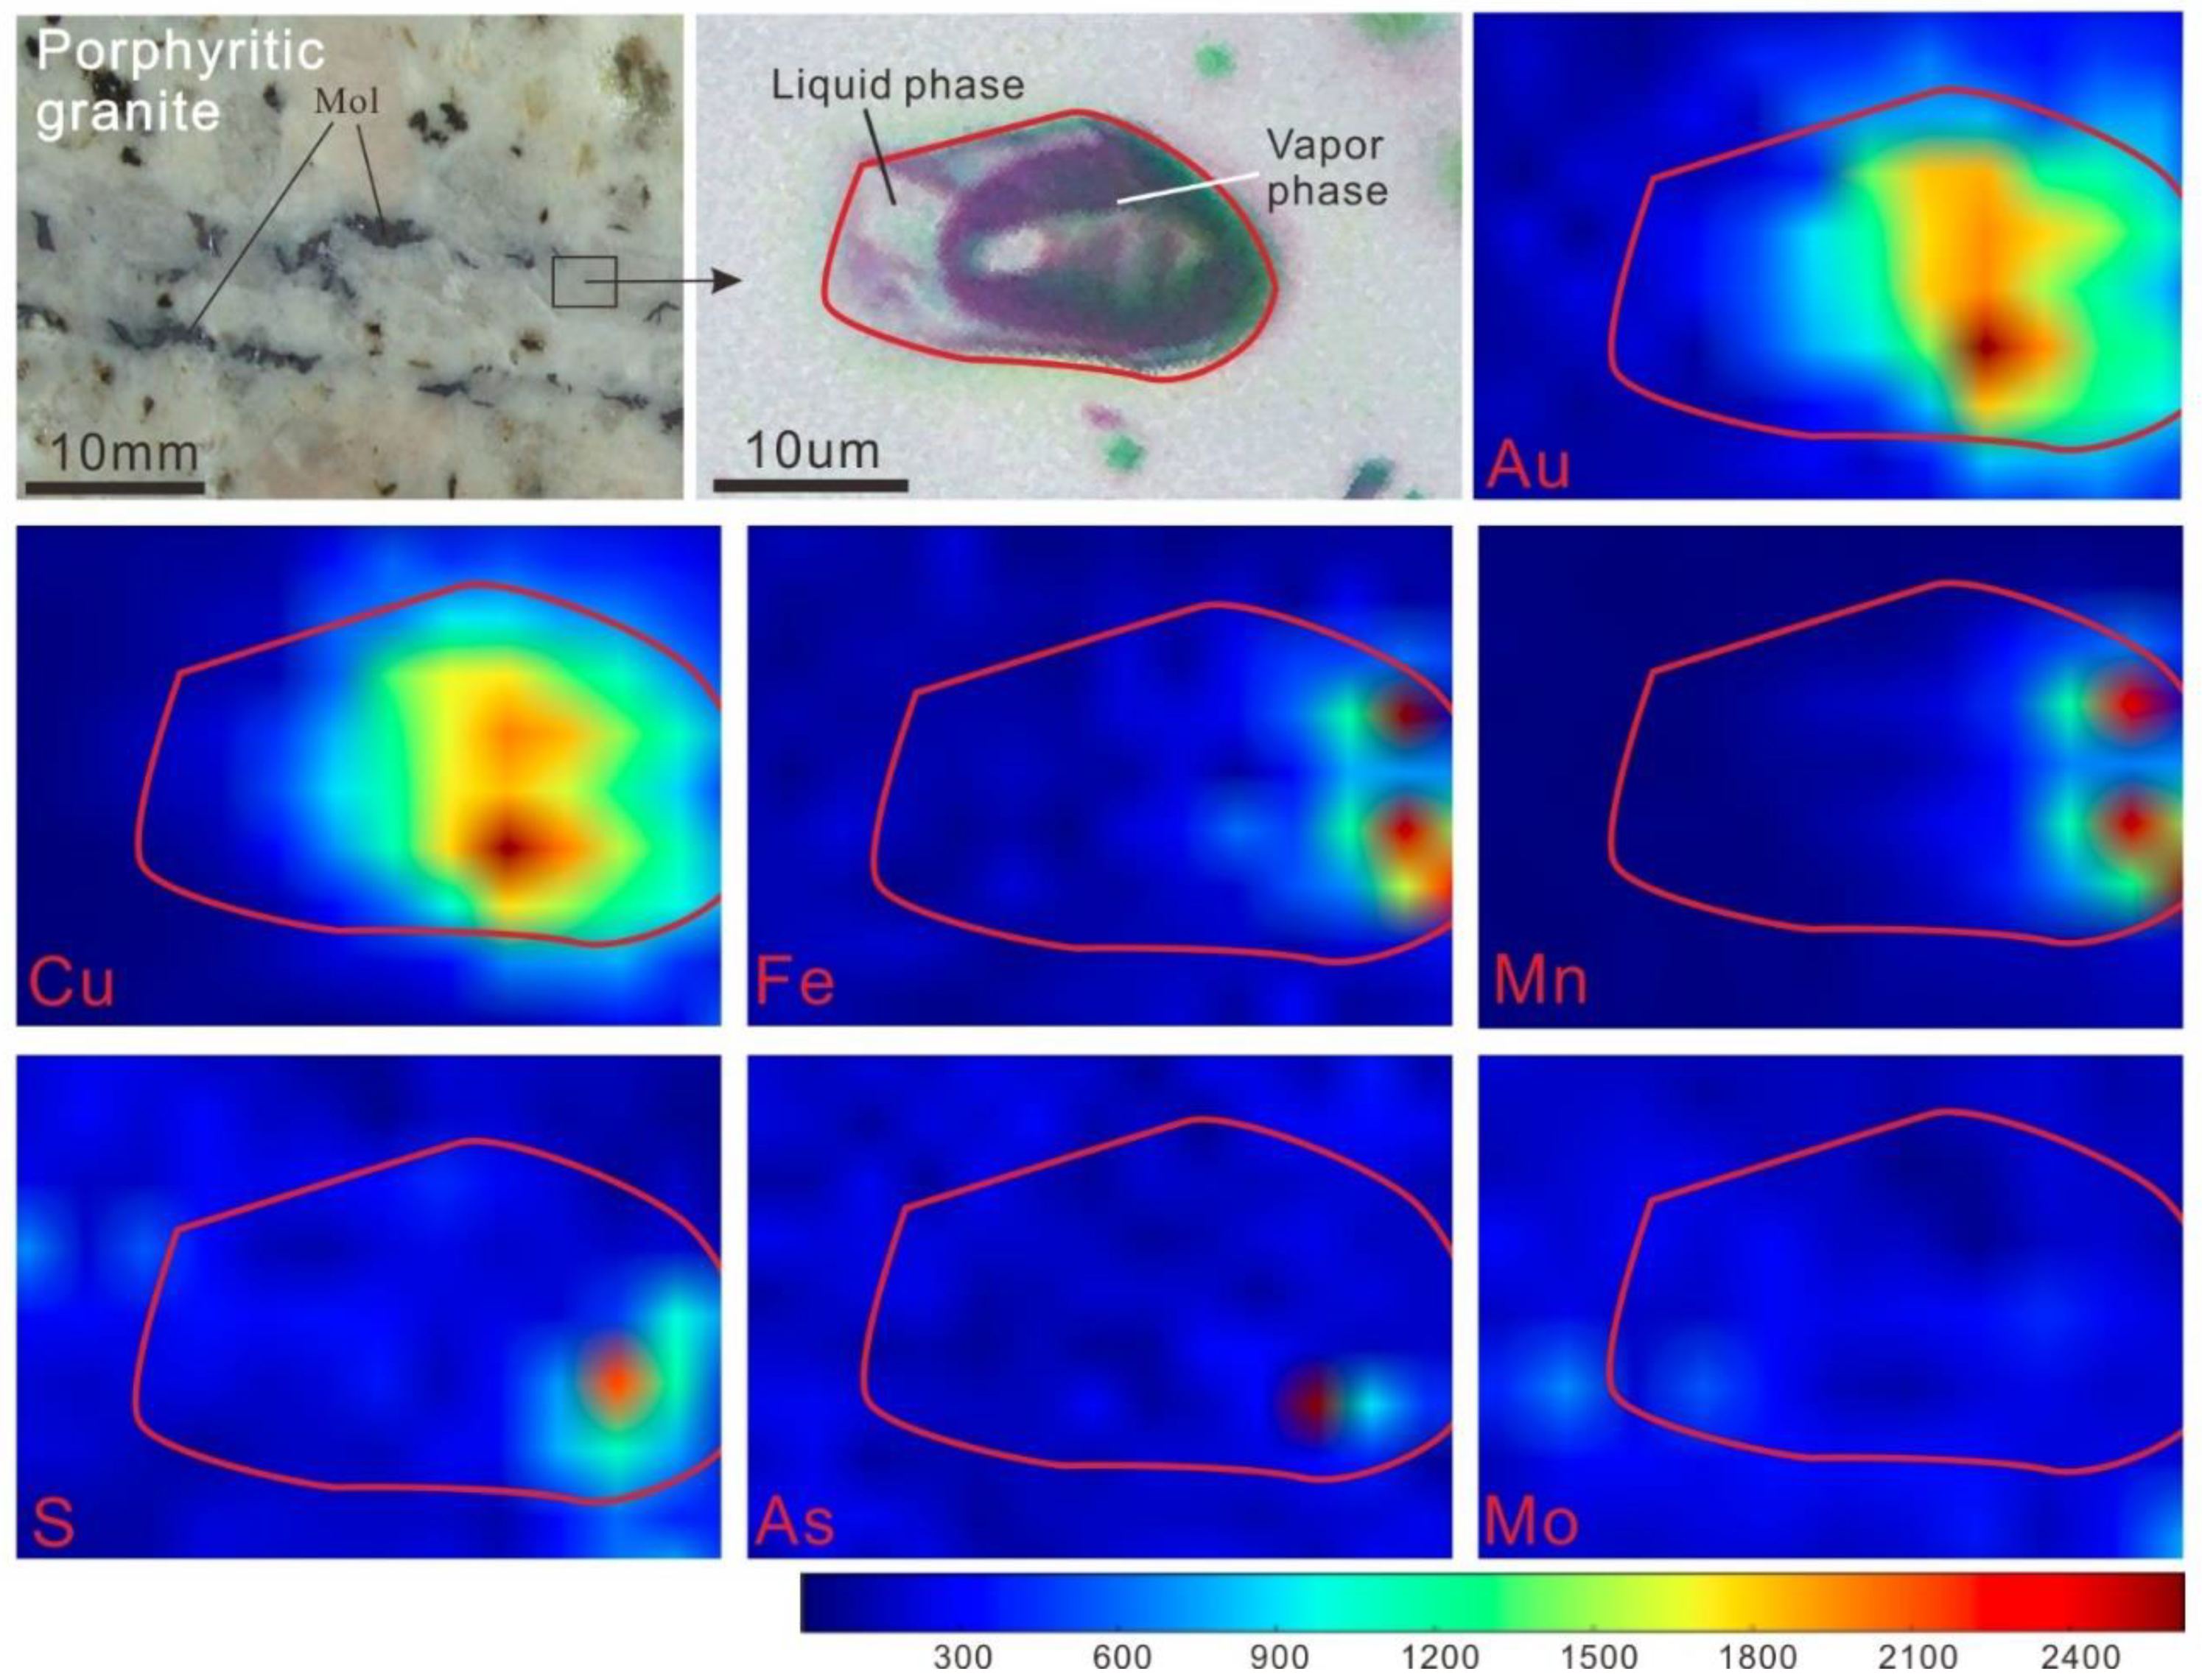
4.3.3. SR–XRF Mapping

The fluid inclusions in the Cu-bearing quartz veins from the porphyritic quartz diorite and Mo-bearing quartz veins from the porphyritic granodiorite were analyzed using Synchrotron radiation X-ray fluorescence (SR–XRF). The fluid inclusions were analyzed for Au, Cu, Fe, Mn, Mo, S, and As to study the proportions and nature of ore-forming elements in them.
The relative concentrations of Cu and Fe in the Cu-bearing quartz veins are low in the vapor–liquid phase. The concentration of Mo in the liquid phase is relatively high and very low in the vapor phase. Relative concentrations of Au are high in the vapor–liquid phase. The relative concentration of S in the vapor phase is much higher than that in the liquid phase (Figure 8).
In the Mo-bearing quartz veins, the relative concentrations of Mo are low in the vapor–liquid phase. In contrast, Cu and Fe are relatively high in the vapor phase and very low in the liquid phase. The relative concentrations of Au are high in the vapor phase and low in the liquid phase, and the relative concentrations of S are much higher in the vapor phase than in the liquid phase (Figure 9).

5. Discussion

5.1. Magmatic Metal Fractionation and Magma Evolution

Tang et al. [38] relate igneous rocks in the Jiama area with the genesis of the ore, and divided them into an early Cu mineralization associated with porphyritic quartz diorite and porphyritic granodiorite, and a later Mo mineralization associated with porphyritic monzonite to quartz monzonite and porphyritic granodiorite (Figure 2 and Figure 3). The differences in the ore that formed during the two stages depend on the geochemical behavior of the metals during the crystallization of the magma. In a series of experiments conducted at 750 °C and 1.4 kbar, Candela and Holland [41] measured the extent to which Cu and Mo are partitioned between granitic melt and coexisting aqueous fluids containing both Cl and F. These experiments showed that the partitioning of Cu is strongly controlled by the concentration of Cl, defined by the equation D C u F l u i d / m e l t   = [Cl]. In contrast, partitioning of Mo is relatively unaffected by the concentration of Cl, and can be expressed by the relationship D M o F l u i d / m e l t = 2.5. Using these criteria, Cu being a compatible element is more readily partitioned into the fluid during the early stages of magmatic crystallization. This results in Cu mineralization concentrating in early granitic stocks or dykes. In contrast, Mo being an incompatible element tends to remain in the melt, causing a sharp decrease in the Cu/Mo ratio. Mo becomes saturated during the later stages of magmatic crystallization and concentrates in more felsic granite or dykes.
The different ages of plutonic rocks that are sources for Cu and Mo are an important factor in their temporal separation. In addition, the oxygen fugacity (fO2) of the magma plays an important role in elemental separation [42,43,44]. Fluid inclusions in the Cu-mineralized quartz veins contain hematite, magnetite, and anhydrite, indicating that the magma was oxidized during the early stages (Figure 6b–e and Figure 7b–d). The distribution capacity of Cu in fluids is strengthened with a high fO2, whereas the fluid inclusions in the Mo-mineralized quartz veins contained an abundance of pyrite, CO2, and CH4 (Figure 6g and Figure 7e–g), which indicate that the magma was reducing and felsic in composition during deposition of Mo [45].

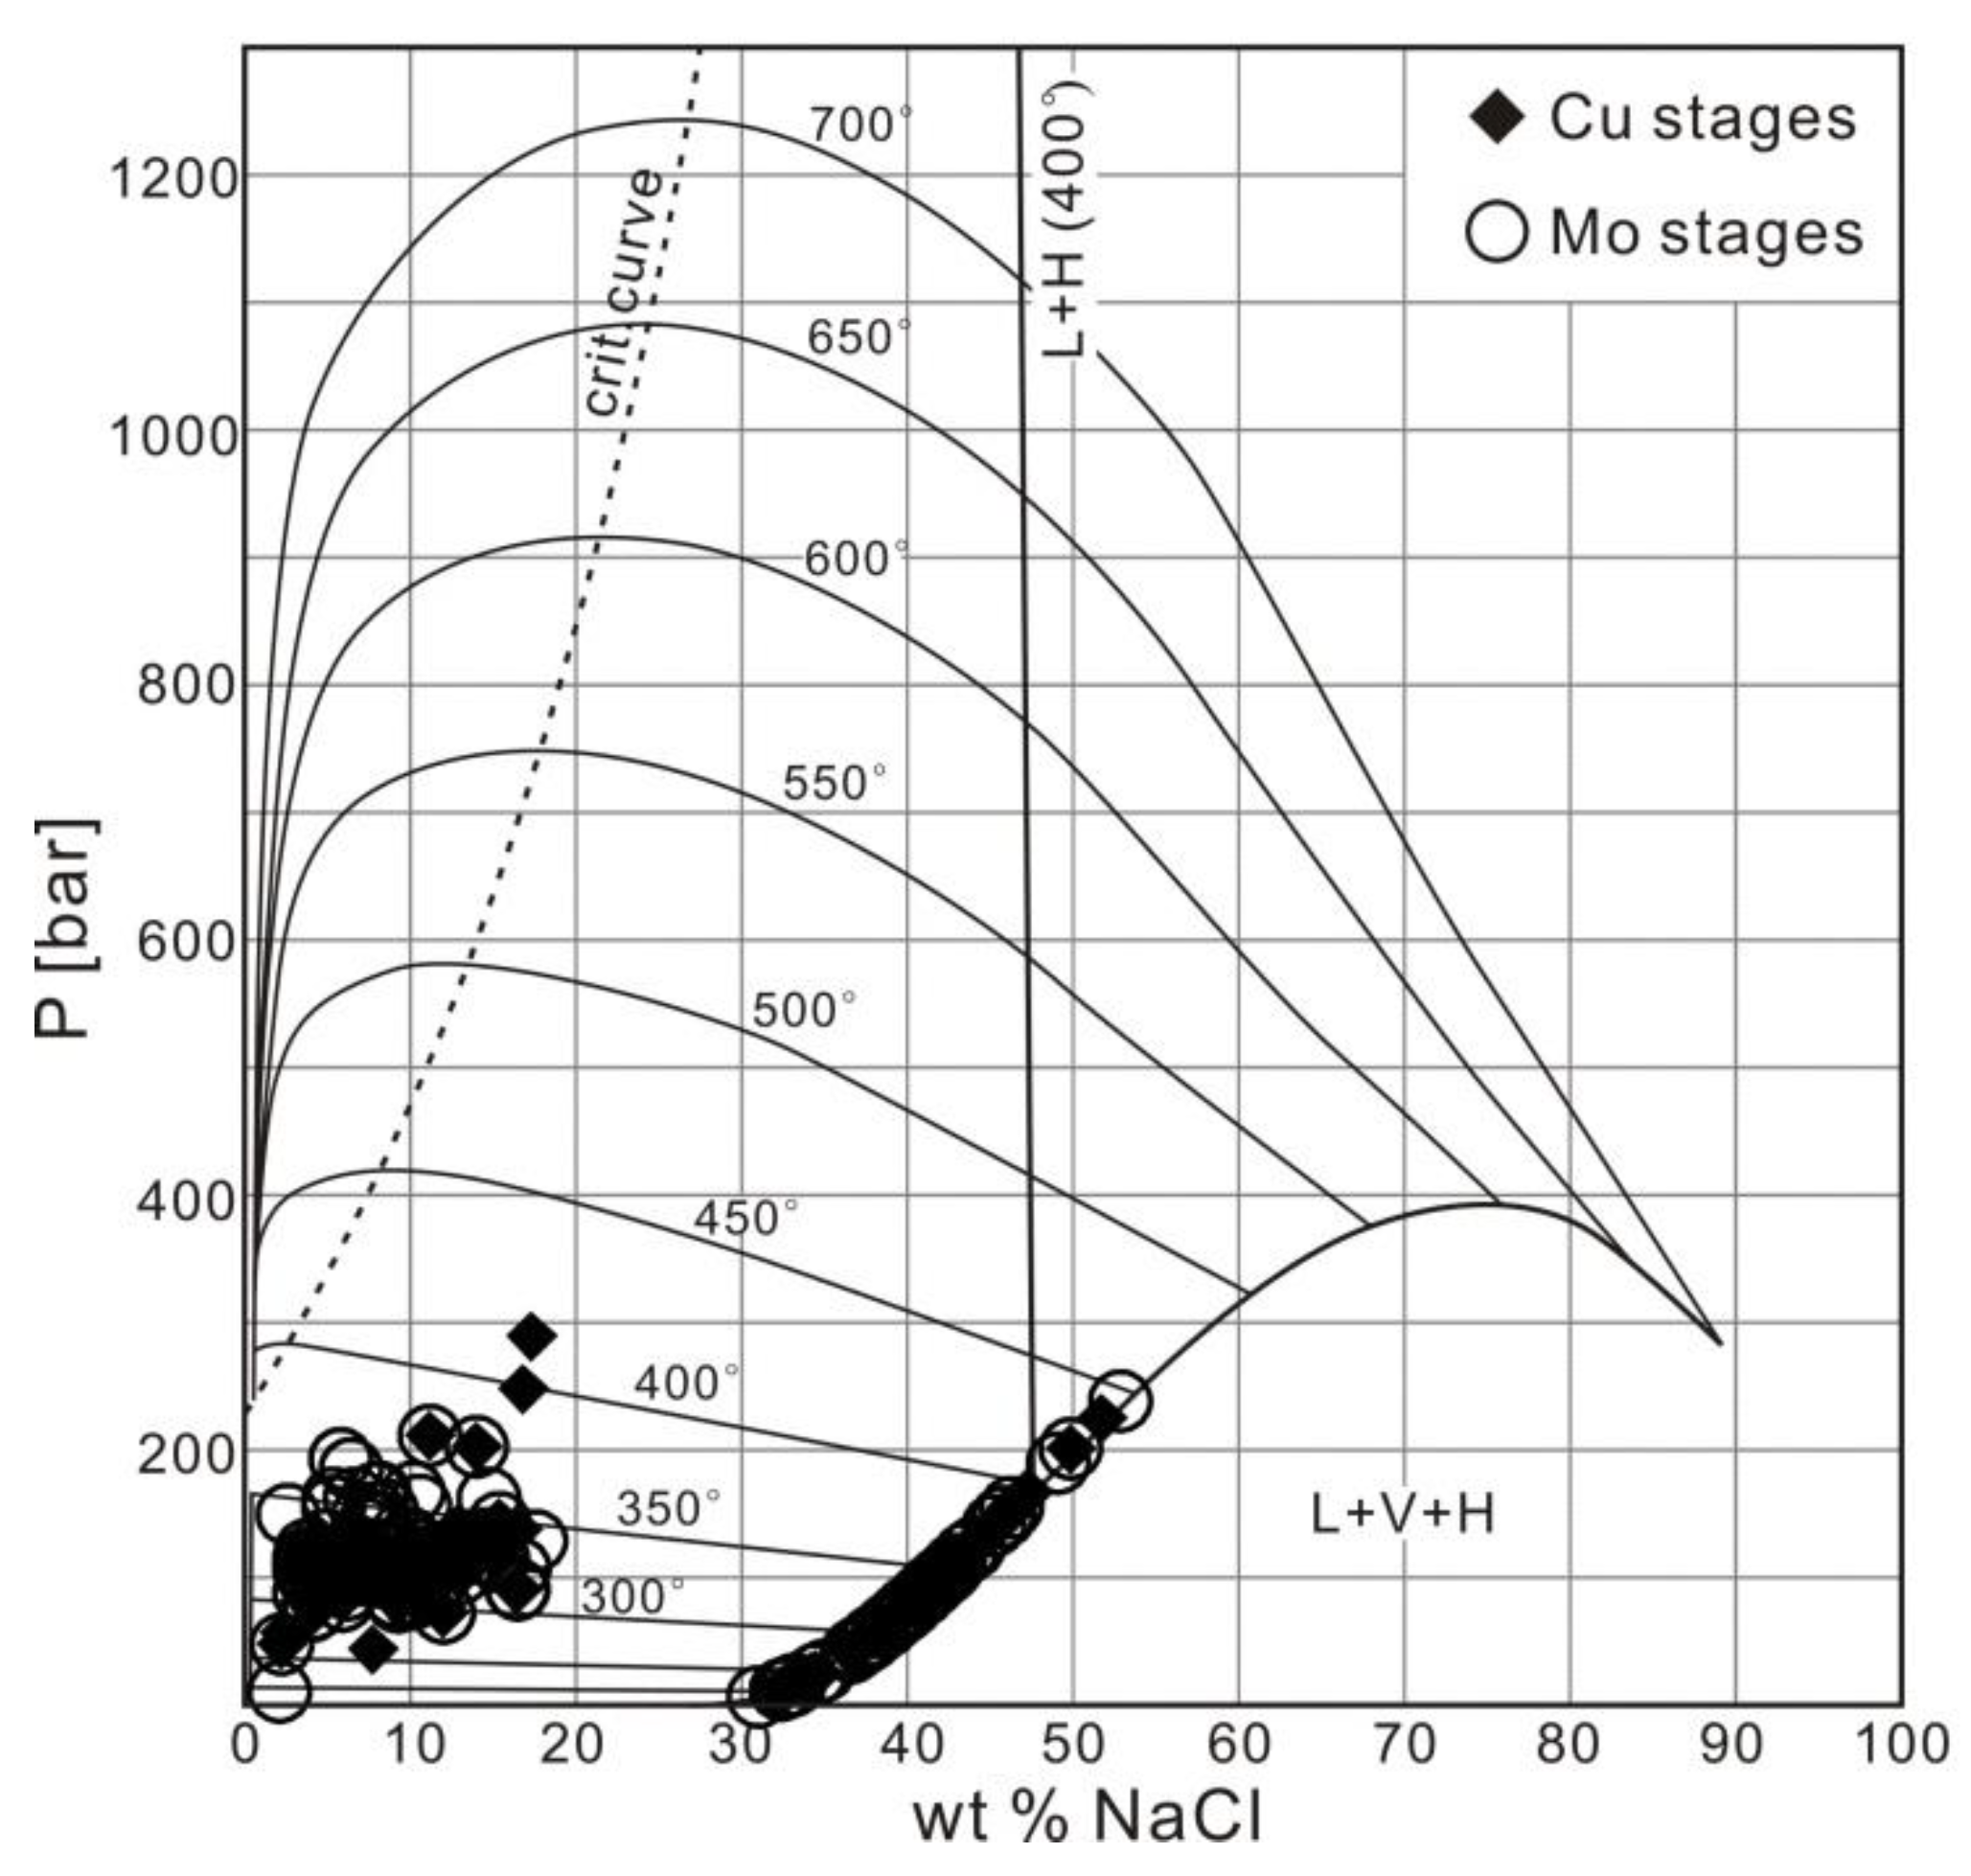
5.2. P–T Conditions and Phase Separation

A comparison of P–T conditions during the deposition of Cu and Mo indicate that the conditions for the L-type fluid inclusions are nearly the same during the Cu and Mo stages of mineralization, while the temperatures of the V- and S-type fluid inclusions in the Cu stage are ~15 °C higher than those in the Mo stage. The average pressure in the Cu stage was ~16 bar higher than those in the Mo stage. However, very small differences in P–T conditions are not sufficient to cause the obvious separation of Cu and Mo, indicating that the mineral-bearing fluid for both of the Cu and Mo stages had similar P-T conditions and salinity (Figure 10). Furthermore, L-, V-, and S-type fluid inclusions commonly coexist in the Cu- and Mo-bearing quartz veins, and the similar P–T conditions of the Cu and Mo stages demonstrate that the ore-forming fluids were immiscible, causing the separation of high-salinity fluid and vapor phases (Figure 10; [46]).

5.3. Transport and Precipitation of Metals

Results of the SR–XRF mapping show that the concentration of Cu in fluid inclusions is relatively low during the Cu stage, and the Mo concentration is relatively high and present in the liquid phase. In contrast, the concentration of Mo in the Mo stage is relatively low and the Cu content is relatively high being present in the vapor phase (Figure 8 and Figure 9). These characteristics indicate: (1) Cu was enriched in the vapor phase, suggesting a sudden release in pressure and Mo in the liquid phase. During precipitation of the Cu, residual Cu was present in the vapor phase with residual Mo in the liquid phase. The process continued until Mo was deposited, leaving residual Mo in the vapor phase and Cu in the liquid phase; (2) Cu was transported in solution in the vapor phase and Mo in the liquid phase. Therefore, the Cu in the vapor phase was transported across greater distances than the Mo in the liquid phase [48,49,50], which may explain the spatial separation of Cu and Mo. The changes in Fe are consistent with changes in Cu, thus providing clues to for the formation of a fine-grained chalcopyrite–pyrite mineral assemblage during the Cu stage (Figure 5a–d).
In addition, the Cl content of the initial vapor phase was generally high in the porphyry Cu deposits [51,52,53,54]. This association between Cu and Cl indicates that the carrying capacity of Cu in the vapor phase was far greater than that in the liquid phase.
Quartz dissolution and precipitation experiments performed by Steele-MacInnis et al. [55] showed that at pressures of <20 MPa at a hydrostatic paleo-depth of ~2 km and at temperatures of 350 °C–500 °C, the solubility of quartz is low in vapor with a low salinity of <2 molal [56]. This observation explains the weak silicification observed in the Cu–I and Cu–II stages (Figure 5a–d).
The Au in the inclusions of the Cu and Mo stages is enriched in the vapor phase. Based on the hypothesis regarding Cu and Mo transport discussed above, it is considered that Au was transported in the vapor phase, but did not precipitate until after the precipitation of Cu or Mo, resulting in the enrichment of Au in the residual vapor phase. This inference is consistent with the average Au grade in the Jiama porphyry–hornfels ore of generally <0.1 ppm (Figure 4). Moreover, the remaining relatively Au-rich residual vapor phase was probably transported to distal zones of the porphyry system, where it formed epithermal Au deposits in faults [48,57,58].

5.4. Influence of Wall-Rock Permeability on Metal Transport

The mineralization and zonation patterns in skarn are controlled by factors such as the lateral escape of fluids, the distribution of limestone, and temperature gradients [13,59,60,61]. Mineralization in the Jiama Porphyry and adjacent hornfels studied is the result of the vertical escape of fluid from the hornfels and structures within controlling the zonation of metals. The shallower part of the hornfels in contact with the Jiama Porphyry is massive, dominated by biotite alteration, and exhibits a moderate density of factors (Figure 5a–b). Deeper zones are characterized by coarse-grained altered felsic granitic rock that are also significantly fractured (Figure 5f–i; [62]). The permeability of the deeper zone is higher than that of the upper zone (Figure 4), and the difference in permeability would have been favorable for transport of Cu in the vapor phase, thus facilitating the movement of Cu from the lower to the upper member of the wall rock. Metasomatism associated with vapor resulted in the formation of the disseminated and thinly veined chalcopyrite–pyrite mineral assemblage. Mo that was transported in the liquid phase is readily precipitated in rocks with a relatively high permeability [63].

6. Conclusions

An unusual pattern of metal zonation is present in the Jiama deposit divided into an early upper-level containing Cu and a late lower-level containing Mo. The Cu mineralization proceeded in three stages and is dominated by disseminated and veinlet types containing an assemblage of chalcopyrite–pyrite accompanied by hydrothermal biotite alteration. The Mo mineralization also went through three stages, and was dominated by a vein stockwork of quartz–Mol accompanied by silicic alteration. From deep to shallow, the change of rock porosity/fracture rate and the migration of Cu and Mo in different phases are the main reasons for the spatial separation of elements, while the continuous evolution of ore-bearing magmatic rocks and the emplacement of porphyries in different stages may be the main reasons for the temporal separation of elements. It can be seen that the element zoning mechanism of porphyry deposits is complex, and this study is an important supplement to the traditional element zoning mechanism of porphyry deposits, and also has guiding significance for the mining planning of this type of deposits.

Author Contributions

W.Z.: Ideas, Writing—Original draft preparation, commentary, and revision. Y.W.: Experimental data analysis and mapping, commentary, and revision. All authors have read and agreed to the published version of the manuscript.

Funding

This research was funded by the National Science Foundation of China, grant number 41302060 and the Basic Scientific Research of CAGS, grant number K1302.

Institutional Review Board Statement

Not applicable.

Informed Consent Statement

Not applicable.

Data Availability Statement

Not applicable.

Conflicts of Interest

The authors declare no conflict of interest.

References

  1. Duan, J.; Tang, J.; Mason, R.; Zheng, W.; Ying, L. Zircon U-Pb Age and Deformation Characteristics of the Jiama Porphyry Copper Deposit, Tibet: Implications for Relationships between Mineralization, Structure and Alteration. Resour. Geol. 2014, 64, 316–331. [Google Scholar] [CrossRef] [Green Version]
  2. Guo, N.; Thoms, C.; Tang, J.X.; Tong, Q.X. Mapping white mica alteration associated with the Jiama porphyry-skarn Cu de-posit, central Tibet using field SWIR spectrometry. Ore Geol. Rev. 2019, 108, 147–157. [Google Scholar] [CrossRef]
  3. Huang, Y.-R.; Guo, N.; Tang, J.-X.; Shi, W.-X.; Ran, F.-Q. Garnet Characteristics Associated with Jiama Porphyry-Skarn Cu Deposit 1# Skarn Orebody, Tibet, Using Thermal Infrared Spectroscopy. Minerals 2020, 11, 5. [Google Scholar] [CrossRef]
  4. Tang, J.X.; Wang, D.H.; Wang, X.W.; Zhong, K.H.; Ying, L.J.; Zheng, W.B.; Li, F.J.; Guo, N.; Qin, Z.P.; Yao, X.F.; et al. Geological features and metallogenic model of the Jiama copper–polymetallic deposit in Tibet. Acta Geosci. Sin. 2010, 31, 1–12. [Google Scholar]
  5. Ying, L.J.; Wang, D.H.; Tang, J.X.; Chang, Z.S.; Qu, W.J.; Zheng, W.B.; Wang, H. Re2O3 dating of molybdenite from the Jiama copper polymetallic deposit in Tibet and its metallogenic significance. Acta Geol. Sin. 2010, 84, 1165–1174. [Google Scholar]
  6. Ying, L.; Wang, C.; Tang, J.; Wang, D.; Qu, W.; Li, C. Re–Os systematics of sulfides (chalcopyrite, bornite, pyrite and pyrrhotite) from the Jiama Cu–Mo deposit of Tibet, China. J. Asian Earth Sci. 2014, 79, 497–506. [Google Scholar] [CrossRef]
  7. Zou, B.; Lin, B.; Zheng, W.B.; Song, Y.; Tang, P.; Zhang, Z.B.; Gao, X. The characteristics of alteration and mineralization and geochronology of ore-bearing porphyry in south pit of Jiama copper-polymetallic deposit, Tibet. Acta Petrol. Sin. 2019, 35, 953–967. [Google Scholar]
  8. Zheng, W.B.; Tang, J.X.; Chang, Z.S.; Li, F.J.; Yao, X.F. Geological and geochemical characteristics and genesis of the Jiama polymetallic copper deposit in Tibet. Geol. Explor. 2010, 46, 985–992. [Google Scholar]
  9. Zheng, W.B.; Chen, Y.C.; Tang, J.X.; Chang, Z.S.; Wang, X.W.; Ying, L.J.; Li, F.J.; Wang, H.; Tang, X.Q. Discovery of the tubu-lar ore body in Jiama ore district, Tibet and its geological significance. Miner. Depos. 2011, 30, 207–218. [Google Scholar]
  10. Zheng, W.B.; Tang, J.X.; Zhong, K.H.; Ying, L.J.; Leng, Q.F.; Ding, S.; Lin, B. Geology of the Jiama porphyry cop-per-polymetallic system, Lhasa Region, China. Ore Geol. Rev. 2016, 74, 151–169. [Google Scholar] [CrossRef]
  11. Zhong, K.H.; Li, L.; Zhou, H.W.; Bai, J.G.; Li, W.; Zhong, W.T.; Zhang, Y.Q.; Lan, J.Q.; Zheng, F.S.; Huang, X.Y.; et al. Features of Jiama–Kajunguo thrust–gliding nappe tectonic system in Tibet. Acta Geosci. Sin. 2012, 33, 411–423. [Google Scholar]
  12. Zhou, Y.; Wang, X.W.; Tang, J.X.; Qin, Z.P.; Peng, H.J.; Li, A.G.; Yang, K.; Wang, H.; Li, J.; Zhang, J.C. Origin and evolution of ore–forming fluids from Jiama copper polymetallic deposit in Tibet. Miner. Depos. 2011, 30, 231–246. [Google Scholar]
  13. Zheng, W.B.; Chen, Y.C.; Song, X.; Tang, J.X.; Ying, L.J.; Li, F.J.; Tang, X.Q. Element distribution of Jiama copper–polymetallic deposit in Tibet and its geological significance. Miner. Depos. 2010, 29, 775–784. [Google Scholar]
  14. Susak, N.J.; Crerar, D.A. Factors controlling mineral zoning in hydrothermal ore deposits. Econ. Geol. 1982, 77, 476–482. [Google Scholar] [CrossRef]
  15. Lang, J.R.; Gregory, M.J.; Rebagliati, M.C.; Payne, J.G.; Oliver, J.L.; Roberts, K. Geology and magmatic–hydrothermal evolution of the giant Pebble porphyry copper–gold–molybdenum deposit, Southwest Alaska. Econ. Geol. 2013, 108, 437–462. [Google Scholar] [CrossRef]
  16. Li, X.; Sasaki, M. Hydrothermal Alteration and Mineralization of Middle Jurassic Dexing Porphyry Cu-Mo Deposit, Southeast China. Resour. Geol. 2007, 57, 409–426. [Google Scholar] [CrossRef]
  17. Redmond, P.B.; Einaudi, M.T. The Bingham Canyon Porphyry Cu-Mo-Au Deposit. I. Sequence of Intrusions, Vein Formation, and Sulfide Deposition. Econ. Geol. 2010, 105, 43–68. [Google Scholar] [CrossRef]
  18. Seo, J.H.; Guillong, M.; Heinrich, C.A. Separation of Molybdenum and Copper in Porphyry Deposits: The Roles of Sulfur, Redox, and pH in Ore Mineral Deposition at Bingham Canyon. Econ. Geol. 2012, 107, 333–356. [Google Scholar] [CrossRef]
  19. Wang, Y.Y.; Tang, J.X.; Zheng, W.B.; Duan, J.L.; Song, J.L.; Yang, C. Mechanism of metal precipitation in Dabu porphyry Cu-Mo deposit, Quxu Country, Tibet. Miner. Depos. 2015, 34, 81–97. [Google Scholar]
  20. Wang, Y.Y.; Zheng, W.B.; Chen, Y.C.; Tang, J.X.; Leng, Q.F.; Tang, P.; Ding, S.; Zhou, Y. Discussion on the mechanism of sep-aration of copper and molybdenum in Jiama porphyry deposit system, Tibet. Acta Petrol. Sin. 2017, 33, 495–514. [Google Scholar]
  21. Yang, Z.; Hou, Z.; White, N.C.; Chang, Z.; Li, Z.; Song, Y. Geology of the post-collisional porphyry copper–molybdenum deposit at Qulong, Tibet. Ore Geol. Rev. 2009, 36, 133–159. [Google Scholar] [CrossRef]
  22. Chung, S.-L.; Chu, M.-F.; Zhang, Y.; Xie, Y.; Lo, C.-H.; Lee, T.-Y.; Lan, C.-Y.; Li, X.; Zhang, Q.; Wang, Y. Tibetan tectonic evolution inferred from spatial and temporal variations in post-collisional magmatism. Earth-Sci. Rev. 2005, 68, 173–196. [Google Scholar] [CrossRef]
  23. Chung, S.L.; Chu, M.F.; Ji, J.Q.; O’Reilly, S.Y.; Pearson, N.J.; Liu, D.Y.; Lee, T.Y.; Lo, C.H. The nature and timing of crustal thickening in southern Tibet: Geochemical and zircon Hf isotopic constraints from post-collisional adakites. Tectonophysics 2009, 477, 36–48. [Google Scholar] [CrossRef]
  24. Hou, Z.Q.; Cook, N.J. Metallogenesis of the Tibetan collisional orogeny: A review and introduction to the special issue. Ore Geol. Rev. 2009, 36, 2–24. [Google Scholar] [CrossRef]
  25. Hou, Z.Q.; Zheng, Y.C.; Yang, Z.M.; Rui, Z.Y.; Zhao, Z.D.; Jiang, S.H.; Qu, X.M.; Sun, Q.Z. Contribution of mantle compo-nents within juvenile lower–crust to collisional zone porphyry Cu systems in Tibet. Miner. Depos. 2013, 48, 173–192. [Google Scholar] [CrossRef]
  26. Hou, Z.; Yang, Z.; Lu, Y.; Kemp, A.; Zheng, Y.; Li, Q.; Tang, J.; Yang, Z.; Duan, L. A genetic linkage between subduction- and collision-related porphyry Cu deposits in continental collision zones. Geology 2015, 43, 247–250. [Google Scholar] [CrossRef]
  27. Mo, X.X.; Hou, Z.Q.; Niu, Y.L.; Dong, G.C.; Qu, X.M.; Zhao, Z.D.; Yang, Z.M. Mantle contributions to crustal thickening dur-ing continental collision: Evidence from Cenozoic igneous rocks in southern Tibet. Lithos 2007, 96, 225–242. [Google Scholar] [CrossRef]
  28. Pan, G.; Wang, L.; Li, R.; Yuan, S.; Ji, W.; Yin, F.; Zhang, W.; Wang, B. Tectonic evolution of the Qinghai-Tibet Plateau. J. Asian Earth Sci. 2012, 53, 3–14. [Google Scholar] [CrossRef]
  29. Tang, J.X.; Duo, J.; Liu, H.F.; Lang, X.H.; Zhang, J.S.; Zheng, W.B.; Ying, L.J. Minerogenetic series of ore deposit in the east part of the Gangdise Metallogenic Belt. Acta Geosci. Sin. 2012, 33, 393–410. [Google Scholar]
  30. Wang, R.; Richards, J.P.; Hou, Z.; Yang, Z.; Dufrane, S.A. Increased Magmatic Water Content--The Key to Oligo-Miocene Porphyry Cu-Mo Au Formation in the Eastern Gangdese Belt, Tibet. Econ. Geol. 2014, 109, 1315–1339. [Google Scholar] [CrossRef]
  31. Wang, R.; Richards, J.P.; Hou, Z.-Q.; Yang, Z.-M.; Gou, Z.-B.; Dufrane, S.A. Increasing Magmatic Oxidation State from Paleocene to Miocene in the Eastern Gangdese Belt, Tibet: Implication for Collision-Related Porphyry Cu-Mo Au Mineralization. Econ. Geol. 2014, 109, 1943–1965. [Google Scholar] [CrossRef]
  32. Xu, Z.; Yang, W.; Ji, S.; Zhang, Z.; Yang, J.; Wang, Q.; Tang, Z. Deep root of a continent–continent collision belt: Evidence from the Chinese Continental Scientific Drilling (CCSD) deep borehole in the Sulu ultrahigh-pressure (HP–UHP) metamorphic terrane, China. Tectonophysics 2009, 475, 204–219. [Google Scholar] [CrossRef]
  33. Yin, A.; Harrison, T.M.; Ryerson, F.J.; Wenji, C.; Kidd, W.S.F.; Copeland, P. Tertiary structural evolution of the Gangdese Thrust System, southeastern Tibet. J. Geophys. Res. Space Phys. 1994, 99, 18175–18201. [Google Scholar] [CrossRef] [Green Version]
  34. Yin, A.; Harrison, T.M. Geologic evolution of the Himalyan–Tibetan Orogen. Annu. Rev. Earth Planet. Sci. 2000, 28, 211–280. [Google Scholar] [CrossRef] [Green Version]
  35. Zhu, D.C.; Pan, G.T.; Zhao, Z.D.; Lee, H.Y.; Kang, Z.Q.; Liao, Z.L.; Wang, L.Q.; Li, G.M.; Dong, G.C.; Liu, B. Early Cretaceous subduction–related adakite–like rocks in the Gangdese, south Tibet: Products of slab melting and subsequent melt–peridotite interaction? J. Asian Earth Sci. 2009, 34, 298–309. [Google Scholar] [CrossRef]
  36. Zhu, D.C.; Zhao, Z.D.; Niu, Y.L.; Mo, X.X.; Chung, S.L.; Hou, Z.Q.; Wang, L.Q.; Wu, F.Y. The Lhasa Terrane: Record of a mi-crocontinent and its histories of drift and growth. Earth Planet. Sci. Lett. 2011, 301, 241–255. [Google Scholar] [CrossRef]
  37. Hou, Z.-Q.; Gao, Y.-F.; Qu, X.-M.; Rui, Z.-Y.; Mo, X.-X. Origin of adakitic intrusives generated during mid-Miocene east–west extension in southern Tibet. Earth Planet. Sci. Lett. 2004, 220, 139–155. [Google Scholar] [CrossRef]
  38. Tang, J.X.; Zheng, W.B.; Chen, Y.C.; Wang, D.H.; Ying, L.J.; Qin, Z.P. The deep porphyry prospecting breakthrough and its significance in the Jiama copper polymetallic deposit, Tibet. J. Jilin Univ. Earth Sci. Ed. 2013, 43, 1100–1110. [Google Scholar]
  39. Burnham, C.W. Magmas and hydrothermal fluids. In Geochemistry of Hydrothermal ore Deposits, 2nd ed.; Barnes, H.L., Ed.; John Wiley and Sons: New York, NY, USA, 1979; pp. 71–136. [Google Scholar]
  40. Furman, T.; Graham, D. Erosion of lithospheric mantle beneath the East African Rift system: Geochemical evidence from the Kivu volcanic province. Lithos 1999, 48, 237–262. [Google Scholar] [CrossRef]
  41. Candela, P.A.; Holland, H.D. The partitioning of copper and molybdenum between silicate melts and aqueous fluids. Geochim. Cosmochim. Acta 1984, 48, 373–380. [Google Scholar] [CrossRef]
  42. Blevin, P.L. Redox and compositional parameters for interpreting the granitoid metallogeny of Eastern Australia: Implica-tions for gold–rich ore systems. Resour. Geol. 2004, 54, 241–252. [Google Scholar] [CrossRef]
  43. Richards, J.P. Discussion of: The link between reduced porphyry copper deposits and oxidized magmas. Geochim. Cosmochim. Acta 2014, 126, 643–645. [Google Scholar] [CrossRef]
  44. Sun, W.; Huang, R.-F.; Li, H.; Hu, Y.-B.; Zhang, C.-C.; Sun, S.-J.; Zhang, L.-P.; Ding, X.; Li, C.-Y.; Zartman, R.E.; et al. Porphyry deposits and oxidized magmas. Ore Geol. Rev. 2015, 65, 97–131. [Google Scholar] [CrossRef]
  45. Lowenstern, J.B. Carbon dioxide in magmas and implications for hydrothermal systems. Miner. Depos. 2001, 36, 490–502. [Google Scholar] [CrossRef]
  46. Heinrich, C.A.; Günther, D.; Audétat, A.; Ulrich, T.; Frischknecht, R. Metal fractionation between magmatic brine and vapor, determined by microanalysis of fluid inclusions. Geology 1999, 27, 755–758. [Google Scholar] [CrossRef]
  47. Driesner, T.; Heinrich, C.A. The system H2O–NaCl. Part 1: Correlation formulae for phase relations in temperature–pressure–composition space from 0 to 1000 °C, 0 to 5000 bar, and 0 to 1 XNaCl. Geochim. Cosmochim. Acta 2007, 71, 4880–4901. [Google Scholar]
  48. Heinrich, C.A.; Driesner, T.; Stefansson, A.; Seward, T.M. Magmatic vapour contraction and the transport of gold from porphyry to epithermal ore deposits. Geology 2004, 32, 761–764. [Google Scholar] [CrossRef]
  49. Williams–Jones, A.E.; Heinrich, C.A. Vapour transport of metals and the formation of magmatic–hydrothermal ore depos-its. Econ. Geol. 2005, 100, 1287–1312. [Google Scholar] [CrossRef]
  50. Zajacz, Z.; Hanley, J.J.; Heinrich, C.A.; Halter, W.E.; Guillong, M. Diffusive re-equilibration of quartz–hosted silicate melt and fluid inclusions: Are all metal concentrations unmodified? Geochim. Cosmochim. Acta 2009, 73, 3013–3027. [Google Scholar] [CrossRef]
  51. Blundy, J.D.; Mavrogenes, J.; Tattitch, B.C.; Sparks, S.; Gilmer, A. Generation of porphyry copper deposits by gas–brine reaction in volcanic arcs. Nat. Geosci. 2015, 8, 235–240. [Google Scholar] [CrossRef]
  52. Mungall, J.; Brenan, J.M.; Godel, B.; Barnes, S.; Gaillard, F. Transport of metals and sulphur in magmas by flotation of sulphide melt on vapour bubbles. Nat. Geosci. 2015, 8, 216–219. [Google Scholar] [CrossRef]
  53. Robb, L. Introduction to Ore–Forming Processes; Blackwell: Oxford, UK, 2005; p. 373. [Google Scholar]
  54. Xiao, Z.; Gammons, C.; Williams-Jones, A. Experimental study of copper(I) chloride complexing in hydrothermal solutions at 40 to 300 °C and saturated water vapor pressure. Geochim. Cosmochim. Acta 1998, 62, 2949–2964. [Google Scholar] [CrossRef]
  55. Steele–MacInnis, M.; Han, L.; Lowell, R.P.; Rimstidt, J.D.; Bodnar, R.J. The role of fluid phase immiscibility in quartz disso-lution and precipitation in sub–seafloor hydrothermal systems. Earth Planet. Sci. Lett. 2012, 321–322, 139–151. [Google Scholar] [CrossRef]
  56. Fournier, R.O. Conceptual models of brine evolution in magmatic–hydrothermal systems. US Geol. Surv. Prof. Pap. 1987, 1350, 1487–1506. [Google Scholar]
  57. Sillitoe, R.H. Porphyry Copper Systems. Econ. Geol. 2010, 105, 3–41. [Google Scholar] [CrossRef] [Green Version]
  58. Zheng, S.-J.; Zhong, H.; Bai, Z.-J.; Zhang, Z.-K.; Wu, C.-Q. High-sulfidation veins in the Jiama porphyry system, South Tibet. Miner. Depos. 2021, 56, 205–214. [Google Scholar] [CrossRef]
  59. Meinert, L.D. Skarn zonation and fluid evolution in the Groundhog Mine, Central mining district, New Mexico. Econ. Geol. 1987, 82, 523–545. [Google Scholar] [CrossRef]
  60. Meinert, L.D. Skarns and skarn deposits. Geosci. Can. 1992, 19, 145–162. [Google Scholar]
  61. Meinert, L.D.; Dipple, G.M.; Nicolescu, S.; Hedenquist, J.W.; Thompson, J.F.H.; Goldfarb, R.J.; Richards, J.P. World Skarn Deposits. One Hundredth Anniv. Vol. 2005. [Google Scholar] [CrossRef]
  62. Lin, B.; Tang, J.X.; Zhang, Z.; Zheng, W.B.; Leng, Q.F.; Zhong, W.T.; Ying, L.J. Preliminary study of fissure system in Jiama porphyry deposit of Tibet and its significance. Miner. Depos. 2012, 31, 579–589. [Google Scholar]
  63. Wang, W.P.; Tang, J.X. Rock types and genetic significance of hornfels and location prediction of concealed porphyry bodies in Jiama copper polymetallic deposit, Tibet. Miner. Depos. 2011, 30, 1017–1038. [Google Scholar]
Figure 1. Maps: (a) Tectonic sketch map showing the location of the study area [37]; and (b) generalized geological map of the Jiama ore district (modified from [10]). Abbreviations: JSS = Jinsha suture; BNS = Bangong–Nujiang suture; IYZS = Indus–Yarlung Zangbo suture.
Minerals 11 00609 g001
Figure 2. Cross-section No. 16 through the center of the porphyry–hornfels orebody. (a) Geological cross-section; (b,c) grade block models, showing the metal zonation characterizing the upper Cu and lower Mo zones in the porphyry–hornfels. The location of the section is shown in Figure 1b.
Minerals 11 00609 g002
Figure 3. Cross-section No. 24 through the center of the porphyry–hornfels orebody. (a) Geological cross-section; (b,c) grade block models, showing the metal zonation characterizing the upper Cu and lower Mo zones in the porphyry–hornfels. The location of the section is shown in Figure 1b.
Minerals 11 00609 g003
Figure 4. Characteristic lithologies, types of alteration, and mineralization in the different levels of the porphyry–hornfels orebody. Direction of arrows represent increasing trends.
Minerals 11 00609 g004
Figure 5. Photographs showing temporal relationships between the Cu and Mo stages. (a) Cu–I stage fine-grained and disseminated chalcopyrite (Cp)–pyrite (Py) assemblage in biotite (Bi) hornfels (ZK1612-138.9 m); (b) Cu–II stage fine-grained and veinlet Cp–Py–quartz (Q) assemblage in Bi hornfels (ZK1612-213.6 m); (c) late Q–molybdenite (Mol) assemblage vein cutting the Cu–II stage Bi hornfels (ZK1612-103.7 m); (d) Cu–I stage Cp–Py–Q assemblage intergrowth with hydrothermal Bi alteration, accompanied by a flamboidal albite (Ab) in Bi hornfels (ZK1612-283.4 m); (e) Cu–III stage sub-vertical and well-developed miarolitic structure in a Q–Py–Cp assemblage in felsic hornfels (ZK1612-282.7 m); (f) the Mo–III stage cutting the Cu–III stage in felsic hornfels (ZK1616-433.2 m); (g) the Mo–I stage subhorizontal Q–Mol assemblage vein cut by a late Q vein. Fine-grained Mol is distributed along the selvedges of the vein (ZK1616-450.9 m); (h) Mo–II stage stockwork Q–Mol assemblage in felsic hornfels (ZK1616-445.2 m); (i) Mo–III stage subvertical Q–Mol assemblage cutting a Mo–I stage vein in felsic hornfels (ZK1616-445.2 m); (j) photomicrograph of Cu–I stage fine-grained and disseminated Cp–Py assemblage in Bi hornfels (ZK1612-138.9 m); (k) photomicrograph of Cu–II stage fine-grained and veinlet Cp–Py–Q assemblage in Bi hornfels (ZK1612-213.6 m); and (l) photomicrograph of a Cu–II stage Cp–Py–Q assemblage veinlet (ZK1612-213.6 m).
Minerals 11 00609 g005
Figure 6. Typical fluid inclusions in Cu and Mo stages of the Jiama deposit (under the polarizing optical microscope). (a) Combination of L- and V-type inclusions in Cu-bearing vein (ZK1616-167 m); (b) combination of L- and S1-type inclusions in a Cu-bearing vein, and S1-type inclusions containing hematite (Hem) and pyrite (Py) (ZK1614-158.2 m); (c) combination of L-, V-, S1-, and S2-type inclusions in a Cu-bearing vein, and an S1-type inclusion containing Hem and an S2-type inclusion containing halite (Hal) (ZK1615-438 m); (d) combination of L- and S2-type inclusions in a Cu-bearing vein, and an S2-type inclusion containing Hal and Py (ZK1615-219 m); (e) combination of L-, V-, S1-, and S2-type inclusions in a Cu-bearing vein, and an S1-type inclusion containing irregular chalcopyrite (Cp), magnetite (Mag), and red Hem, while an S2-type inclusion contains cubic transparent Hal and red Hem (ZK1617-133.9 m); (f) combination of L- and V-type inclusions in a Mo-bearing vein (ZK1616-167 m); (g) combination of L- and S1-type inclusions in a Mo-bearing vein (ZK1616-404 m); (h) combination of L- and S2-type inclusions in a Mo-bearing vein, and an S2-type inclusion containing irregular sylvite (Syl) and cubic Hal (ZK1615-364.8 m); (i) combination of L-, S1-, and S2-type inclusions in a Mo-bearing vein, an S1-type inclusion containing Cp, and an S2 type inclusion containing transparent Hal and Cp (ZK1616-742.8 m).
Minerals 11 00609 g006
Figure 7. Laser Raman spectra of typical fluid inclusions (FI) in Cu- and Mo-bearing veins. (a) Curves and peaks of the Raman shift around chalcopyrite (Cp) (S1-type FI in a Cu-bearing vein; ZK1614-118.8 m); (b) curves and peaks of the Raman shift around hematite (Hem) (S1-type FI in a Cu-bearing vein; ZK1615-67.5 m); (c) curves and peaks of the Raman shift around magnetite (Mag) (S1-type FI in a Cu-bearing vein; ZK1617-53.7 m); (d) curves and peaks of the Raman shift around anhydrite (Anh) (S2-type FI in a Cu-bearing vein; ZK1615-311 m); (e) curves and peaks of the Raman shift around pyrite (Py) (S1-type FI in a Mo-bearing vein; ZK1616-194 m); (f) curves and peaks of the Raman shift around CO2 (S1-type FI in a Cu-bearing vein; ZK1616-167 m); (g) curves and peaks of the Raman shift around CH4 (V-type FI in a Mo-bearing vein; ZK1614-795.3 m); (h) wide H2O peaks detected in the liquid and vapor phases (L-type FI in a Mo-bearing vein; ZK1614-795.3 m).
Minerals 11 00609 g007
Figure 8. Trace element enrichment maps of a single fluid inclusion in a Cu-bearing vein from the porphyritic quartz diorite.
Minerals 11 00609 g008
Figure 9. Trace element enrichment maps of a single fluid inclusion in an Mo-bearing vein from the porphyritic granite.
Minerals 11 00609 g009
Figure 10. NaCl–H2O P–T–X phase diagram [47]. The liquid + vapor coexistence surface is projected onto the P–X plane and contoured for temperature. The limit of liquid + halite coexistence at 400 °C is also shown.
Minerals 11 00609 g010
Table 1. Temperature, pressure and salinity ranges of fluid inclusions at the Jiama deposit.
Fluid Inclusion TypeHomogenization Temperature Range
(°C)
Pressure Range
(bar)
Salinity Range
(NaCl Equiv.)
Cu-bearing quartz veins
L-type229°–478°43–2921.2–16.4%
V-type328°–415°82–1954.3–9.5%
S1-type317°–451°72–2505.9–16%
S2-type198°–436°11–22731.7–51.3%
Mo-bearing quartz veins
L-type189°–427°9–2131.1–16.7%
V-type328°–415°82–1951.6–9.2%
S1-type317°–387°72–1533.1–15.7%
S2-type163°–445°5–24130.3–52.4%
Publisher’s Note: MDPI stays neutral with regard to jurisdictional claims in published maps and institutional affiliations.

