
A Criterion for Estimating the Strength of Flocculated Aggregates in Salt Solutions

 ,
,  and
and 
Abstract
:1. Introduction
2. Methodology
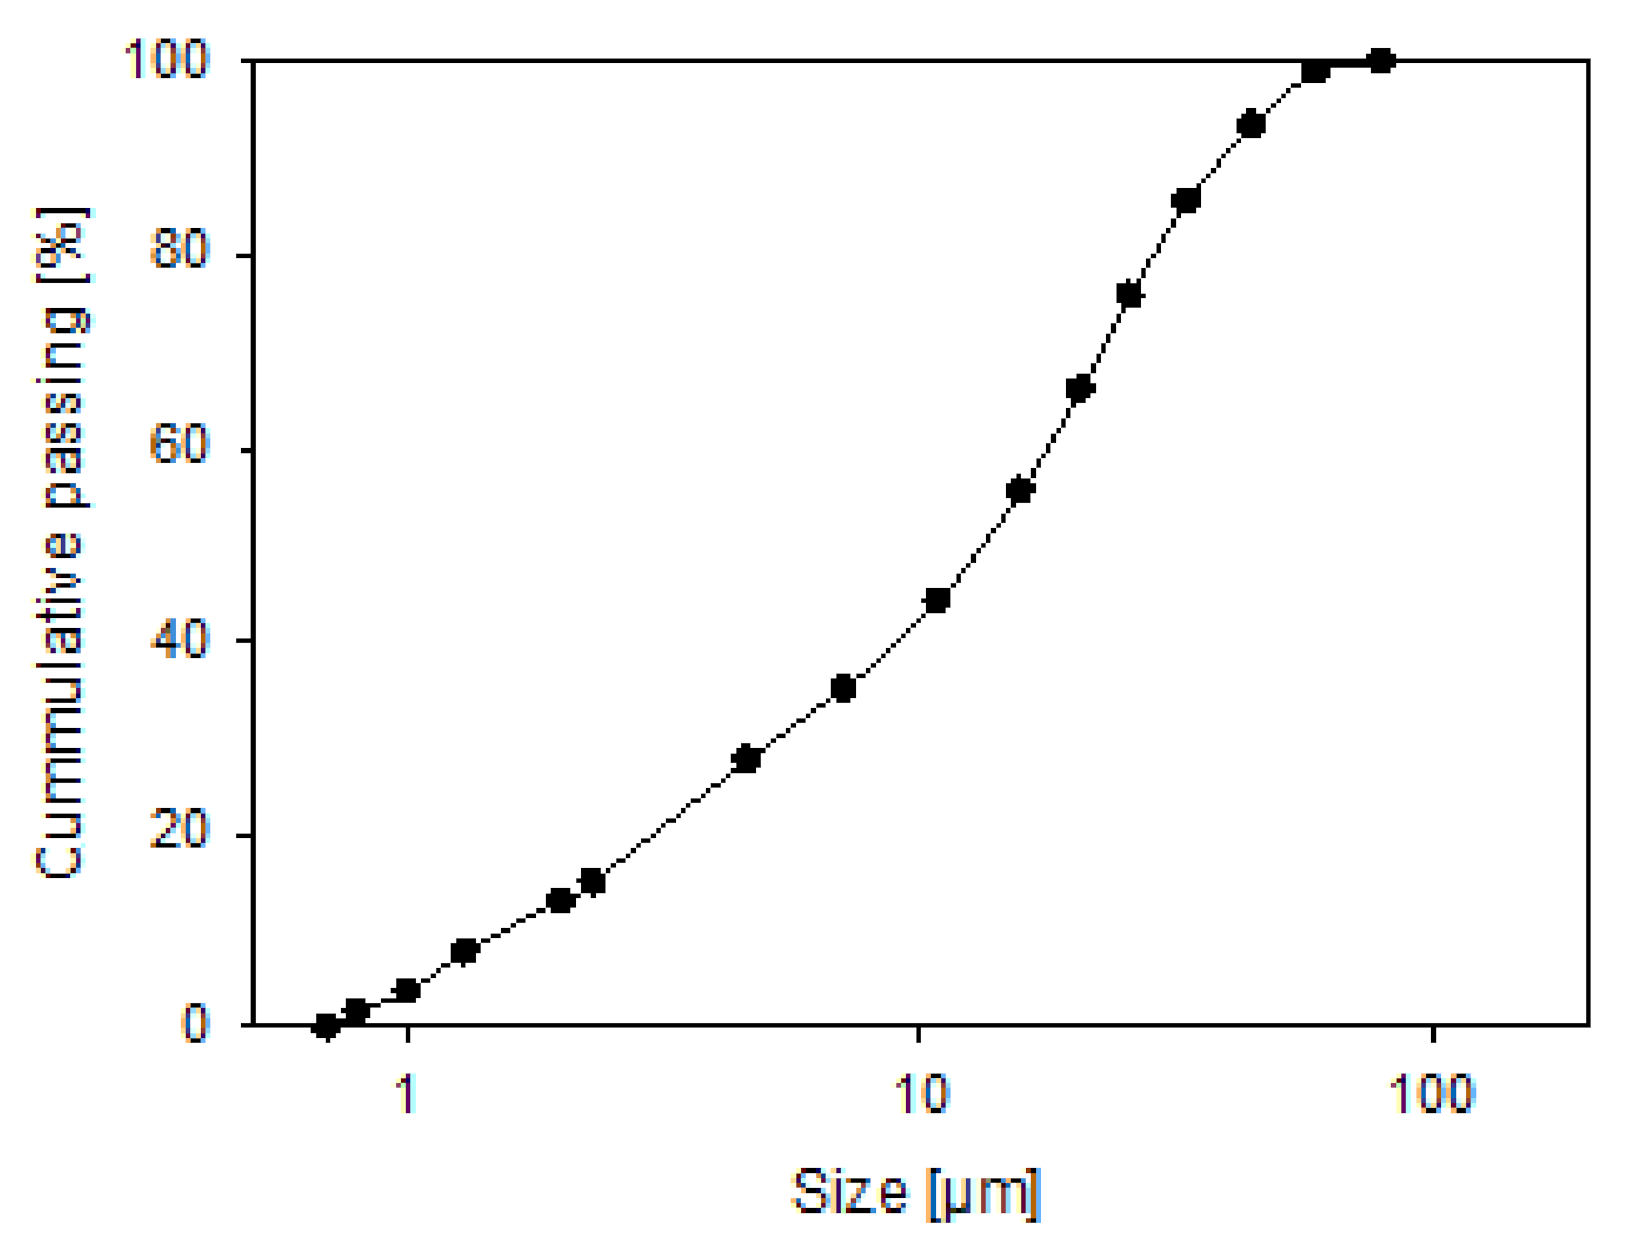
2.1. Materials
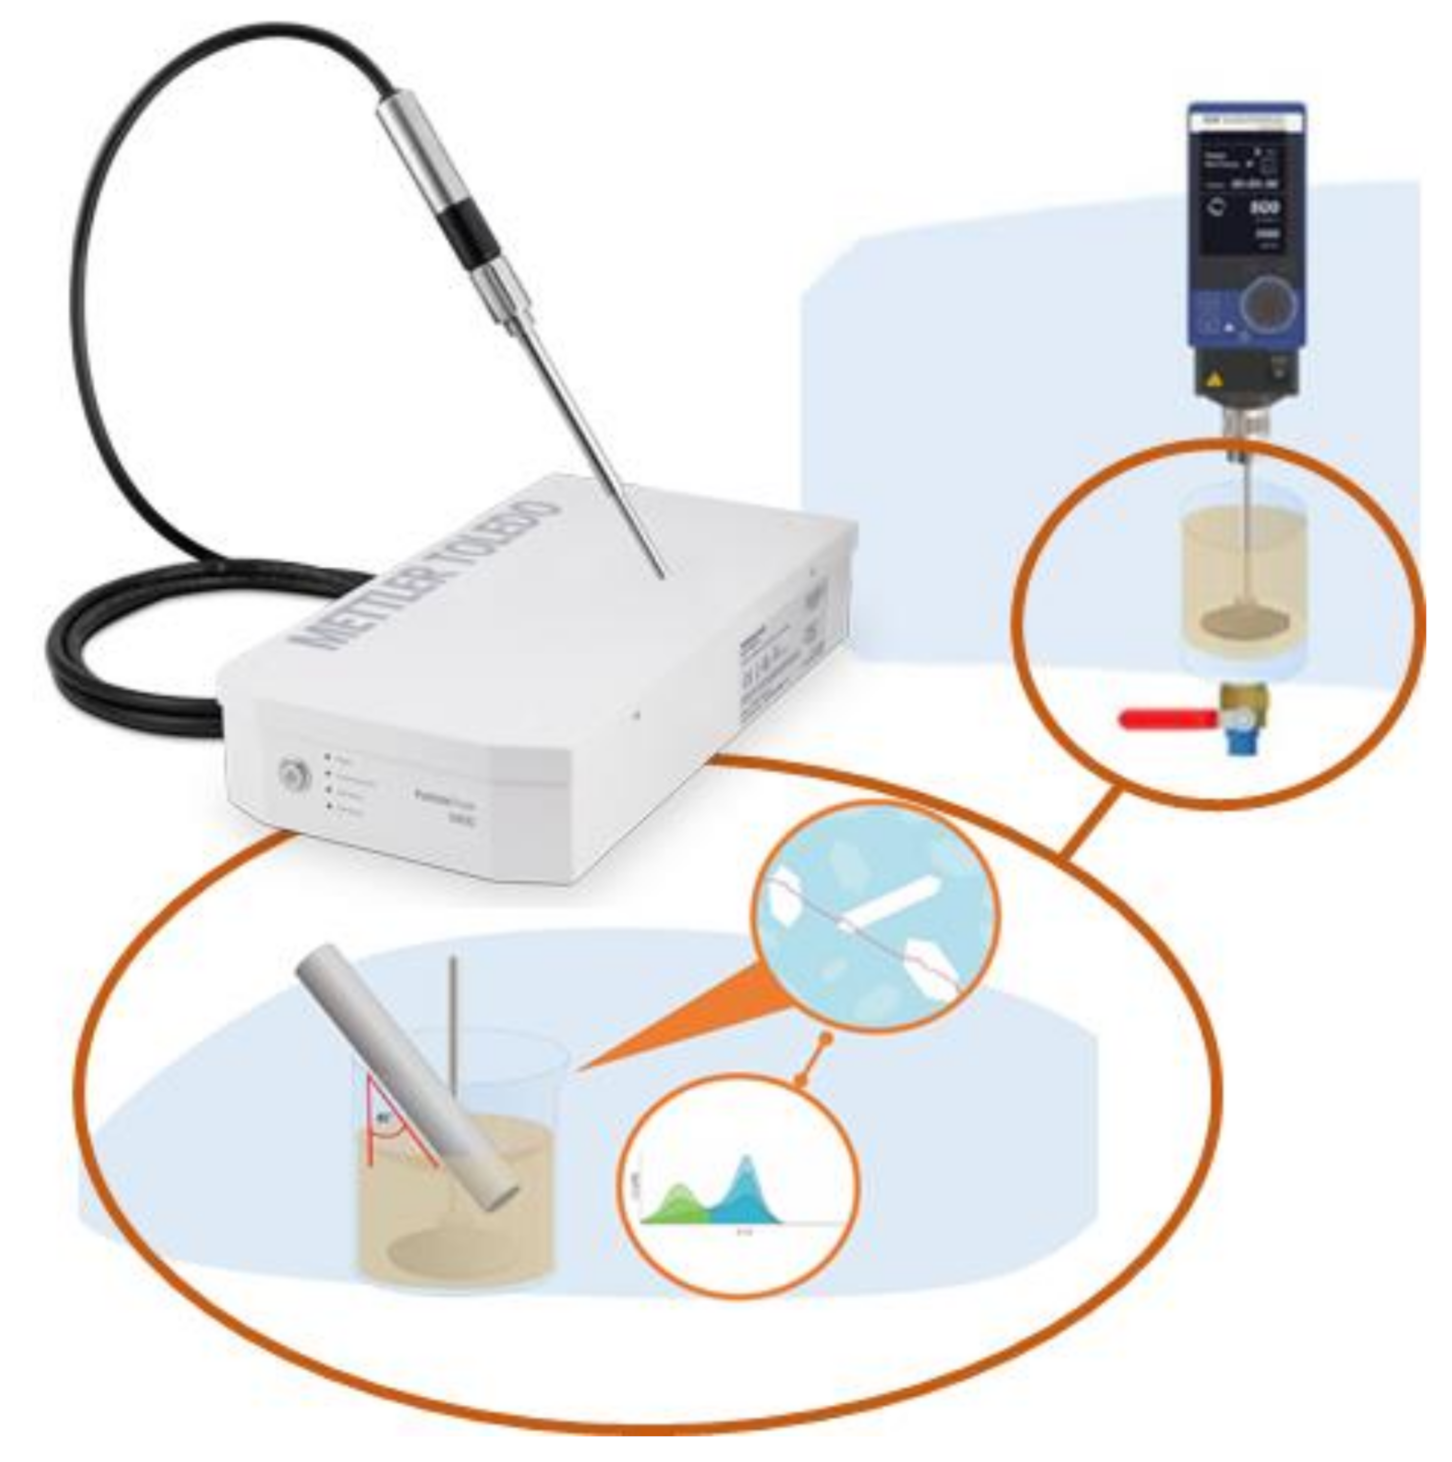
2.2. Aggregate Characterization
2.3. Mean Shear Rate (G)
3. Results
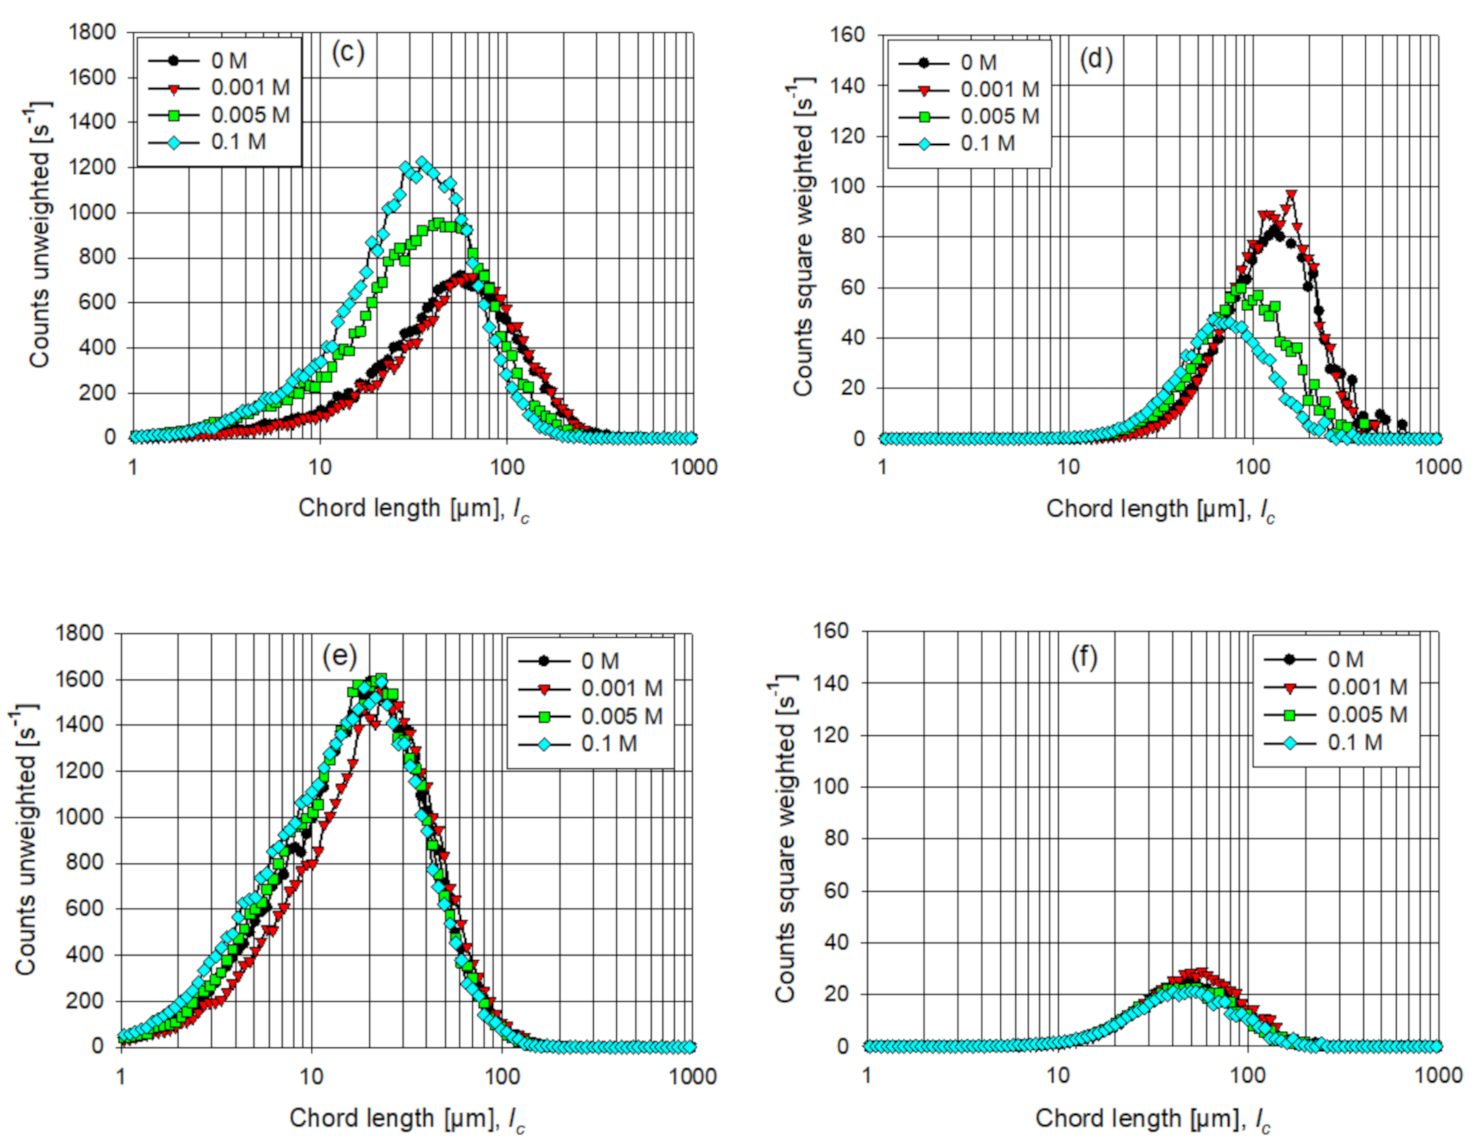
3.1. Particle Aggregation without Flocculant
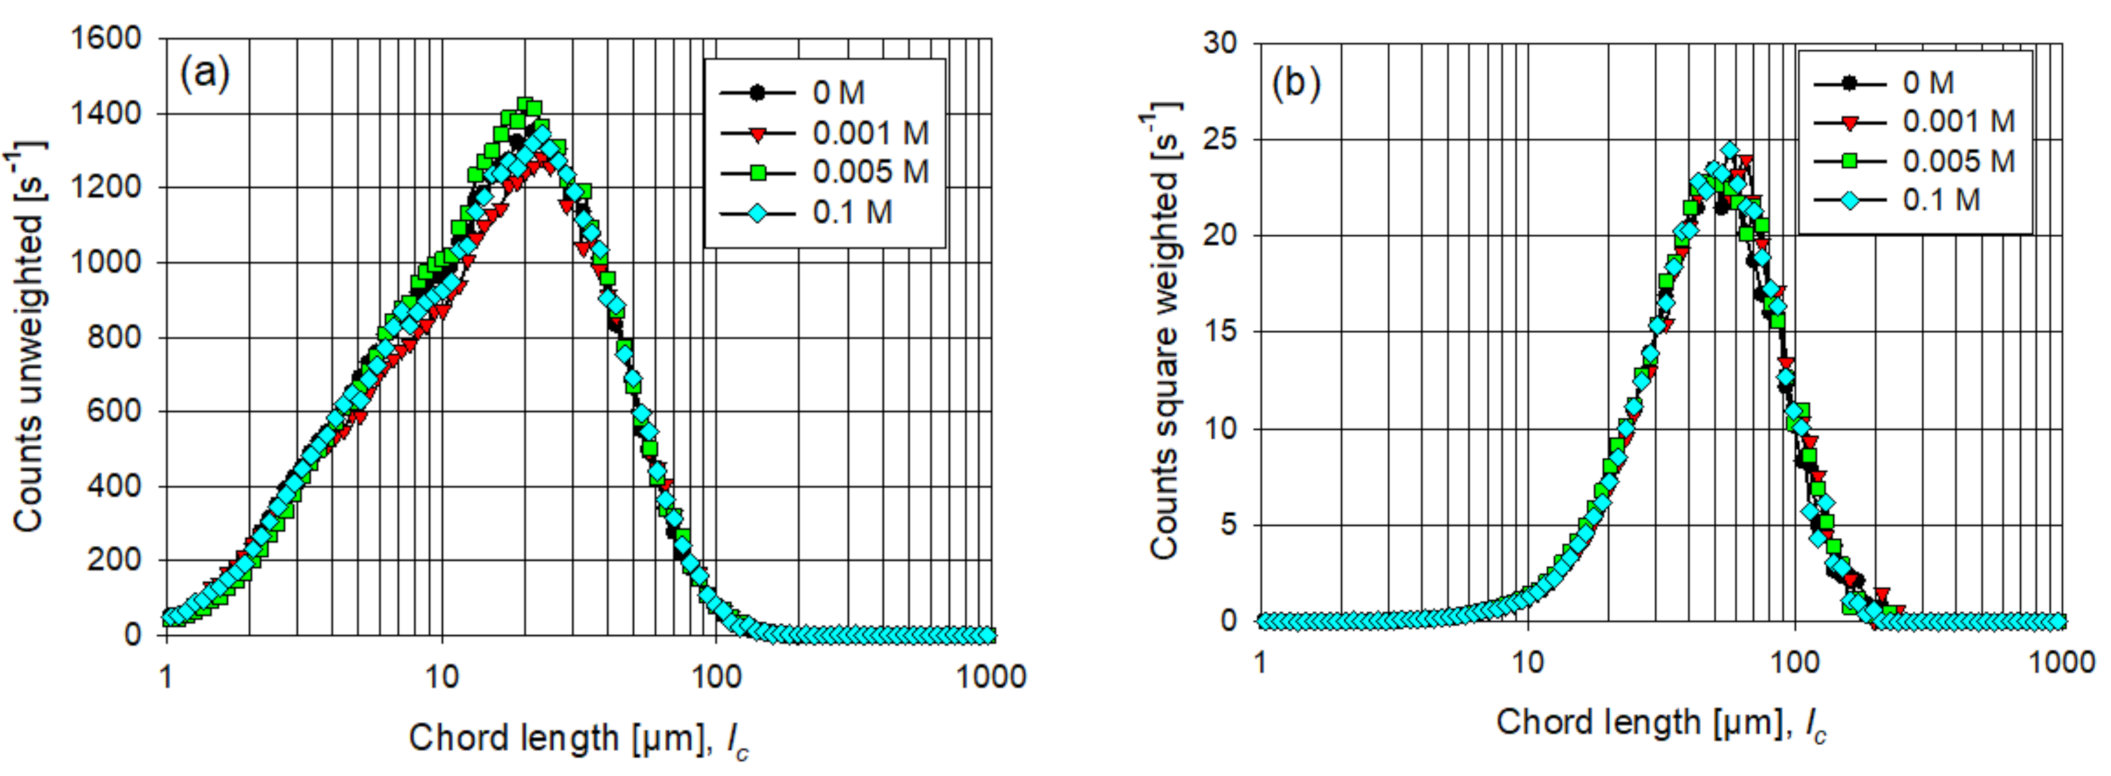
3.2. Aggregation of Flocculated Particles
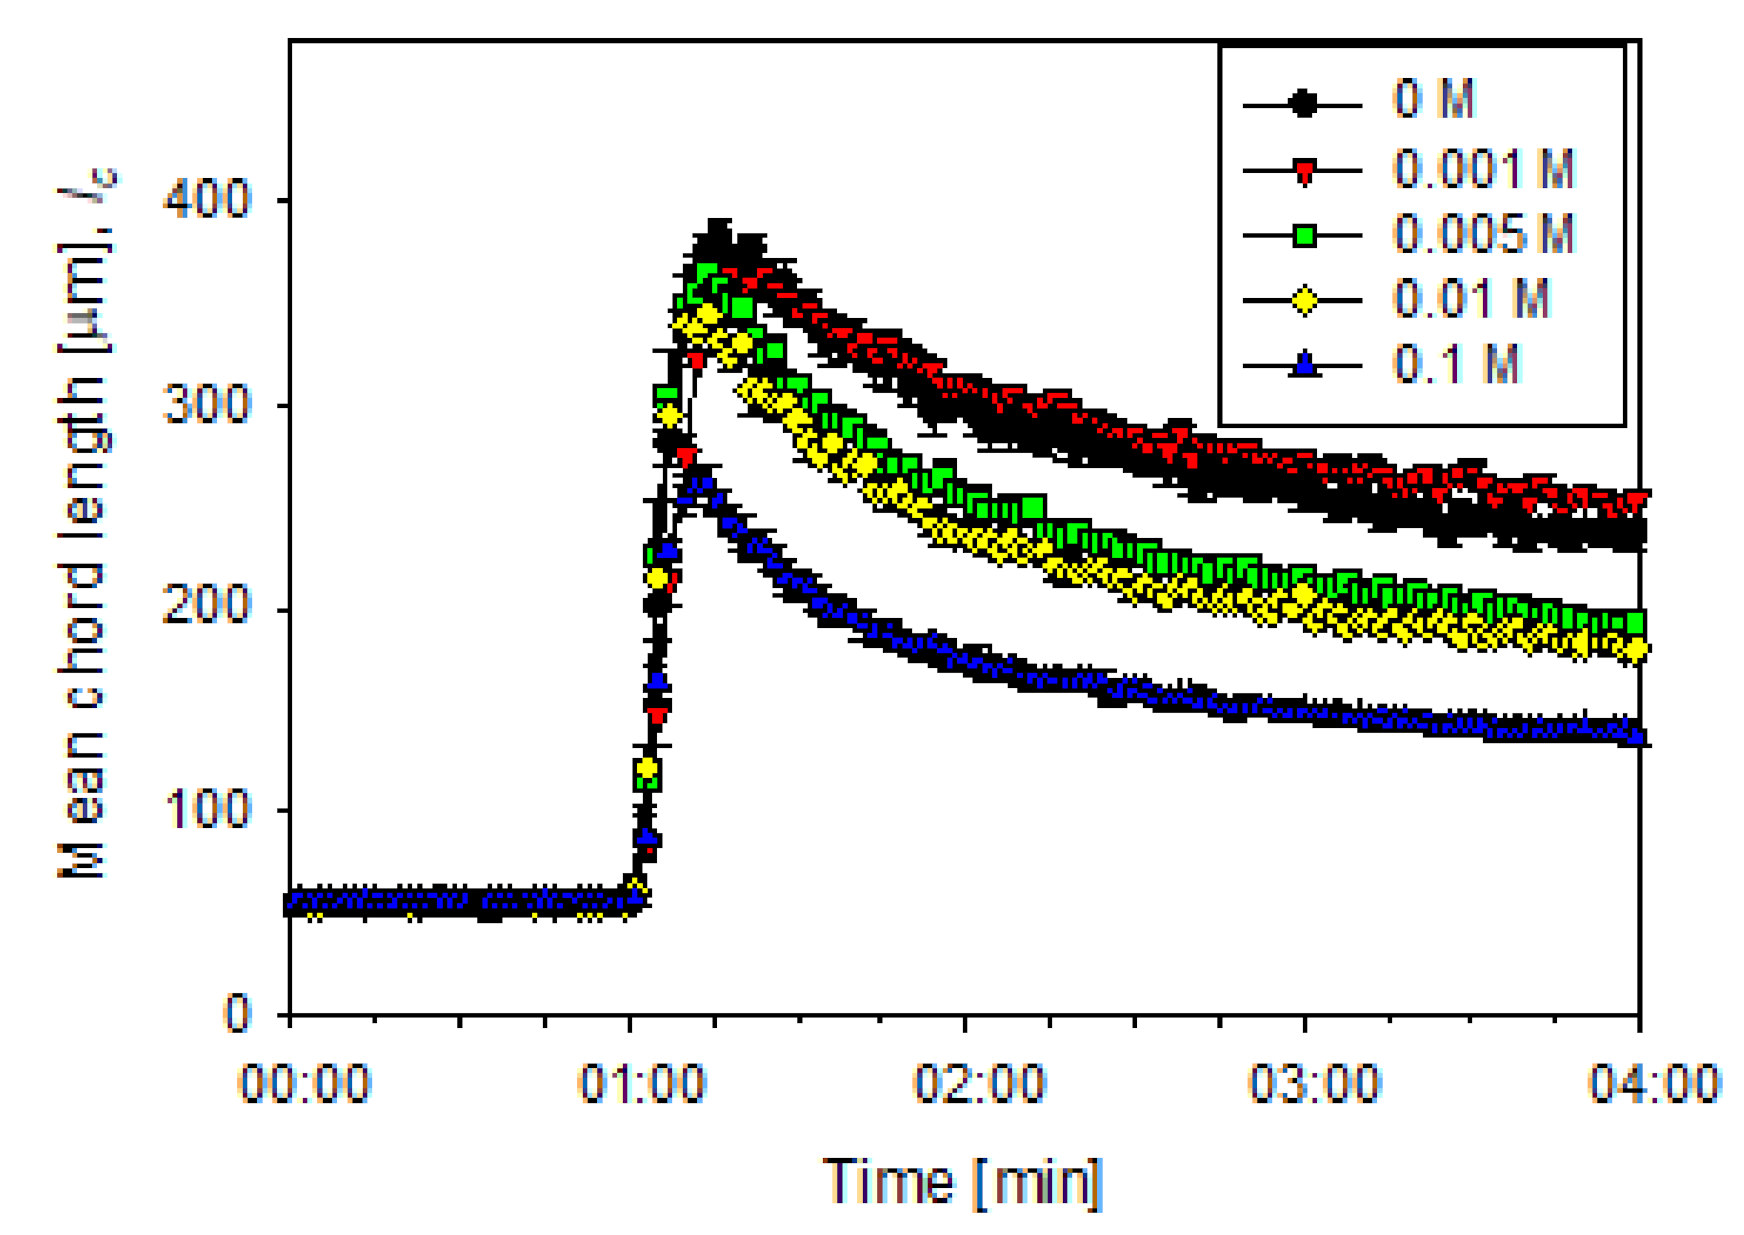
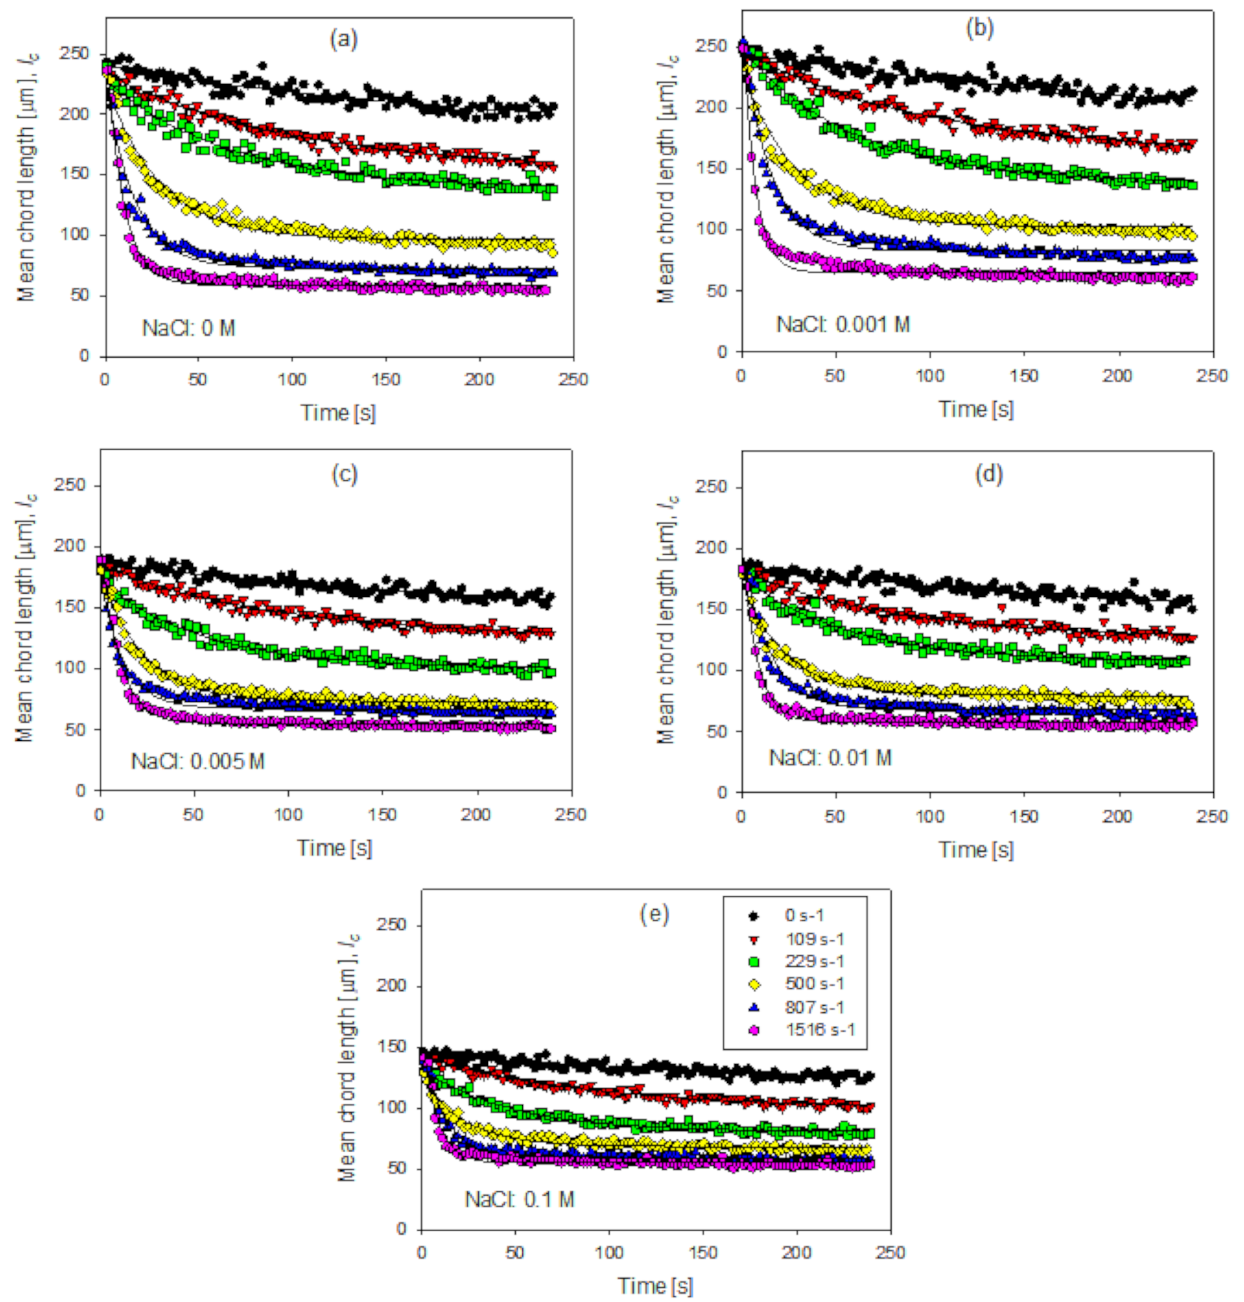
3.3. Aggregate Shear Fragmentation
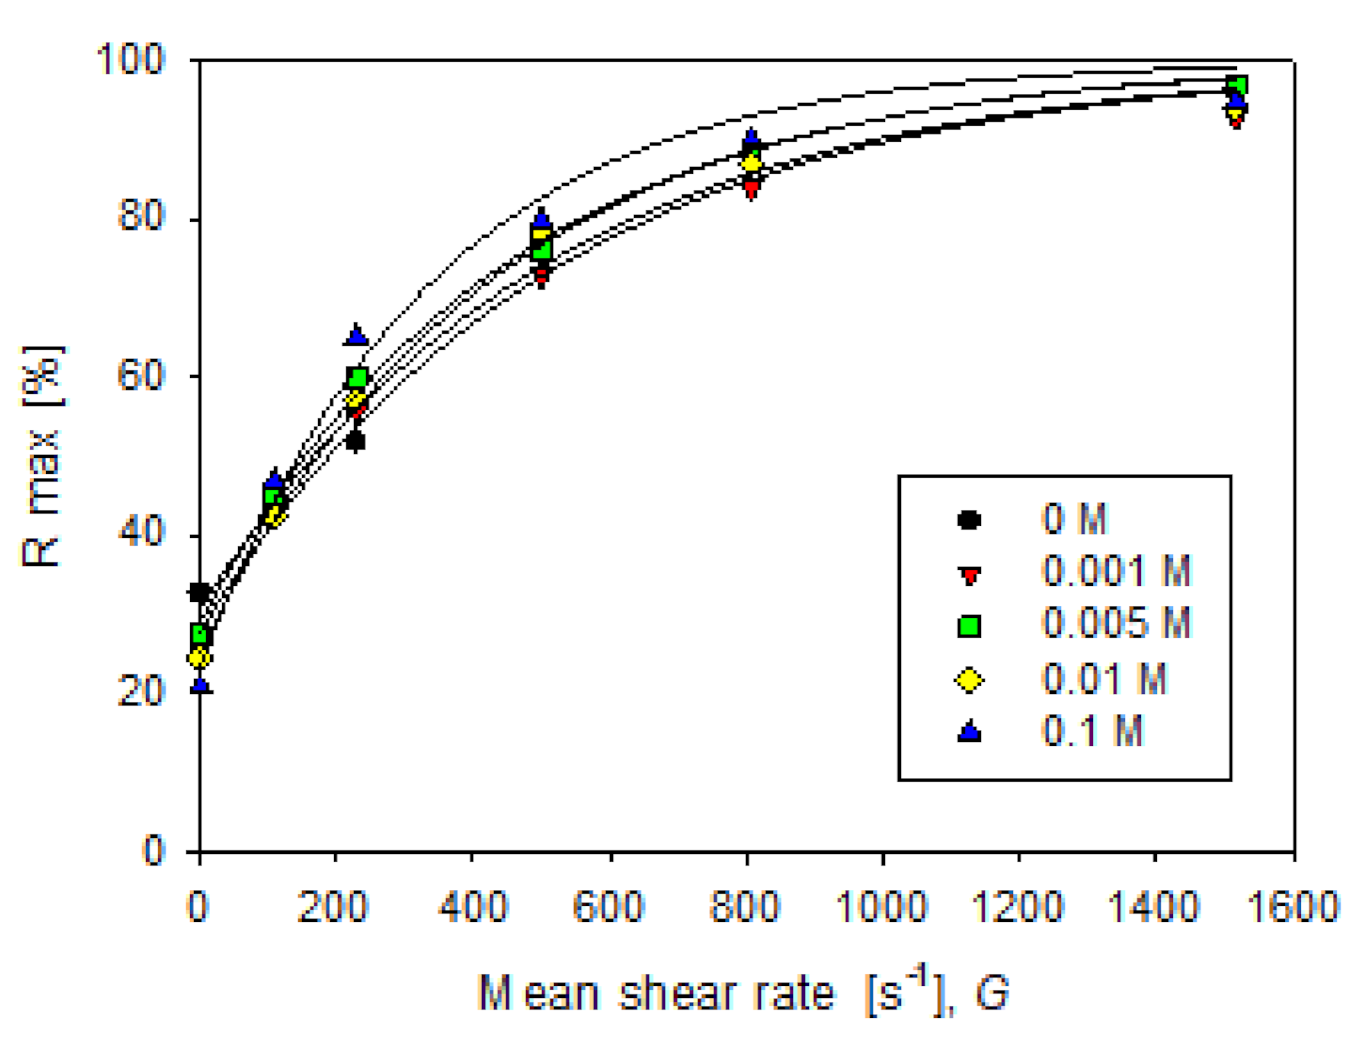
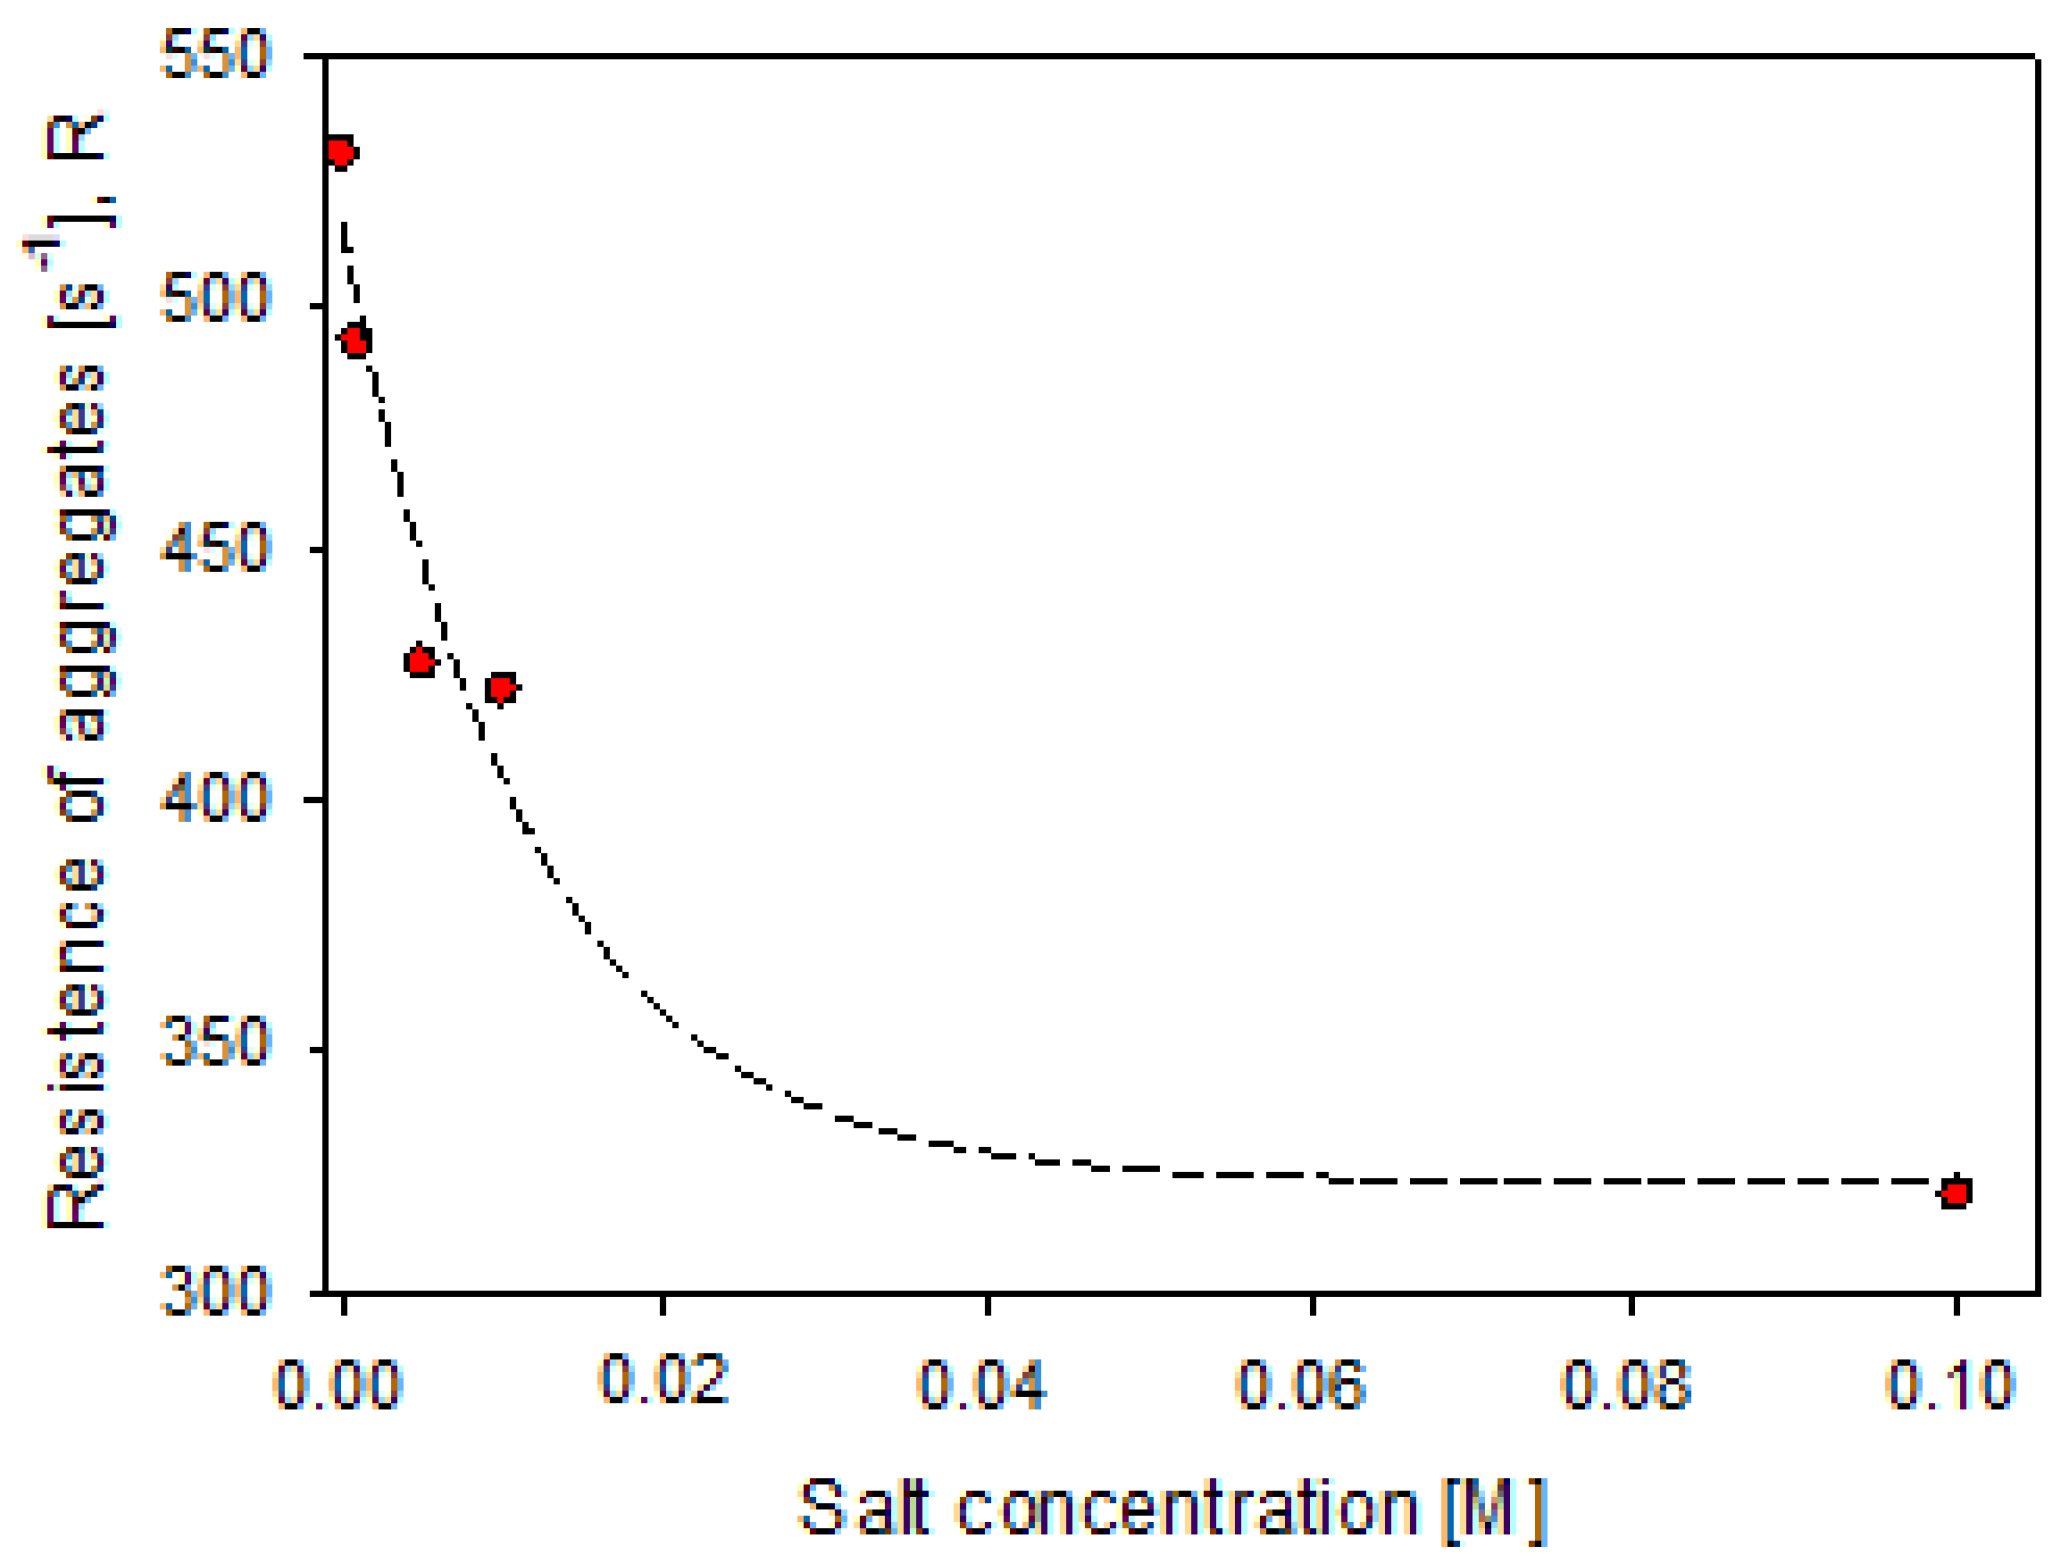
3.4. Aggregate Strength
4. Conclusions
Author Contributions
Funding
Data Availability Statement
Acknowledgments
Conflicts of Interest
References
- Berlin, A.A.; Kislenko, V.N. Kinetic models of suspension flocculation by polymers. Colloids Surf. A Physicochem. Eng. Asp. 1995, 104, 67–72. [Google Scholar] [CrossRef]
- Bremmell, K.E.; Jameson, G.J.; Biggs, S. Polyelectrolyte adsorption at the solid/liquid interface interaction forces and stability. Colloids Surf. A Physicochem. Eng. Asp. 1998, 139, 199–211. [Google Scholar] [CrossRef]
- Biggs, S.; Habgood, M.; Jameson, G.J.; Yan, Y. Aggregate structures formed via a bridging flocculation mechanism. Chem. Eng. J. 2000, 80, 13–22. [Google Scholar] [CrossRef]
- Vajihinejad, V.; Gumfekar, S.P.; Bazoubandi, B.; Rostami Najafabadi, Z.; Soares, J.B.P. Water soluble polymer flocculants: Synthesis, characterization, and performance assessment. Macromol. Mater. Eng. 2019, 304, 1800526. [Google Scholar] [CrossRef] [Green Version]
- Hubbe, M.A.; Nanko, H.; McNeal, M.R. Retention aid polymer interactions with cellulosic surfaces and suspensions: A review. BioResources 2009, 4, 850–906. [Google Scholar] [CrossRef]
- Cadotte, M.; Tellier, M.E.; Blanco, A.; Fuente, E.; Van De Ven, T.G.M.; Paris, J. Floculation, retention and drainage in papermaking: A comparative study of polymeric additives. Can. J. Chem. Eng. 2007, 85, 240–248. [Google Scholar] [CrossRef]
- Nabzar, L.; Pefferkorn, E.; Varoqui, R. Polyacrylamide-sodium kaolinite interactions: Flocculation behavior of polymer clay suspensions. J. Colloid Interface Sci. 1984, 102, 380–388. [Google Scholar] [CrossRef]
- Lee, L.T.; Rahbari, R.; Lecourtier, J.; Chauveteau, G. Adsorption of polyacrylamides on the different faces of kaolinites. J. Colloid Interface Sci. 1991, 147, 351–357. [Google Scholar] [CrossRef]
- Leiva, W.H.; Fawell, P.D.; Goñi, C.; Toro, N.; Jeldres, R.I. Temporal evolution of the structure of tailings aggregates flocculated in seawater. Miner. Eng. 2021, 160, 106708. [Google Scholar] [CrossRef]
- Rasteiro, M.G.; Garcia, F.A.P.; Ferreira, P.; Blanco, A.; Negro, C.; Antunes, E. Evaluation of flocs resistance and reflocculation capacity using the LDS technique. Powder Technol. 2008, 183, 231–238. [Google Scholar] [CrossRef] [Green Version]
- Bache, D.H.; Johnson, C.; McGilligan, J.F.; Rasool, E. A conceptual view of floc structure in the sweep floc domain. In Water Science and Technology; Elsevier Science Ltd: Amsterdam, The Netherlands, 1997; Volume 36, pp. 49–56. [Google Scholar]
- Gregory, J. Monitoring floc formation and breakage. Water Sci. Technol. 2004, 50, 163–170. [Google Scholar] [CrossRef]
- François, R.J. Strength of aluminium hydroxide flocs. Water Res. 1987, 21, 1023–1030. [Google Scholar] [CrossRef]
- Fitzpatrick, C.S.B.; Fradin, E.; Gregory, J. Temperature effects on flocculation, using different coagulants. Water Sci. Technol. 2004, 50, 171–175. [Google Scholar] [CrossRef]
- Leentvaar, J.; Rebhun, M. Strength of ferric hydroxide flocs. Water Res. 1983, 17, 895–902. [Google Scholar] [CrossRef]
- Parker, D.S.; Kaufman, W.J.; Jenkins, D. Floc breakup in turbulent flocculation processes. J. Sanit. Eng. Div. 1972, 98, 79–99. [Google Scholar] [CrossRef]
- Biggs, C.A.; Lant, P.A. Activated sludge flocculation: On-line determination of floc size and the effect of shear. Water Res. 2000, 34, 2542–2550. [Google Scholar] [CrossRef]
- Bache, D.H.; Rasool, E.; Moffat, D.; McGilligan, F.J. On the strength and character of alumino-humic flocs. Water Sci. Technol. 1999, 40, 81–88. [Google Scholar] [CrossRef]
- Bache, D.H. Floc rupture and turbulence: A framework for analysis. Chem. Eng. Sci. 2004, 59, 2521–2534. [Google Scholar] [CrossRef]
- Jarvis, P.; Jefferson, B.; Gregory, J.; Parsons, S.A. A review of floc strength and breakage. Water Res. 2005, 39, 3121–3137. [Google Scholar] [CrossRef] [Green Version]
- Blanco, A.; Fuente, E.; Negro, C.; Tijero, J. Flocculation monitoring: Focused beam reflectance measurement as a measurement tool. Can. J. Chem. Eng. 2008, 80, 1–7. [Google Scholar] [CrossRef]
- Antunes, E.; Garcia, F.A.P.; Ferreira, P.; Blanco, A.; Negro, C.; Rasteiro, M.G. Effect of water cationic content on flocculation, flocs resistance and reflocculation capacity of PCC induced by polyelectrolytes. Ind. Eng. Chem. Res. 2008, 47, 6006–6013. [Google Scholar] [CrossRef] [Green Version]
- Lagaly, G.H. van Olphen: An Introduction to Clay Colloid Chemistry, 2nd ed; John Wiley & Sons: New York, NY, USA; London, UK; Sydney, Australia; Toronto, CN, Canada, 1977. 318 Seiten, Preis: £ 15.–, $ 25.–. Ber. der Bunsenges. für Phys. Chem. 1978, 82, 236–237. [Google Scholar] [CrossRef]
- Rand, B.; Melton, I.E. Particle interactions in aqueous kaolinite suspensions. I. Effect of pH and electrolyte upon the mode of particle interaction in homoionic sodium kaolinite suspensions. J. Colloid Interface Sci. 1977, 60, 308–320. [Google Scholar] [CrossRef]
- Jeldres, R.I.; Fawell, P.D.; Florio, B.J. Population balance modelling to describe the particle aggregation process: A review. Powder Technol. 2018, 326, 190–207. [Google Scholar] [CrossRef]
- Quezada, G.R.; Jeldres, M.; Toro, N.; Robles, P.; Toledo, P.G.; Jeldres, R.I. Understanding the flocculation mechanism of quartz and kaolinite with polyacrylamide in seawater: A molecular dynamics approach. Colloids Surf. A Physicochem. Eng. Asp. 2021, 608, 125576. [Google Scholar] [CrossRef]
- Jeldres, R.I.; Piceros, E.C.; Leiva, W.H.; Toledo, P.G.; Herrera, N. Viscoelasticity and yielding properties of flocculated kaolinite sediments in saline water. Colloids Surf. A Physicochem. Eng. Asp. 2017, 529, 1009–1015. [Google Scholar] [CrossRef]
- Nguyen, T.; Farrow, J.; Smith, J.; Fawell, P. Design and Development of A Novel Thickener Feedwell Using Computational Fluid Dynamics. J. South. Afr. Inst. Min. Metall. 2012, 112, 105–119. [Google Scholar]
- Fawell, P.D.; Nguyen, T.V.; Solnordal, C.B.; Stephens, D.W. Enhancing gravity thickener feedwell design and operation for optimal flocculation through the application of computational fluid dynamics. Miner. Process. Extr. Metall. Rev. 2019, 1–15. [Google Scholar] [CrossRef]
- Selomulya, C.; Bushell, G.; Amal, R.; Waite, T.D. Understanding the role of restructuring in flocculation: The application of a population balance model. Chem. Eng. Sci. 2003, 58, 327–338. [Google Scholar] [CrossRef]
- Quezada, G.R.; Jeldres, R.I.; Fawell, P.D.; Toledo, P.G. Use of molecular dynamics to study the conformation of an anionic polyelectrolyte in saline medium and its adsorption on a quartz surface. Miner. Eng. 2018, 129, 102–105. [Google Scholar] [CrossRef]


| Parameter | Value | |
|---|---|---|
| 0.004 | kg/(m·s) | |
| 0.6 | ||
| 0.08 | m | |
| 0.04 | ||
| 2600 | kg/ | |
| 1000 | kg/ | |
| 0.25 | L | |
| Delta G (s−1) | Amplitude of the Size Reduction of the Aggregates (A) | ||||
|---|---|---|---|---|---|
| 0 M | 0.001 M | 0.005 M | 0.01 M | 0.1 M | |
| 109 | 81.7 | 86.5 | 64.7 | 56.5 | 41.7 |
| 229 | 97.1 | 112.1 | 85.9 | 76.2 | 57.9 |
| 500 | 141.4 | 14.7 | 108.8 | 103.9 | 71.1 |
| 807 | 164.9 | 169.0 | 125.6 | 115.7 | 80.2 |
| 1516 | 180.2 | 186.8 | 138.6 | 125.5 | 84.5 |
| Delta G (s−1) | Decay Constant of the Size of the Aggregates (b) | ||||
|---|---|---|---|---|---|
| 0 M | 0.001 M | 0.005 M | 0.01 M | 0.1 M | |
| 109 | 0.0114 | 0.0115 | 0.0133 | 0.0129 | 0.0096 |
| 229 | 0.0168 | 0.0176 | 0.0246 | 0.0172 | 0.0253 |
| 500 | 0.0322 | 0.0428 | 0.0581 | 0.0396 | 0.0421 |
| 807 | 0.0590 | 0.0613 | 0.0797 | 0.0677 | 0.0729 |
| 1516 | 0.0669 | 0.1260 | 0.0872 | 0.1419 | 0.1041 |
| Salt, M | Rmax,0 [%] | U [%] | ||
|---|---|---|---|---|
| 0 | 32.66 | 67.34 | 530 | 0.9903 |
| 0.001 | 25.72 | 74.28 | 492 | 0.9910 |
| 0.005 | 27.66 | 72.34 | 428 | 0.9964 |
| 0.01 | 24.39 | 75.61 | 422 | 0.9943 |
| 0.1 | 20.76 | 79.24 | 320 | 0.9822 |
| Salinity | Blanco et al. [21] | François et al. [13] | R [s−1] from Equation (10) | ||||
|---|---|---|---|---|---|---|---|
| G = 229 s−1 | G = 807 s−1 | G = 1516 s−1 | G = 229 s−1 | G = 807 s−1 | G = 1516 s−1 | All Shear Rate | |
| 0 M | 53.6 | 14.8 | 14.8 | 0.71 | 0.34 | 0.27 | 530 |
| 0.001 M | 56.6 | 16.3 | 7.9 | 0.71 | 0.36 | 0.28 | 492 |
| 0.005 M | 40.8 | 16.1 | 12.1 | 0.71 | 0.40 | 0.31 | 428 |
| 0.01 M | 58.7 | 17.5 | 7.1 | 0.71 | 0.42 | 0.35 | 422 |
| 0.1 M | 39.8 | 13.8 | 9.6 | 0.69 | 0.47 | 0.41 | 320 |
Publisher’s Note: MDPI stays neutral with regard to jurisdictional claims in published maps and institutional affiliations. |
© 2021 by the authors. Licensee MDPI, Basel, Switzerland. This article is an open access article distributed under the terms and conditions of the Creative Commons Attribution (CC BY) license (https://creativecommons.org/licenses/by/4.0/).
Share and Cite
Jeldres, M.; Ayala, L.; Robles, P.; Gálvez, E.; Leiva, W.H.; Toledo, P.G.; Jeldres, R.I. A Criterion for Estimating the Strength of Flocculated Aggregates in Salt Solutions. Minerals 2021, 11, 713. https://doi.org/10.3390/min11070713
Jeldres M, Ayala L, Robles P, Gálvez E, Leiva WH, Toledo PG, Jeldres RI. A Criterion for Estimating the Strength of Flocculated Aggregates in Salt Solutions. Minerals. 2021; 11(7):713. https://doi.org/10.3390/min11070713
Chicago/Turabian StyleJeldres, Matías, Luis Ayala, Pedro Robles, Edelmira Gálvez, Williams H. Leiva, Pedro G. Toledo, and Ricardo I. Jeldres. 2021. "A Criterion for Estimating the Strength of Flocculated Aggregates in Salt Solutions" Minerals 11, no. 7: 713. https://doi.org/10.3390/min11070713
APA StyleJeldres, M., Ayala, L., Robles, P., Gálvez, E., Leiva, W. H., Toledo, P. G., & Jeldres, R. I. (2021). A Criterion for Estimating the Strength of Flocculated Aggregates in Salt Solutions. Minerals, 11(7), 713. https://doi.org/10.3390/min11070713