Article

The Effect of pH, Ionic Strength and the Presence of PbII on the Formation of Calcium Carbonate from Homogenous Alkaline Solutions at Room Temperature

by
Fulvio Di Lorenzo
1,2,*,
Kay Steiner
1 and
Sergey V. Churakov
1,2
1
Institute of Geological Sciences, University of Bern, Baltzerstasse 3, 3012 Bern, Switzerland
2
Laboratory for Waste Management, Paul Scherrer Institute, Forschungsstrasse 111, 5232 Villigen, Switzerland
*
Author to whom correspondence should be addressed.
Minerals 2021, 11(7), 783; https://doi.org/10.3390/min11070783
Submission received: 19 June 2021 / Revised: 13 July 2021 / Accepted: 15 July 2021 / Published: 19 July 2021

Abstract

:
Precipitation of calcium carbonates in aqueous systems is an important factor controlling various industrial, biological, and geological processes. In the first part of this study, the well-known titration approach introduced by Gebauer and coworkers in 2008 s used to obtain reliable experimental dataset for the deep understanding of CaCO3 nucleation kinetics in supersaturated solutions over a broad range of pH and ionic strength conditions. In the second part, the effect of impurities, i.e., 1 mol% of Pb2+, was assessed in the same range of experimental conditions. Divalent lead has been shown to have an inhibitory effect in all ranges of the conditions tested except for pH 8 and low ionic strength (≤0.15 mol/L). Future investigations might take advantage of the methodology and the data provided in this work to investigate the effect of other system variables. The investigation of all the major variables and the assessment of eventual synergic effects could improve our ability to predict the formation of CaCO3 in complex natural systems.

1. Introduction

Calcium carbonates belong to the most abundant mineral phases in the earth’s crust. Limestone plays a fundamental role in the global carbon cycle through weathering and sedimentation processes [1,2,3]. Calcium carbonate and its crystalline polymorphs are common constituents of biominerals, the intermixed organic/inorganic materials synthesized by many living organisms to build their hard tissues [4]. CaCO3 is a common material in technological applications. Limestone is the main source of lime in cement clinker production [5]. Calcium carbonate is also envisaging to play an important role in developing carbon sequestration, especially in the processes that aim to mimic natural weathering phenomena [6,7]. Finally, CaCO3 is one of the most common scale building materials in various contexts ranging from household cleaning to oil production and hydrothermal systems [8,9].
Several high-quality studies in the last decades have addressed the CaCO3 crystallization mechanism [10,11,12], the crystallographic control of the carbonate growth [13,14,15], and the action of inhibitors and catalysts [16,17,18]. However, to the best of our knowledge, no sufficient data are available to provide systematic guidance for predictions of homogeneous nucleation from supersaturated solutions, in a broad range of pH and ionic strength (I.S.) conditions. Therefore, this study initiates a systematic effort to provide a comprehensive description of the calcite supersaturation degree necessary to nucleate instantaneously solid CaCO3 in a homogeneous solution. The supersaturation indexes (SI) reported for the different solutions at the onset of nucleation always refer to calcite rather than more soluble polymorphs (aragonite, vaterite, amorphous calcium carbonate). The practical reason behind this choice is the possibility of reusing and rescale the reported data. The solubility product of calcite is well known. It is included in all the most popular geochemical software, in contrast to the solubility data for other polymorphs of CaCO3 (e.g., amorphous calcium carbonate). It should be mentioned that the SI data provided in this work can be easily converted into the saturation indexes of other CaCO3 polymorphs by just subtracting the difference in the solubility product between the target CaCO3 polymorphs and calcite. For example, SI indexes with respect to aragonite would be −0.14 SI units lower than the values provided in this work. In the case of the different amorphous calcium carbonate phases identified by Gebauer et al. [10], the SI for protovaterite would be −1.06 SI units lower than calcite. In comparison, the SI for protocalcite would be −0.97 SI units lower. The pH range between 8 and 10 was investigated, at ionic strength values ranging from 0.05 (i.e., no background salt) to 1 M. This range is relevant to several natural and engineering processes [1]. Another variable investigated in the same experimental conditions was the effect of Pb2+ impurities, at the 1% mole ratio regarding calcium, on the CaCO3 nucleation. The effect of trace elements on calcium carbonate formation has relevant implications for technological applications such as wastewater treatment and carbon capture and storage [19,20,21].
The experimental results presented below provide a basis for the investigations of more complex effects, which is essential to improve the prediction of CaCO3 formation in real systems.

2. Materials and Methods

2.1. Materials

American Chemical Society (ACS) grade reactants (Ca(NO3)2 · 4H2O, Pb(NO3)2, Na2CO3, KNO3, NaCl, CaCl2 · 2H2O) from MilliporeSigma (Missouri, St. Louis, MO, USA) were used to prepare the stock solutions. Stock solution with an exact concentration of NaOH 0.1 N and NaOH 0.01 N from MilliporeSigma and HNO3 0.1 M and HNO3 0.01 M (Titrisol®) from Merck (Darmstad, Germany) were used. All the stock solutions were prepared on a molality base. The reactants were diluted in fresh ultrapure water (resistivity = 18.2 MΩ). All experiments were conducted in borosilicate glassware from VWR (Pennsylvania, Radnor, PA, USA).

2.2. Titration Equipment

An OMNIS® Titration system from Metrohm (Herisau, Switzerland), equipped with a conductivity module (856), was used for the controlled-addition pH-stat experiments. The titration system was equipped with two burettes of 20 mL. Six electrodes from Metrohm were used to monitor the evolution of the precipitation reaction: (i) a digital pH-electrode (dUnitrode, Metrohm). (ii) A combined polymer membrane calcium ion-selective electrode (CaISE). (iii) A lead ion-selective electrode (PbISE) with a crystal membrane was used in combination with a reference electrode. (iv) The reference electrode was a silver/silver chloride cell with a double junction system. (v) A conductivity probe, 5-ring conductivity measuring cell with a cell constant c = 0.7 cm−1, with an integrated Pt1000 temperature sensor, was connected to the 856 conductivity module. (vi) A visible light transmittance probe (Optrode, Metrohm) was used to monitor the solution’s turbidity, thereby identifying the formation of solid phases. According to the literature, the Optrode is an optical sensor for photometric titrations, and a wavelength of 610 nm was chosen [18,22]. The system was vigorously stirred with a magnetic impeller at a fixed stirring rate to avoid concentration gradients.

2.3. Titration Experiments

Table 1 summarizes the nucleation experiments performed with or without Pb2+ at three different pH (8, 9, and 10) and ionic strength (0.05, 0.15, and 1.06 M, the last ones are often abbreviated as 0.1 M and 1 M). Nucleation experiments were carried out by adding up to 60 mL of 30 mM Ca(NO3)2 (with or without PbII) at a constant rate (0.24 mL/min) to 180 mL solution with 0.04 M of total inorganic carbon (initial beaker solution). To ensure that the pH of the initial solutions is close to the target experimental condition, sodium carbonate and sodium bicarbonate were mixed in proportions described in Table 1. In the experiments containing Pb, the burette 1 reagent was a mixture of Ca(NO3)2 and Pb(NO3)2. The concentrations are described in Table 1. NaOH 0.1 N was added (software controlled) via the burette 2 to ensure a constant pH value during all the experiments. Experiments were performed at room temperature (23 ± 2 °C) and were stirred constantly with a magnetic impeller. To fix the ionic strength, a background electrolyte was added into the initial solution when necessary, i.e., for 0.1 M and 1 M experiments. Indeed, the experiments with 0.05 M ionic strength had the smallest ionic strength, as no background salt was added. In this condition, the ions in the solution were uniquely the target components and their counter ions. Their concentration increased over time and determined the ionic strength. The value of 0.05 M corresponded to the ionic strength of a solution with the same composition that the system shows at nucleation for pH 9, assuming all the ions to be in the liquid phase (CaTOT = 0.8 ± 0.1 mM, CTOT = 39 ± 1 mM). The use of KNO3 as a background electrolyte was motivated by the need to avoid the formation of insoluble Pb halogenides (e.g., chlorine forms phosgenite) [23]. Between experimental runs, the glassware and the sensors were cleaned in a 0.01 M HCl solution to ensure that no precipitates formed in the previous run were still present. To calculate the saturation index of calcite at nucleation, the actual total concentration of calcium and inorganic carbon were used as input values in a geochemical speciation model calculated with PHREEQC (USGS, Virginia, Reston, VA, USA) using the homonymous database [24]. The geochemical modeling software PHREEQC was also used to compute the thermodynamic properties of the calcite-water equilibrium. In the discussion, to provide an immediate distinction between the color plots containing experimental data and the contour plots derived from geochemical modeling, the latter were presented with a wider pH range, from 7 to 11.

2.4. Calibrations

The pH electrode was calibrated every week using certified standards from Merck (Certipur®) with pH values 4, 7, and 10. The isoelectric point was always between 6.9 and 7.0, and the slope was between 99% and 100%. The conductivity probe was calibrated with a conductivity standard from Sigma-Aldrich to determine the cell constant. The determined cell constant of C = 0.66 cm−1 was found to agree with the manufacturer’s specifications. The ion-selective electrodes were calibrated after each series of nucleation experiments. The ISE calibrations were performed with continuous additions rather than by measuring a fixed number of standards. There are no anions (i.e., there is a nitrate, but no carbon source in the beaker) present during calibrations to avoid solids forming, or in other words, to ensure that all calcium dosed will be in solution, thereby measurable.

3. Results

3.1. Physical-Chemistry Basis for Titration Experiments

The investigation of the pure system was a preliminary step to understand the effect of Pb2+ on the formation of CaCO3. The formation of CaCO3 was observed at different conditions of pH and ionic strength. To explain the underlying processes of chemical control and system behavior in titration experiments, the four channels that were constantly monitored during an experimental run with no-Pb, are shown in Figure 1 for the intermediate conditions (pH 9, I.S. = 0.15 M). The saturation index of calcite calculated when nucleation was observed is hereafter referred to as the critical supersaturation. A critical supersaturation concerning calcite was reached by adding a constant amount of Ca2+ ions to the C-bearing solution. After a certain time corresponding to a specific degree of saturation, the formation of a solid phase was observed. The nucleation of a solid phase was clearly distinguishable in all the monitored channels. Three distinct regions could be identified by observing the signal recorded by the CaISE (Figure 1A). The initial segment of the curve showing a linear increase of [Ca2+]free defines the prenucleation stage. This region was followed by an interval where the free calcium concentration reached a maximum despite the continuous addition (II in Figure 1A). This second region was referred to as the nucleation stage, and it was delimited on the left by the loss of a linear relationship between dosed calcium and free calcium and on the right by the maximum of [Ca2+]free. The difficulty in precisely locating the nucleation event represents the major uncertainty in interpreting the experimental data reported below. The nucleation stage had a typical duration of about 300 s. This time interval is usually longer than the uncertainty of the measurement derived from the CaISE onset in two independent replicas of the same experiment. The maximum of [Ca2+]free curve marks a boundary to the third region where the dominant process is the continuous growth of the solid particles out of nuclei formed at the second stage (III in Figure 1A). The formation of a solid phase (i.e., the nucleation, stage II) could also be detected by the drop of visible light transmittance (Figure 1B). The development of turbidity in the reactor results from the formation of suspended solid particles that scatter the light. This phenomenon is tracked with an in situ visible light transmittance probe, the Optrode. The drop in the light transmittance recorded by the Optrode reveals the appearance of solid particles in the solution. Occasionally, the formation of air bubbles due to stirring on the Optrode window induces a distortion of the signal. Still, it can be easily identified, and the bubbles can be removed by moving the probe gently in the solution. The formation of solid phases leads to a decrease in the concentration of the aqueous species. Therefore, the electrical conductivity shows a slope change in correspondence with the solid phase formation (Figure 1C). Dashed lines corresponding to a linear fit of the initial and final segments are displayed together with the experimental data to highlight the presence of a slope change in correspondence with the beginning of the nucleation stage.
The incorporation of CaCO3 units into the solid phase leads to the acidification of the solution because the carbonate units are removed selectively from the carbon species.
Ca2+ + CO32− → CaCO3(s)
The removal of carbonate units by precipitation reaction (1) modifies the ratio between carbonate and bicarbonate ions. Consequently, the pH of the solution becomes more acidic. When the selected threshold of pH is reached, the automatic addition of a base raises the pH. According to the law of mass action, the initial carbonate/bicarbonate ratio is restored.
HCO3 + OH → CO32− + H2O
In the experiments presented below, the pH was maintained constant during the entire process thanks to the automatic addition of 0.1 N NaOH (Figure 1D). The cumulative amount of NaOH showed a slope change in correspondence with the nucleation stage. The increase of the rate of NaOH addition coincided with the point when the consumption of carbonate ions due to the formation of a solid phase that becomes predominant over the consumption associated with the formation of aqueous species (i.e., complexes, ion pairs, and prenucleation clusters).

3.2. The Effect of pH and Ionic Strength on CaCO3 Formation

The effect of pH on CaCO3 formation was studied, modifying the ratio of carbonate salts used to prepare the initial solution in the reactor. Increasing pH at constant ionic strength reduces the Ca concentration necessary for the formation of the solid phase. This effect was evident by observing the CaISE and the light transmittance channels (Figure 2A) for the intermediate ionic strength, 0.15 M. Analogous results were obtained for the other ionic strength conditions tested (0.05 and 1.05 M), as shown in the discussion.
The systematic investigation of the effect of ionic strength was obtained by adding KNO3 in the reactor and the calcium burette. To observe the effect of ionic strength, the experiments at pH 9 with different ionic strengths are reported in Figure 2B. While dealing with ionic strength, it is worth mentioning that ion-selective electrodes are extremely sensitive to this parameter. To avoid artefacts, in addition to the signals from CaISE and the light transmittance sensor, the amount of dosed NaOH was also reported for the experiments at different ionic strengths. These measurements confirmed that the nucleation of CaCO3 was delayed when the concentration of background salts increased. All three channels showed an abrupt change that corresponds to the formation of a solid phase. Only the conductivity was not shown due to the very different initial values. As previously shown, these changes allowed us to estimate the total calcium concentration necessary to achieve the precipitation of a solid phase in a homogenous solution containing Ca and C in a concentration above the solubility of calcite, thus supersaturated.

3.3. The Effect of Pb2+ on CaCO3 Formation

The addition of 1-mole percent of Pb2+ to the Ca2+ reactant clearly affected the CaCO3 nucleation kinetics. At most of the conditions studied, Pb2+ ions showed inhibition of CaCO3 nucleation. The only exceptions were the experiments at low ionic strength (≤0.15 M) and pH 8, for which only a weak inhibition effect was observed if compared with the experimental uncertainty. Figure 3 shows the evolution of free calcium and visible light transmittance during experiments at different pH and constant ionic strength. When Pb was present, higher supersaturation was required for the instantaneous nucleation of CaCO3 to occur. The effect was remarkable for pH 9 and 10, while it fell within the experimental uncertainty for pH 8. The effect was very notable at pH 9 as the average time for the onset of nucleation almost doubled in the presence of Pb. For example, the induction time increased from 25 ± 3 min to 55 ± 5 min in the experiments at pH 9 and ionic strength 0.1 M (Figure 3). The delay in the nucleation indicates that a higher total calcium concentration was necessary to trigger the instantaneous nucleation of CaCO3. In the above-mentioned example, the increase due to Pb2+ of the CaTOT at nucleation was from 0.8 ± 0.2 mM to 2.0 ± 0.3 mM.
The ionic strength also influences the inhibitory effect of Pb on CaCO3 nucleation. In general, the effect is higher at higher ionic strength, as explained in the discussion. The uncertainty in determining the nucleation onset of the calcium carbonate in the experiments involving Pb was higher than in the pure system because the nucleation was also determined based on the signal recorded by the PbISE. In order to maintain the focus of this work, the Pb was considered to co-precipitate always with CaCO3. The time difference between the onset recorded by the CaISE and the PbISE was considered to be within the experimental error. Further studies will be necessary to describe the incorporation of Pb in calcium carbonate, the existence of co-precipitation, and the formation of solid solutions.

4. Discussion

4.1. The Effect of pH and Ionic Strength on the Saturation State of Calcite

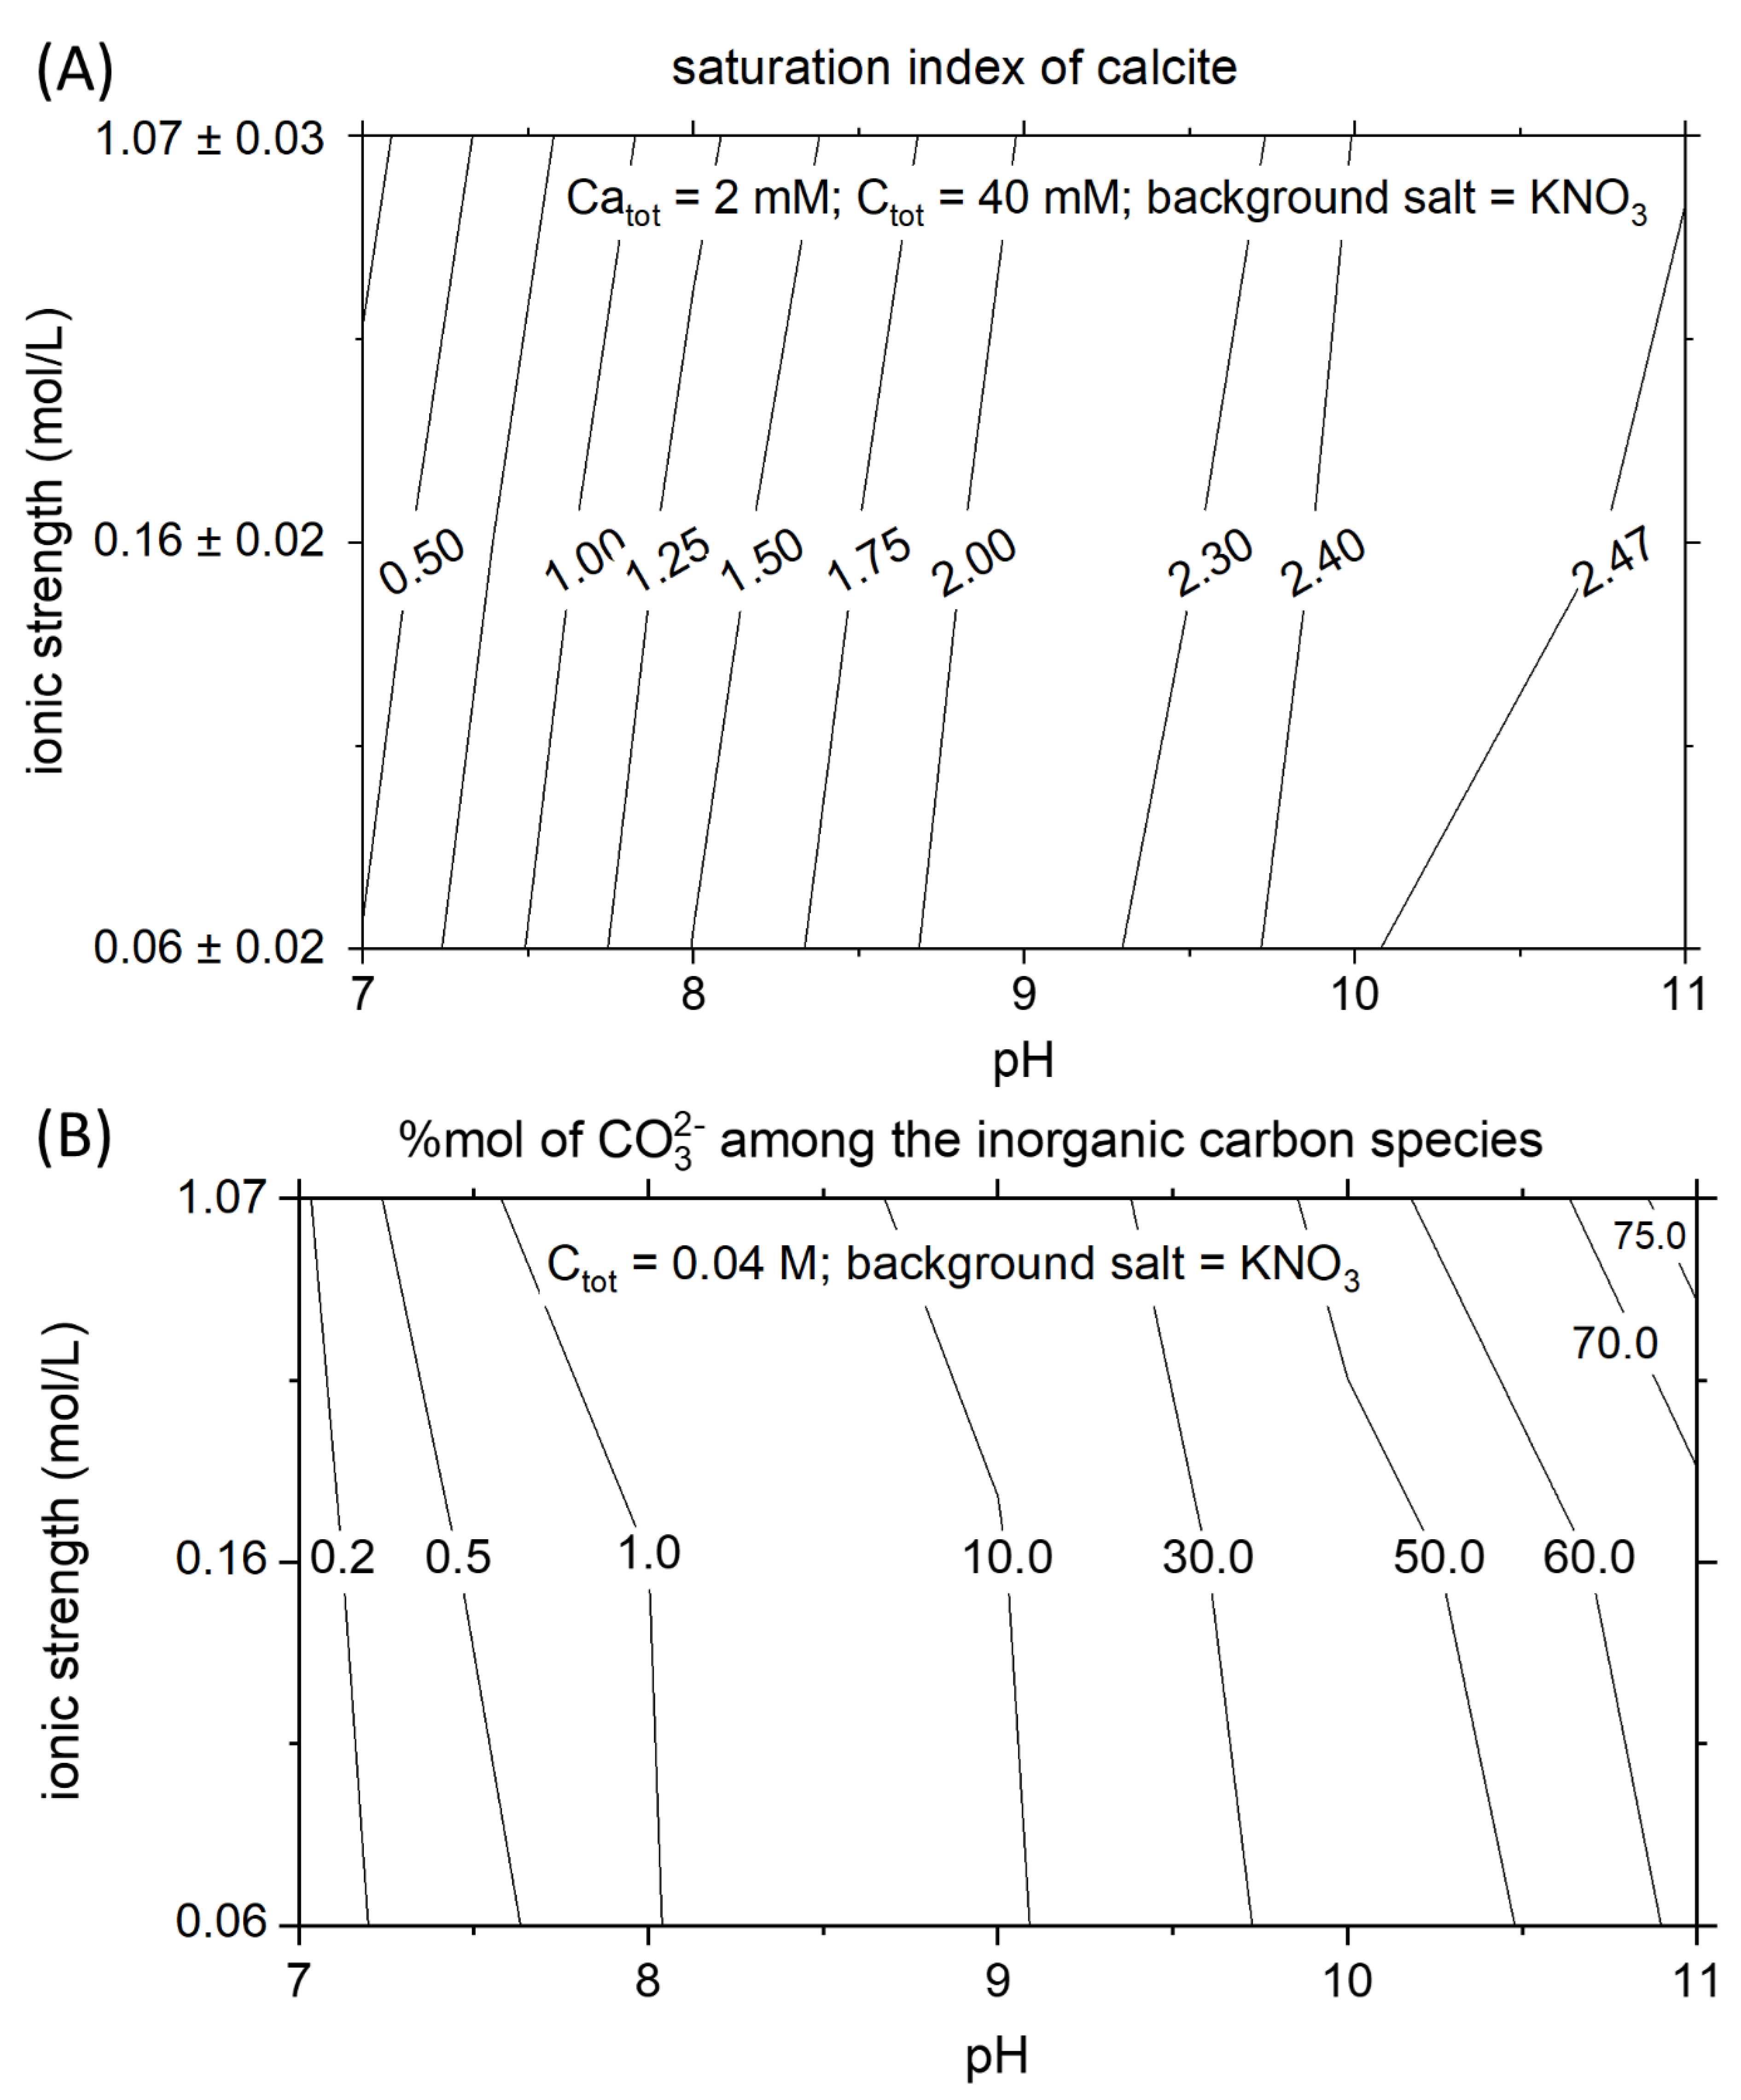
The saturation state of calcite in a solution, with constant Ca and C concentration, is highly dependent on pH and ionic strength. The ionic strength is a crucial parameter that controls the activity of the ions in the solution. The Debye–Huckel and the Davies equations are commonly used to describe the relationship existing between activity coefficients and ionic strength. These equations demonstrate that the activity coefficients of the ions in a solution decrease with increasing ionic strength. Therefore, calcite becomes more soluble at higher salinity, and the saturated solution contains a higher concentration of calcium and carbonate ions. This effect can be seen by analyzing a vertical cross-section along the contour plot in Figure 4A. At constant CaTOT and CTOT, the supersaturation with respect to calcite is smallest at 0.05 M and highest at 1 M. The effect of pH on the solubility of calcite is substantial. The dissociations constants of the carbonic acid control the concentration of the mono and doubly protonated carbon species. In Figure 4B, the mole percentage of CO32− among the carbon speciation is presented for the range of pH and ionic strength of interest. The mole percent of CO32− increases one order of magnitude (from 1 to 10%) while passing from pH 8 to 9. The different amount of carbonate ions as a function of pH, at constant CTOT, is mainly responsible for the strong variation of the supersaturation of calcite with pH. Following a horizontal line in Figure 4A, the variation of the supersaturation index of calcite as a function of pH is observable. The supersaturation index corresponds to the logarithm of the ratio between the ions’ activity product and the solubility product. Therefore, an increase of the saturation index by one unit corresponds to a tenfold increase in the ratio between the actual ions activity and the activity of the ions at equilibrium. Increasing the pH by one unit at constant ionic strength corresponds to increase the supersaturation index by about 0.8 units between pH 8–9 and by 0.5 units for the pH range 9–10.
The precipitation experiments performed allow calculation of the supersaturation index necessary for instantaneous nucleation of CaCO3, the critical supersaturation of calcite. Molecular aspects of the association between calcium and carbonate ions during the crystallization of CaCO3 are under debate [10,11,25,26]. In this work, the supersaturation indices presented below refer to the values calculated at the nucleation stage based on the total amount of calcium (i.e., weighted in value) through the geochemical modeling software PHREEQC. Figure 5 shows the critical supersaturation of calcite obtained from our experiments together with literature values derived from two publications that used the same setup, although different experimental conditions [10,18]. In particular, the different concentrations employed in other publications lead to a different Ca2+/CO32− activity ratio at the nucleation stage. This effect has been pointed out as a crucial variable during calcite formation [27,28,29]. The values calculated from these different experiments show remarkable consistency, assuming an experimental error of about 0.1 units that derive from the intrinsic criticisms presented in the Results.
The critical supersaturation of calcite increases with increasing the pH and the ionic strength (Figure 5). Comparing the critical supersaturation of calcite in the experiments (Figure 5) and the theoretical supersaturation of calcite in a solution with the same CTOT and a constant CaTOT = 2 mM (Figure 4A), it is possible to understand if the theoretical solutions would precipitate instantaneously or remain metastable for a certain amount of time. In the example in Figure 4A, at CaTOT = 2 mM (reached after 3300 s in our system), the comparison with the matrix of critical supersaturation allows us to predict that instantaneous precipitation occurs in all the solutions with pH higher than 8.
The critical supersaturation is a useful upper threshold for determining the conditions that lead to CaCO3 nucleation in a homogenous aqueous phase. Calcium carbonate formation has a crucial role in mineral scaling, cement degradation, and the prediction of sediment deposition [8,9,30,31,32]. Therefore, the contour plots in Figure 5 can be used as a practical guide for predicting the conditions that will bring to the formation of CaCO3 in a homogeneous solution. The broad ranges of pH and ionic strength that are considered allow estimating of the critical supersaturation of calcite in real systems such as marine and fluvial basins and groundwater and wastewater [1].

4.2. Inhibitory Effect of Pb2+ on Calcium Carbonate Nucleation

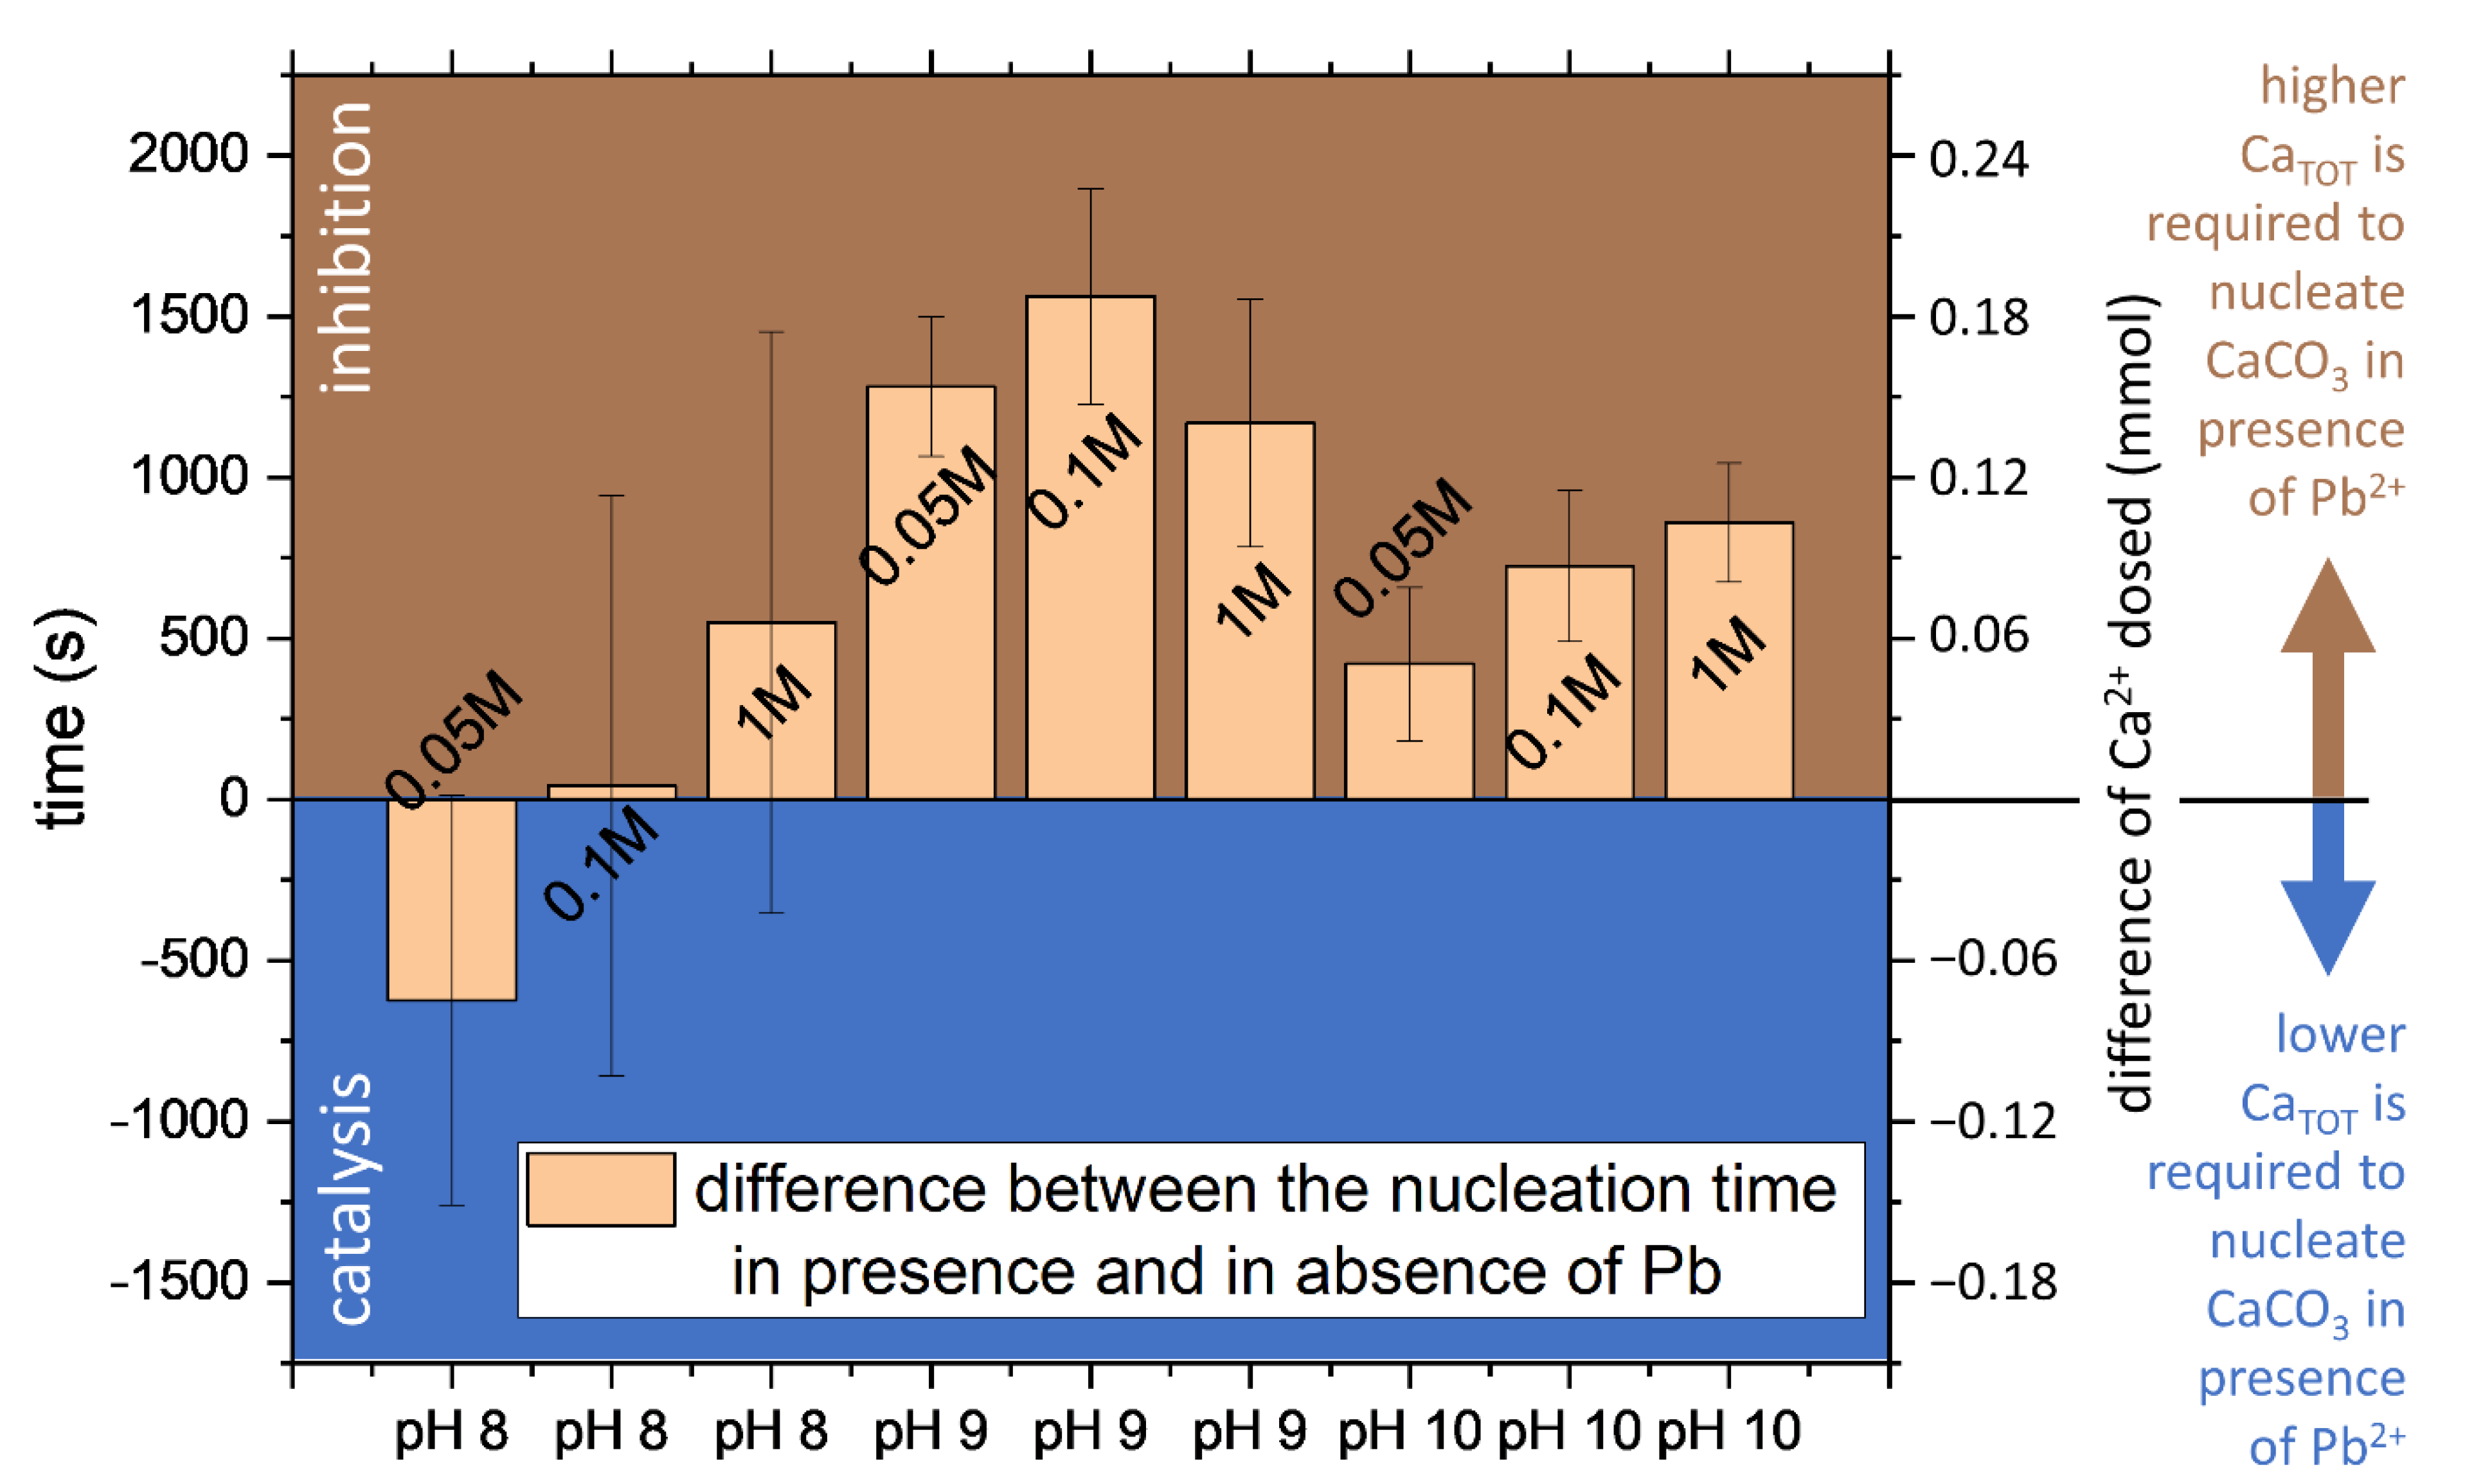
Calcium carbonate formation is affected by the pH and the ionic strength of the medium, but not only by them. Another crucial factor that plays a role in the nucleation and growth of CaCO3 is the presence of foreign ions. Divalent cations are particularly prone to interact with CaCO3. Magnesium [33,34] and ferrous iron [18,35] were reported to inhibit CaCO3 nucleation and growth. An inhibitory effect on CaCO3 formation is also observed for divalent lead (Figure 6). In the presence of Pb2+, the total CaTOT required to obtain the instantaneous precipitation of CaCO3 was higher than in the experiments without Pb2+. This behavior is visible for all the conditions tested, except for the experiments performed at pH 8. At the lowest pH tested, the onset of CaISE and PbISE signals shows a mismatch as reflected by the increase of the experimental error; this behavior suggests the possibility of a parallel nucleation event by a secondary phase to occur in these conditions. Further studies will investigate the nature of the precipitates, the formation of solid solutions, and the ion partitioning between liquid and solid phases.
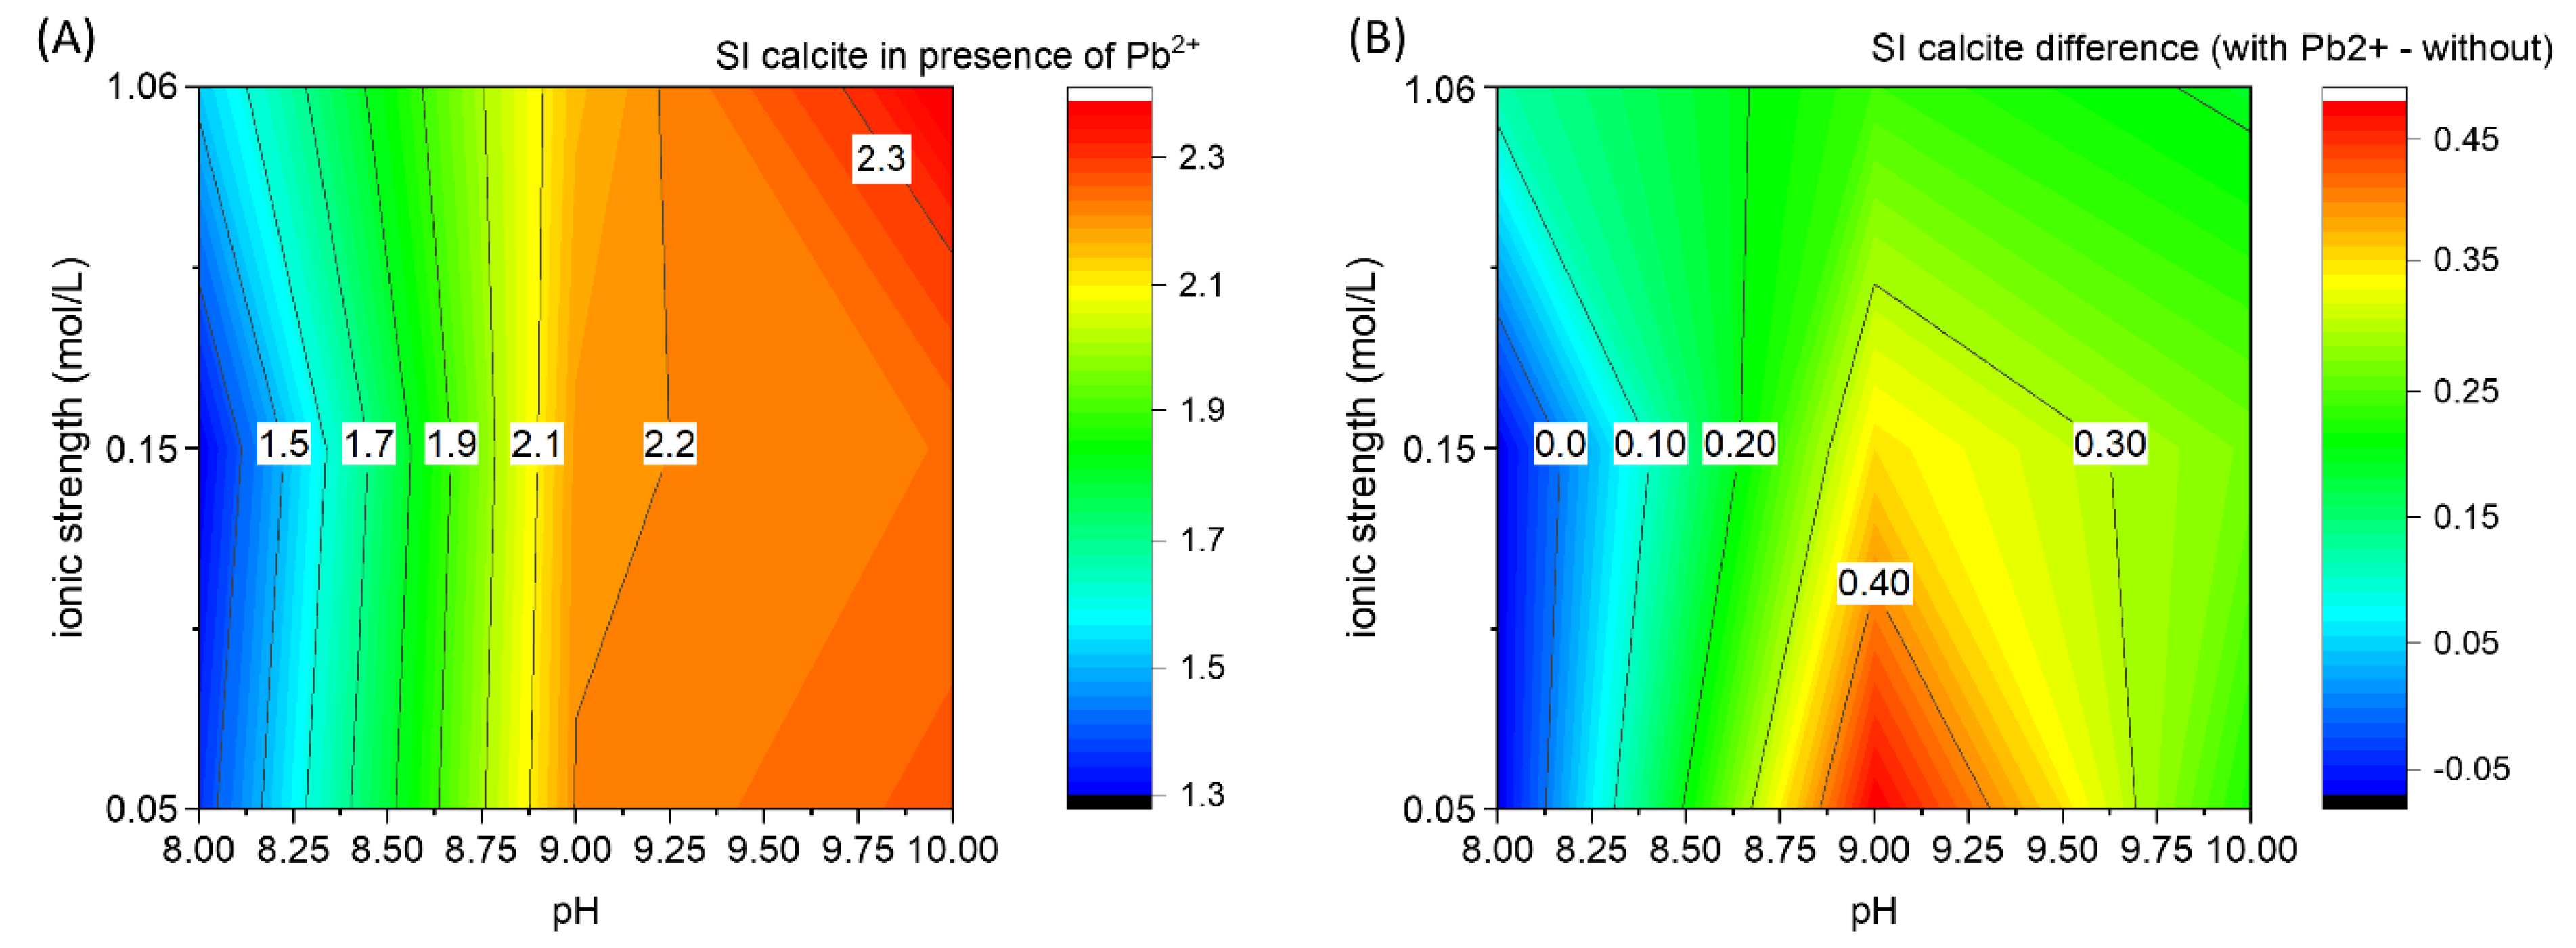
To observe the effect of Pb2+ on the CaCO3 nucleation, a contour plot with the critical supersaturation of calcite (Figure 7A) is calculated from the onset of the CaISE signal using PHREEQC weighted-in concentrations, as previously done for the pure Ca-CO2-H2O system (Figure 5). The difference between the critical supersaturation values of calcite observed in the presence and in the absence of Pb2+ is reported in Figure 7B. The critical supersaturation necessary for spontaneous nucleation is higher in the presence of Pb2+ except for pH 8 at low ionic strength values (≤0.15 M). The most pronounced inhibition of CaCO3 nucleation due to the presence of Pb2+ is observed at pH 9 and with low ionic strength. In the context of predicting CaCO3 formation, it could be very useful to have difference matrices (analogous to Figure 7B) for the most relevant components of the real systems to be able to realistically predict the supersaturation of calcite that will trigger the homogenous precipitation of calcite (using Figure 5 as reference value). To improve the reusability of the data included in this work, the matrix with the critical supersaturation indexes of calcite, corresponding to Figure 5 and Figure 7b, is provided in Table 2.
Further studies, focusing on the effect of surface anchoring and heterogeneous nucleation, could help derive the influence of this additional parameter for different materials, thereby refining the ability to forecast the concentration that will induce the instantaneous appearance of solid CaCO3 in a specific context or application.

5. Conclusions

The precipitation of carbonate minerals is highly relevant in numerous technological and environmental challenges faced by modern society. The control of anthropogenic CO2 emissions, the reduction of scaling-related issues, and the removal of heavy metals are just a few most prominent examples. Despite years of research, a reliable forecast of carbonate precipitation is still unfeasible due to the lack of experimental data covering the entire range of relevant chemical conditions.
The experimental results presented in this work aim to improve the predictability of spontaneous CaCO3 precipitation in a broad range of pH (8–10) and ionic strength (0.05–1 M) conditions. In this whole range of conditions, we observed the precipitation of CaCO3 at solution compositions corresponding to a saturation index of calcite SI = 1.4–2.2 ± 0.1 in the pure system and SI = 1.3–2.4 ± 0.1 in the presence of Pb2+. These results constitute the basic knowledge to understand and quantify the effect of other fundamental components of real systems. An example of this incremental approach is given for the presence of Pb2+. This harmful heavy metal is a common and dangerous contaminant found in an aquatic system subject to the release of industrial wastewater. The experiments performed show that Pb2+ has a significant inhibitory effect on the formation of CaCO3 even at a high Ca/Pb mole ratio (Ca/Pb = 100) that resembles the composition of real systems.
This result is particularly interesting for applications in the field of geological carbon storage. The Carbfix project in Iceland is optimizing the conditions for carbon sequestration via mineralization of dissolved CO2 in contact with basaltic rocks in a process that mimics natural rock weathering [6,7]. A serious problem found during pilot injections is the quick and progressive loss of permeability in the injection well. The formation of CaCO3 scaling in the early segments of the injection well is the main responsible for this systematic clogging phenomenon. If the fresh groundwater, normally used to dissolve the CO2, would be substituted with wastewater, which normally has higher salinity and higher concentration of foreign divalent ions (Pb, Cd, Zn, Ni, etc.), the formation of CaCO3 scaling in the early reaction stage could be delayed improving the efficiency of the carbon capture process. Such a scenario could also combine the cost associated with two highly demanding processes (water treatment and carbon capture) into a single and more efficient process. However, further studies will be necessary to understand and quantify the effect of other divalent cations. In particular, the role of co-precipitation vs. dual precipitation events, the formation of solid solutions, and the partitioning of ions between liquid and solid phases.

Author Contributions

Conceptualization, F.D.L. and S.V.C.; methodology, F.D.L.; formal analysis, K.S. and F.D.L.; investigation, K.S. and F.D.L.; writing—original draft preparation, F.D.L.; writing—review and editing, F.D.L.; supervision, S.V.C.; funding acquisition, S.V.C. All authors have read and agreed to the published version of the manuscript.

Funding

Not applicable.

Institutional Review Board Statement

Not applicable.

Informed Consent Statement

Not applicable.

Data Availability Statement

All the data are provided in the manuscript.

Conflicts of Interest

The authors declare no conflict of interest.

References

  1. Stumm, W.; Morgan, J.J. Aquatic Chemistry: Chemical Equilibria and Rates in Natural Waters; Wiley: Hoboken, NJ, USA, 1996; p. 1040. [Google Scholar]
  2. Morse, J.W.; Arvidson, R.S.; Lüttge, A. Calcium carbonate formation and dissolution. Chem. Rev. 2007, 107, 342–381. [Google Scholar] [CrossRef]
  3. Dong, S.; Berelson, W.M.; Rollins, N.E.; Subhas, A.V.; Naviaux, J.D.; Celestian, A.J.; Liu, X.; Turaga, N.; Kemnitz, N.J.; Byrne, R.H.; et al. Aragonite dissolution kinetics and calcite/aragonite ratios in sinking and suspended particles in the North Pacific. Earth Planet. Sci. Lett. 2019, 515, 1–12. [Google Scholar] [CrossRef] [Green Version]
  4. Addadi, B.L.; Raz, S.; Weiner, S. Taking Advantage of Disorder: Amorphous Calcium Carbonate and Its Roles in Biomineralization. Adv. Mater. 2003, 12, 959–970. [Google Scholar] [CrossRef]
  5. Salas, D.A.; Ramirez, A.D.; Rodríguez, C.R.; Petroche, D.M.; Boero, A.J.; Duque-Rivera, J. Environmental impacts, life cycle assessment and potential improvement measures for cement production: A literature review. J. Clean. Prod. 2016, 113, 114–122. [Google Scholar] [CrossRef]
  6. Matter, J.M.; Broecker, W.S.; Gislason, S.R.; Gunnlaugsson, E.; Oelkers, E.H.; Stute, M.; Sigurdardottir, H.; Stefansson, A.; Alfredsson, H.A.; Aradottir, E.S.; et al. The CarbFix Pilot Project—Storing Carbon Dioxide in Basalt. Energy Procedia 2011, 4, 5579–5585. [Google Scholar] [CrossRef] [Green Version]
  7. Gislason, S.R.; Oelkers, E.H. Carbon storage in basalt. Science 2014, 344, 373–374. [Google Scholar] [CrossRef] [PubMed]
  8. Khormali, A.; Petrakov, D.G.; Nazari Moghaddam, R. Study of adsorption/desorption properties of a new scale inhibitor package to prevent calcium carbonate formation during water injection in oil reservoirs. J. Pet. Sci. Eng. 2017, 153, 257–267. [Google Scholar] [CrossRef]
  9. Warsinger, D.M.; Swaminathan, J.; Guillen-Burrieza, E.; Arafat, H.A.; Lienhard, V.J.H. Scaling and fouling in membrane distillation for desalination applications: A review. Desalination 2015, 356, 294–313. [Google Scholar] [CrossRef]
  10. Gebauer, D.; Völkel, A.; Cölfen, H. Stable Prenucleation Calcium Carbonate Clusters. Science 2008, 322, 1819–1822. [Google Scholar] [CrossRef] [PubMed] [Green Version]
  11. Henzler, K.; Fetisov, E.O.; Galib, M.; Baer, M.D.; Legg, B.A.; Borca, C.; Xto, J.M.; Pin, S.; Fulton, J.L.; Schenter, G.K.; et al. Supersaturated calcium carbonate solutions are classical. Sci. Adv. 2018, 4, 1–12. [Google Scholar] [CrossRef] [Green Version]
  12. Avaro, J.T.; Wolf, S.L.P.; Hauser, K.; Gebauer, D. Stable Prenucleation Calcium Carbonate Clusters Define Liquid. Liq. Phase Sep. 2020, 6155–6159. [Google Scholar] [CrossRef]
  13. Hong, M.; Xu, J.; Teng, H.H. Evolution of calcite growth morphology in the presence of magnesium: Implications for the dolomite problem. Geochim. Cosmochim. Acta 2016, 172, 55–64. [Google Scholar] [CrossRef] [Green Version]
  14. Di Lorenzo, F.; Cametti, G.; Vanhecke, D.; Churakov, S.V. The role of interfaces in controlling Pb2+ removal by calcium carbonate minerals. Cryst. Growth Des. 2020, 20, 6157–6169. [Google Scholar] [CrossRef]
  15. Godelitsas, A.; Astilleros, J.M.; Hallam, K.R.; Löns, J.; Putnis, A. Microscopic and spectroscopic investigation of the calcite surface interacted with Hg(II) in aqueous solutions. Mineral. Mag. 2003, 67, 1193–1204. [Google Scholar] [CrossRef] [Green Version]
  16. Oelkers, E.H.; Golubev, S.V.; Pokrovsky, O.S.; Bénézeth, P. Do organic ligands affect calcite dissolution rates? Geochim. Cosmochim. Acta 2011, 75, 1799–1813. [Google Scholar] [CrossRef]
  17. Ruiz-Agudo, E.; Putnis, C.V.; Hövelmann, J.; Álvarez-Lloret, P.; Ibáñez-Velasco, A.; Putnis, A. Experimental study of the replacement of calcite by calcium sulphates. Geochim. Cosmochim. Acta 2015, 156, 75–93. [Google Scholar] [CrossRef]
  18. Di Lorenzo, F.; Burgos-Cara, A.; Ruiz-Agudo, E.; Putnis, C.V.; Prieto, M. Effect of ferrous iron on the nucleation and growth of CaCO3 in slightly basic aqueous solutions. CrystEngComm 2017, 19, 447–460. [Google Scholar] [CrossRef]
  19. Nriagu, J.O.; Pacyna, J.M. Quantitative assessment of worldwide contamination of air, water and soils by trace metals. Nature 1988, 333, 134–139. [Google Scholar] [CrossRef]
  20. Prieto, M.; Heberling, F.; Rodríguez-Galán, R.M.; Brandt, F. Crystallization behavior of solid solutions from aqueous solutions: An environmental perspective. Prog. Cryst. Growth Charact. Mater. 2016, 62, 29–68. [Google Scholar] [CrossRef]
  21. González-Núñez, R.; Rigol, A.; Vidal, M. Assessing the efficacy over time of the addition of industrial by-products to remediate contaminated soils at a pilot-plant scale. Environ. Monit. Assess. 2017, 189. [Google Scholar] [CrossRef] [PubMed]
  22. Rodriguez-Navarro, C.; Ruiz-Agudo, E.; Burgos-Cara, A.; Elert, K.; Hansen, E.F. Crystallization and Colloidal Stabilization of Ca(OH)2 in the Presence of Nopal Juice (Opuntia ficus indica): Implications in Architectural Heritage Conservation. Langmuir 2017, 33, 10936–10950. [Google Scholar] [CrossRef]
  23. Bersani, D.; Campani, E.; Casoli, A.; Lottici, P.P.; Marino, I.G. Spectroscopic study of the degradation products in the holy water fonts in Santa Maria della Steccata Church in Parma (Italy). Anal. Chim. Acta 2008, 610, 74–79. [Google Scholar] [CrossRef]
  24. Parkhurst, D.L.; Appelo, C.A.J. Description of Input and Examples for PHREEQC Version 3-A Computer Program for Speciation, Batch-Reaction, One-Dimensional Transport, and Inverse Geochemical Calculations; Book 6, Section A; US Geological Survey: Reston, VA, USA, 2013; Chapter 43.
  25. De Yoreo, J.J.; Vekilov, P.G. Principles of Crystal Nucleation and Growth. Rev. Mineral. Geochem. 2003, 54, 57–93. [Google Scholar] [CrossRef] [Green Version]
  26. Gebauer, D.; Cölfen, H. Prenucleation clusters and non-classical nucleation. Nano Today 2011, 6, 564–584. [Google Scholar] [CrossRef] [Green Version]
  27. Wolthers, M.; Nehrke, G.; Gustafsson, J.P.; Van Cappellen, P. Calcite growth kinetics: Modeling the effect of solution stoichiometry. Geochim. Cosmochim. Acta 2012, 77, 121–134. [Google Scholar] [CrossRef] [Green Version]
  28. Seepma, S.Y.M.H.; Ruiz-Hernandez, S.E.; Nehrke, G.; Soetaert, K.; Philipse, A.P.; Kuipers, B.W.M.; Wolthers, M. Controlling CaCOParticle Size with {Ca2+}:{CO32−} Ratios in Aqueous Environments. Cryst. Growth Des. 2021, 21, 1576–1590. [Google Scholar] [CrossRef]
  29. Mills, J.V.; DePaolo, D.J.; Lammers, L.N. The influence of Ca:CO3 stoichiometry on Ca isotope fractionation: Implications for process-based models of calcite growth. Geochim. Cosmochim. Acta 2021, 298, 87–111. [Google Scholar] [CrossRef]
  30. Kutchko, B.G.; Strazisar, B.R.; Dzombak, D.A.; Lowry, G.V.; Thauiow, N. Degradation of well cement by CO2 under geologic sequestration conditions. Environ. Sci. Technol. 2007, 41, 4787–4792. [Google Scholar] [CrossRef] [PubMed]
  31. Duguid, A.; Scherer, G.W. Degradation of oilwell cement due to exposure to carbonated brine. Int. J. Greenh. Gas Control 2010, 4, 546–560. [Google Scholar] [CrossRef]
  32. Arvidson, R.S.; Mackenzie, F.T. The Dolomite Problem: Control of Precipitation Kinetics by Temperature and Saturation State. Am. J. Sci. 1999, 2, 257–288. [Google Scholar] [CrossRef] [Green Version]
  33. Lin, Y.-P.; Singer, P.C. Effect of Mg2+ on the kinetics of calcite crystal growth. J. Cryst. Growth 2009, 312, 136–140. [Google Scholar] [CrossRef]
  34. Astilleros, J.M.; Fernández-Díaz, L.; Putnis, A. The role of magnesium in the growth of calcite: An AFM study. Chem. Geol. 2010, 271, 52–58. [Google Scholar] [CrossRef] [Green Version]
  35. Katz, J.L.; Reick, M.R.; Herzog, R.E.; Parsiegla, K.I. Calcite Growth Inhibition by Iron. Langmuir 1993, 9, 1423–1430. [Google Scholar] [CrossRef]
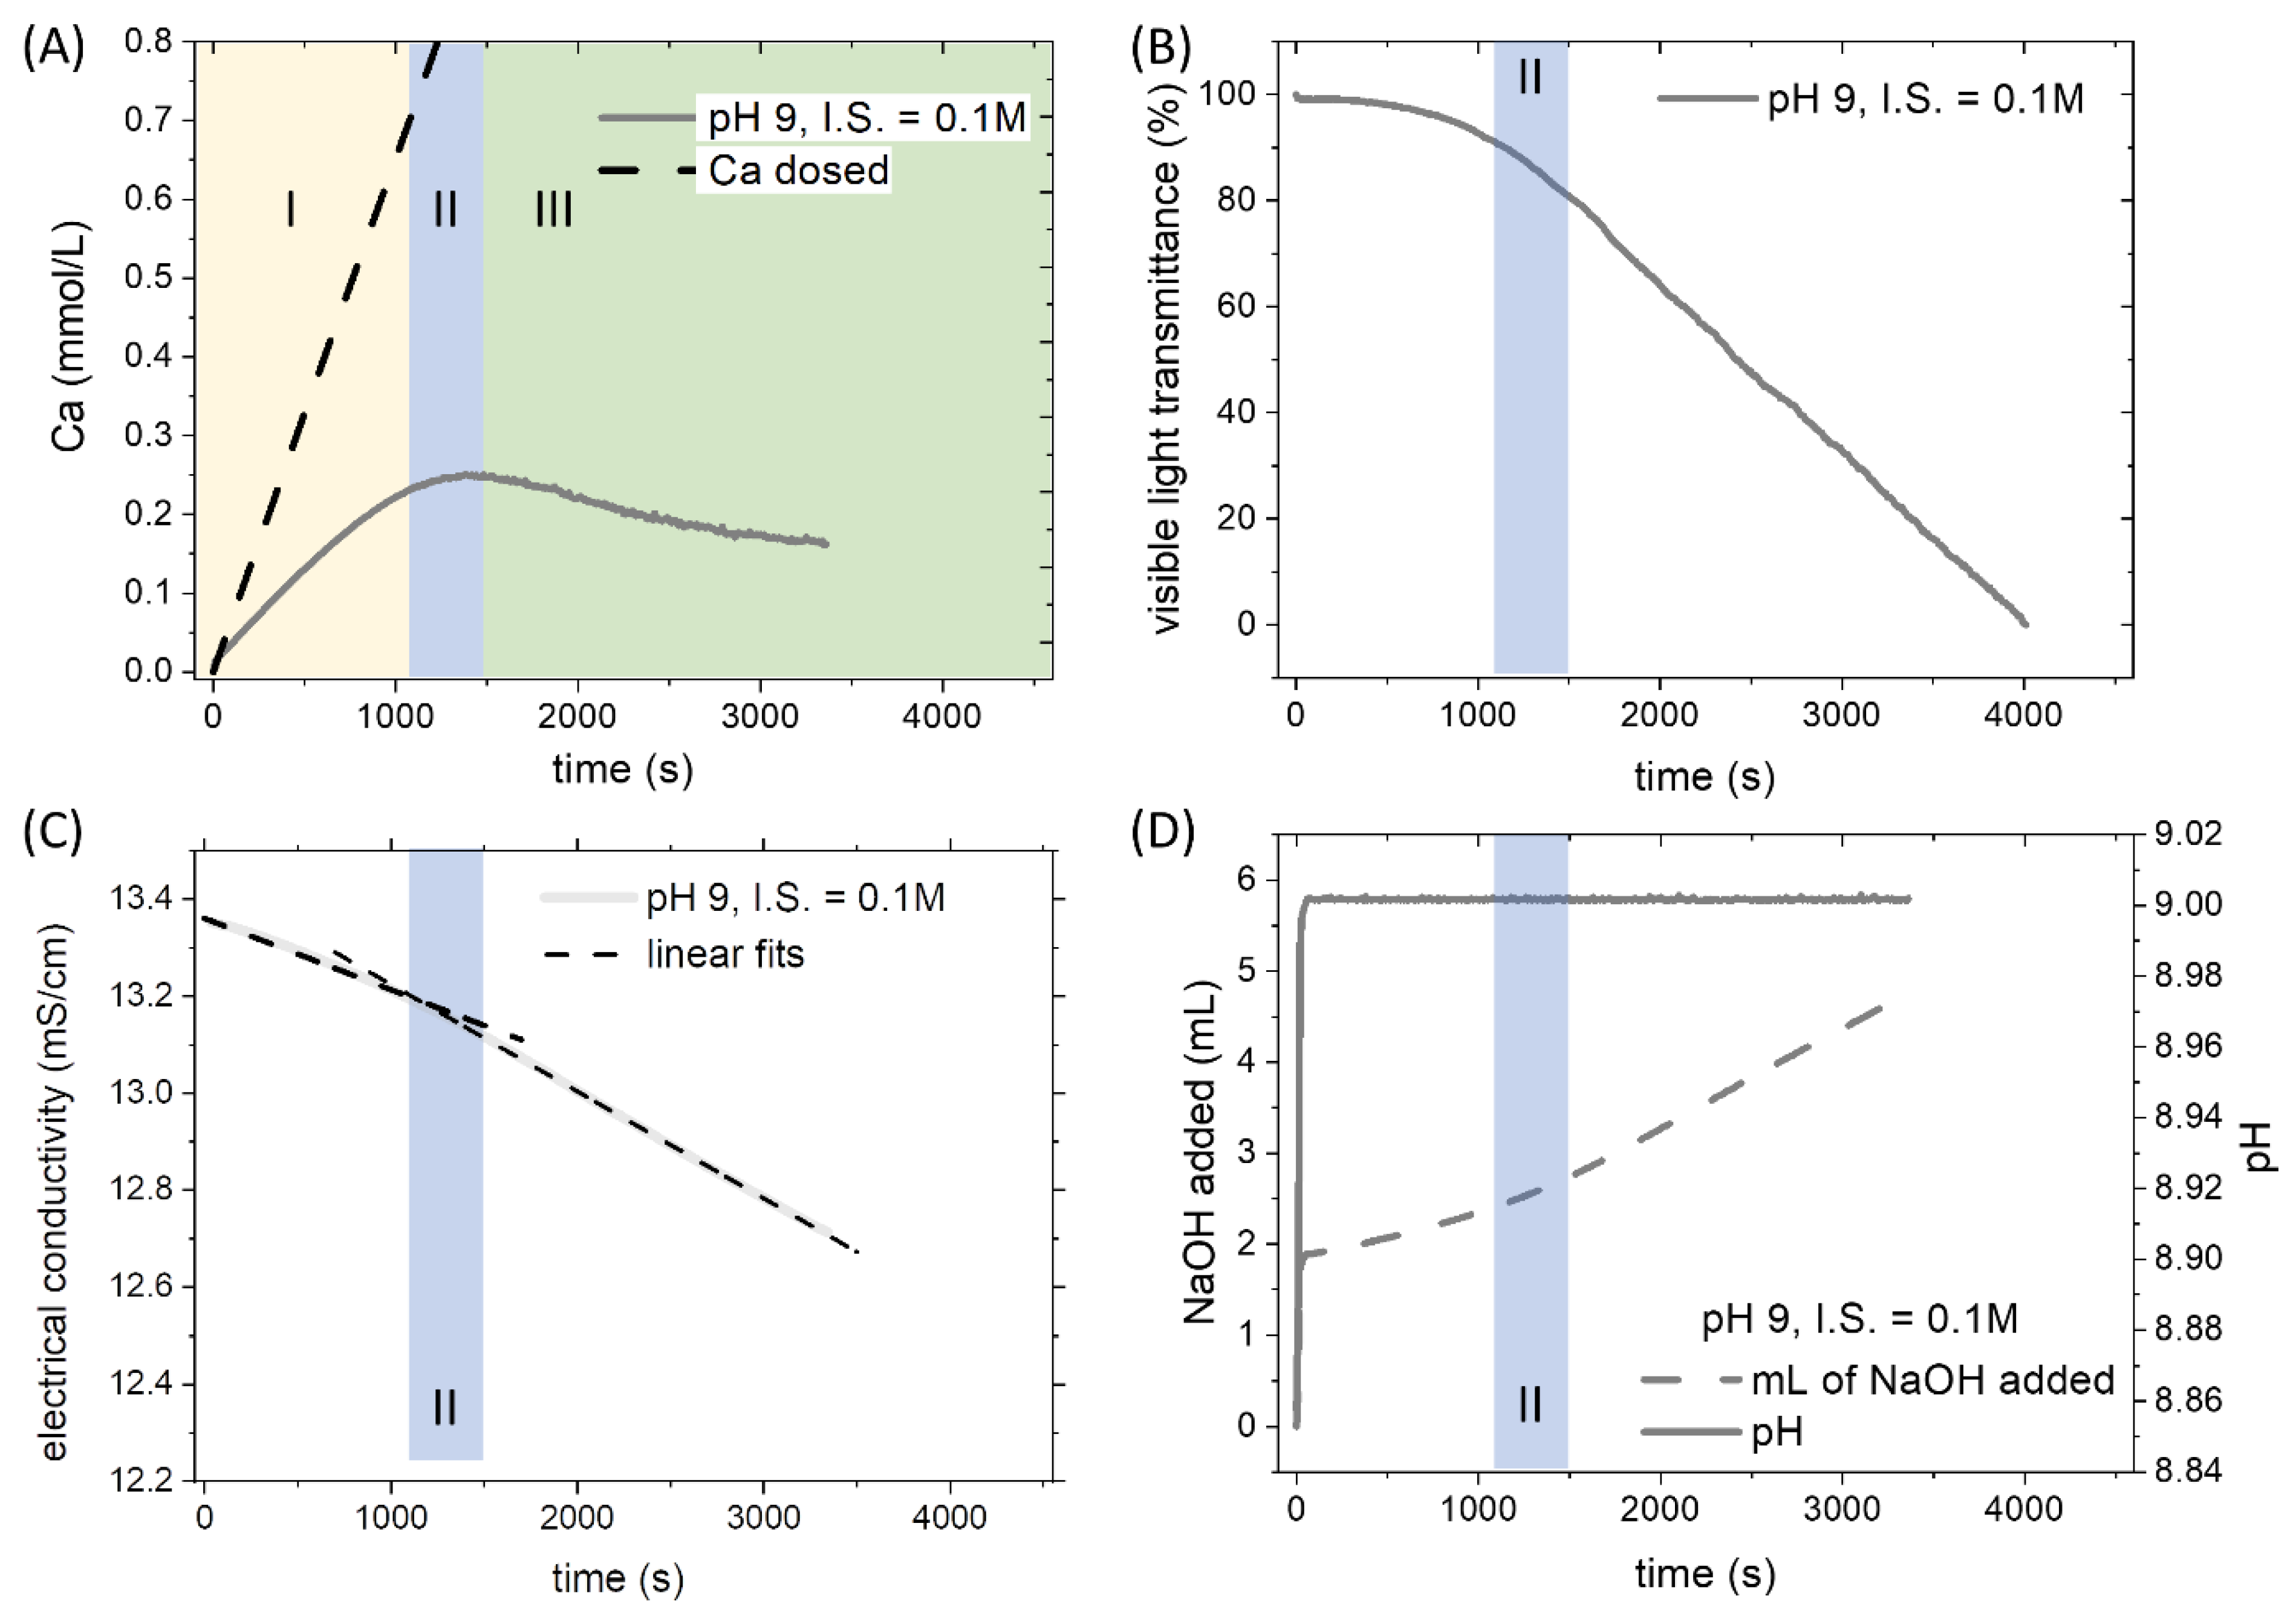
Figure 1. General overview of a titration experiment (pH 9, ionic strength 0.15 M) without Pb2+. (A) The signal recorded by the CaISE is converted into the concentration of free calcium after specific calibrations of the electrode in carbonate-free solutions. Latin numbers indicate three stages of the experiment: prenucleation (I), nucleation (II), and growth (III). (B) The potential recorded by the Optrode is converted in a percent scale to normalize the value along with the different experimental runs. The drop of visible light transmittance corresponds to the development of turbidity. This phenomenon is related to the formation of solid particles in the initially homogenous solution. (C) The electrical conductivity of the solution shows a slope change in correspondence of the nucleation stage. (D) The pH of the solution was maintained constant during the experiments thanks to the automatic addition of NaOH. The consumption of NaOH shows an acceleration after the nucleation of the solid phase.
Minerals 11 00783 g001
Figure 2. Examples of the titration results obtained for the system without Pb2+. (A) At constant ionic strength, a decrease of pH reduces the nucleation time, as demonstrated by the CaISE and Optrode signals. (B) An increase in the ionic strength while keeping pH constant delays nucleation. As ion-selective electrodes are very sensitive to ionic strength variations, the mL of dosed NaOH are also reported together with CaISE and Optrode signals.
Minerals 11 00783 g002
Figure 3. A comparison of the nucleation in the systems with and without Pb2+ is provided by the variation of CaISE and Optrode signals at different pH and constant ionic strength. In the presence of Pb2+, the instantaneous precipitation of CaCO3 starts at a higher total calcium concentration. The effect is observed in most of the experimental conditions tested. Nevertheless, the effect becomes comparable with experimental reproducibility at pH 8, as explained in detail below.
Minerals 11 00783 g003
Figure 4. Thermodynamic properties of calcite and carbonate ions. (A) At constant CaTOT and CTOT conditions, the supersaturation index of calcite is highly dependent on the pH and the ionic strength. (B) Relative abundance in mole percent of free carbonate among the aqueous species of inorganic carbon.
Minerals 11 00783 g004
Figure 5. The critical supersaturation of calcite in the pure system is presented as a pH and ionic strength function. A color plot is a suitable representation for the matrix of data acquired with the precipitation experiments performed according to Table 1. To highlight the agreement between the saturation indexes of calcite reported in this work and previous studies, the values calculated from the literature are also plotted together with the experimental data.
Minerals 11 00783 g005
Figure 6. The effect of Pb2+ on the nucleation of calcium carbonate is reported as the time difference between the detection of nucleation in presence of Pb2+ minus the induction time observed in absence of Pb2+. The values for each experiment correspond to the average of the CaISE, Optrode, PbISE (only in the Pb-bearing experiments) and replicas; the errors are the standard deviations. The labels on the column correspond to the approximate ionic strength.
Minerals 11 00783 g006
Figure 7. (A) Saturation index of calcite at the nucleation stage for the experiments in the presence of PbII, 1 mol% concerning calcium. (B) Difference between the saturation indexes of calcite in the experiments with Pb2+ minus the saturation index in the pure system. This plot can be considered a possible correction factor for Figure 5 to predict the formation of CaCO3 in a system containing Pb2+. The possibility to derive similar corrections factors to include the effect of other variables could substantially contribute to the prediction of CaCO3 in real systems.
Minerals 11 00783 g007
Table 1. Overview of the experimental conditions employed for the precipitation experiments.
Experimental ConditionsBeaker (Initial Composition)Burette 1Burette 2
#Ionic Strength(KNO3)pHReagent mol%Total Inorganic CarbonCa(NO3)2Pb(NO3)2NaOH
10.05 M8NaHCO3 100%0.04 M0.03 M0 (no Pb)0.1 N
20.15 M
31.06 M
40.05 M9NaHCO3 92% + Na2CO3 8%0.04 M0.03 M0 (no Pb)0.1 N
50.15 M
61.06 M
70.05 M10NaHCO3 49% + Na2CO3 51%0.04 M0.03 M0 (no Pb)0.1 N
80.15 M
91.06 M
100.05 M8NaHCO3 100%0.04 M0.03 M0.0003 M
(Ca/Pb = 100)
0.1 N
110.15 M
121.06 M
130.05 M9NaHCO3 92% + Na2CO3 8%0.04 M0.03 M0.0003 M
(Ca/Pb = 100)
0.1 N
140.15 M
151.06 M
160.05 M10NaHCO3 49% + Na2CO3 51%0.04 M0.03 M0.0003 M
(Ca/Pb = 100)
0.1 N
170.15 M
181.06 M
Table 2. Saturation indexes of calcite at the nucleation stage in the pure system and correction factors for the presence of 1 mol% of Pb2+. The data correspond to the values plotted in Figure 5 and Figure 7B.
Ca-CO2-H2O
saturation index of calcite
pH
8910
ionic strength (mol/L)0.051.431.722.04
0.151.371.841.96
1.061.41.922.17
Ca-Pb-CO2-H2O
(Ca/Pb = 100 mole ratio)
Difference in saturation
index of calcite
pH
8910
ionic strength (mol/L)0.05−0.070.480.22
0.15−0.070.350.27
1.060.120.240.19
Publisher’s Note: MDPI stays neutral with regard to jurisdictional claims in published maps and institutional affiliations.