Article

Molecular and Carbon Isotopic Variation during Canister Degassing of Terrestrial Shale: A Case Study from Xiahuayuan Formation in the Xuanhua Basin, North China

1
School of Energy Resources, China University of Geosciences (Beijing), Beijing 100083, China
2
Key Laboratory of Strategy Evaluation for Shale Gas, Ministry of Land and Resources, China University of Geosciences (Beijing), Beijing 100083, China
3
PetroChina Research Institute of Petroleum Exploration & Development, Beijing 100083, China
4
School of Earth Sciences and Engineering, Xi’an Shiyou University, Xi’an 710065, China
5
Hebei Province Coal Geological Exploration Institute, Xingtai 054000, China
6
Sinopec Petroleum Exploration and Production Research Institute, Beijing 102206, China
7
China State Key Laboratory of Shale Oil and Shale Gas Resources and Effective Development, Beijing 102206, China
*
Author to whom correspondence should be addressed.
Minerals 2021, 11(8), 843; https://doi.org/10.3390/min11080843
Submission received: 13 July 2021 / Revised: 2 August 2021 / Accepted: 3 August 2021 / Published: 5 August 2021

Abstract

:
Molecular and carbon isotopic variation during degassing process have been observed in marine shale reservoirs, however, this behavior remains largely unexplored in terrestrial shale reservoirs. Here, we investigate the rock parameters of five terrestrial shale core samples from the Xiahuayuan Formation and the geochemical parameters of thirty natural gas samples collected during field canister degassing experiments. Based on these new data, the gas composition and carbon isotope variation during canister degassing are discussed and, further, the relationship between petrophysics and the carbon isotope variation is explored. The results show that methane content first increases and then decreases, the concentrations of carbon dioxide (CO2) and nitrogen gas (N2) peak in the early degassing stage, while heavier hydrocarbons gradually increase over time. Shale gas generated from humic source rocks contains more non-hydrocarbon and less heavy hydrocarbon components than that generated from sapropelic source rocks with similar maturity. Time-series sampling presents an upward increase in δ13C1 value during the degassing process with the largest variation up to 5.7‰, while the variation in δ13C3 and δ13C2 is insignificant compared to δ13C1. Moreover, we find that there is only a small variation in δ13C1 in shale samples with high permeability and relatively undeveloped micropores, which is similar to the limited δ13C1 variation in conventional natural gas. For our studied samples, the degree of carbon isotope variation is positively correlated with the TOC content, micropore volume, and micropore surface, suggesting that these three factors may play a significant role in carbon isotope shifts during shale gas degassing. We further propose that the strong 13C1 and C2+depletion of shale gas observed during the early degassing stage may have resulted from the desorption and diffusion effect, which may lead to deviation in the identification of natural gas origin. It is therefore shale gas of the late degassing stage that would be more suitable for study to reduce analytic deviations. In most samples investigated, significant isotopic variation occurred during the degassing stage at room temperature, indicating that the adsorbed gas had already been desorbed at this stage Our results therefore suggest that more parameters may need to be considered when evaluating the lost gas of shales.

1. Introduction

Molecular and isotope compositions are fundamental geochemical parameters in the study of natural gas origin and genetic type [1,2,3,4]. In addition to genetic processes, some secondary processes, such as adsorption/desorption, migration, diffusion, and dissolution, can also cause variations in molecular and isotopic compositions [5,6,7]. Extensive studies have shown that the molecular composition varies constantly during canister degassing of marine shale [8,9]. As another major target of shale gas exploration in China, terrestrial shale reservoir has shown significant differences from marine shale reservoirs, thus the degassing behavior of these two types of shale may also be expressed differently. However, the molecular and carbon isotopic variation of terrestrial shale during canister degassing has not been well documented. The consideration of stable isotope fractionation associated with the migration process started with a study by Colombo et al. [10], and was further discussed in later studies [6,11,12,13]. The directions and magnitudes of isotope shifts vary greatly (ranging from −1‰ to −30‰) during the desorption experiments of coal considering different gas species across a wide maturity range [14,15,16,17]. Diffusion-related isotope shifts have been emphasised in previous studies and have mainly focused on conventional gas accumulations and the evaluation of gas loss through the shale caprock [7,18,19]. More detailed quantification models were proposed later to characterise diffusion-related isotope shifts during natural gas transport [20,21,22]. The dissolution carbon isotope effect has shown the preferential solution of 13CH4 in an aqueous medium [21,23,24,25]. The influence of the adsorption carbon isotope effect has been controversial in the past. Gunter and Gleason (1971) addressed the quantum mechanical effect on the dispersion energy-dominated carbon isotope behaviour through silica gel [5], causing the preferential adsorption of lighter species to reverse the expected trends during gas chromatographic separations. The same conclusion was reported by Rahn and Eiler (2001), who analysed the carbon and oxygen isotope effects for carbon dioxide adsorption onto kaolinite, basalt, and fluorite between the adsorbate and vapour phases [26]. However, other studies have suggested that the difference in adsorption potential is caused by the isotope shift in the adsorption/desorption process [27], resulting in a more negative δ13C1 value during desorption experiments [28,29]. The controversy regarding the adsorption/desorption effect may be caused by the difference in adsorbing material because the adsorbing materials used in gas chromatographic separation experiments are quite different from those in natural gas reservoirs.
The factors influencing the isotopic shift have been investigated in previous studies. Studies on the temperature dependence of the isotope effect have shown an increase in the diffusion coefficient of methane with temperature [22,30]. Schloemer and Krooss (2004) conducted diffusion experiments and concluded that increasing pressure results in a decrease in the effective diffusion coefficient due to the reduction in overall molecular mobility [21]. In addition to external conditions, internal parameters also affect the diffusion isotope effect. Experimental work and mathematical simulation indicated that isotopic fractionation was enhanced by an increase in organic matter in sedimentary rocks [20,29]. The canister degassing of coal showed a more obvious expression of isotope variation in higher rank coals [15]. The petrophysical parameters of reservoir rocks may have played an important role in the carbon isotope variation during the degassing process, however, their relationship remains unclear. For example, some studies have shown that there is no correlation between isotopic fractionation and porosity/permeability in reservoir rocks [29,30], while others have argued that the isotopic shift is inversely related to the rock porosity and permeability properties through physical simulation experiments [31,32].
The shale gas field has become an essential component of hydrocarbon exploration and development [33,34,35,36]. Compared with the extensive studies on carbon isotope variation in conventional caprocks or coal reservoirs, limited studies have focused on carbon isotope variation in shale reservoirs, especially in terrestrial shale reservoirs. In the present study, we aim to (1) investigate the molecular and carbon isotopic variation during canister degassing of terrestrial shale based on time-series sampling, (2) explore the influence of petrophysics on carbon isotope variation during canister degassing by combining bulk rock petrophysical parameters with gas geochemistry.

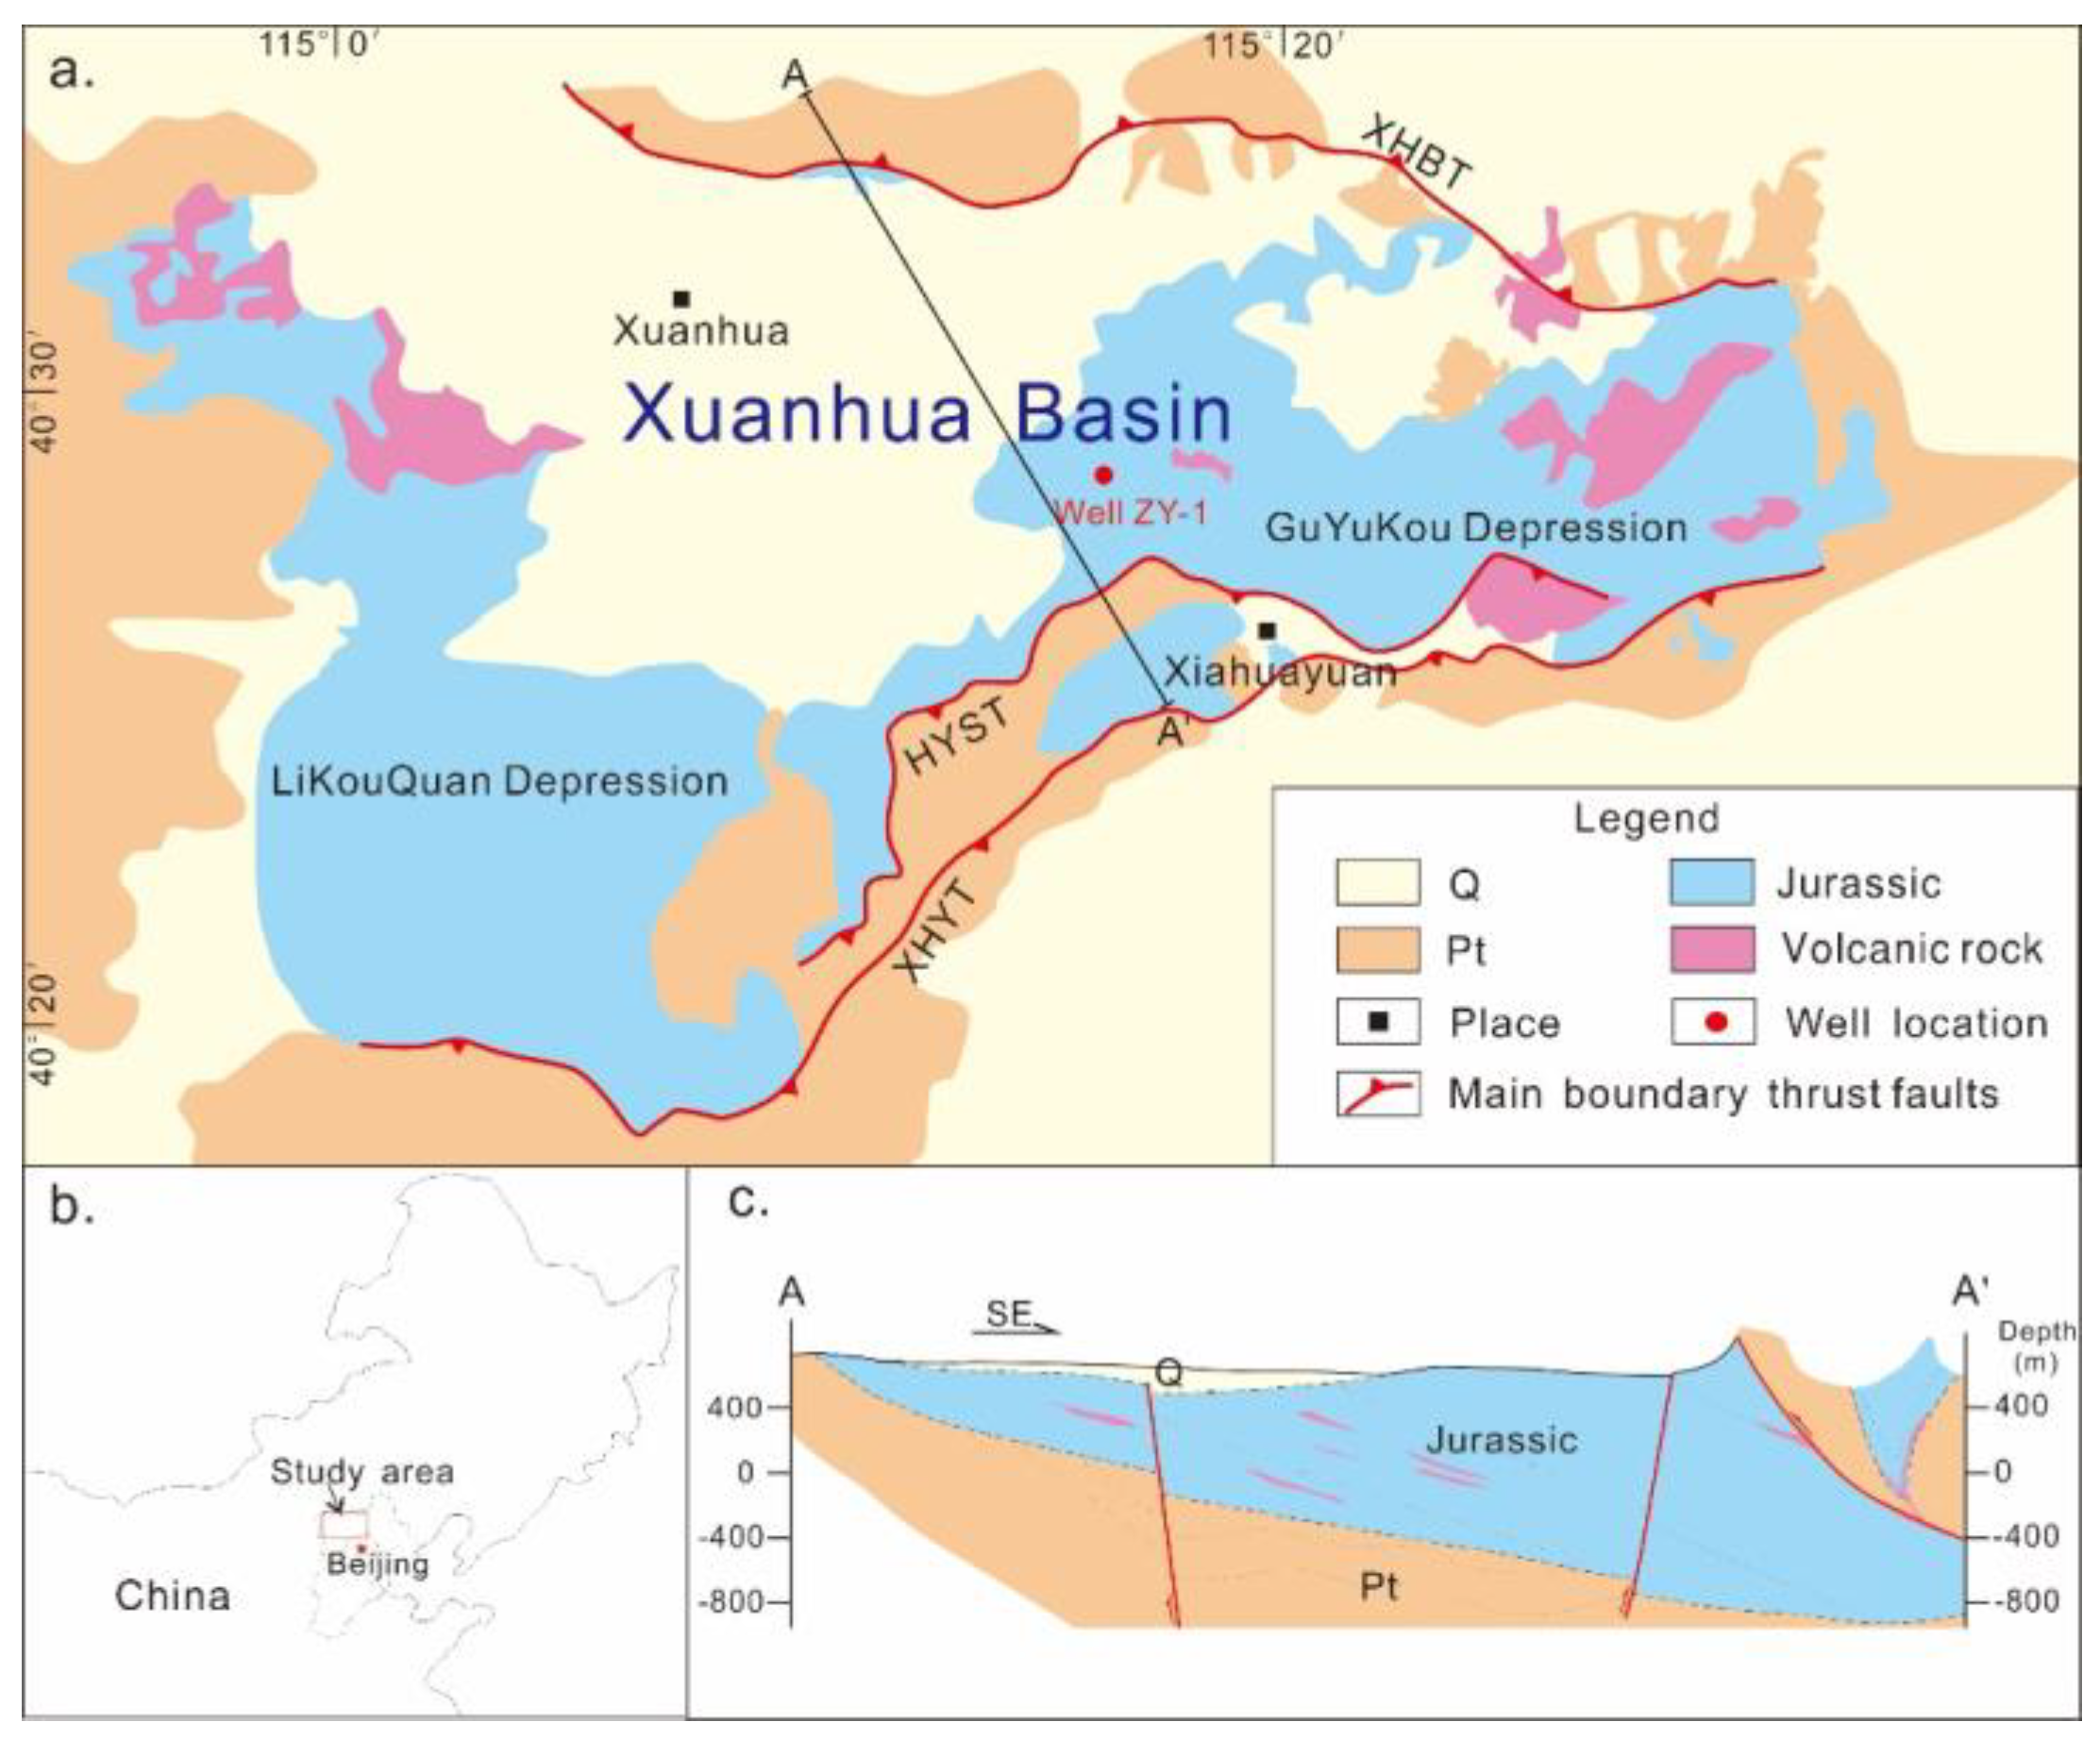
2. Geological Setting

The Xuanhua Basin, located in North Hebei, China (Figure 1b), is a Mesozoic intermountain basin that is largely distributed in the Yanshan region [37]. The basin underwent intense tectonic deformation caused by plate subduction and continental collision in different directions during the Mesozoic [38,39,40], including the northward migration and collision of the southern Yangtze Plate from the Middle Triassic to Jurassic [41,42], closure collision of the Mongolian–Okhotsk Plate in the northwest from the Jurassic to the Early Cretaceous [42,43], and Izanagi and Palaeo-Pacific Plate subduction to the northwest [42]. The main body of the Xuanhua Basin is a southward plunging monocline (Figure 1c), which is mainly controlled by the approximately EW-trending Xuanhuabei thrust fault, the Huangyangshan thrust fault, and the approximately NE–NEE-trending Xiahuayuan thrust fault [37]. From west to east, the Xuanhua Basin can be further divided into the Likouquan and Guyukou depressions (Figure 1a).
The Xuanhua Basin sediments during the Early and Middle Jurassic were mainly characterised by the filling of the low-lying areas produced by thrust faults and gentle folds. The Xiahuayuan Formation, a promising target for terrestrial shale gas exploration, was formed during this period and can be further divided into the Upper Yaopo Formation, Lower Yaopo Formation, and Longmen Formation in West Beijing [44]. With the lake size reduction, the depositional environment gradually changed from lacustrine facies to fan-delta and alluvial fan facies [37]. Xiahuayuan Formation sediments consist of coal, carbonaceous mudstone, shale, silty shale, muddy siltstone, and medium–fine grain sandstone. Apart from the clastic sedimentary rocks, diabase is also found in the Xiahuayuan Formation, and its intrusion changed the primary strata thickness and thermal evolution of the adjacent layers. The total Xiahuayuan Formation thickness ranges from 135 m to 556 m in the study area, in which the cumulative thickness of organic-rich shale ranges from 60 m to 300 m. Due to the frequent variation in the depositional environment, the single-layer thickness is relatively thin compared to marine shales, but the organic matter is relatively rich because of the frequent interbedding with coalbeds.

3. Samples and Methods

3.1. Samples

In this study, five black shale core samples with high gas content from a depth of 1022.13–1120.95 m (JX29, JX30, JX31, JX52, JX59) were collected from well ZY-1 in the Xuanhua Basin, North China. A three-stage field degassing experiment was performed on the five core samples. For each degassing stage, the first and last gas samples were collected, and thirty total natural gas samples were collected for chemical and carbon isotopic composition analysis.

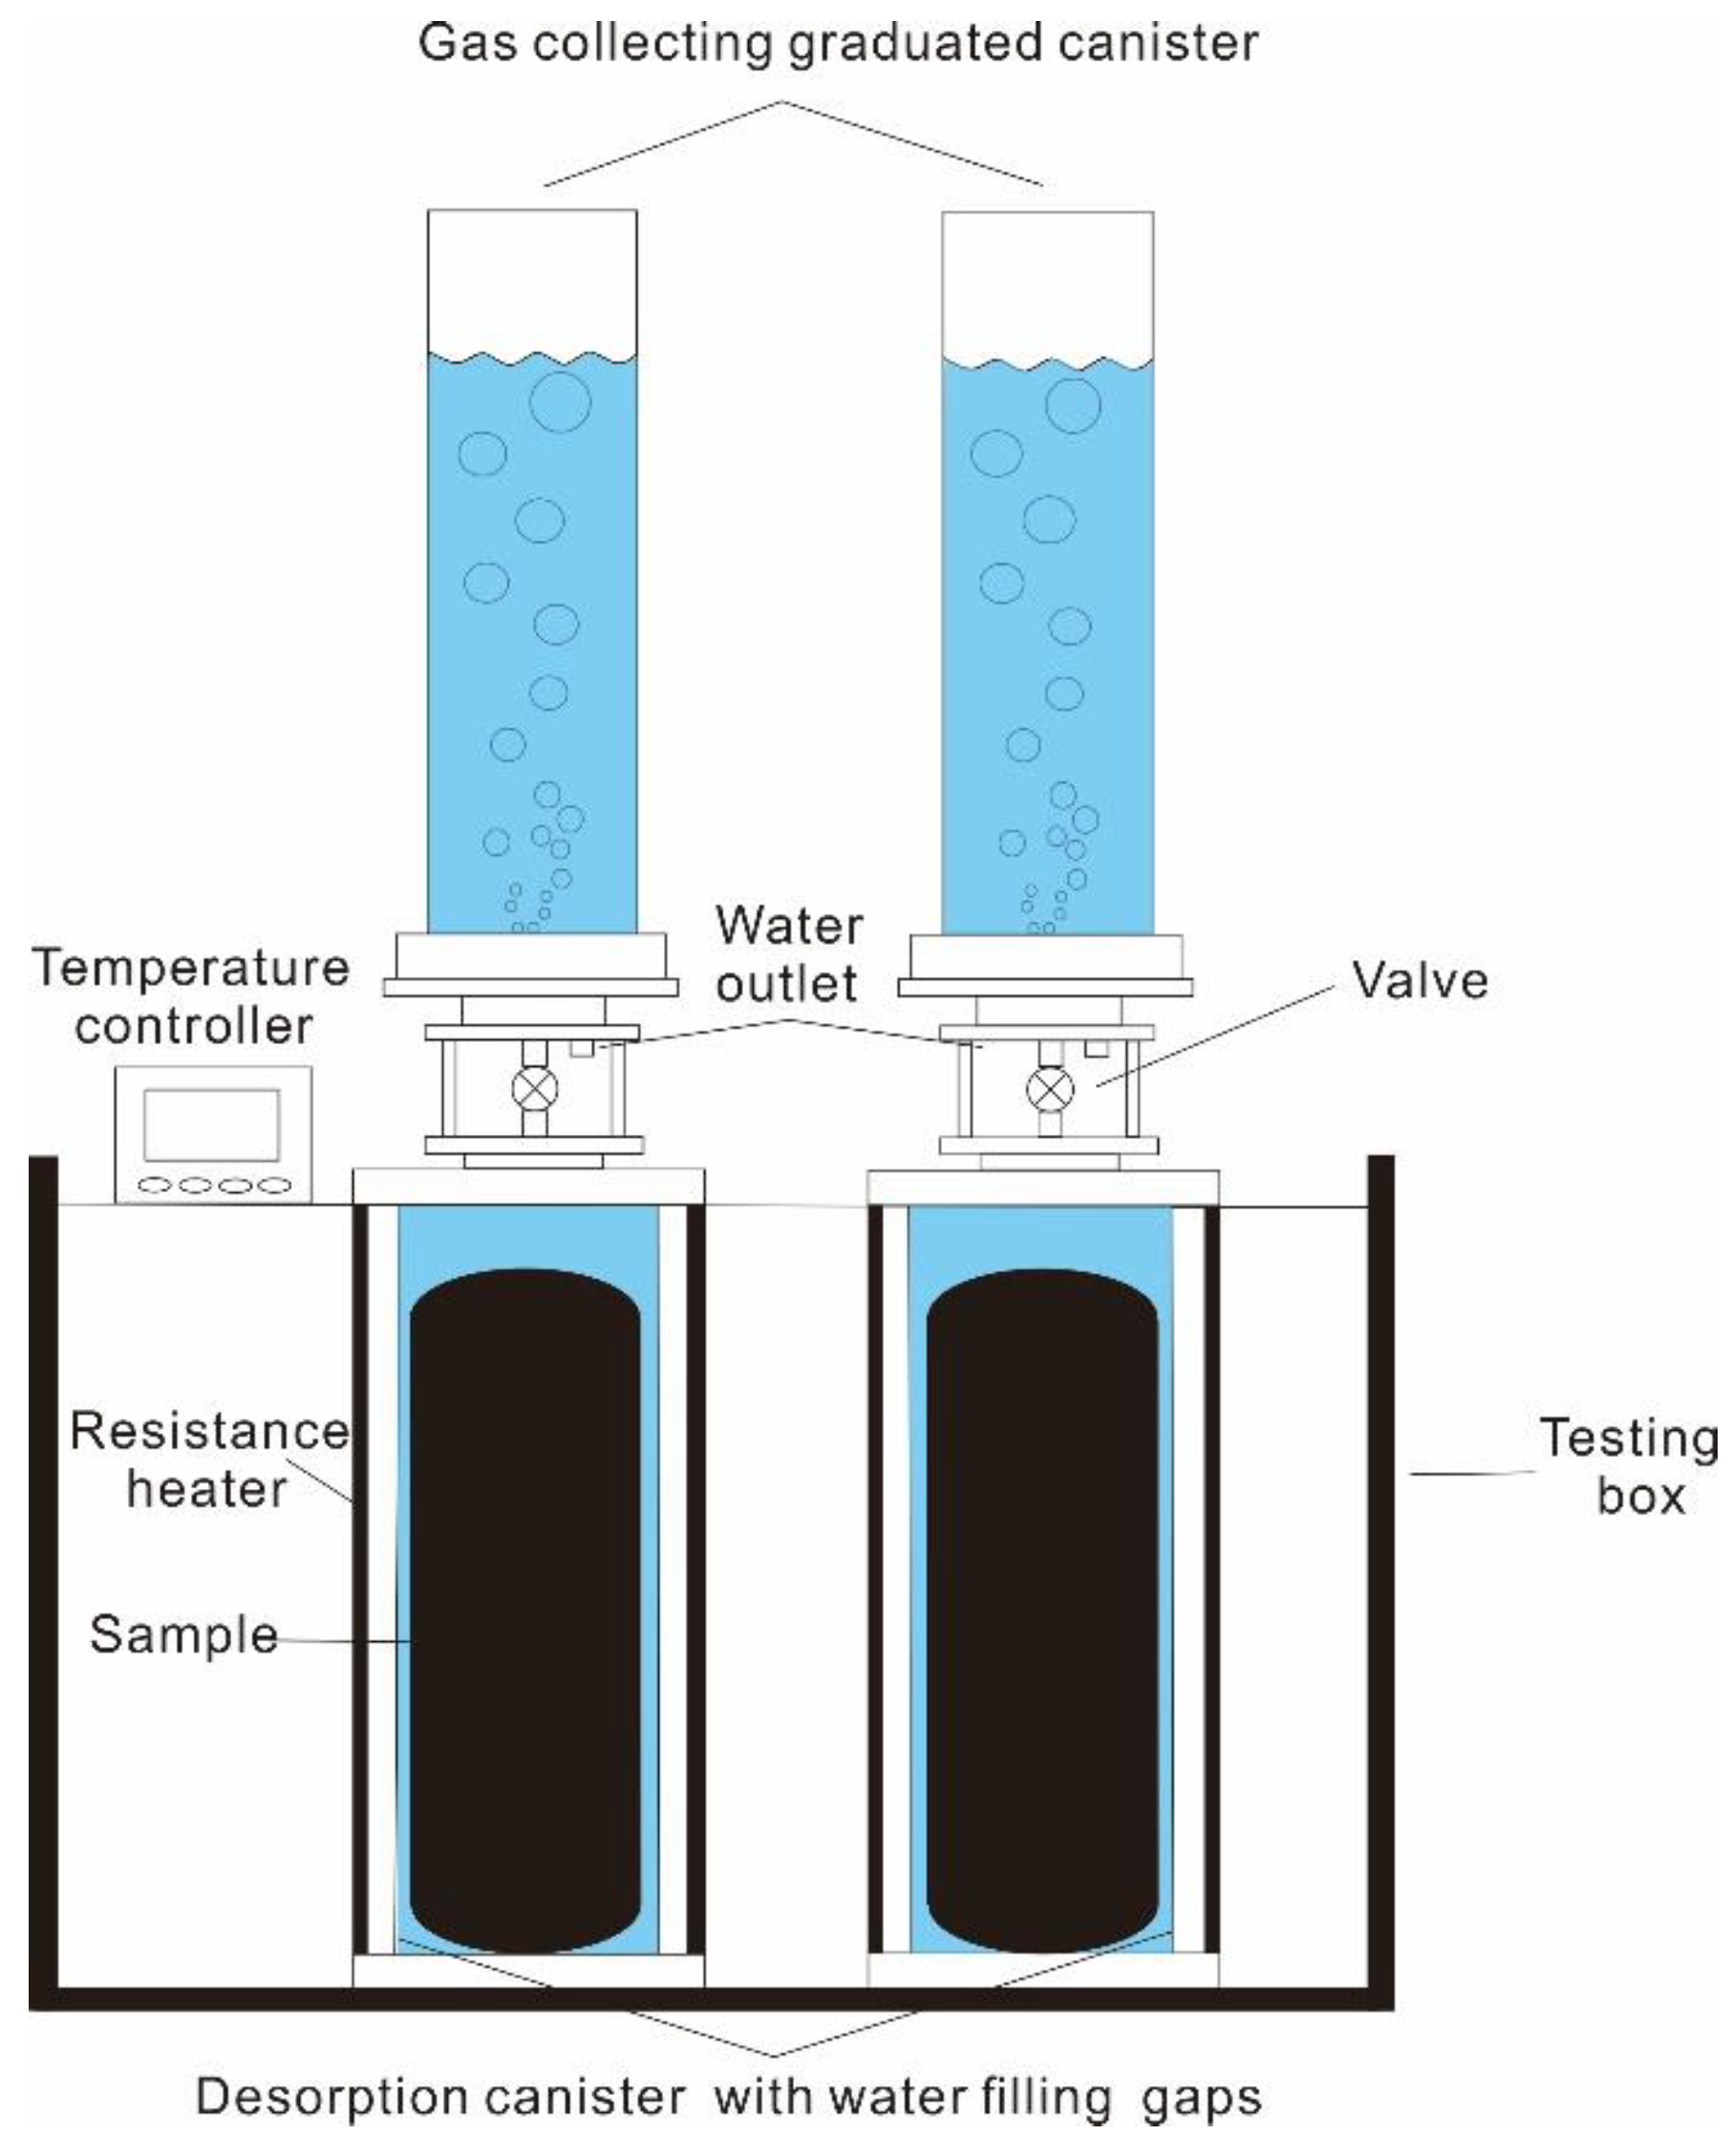
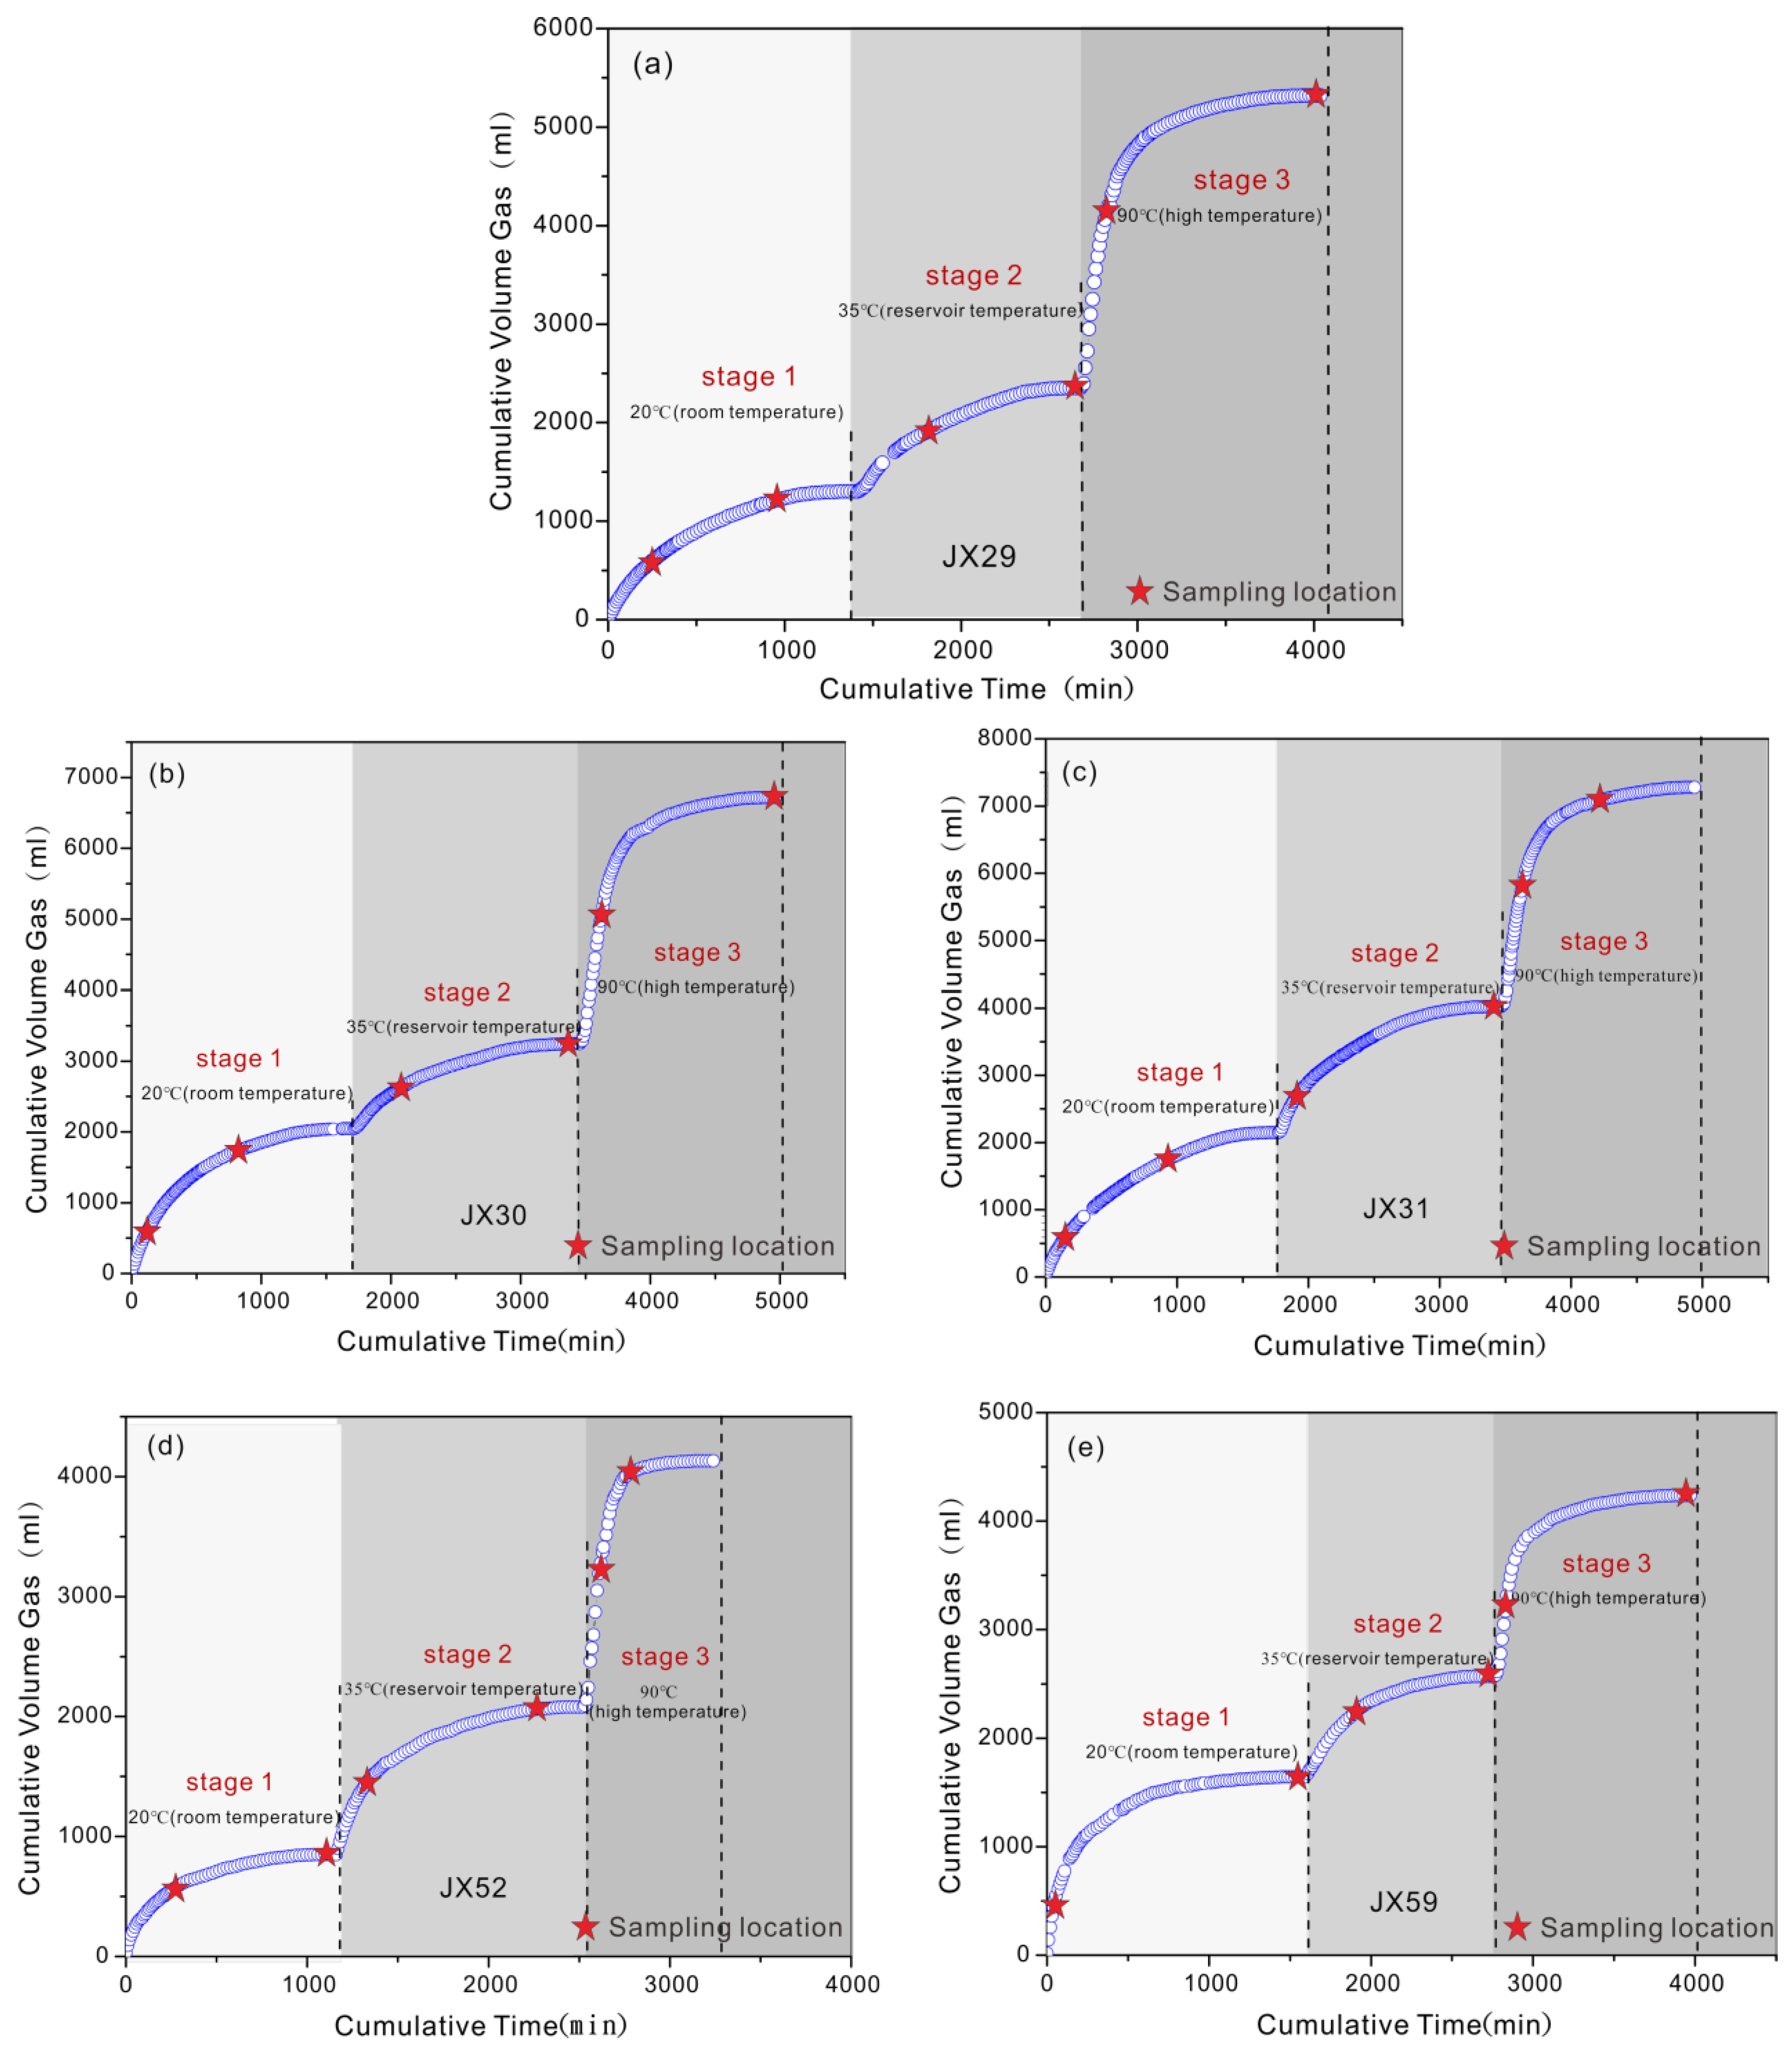
3.2. Field Degassing Experiment

The desorbed gas content was determined using a GOF-I field degassing apparatus produced by the China University of Geosciences (Beijing) [45] (Figure 2), which is an upgraded traditional normalisation measuring apparatus [46]. The GOF-I field degassing apparatus removes the long gas outlet tubes between the degassing canister and the graduated cylinder [47,48], and achieves tubeless gas content measurement based on the capillary method. Desorbed gas released from the degassing canister enters and accumulates in the graduated cylinder through a one-way valve, which greatly improves the measurement accuracy of the desorbed gas content without the effect of air in the tube. After coring at the well site, shale core samples were placed as quickly as possible into sealed degassing canisters with water-filled gaps. At selected time intervals, the liquid level of saturated brine water in the graduated cylinder was recorded, which is equivalent to the gas volume released from the degassing canister [49]. Although free gas and adsorbed gas are difficult to accurately distinguish in field degassing experiments, a rough characterisation can be achieved by setting the degassing temperature. We assume that the degassing of shale at room temperature is dominated by free gas, that there is a mixture of free gas and adsorbed gas at reservoir temperature, and that the degassing at high temperature is dominated by adsorbed gas. Thus, the degassing experiment in this study was divided into three stages (Figure 3), including gas released at a room temperature of 20 °C (stage 1), reservoir temperature of 35 °C (stage 2), and high temperature of 90 °C (stage 3) to completely release the adsorbed gas. A degassing rate of less than 2 mL/h signalled the end of gas content measurement for each stage.

3.3. Gas Geochemical Analysis

Gas component analysis of shale gas samples was performed using an Agilent 6890 N gas chromatograph (GC) equipped with a flame ionisation detector and a thermal conductivity detector at the Key Laboratory of Strategy Evaluation for Shale Gas, China University of Geosciences (Beijing), Beijing, China. Hydrocarbon gas components were separated using a capillary column (PLOT Al2O3 50 m × 0.53 mm). Nonhydrocarbon gases were separated using two capillary columns (PLOT Molsieve 5 Å 30 m × 0.53 mm, PLOT Q 30 m × 0.53 mm). The gas chromatograph oven was preheated at 30 °C for 10 min, and then the oven temperature was heated to 180 °C and maintained for 20–30 min. Gases were injected into the sampling oven and separated by gas chromatograph volume. The gas conductivity detector converted the concentration signal of individual gas components to electrical signals in order, and then identified and quantitated them by retention time, peak height, and peak area. All gas components were oxygen-free and nitrogen-corrected, and the correction for nitrogen was determined by the area ratio of nitrogen to oxygen peaks measured in air [50,51]. High-purity helium (99.99%) was used as carrier gas and the average analytical precision was ± 1%.
Carbon isotope values were analysed using a Thermo Delta V Advantage isotope mass spectrometer equipped with Trace GC Ultra at the Research Institute of Petroleum Exploration and Development (RIPED), Beijing, China. First, the oven was heated from 33 °C to 80 °C at 8 °C/min, then increased to 250 °C at 5 °C/min. The injector port temperature was set to 200 °C. Gas components were separated in a stream of helium and combusted into carbon dioxide using a GC Combustion III with a reactor temperature of 980 °C, and then introduced into the mass spectrometer to obtain carbon isotope data (δ13C, ‰). Stable carbon isotopic values are reported in the δ-notation in permil (‰) relative to Vienna Peedee belemnite (VPDB). The injector port seals were replaced regularly to ensure measurement precision, which was estimated to be ± 0.3‰.

3.4. TOC Content Analysis

Total organic carbon (TOC) was analysed using a LECO-CS230 carbon and sulphur analyser at the Key Laboratory of Strategy Evaluation for Shale Gas, China University of Geosciences (Beijing). Before the experiment, the shale core samples were crushed into powder and filtered through a 100-mesh sample sieve. The powdered samples were then treated with hydrochloric acid to remove the effect of carbonate minerals, which was subsequently removed. The decarbonated samples were placed in a drying oven until they attained a constant weight. Finally, the shale samples were combusted in a high-temperature oxygen stream in the organic carbon analyser for the TOC content test in accordance with the Chinese National Standard GB/T19145-2003 [52].

3.5. Petrophysical Parameter Measurement

The He-porosity test was conducted at 20 °C using a PHI-220 porosity analyser (Beijing Aotao Science & Technology, Beijing, China), with 99.99% helium as the carrier gas. First, shale core samples were cut into 2.5 cm diameter right cylinders using the wire-electrode cutting method to meet the test requirements. Next, the samples were placed in a drying oven to attain a constant weight and then cooled to room temperature before the experiment started. The shale sample pore volume was determined according to Beer’s law [53]. After the He-porosity test, the shale samples were directly used to measure the horizontal permeability because the sample size and pre-experimental treatment were the same in both tests. The pulse-decay permeability was measured with a PDP-200 pulse-decay permeameter based on unsteady flow theory, with 99.99% helium as the carrier gas. The temperature change in the test systems was less than one degree during the test process, following the Chinese National Standard GB/T 34533-2017 [54].
X-ray computed tomography (CT) was performed on a GE Brivo CT385 with a voxel size of 180 μm × 180 μm, working power of 28 kW, and working voltages of 80 kV, 100 kV, 120 kV, and 140 kV. The cylindrical samples were prepared before performing the experiments, following the Chinese Energy Industry Standard NB/T 10122-2018 [55] for shale scanning and imaging methods using X-ray CT. All the above petrophysical parameter measurement experiments were performed at the Center for Reservoir Stimulation, China University of Petroleum (Beijing), Beijing, China.

3.6. Low-Pressure CO2 Adsorption

Low-pressure CO2 adsorption measurements were conducted at a 0 °C bath temperature using a Micrometritics ASAP 2460 apparatus (Micromeritics, Norcross, GA, USA). Gas tightness tests and sample degassing were performed before the experiment started. For each shale sample, the specific micropore volume, micropore surface area, monolayer capacity, and pore width were determined based on the amount of cumulative and incremental adsorbed volume of carbon dioxide at various pressure steps. Specifically, Dubinin–Astakhov (D-A) specific micropore volumes and micropore surface areas are discussed in this study.

4. Results

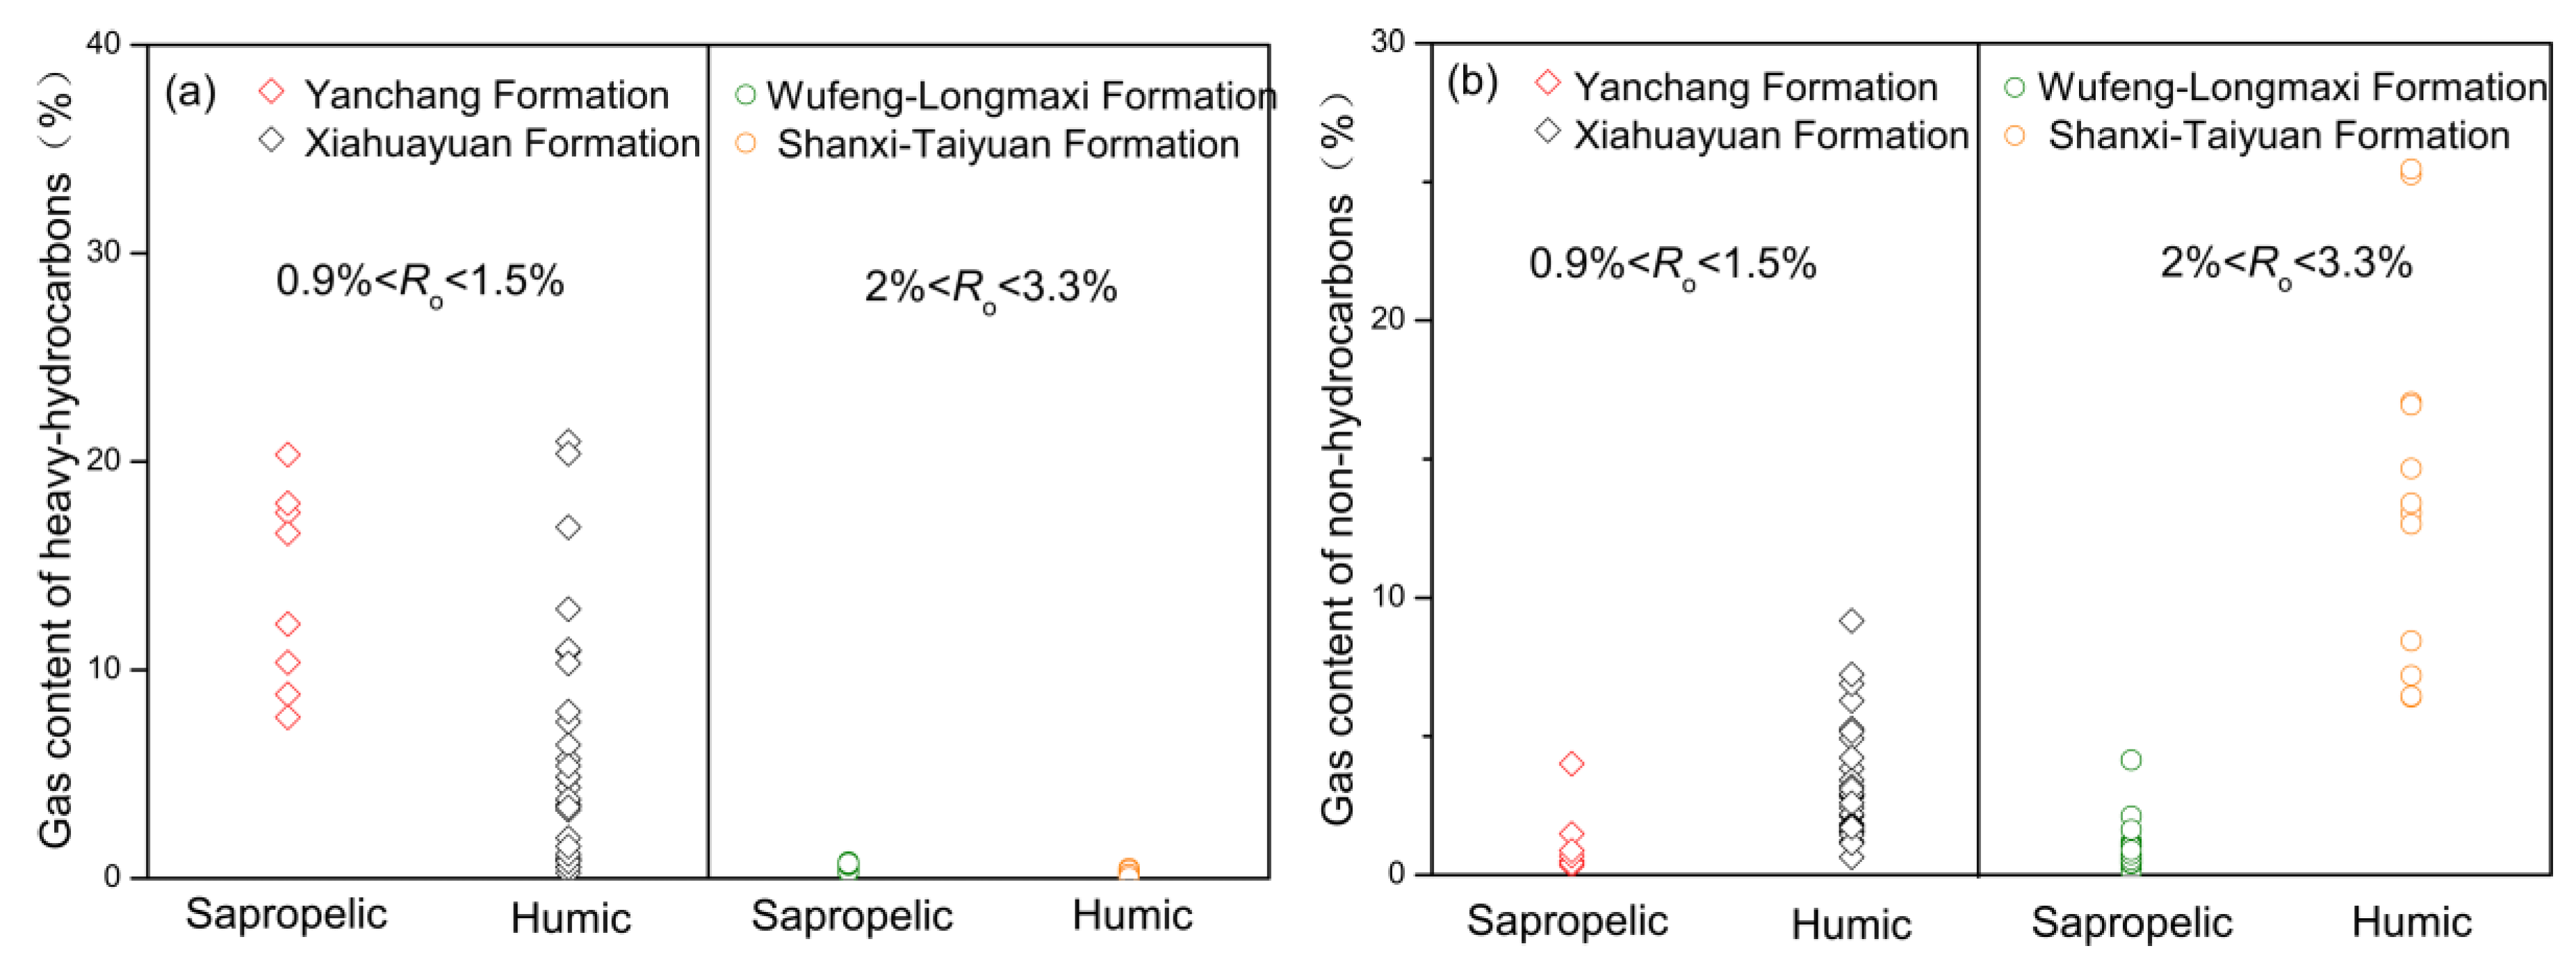
4.1. Molecular Composition of Shale Gas

Molecular composition analysis showed that the gas components changed during the shale gas degassing experiment. The desorbed gas contents released at room temperature were as follows: methane, ethane, propane, carbon dioxide, and nitrogen, which varied from 90.56–94.6% (average 92.48%), 0.27–3.67% (average 1.71%), 0.00–1.21% (average 0.26%), 1.79–4.22% (average 2.73%), and 1.03–4.95% (average 2.82%), respectively. The contents of desorbed gases released at reservoir temperature were as follows: methane, ethane, propane, carbon dioxide, and nitrogen, which varied from 87.2–95.37% (average 92.30%), 0.78–8.04% (average 3.64%), 0.00–3.38% (average 1.14%), 0.69–2.52% (average 1.61%), and 0.21–2.41% (average 1.32%), respectively. The contents of desorbed gases released at high temperature were methane, ethane, propane, carbon dioxide, and nitrogen, which varied from 78.39–93.8% (average 87.35%), 2.71–15.47% (average 7.39%), 1.06–6.99% (average 3.55%), 0.32–1.44% (average 0.90%), and 0.00–1.78% (average 0.82%), respectively (Table 1).

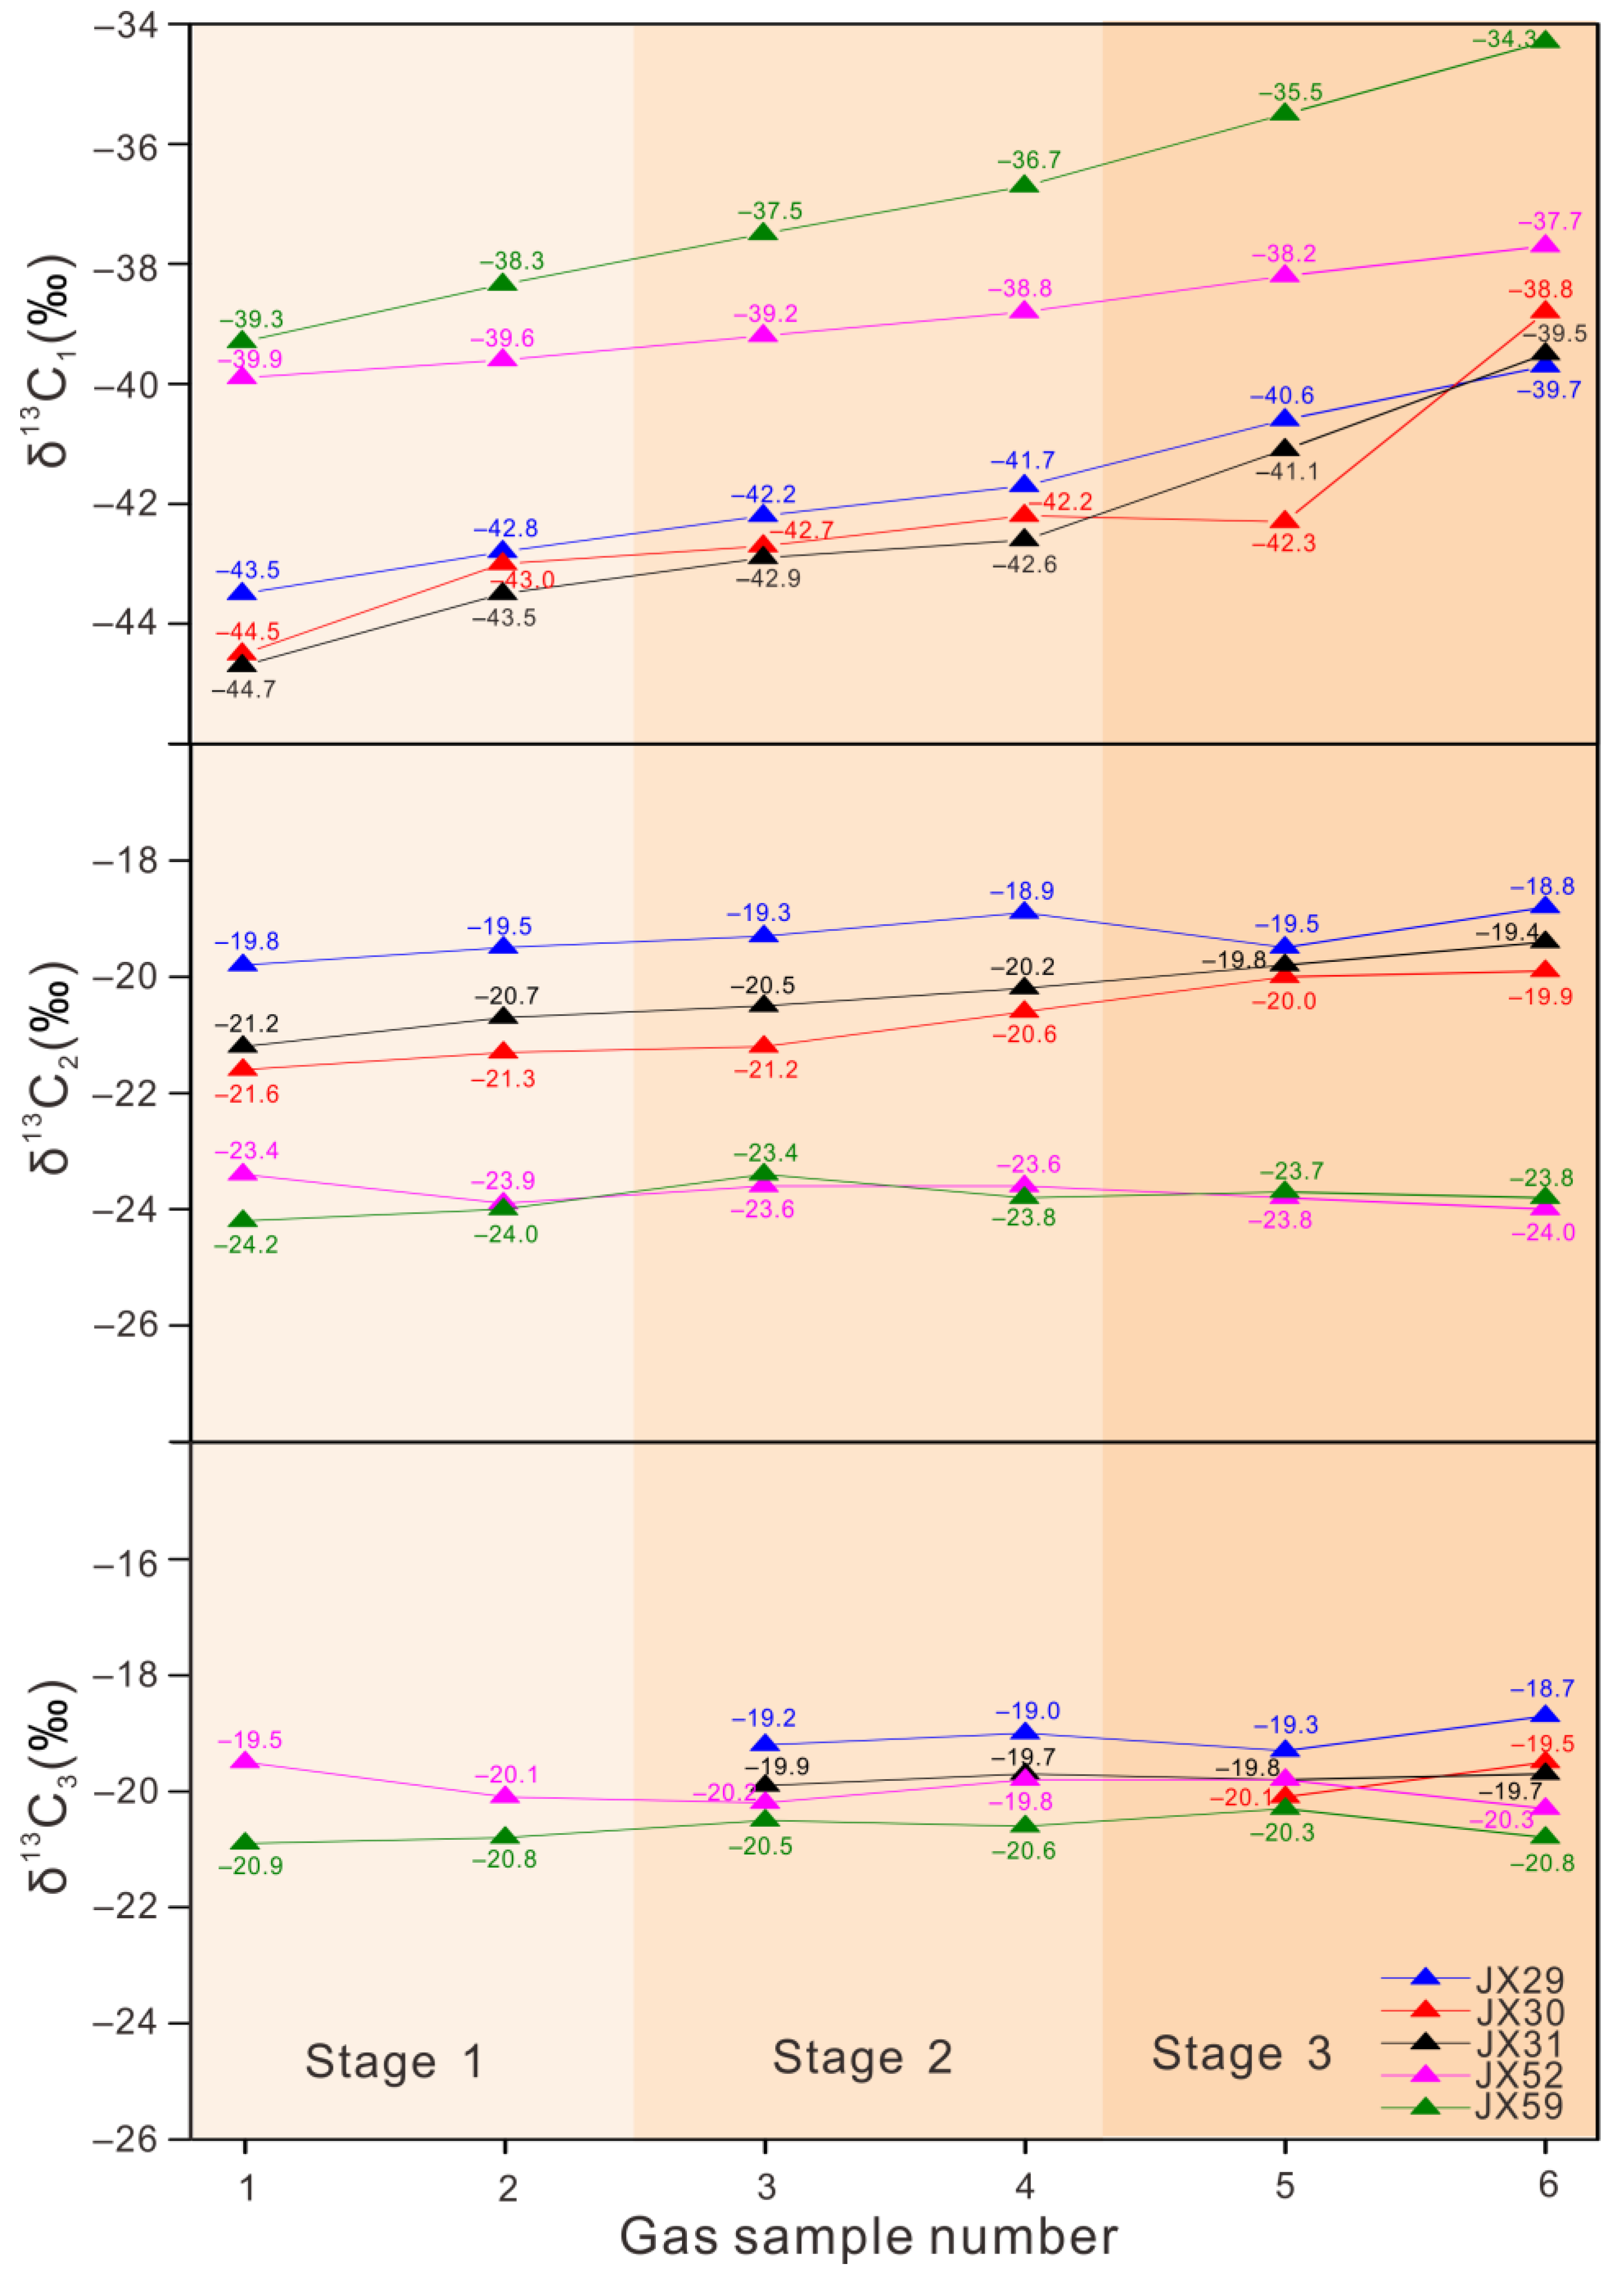
4.2. Stable Carbon Isotopes

The δ13C1 values ranged from −44.7‰ to −34.3‰, while the δ13C2 and δ13C3 values ranged from −24.2‰ to −18.8‰ and from −20.9‰ to −18.7‰, respectively. Due to the low concentration, propane stable carbon isotope values could not be detected in some gas samples (Table 1).

4.3. Total Organic Carbon (TOC) and Petrophysical Parameters

As shown in Table 2, the measured TOC content of the studied samples has a wide range in values, ranging from 1.97 wt.% to 15.16 wt.%. The TOC content of the samples did not vary with depth, but was strongly affected by frequent interbedding with coal, carbonaceous mudstone, silty shale, and muddy siltstone.
The porosity and permeability values of the three shale core samples are listed in Table 2. The porosity of all three samples ranged from 6.81% to 11.5%, and the permeability of these samples had a wide range of values, ranging from 0.116 to 78.27 mD due to the presence of cracks, as shown in the CT image. The porosity and permeability values of samples JX29 and JX59 could not be obtained because the sample sizes did not meet the experimental requirements.

4.4. Micropore Characteristics

The D-A micropore surface area and micropore volumes were calculated from CO2 adsorption analyses. For all five shale core samples investigated in our study, the value of the D-A micropore surface area varied from 21.6197 m2/g to 53.768 m2/g, and that of the micropore volume varied from 0.009241 cm3/g to 0.022476 cm3/g (Table 2).

5. Discussion

5.1. Gas Component Variation during Canister Degassing

Shale gas may be stored as free gas, adsorbed gas, or dissolved gas in organic-rich shale reservoirs with complicated pore structures [33,56]. The changes in gas molecule composition at different stages during the canister degassing process (Figure 4) may be attributed to the differences in the diffusion rate and adsorption behaviour of gas molecules. In our samples, small amounts of ethane and propane were detected even at room temperature (stage 1). Considering that wet hydrocarbon gases have stronger adsorption affinities and slower diffusion rates than methane [57,58,59], the adsorbed gas may have contributed to the methane released in the first stage due to the presence of ethane and propane. The concentrations of carbon dioxide and nitrogen peaked in stage 1 and gradually decreased over time, while methane showed a trend of increasing first and then decreasing (Figure 4). The early release of carbon dioxide and nitrogen may be related to the large diffusion coefficients of carbon dioxide and nitrogen in shale formations [60,61,62]. Furthermore, the concentrations of ethane and propane in samples JX29 and JX52 were relatively higher than those in samples JX30, JX31, and JX59, which is likely due to the difference in permeability. Indeed, sample JX52 had the highest permeability due to the presence of fractures and microcracks (Table 2).
The gas composition of the studied Xiahuayuan terrestrial shale is obviously different from that of the terrestrial Yanchang shale with similar maturity (Figure 5a). The heavy hydrocarbon gas content in our samples is relatively low (less than 10% for most gas samples), Previous studies indicate that the terrestrial Yanchang shale is dominated by the type I kerogen [63], while the organic matter of the studied Xiahuayuan terrestrial shale is dominated by type III kerogen [37]. The difference in organic matter type between the two shales might contribute to the chemical composition of natural gas because sapropelic source rocks tend to produce more heavy hydrocarbon gases than humic source rocks [63]. However, the difference can hardly be identified at higher maturity levels (Figure 5a). For example, the heavy hydrocarbon gas levels in both the Wufeng–Longmaxi Formation (sapropelic sources) and Shanxi–Taiyuan Formation (humic sources) are very low (less than 1%), which is most likely caused by the thermogenic cracking process of heavy hydrocarbon gas at a high maturity level. Moreover, the studied Xiahuayuan shale contains more non-hydrocarbon components than the Yanchang shales with similar maturity (Figure 5b). Humic source rocks’ tendency towards producing more non-hydrocarbon gases during gas generation has also been confirmed by pyrolysis experiments [64]. Another noteworthy phenomenon is that the non-hydrocarbon gas content in our samples is lower than that in Shanxi–Taiyuan shales though they are both generated from humic sources. This may be attributed to the difference in the gas generation mechanisms at different maturity levels. For example, nitrogen generation during the thermogenic transformation of organic matter and the breakdown of clay minerals mainly occur at a high temperature and over-mature stage [65].

5.2. Carbon Isotope Variation during Canister Degassing

As shown in Figure 6, the δ13C1 isotopic time series of shale gas released during canister degassing of core samples showed obvious isotope variation. For all five core samples, the isotope shift of methane varied from 2.2 ‰ to 5.7‰. Diffusion, dissolution, and adsorption are the three most crucial processes that cause stable carbon isotope variation. Previous studies have suggested that the dissolution isotope fractionation effect causes the preferential dissolution of 13CH4 molecules [23,24,25], which is opposite to the observed increase in δ13C1 values in our study. Desorption and diffusion processes, which occur simultaneously, are important during gas flow in tight reservoirs, and the related effect may be related to carbon isotope variation in our study. The difference in adsorption potential causes preferential desorption of 12CH4 [27], and 12CH4 has a higher diffusivity than 13CH4 as a result of the reduced mass coefficient [17,29,66]. Consequently, the combined effect of desorption and diffusion processes results in a more negative carbon isotope composition of earlier desorbed gas, and the variation range gradually decreases as heavier isotopes are released later. From late stage 2 to stage 3, the δ13C1 value of JX30 first decreased and then gradually increased, which may due to the desorption of residual 12CH4 molecules under new conditions. The lack of stable carbon isotope analysis of gas released during the heating stage may be the reason that only increasing δ13C1 values were observed in other samples.
It can be observed that methane is more sensitive to carbon isotope variation than heavy hydrocarbon components (Figure 6). The isotope fractionation effect caused by diffusion through the micropore system is inversely proportional to the square root of the molecular mass, as stated in quantum theory [67,68]. The mass difference between 13CH4 and 12CH4 (1:16) is larger than that of wet hydrocarbon gases (1:30 for C2H6 and 1:44 for C3H8), which results in a difference in molecular diffusion between 13CH4 and 12CH4, and the variation range of δ13C1 is larger than that of heavier hydrocarbon gases. Furthermore, the greater adsorption potentially delays the desorption and diffusion processes of heavy hydrocarbon components, making ethane/propane remain in the early degassing stage where isotopic variation is substantially lower, while methane reaches the late stage of degassing (Figure 4b,c). Therefore, the combined effects of the desorption and diffusion processes make the variation in δ13C3 and δ13C2 insignificant compared to δ13C1.
Unlike conventional reservoirs, time-series sampling shows that the composition and stable carbon isotopes of shale gas represent instantaneous values and vary constantly during the canister degassing experiment. The early released gas investigated in our study does not display the expected composition and stable isotopic characteristics of coal-derived gas [37,59] in the Bernard diagram because of the strongest 13C1 and wet hydrocarbon depletion caused by the desorption and diffusion effects (Figure 7). A substantially depleted δ13C1 value caused by the migration effect has also been documented in a previous study [28], and experimental investigations have shown that the δ13C1 value of gas samples gradually approaches the isotopic composition of the source [20]. Hence, although molecular and isotopic compositions have been widely used in the study of natural gas origins and genetic types [1,2,3,69,70], our results show that more consideration should be given to the selection of gas samples from the canister degassing experiments, suggesting that the late stage of released gas may be more suitable when applied to these models.

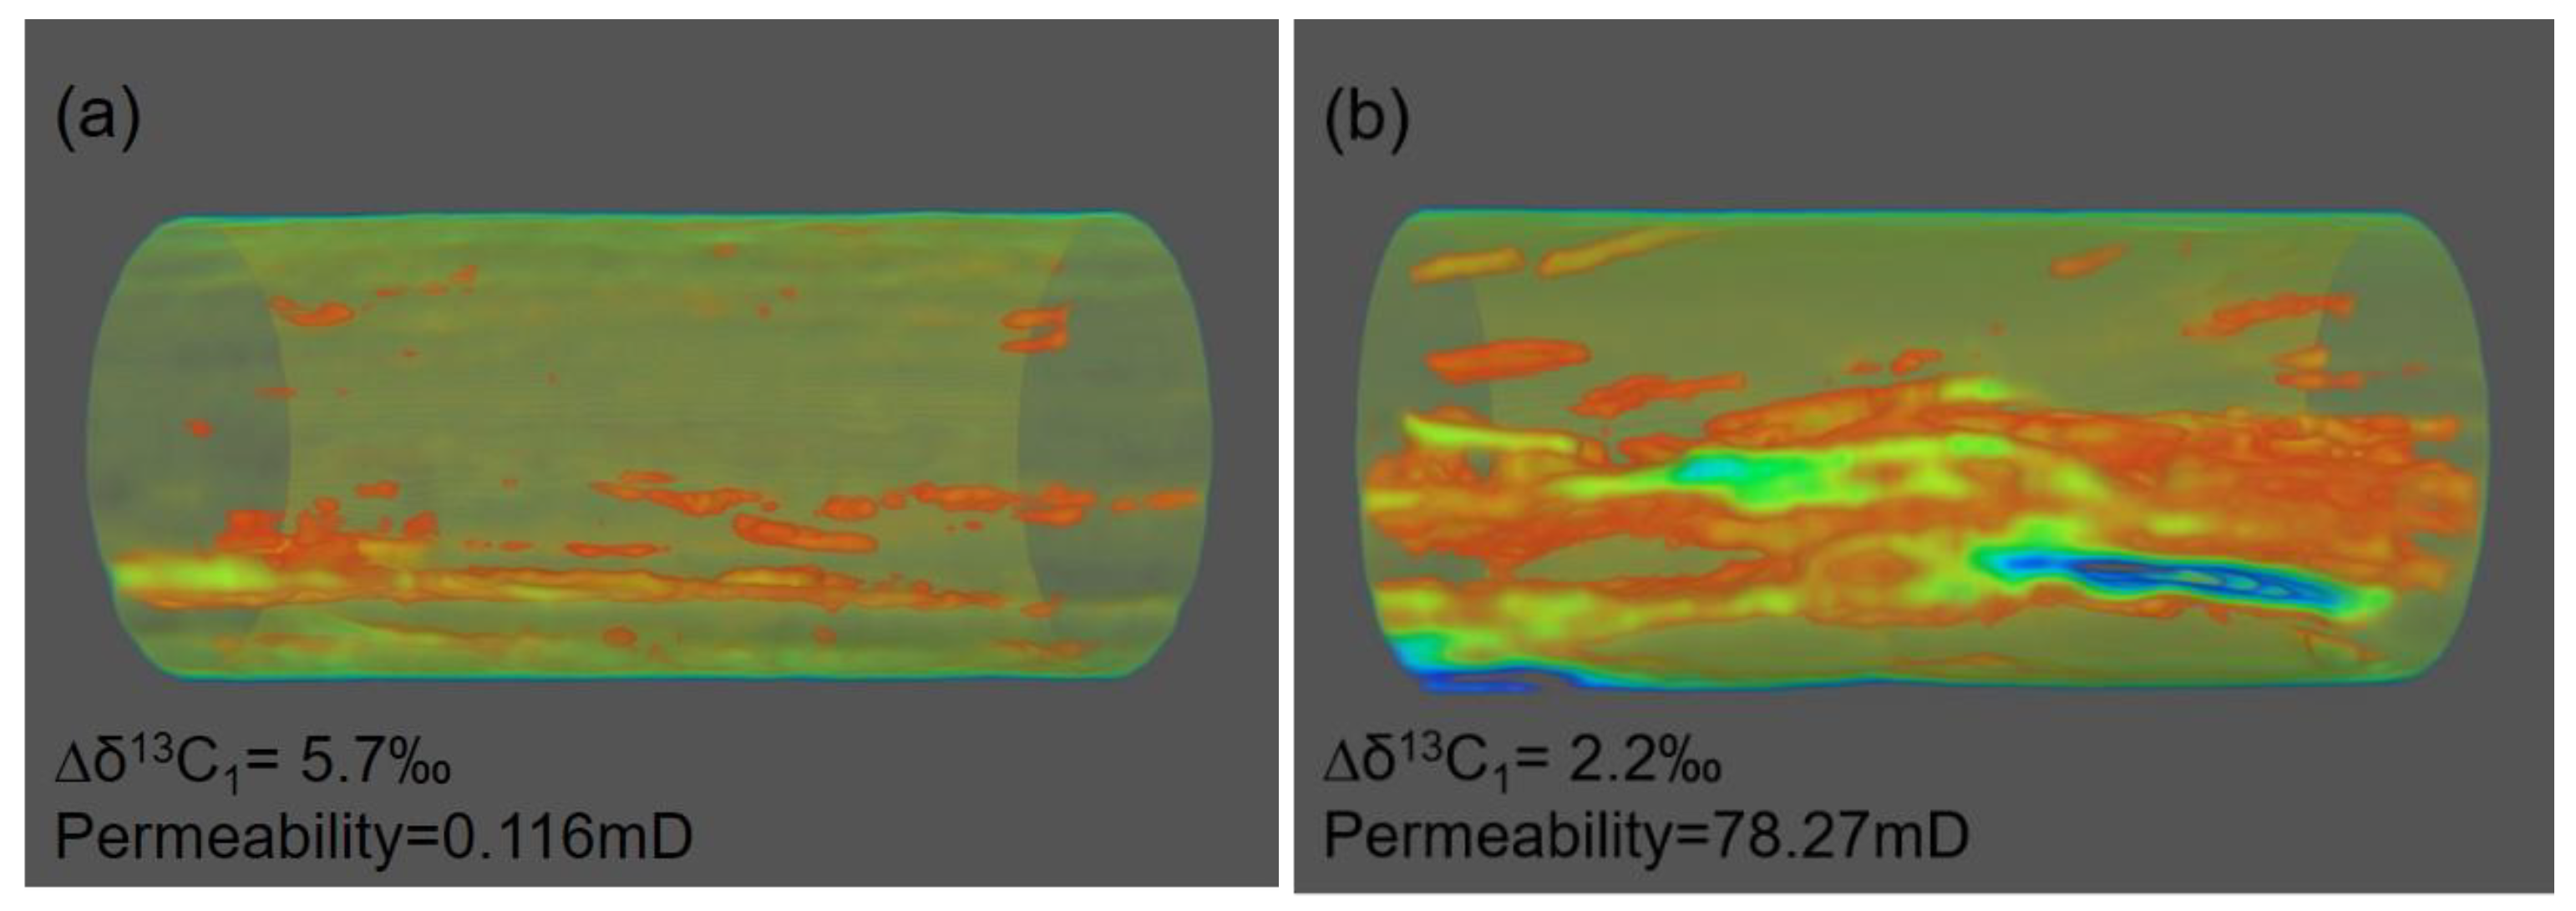
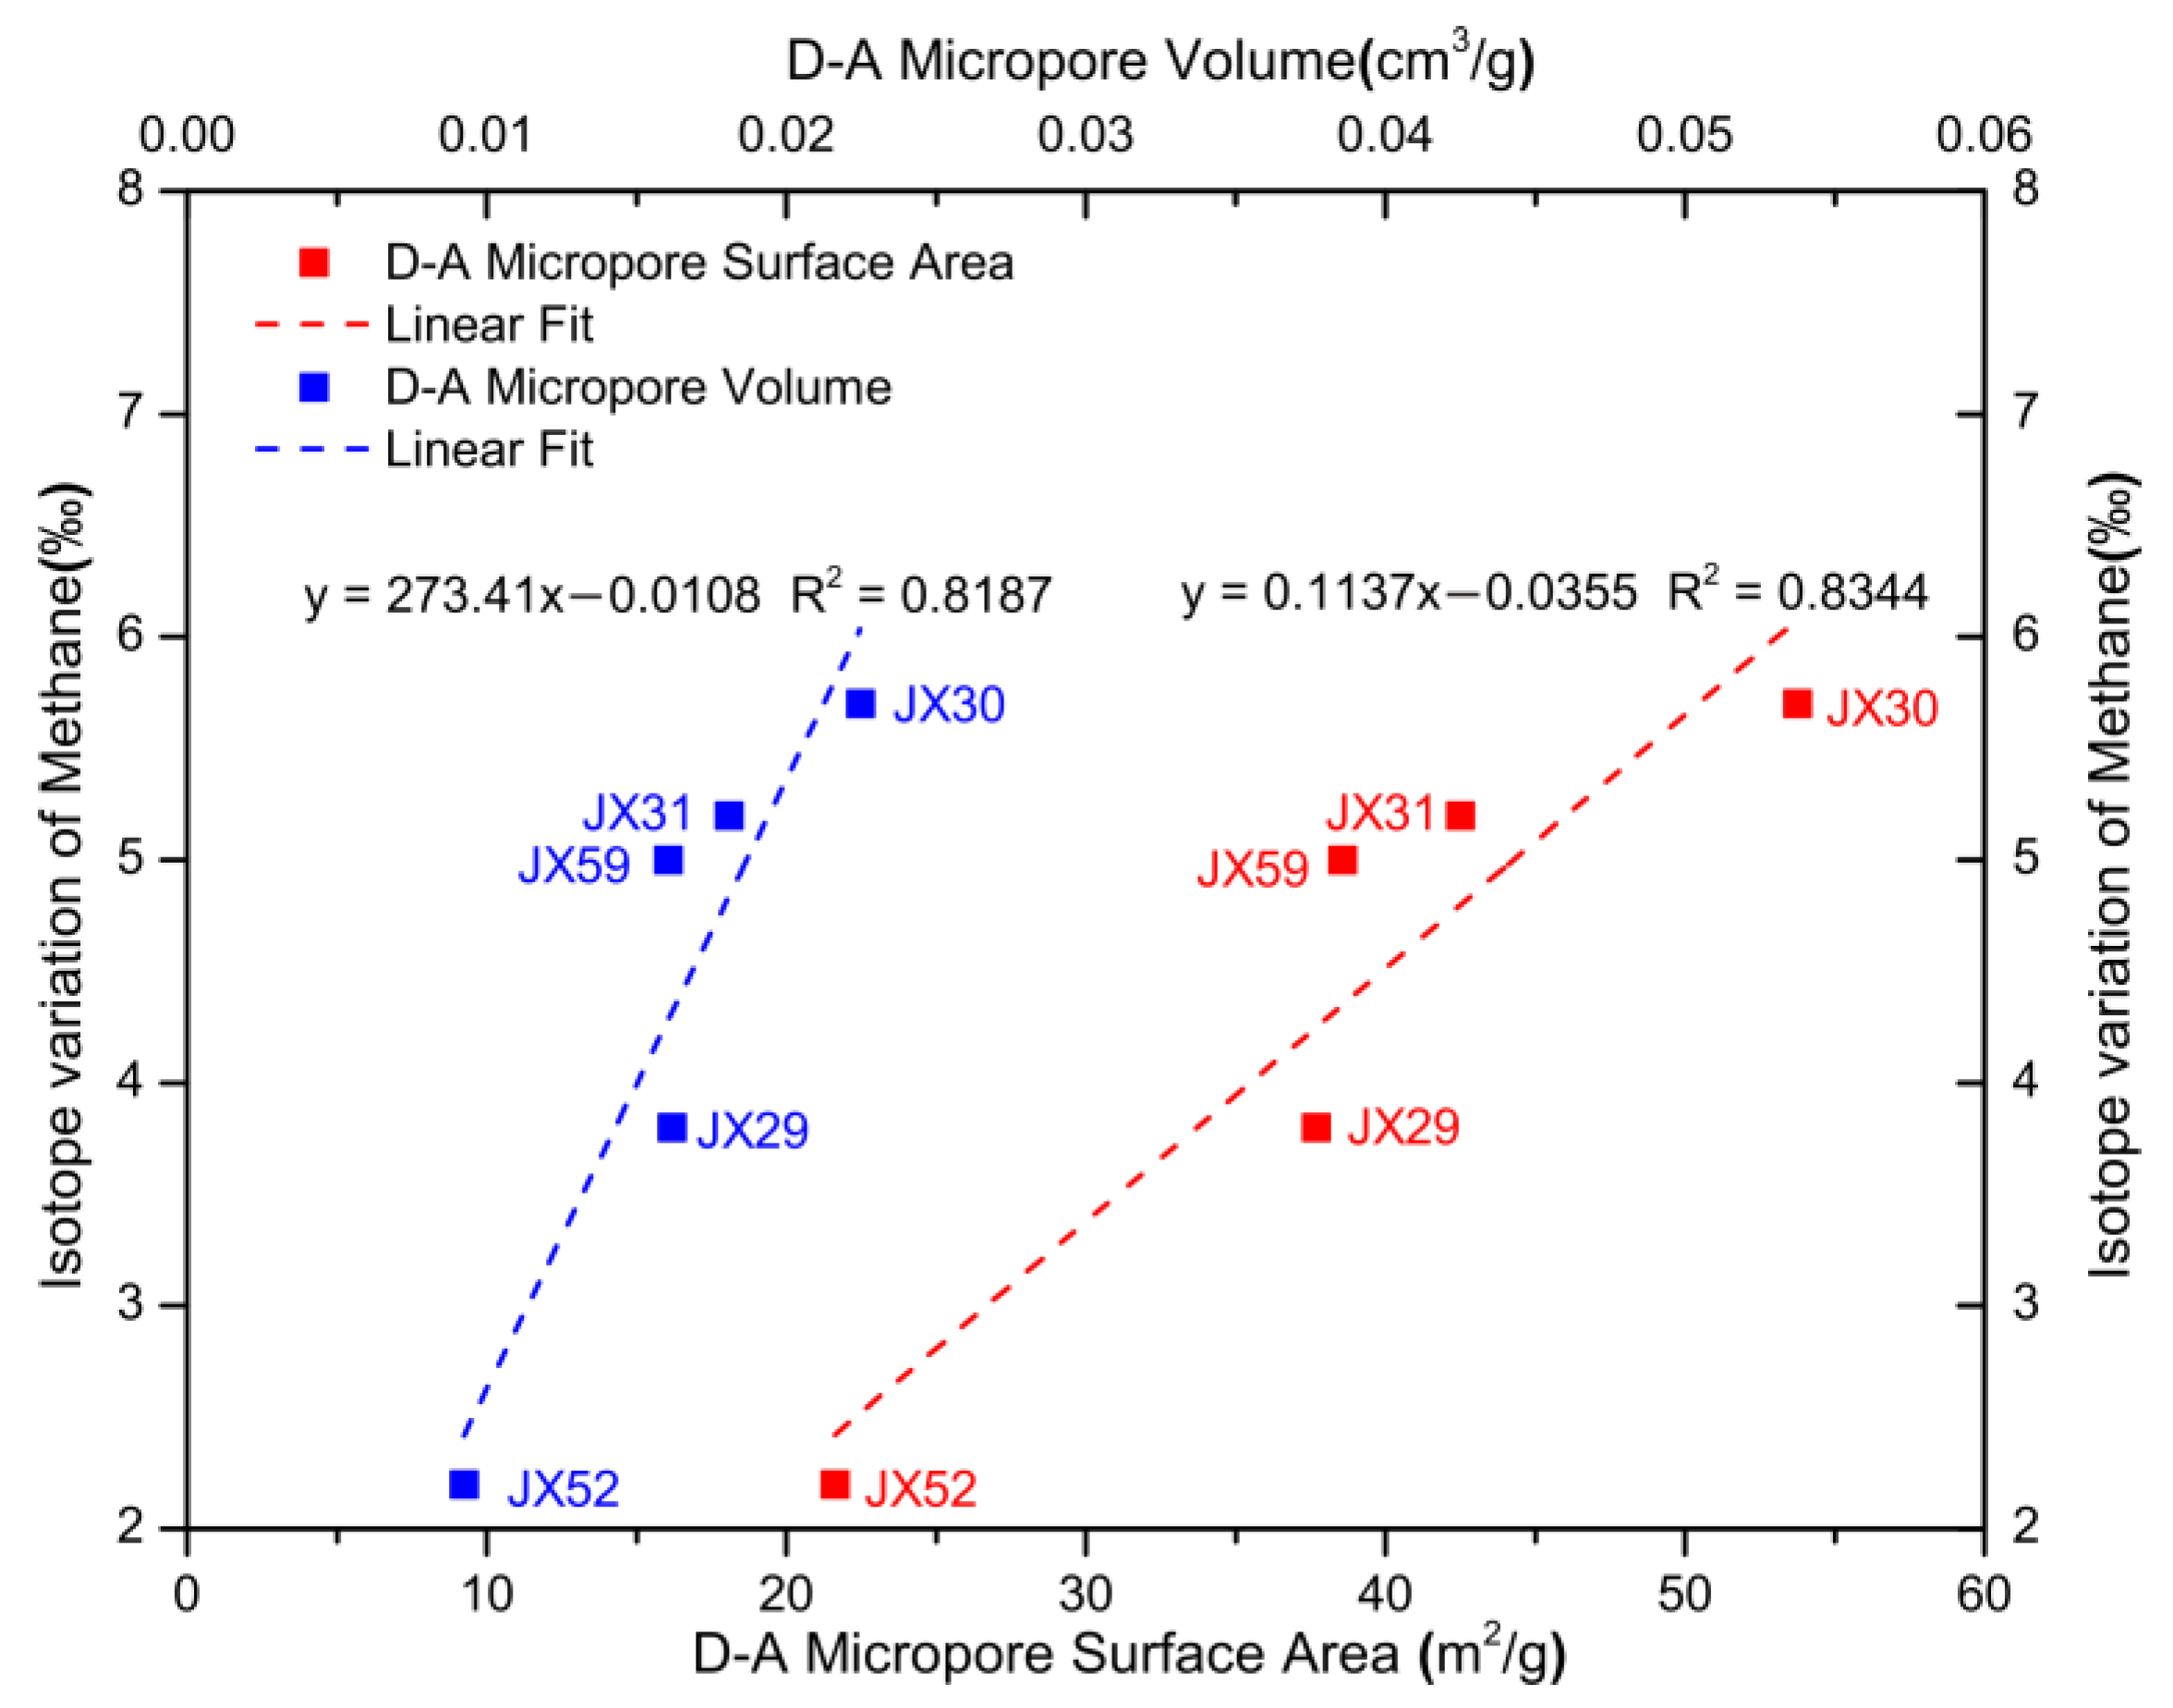
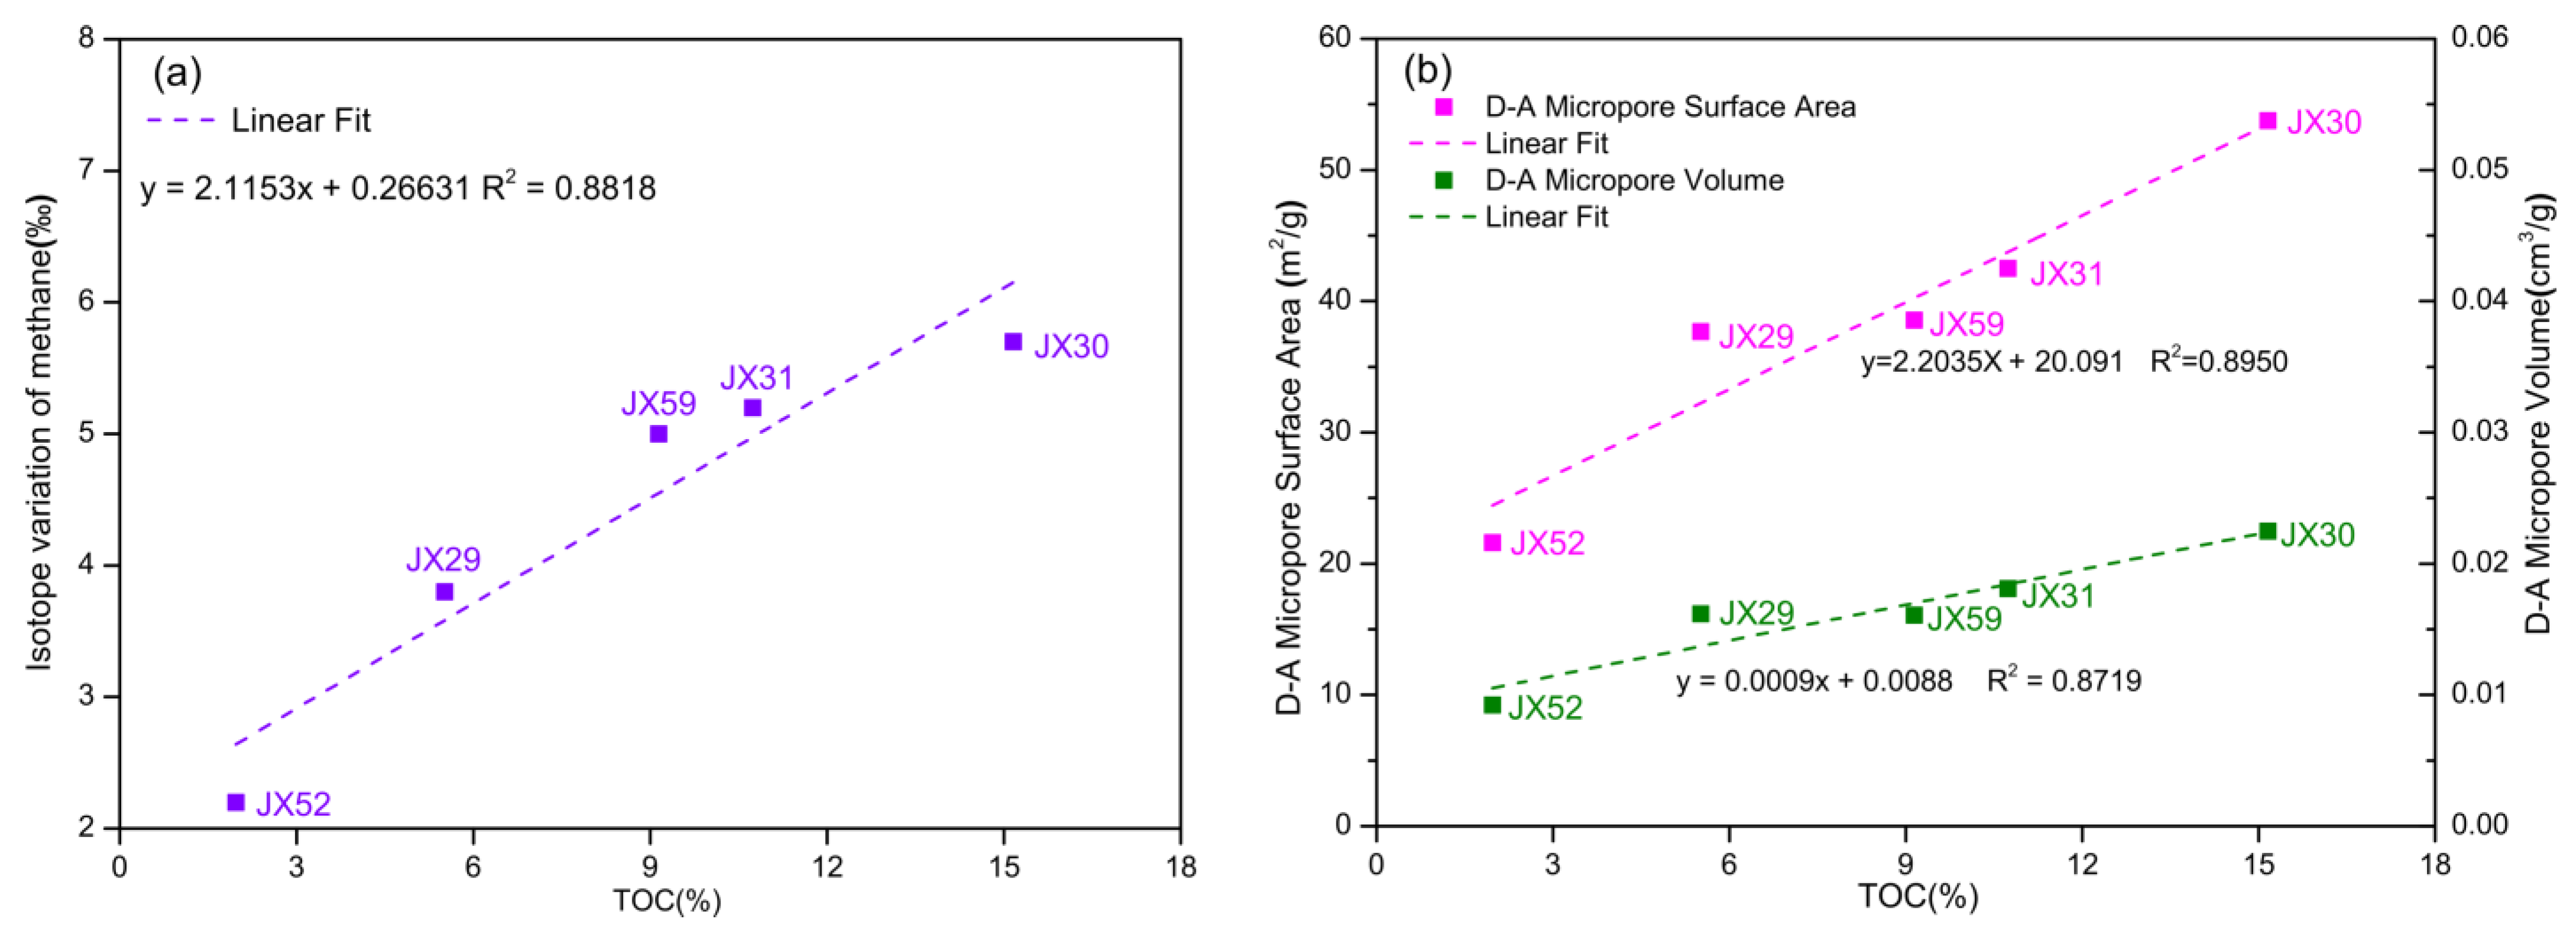
5.3. Influence of Petrophysics on Carbon Isotope Variation

Previous studies have shown that the degree of isotopic variation is inversely related to bulk rock petrophysical parameters (e.g., porosity and permeability) [31]. It is well recognised that the carbon isotope composition of natural gas shows negligible variation in conventional reservoirs [29], whereas obvious isotope variation occurs during gas migration in coal reservoirs [15,73]. In our samples, the carbon isotope variation of methane was controlled by permeability and fracture development (Figure 8). For the samples with low permeability and undeveloped fractures, the isotope variation during degassing was as high as 5.7‰, while for the samples with high permeability, the fracture system was very developed and the isotope variation was significantly reduced.
No obvious correlation between carbon isotope variation and porosity was observed in our samples. However, a low-pressure CO2 adsorption test shows that isotope variation is positively correlated (R2 > 0.80) with micropore volume and micropore surface during degassing (Figure 9). Gas migration through micropores is strongly affected by adsorption affinities, Knudsen diffusion (collision between molecules and pore walls), surface diffusion (gas migration from one adsorption site to another), and configurational diffusion in ultra-micropores [61,74]. The increase in micropore surface and volume leads to an increase in adsorption affinity and interaction with micropore walls, making the gas flow strongly restricted, and a larger isotope shift was expressed. In contrast, isotopic variation is limited when gas permeates through macropores dominated by continuum diffusion or viscous flow [29]. Therefore, we emphasise the importance of micropore constitution on the diffusion carbon isotope effect, not only the porosity properties. In other words, larger isotope variation occurs when micropores constitute a larger portion of the overall porosity or the relative abundance of micropores increases. Furthermore, several experimental studies and model assumptions have demonstrated that the methane carbon isotopic shift increases with TOC content [17,20,21,22], which is consistent with our observation during canister degassing of shale (Figure 10a). The positive correlation between carbon isotopic variation and TOC may be related to the more developed micropores of such samples (Figure 10b), thus enhancing the efficiency of the “molecular sieve” and resulting in a greater isotope effect.
The major components (free gas, adsorbed gas, or both) of gas released from degassing tests have been discussed extensively in previous studies. Some studies have reported that free gas is lost prior to sampling, and thus the sampled gas is a product of the adsorbed gas in coal/shale reservoirs [17,75], while others advocate that adsorbed gas can hardly desorb at room temperature and that gas released from canister degassing captures substantial free gas [76]. The different observations reported in previous studies may be related to the difference in shale and coal properties and the coring process. For samples with relatively high permeability due to the presence of fractures and microcracks, free gas would be lost prior to sampling, and thus the sampled gas is a product of adsorbed gas. For samples with relatively low permeability and good storage conditions, free gas would been preserved in core samples and, at the same time, the molecular mobility and degassing rate of adsorbed gas would decrease with pressurised free gas preservation, making the sampled gas capture substantial free gas. In this study, our samples show that methane carbon isotope variation is expressed even in the early degassing stage at room temperature (Figure 6), and for some samples, gas released at room temperature (stage 1) showed a large isotope shift like those released at high temperature (stage 3). On the consensus that gas released at high temperature is the residual adsorbed gas and free gas shows no isotope variation, it can be inferred that adsorbed gas has already been desorbed at room temperature. In this case, our results suggest that the degree of natural gas loss during the shale being lifted to the surface may have been higher than previously expected. Indeed, the long-term production data of some shale gas fields (e.g., Fuling shale gas field) show significantly higher reserves than those estimated by field degassing experimental data [77]. Thus, more parameters and models may need to be considered when evaluating lost gas from shales. The difference in isotope variation between free gas and adsorbed gas may provide a reference for better identification of the degassing stage in degassing experiments, and may have a broader implication for the production status of shale gas wells. We also note that there are limitations when using field degassing experimental data to predict shale gas production behavior, because the degassing and isotopic variation of shale gas under high temperature and pressure reservoir conditions may be different from those observed in field degassing experiments, which needs further investigation.

6. Conclusions

Molecular and carbon isotopic variations during degassing of terrestrial shale and the influencing factors were investigated based on time-series sampling. Our results show that gas components and carbon isotopes of shale gas represent instantaneous values and vary constantly during the canister degassing experiment. The methane content first increased and then decreased, and the concentrations of carbon dioxide and nitrogen peaked in the early degassing stage, while heavier hydrocarbons showed a depletion in the early degassing stage and gradually increased over time. In comparison, shale gas generated from humic source rocks contain more non-hydrocarbon and less heavy hydrocarbon components than that generated from sapropelic source rocks with similar maturity. The isotope shift of methane varied from 2.2‰ to 5.7‰, and the minimum isotope variation was found in a high-permeability sample. For all samples, the degree of carbon isotope variation was positively correlated with microscope volume and microscope surface, indicating that micropores contribute significantly to the kinetic isotope effect. This is also the case for larger isotopic variation accompanied by a higher TOC values. Unlike conventional gas, the strong 13C1 and C2+ depletion of shale gas during the early degassing stage was observed, which may lead to deviations in geochemical assessment, such as in the evaluation of shale gas origins. Thus, the selection of gas samples in the late stage of degassing could be effective in reducing analysis deviation. Furthermore, based on the obvious isotope variation at room temperature, it can be inferred that some adsorbed gas has already been desorbed at this stage in our core samples. Our results thus suggest that more parameters and models may need to be considered when evaluating the lost gas from shales.

Author Contributions

Conceptualisation, J.T. and J.Z.; methodology, J.T., Y.L. and J.L.; validation, J.T. and J.Z.; formal analysis, J.T., Y.L. and W.D.; investigation, J.T., S.W. and Z.D.; resources, H.Y.; data curation, J.T. and S.W.; writing—original draft preparation, J.T.; writing—review and editing, Y.L., J.L. and Z.C.; supervision, J.Z.; project administration, J.Z. All authors have read and agreed to the published version of the manuscript.

Funding

This work was supported by the National Natural Science Foundation of China (Grant No. 41927801, 1 January 2020), the National Science and Technology Major Project (Grant No. 2016ZX05034002-001, 6 March 2017), and the Shale Gas Resources Investigation and Evaluation in the eastern part of the Xuanhua Basin Program, Hebei Province (3-4-2018-187, 29 October 2018).

Data Availability Statement

The data that support the finding of this study are openly available in Mendeley Data at http://dx.doi.org/10.17632/vv2wt5rm79.1, accessed on 13 July 2021.

Acknowledgments

The authors thank the Hebei Province Coal Geological Exploration Institute and the Coal Geological Bureau of Hebei Province Fourth Geological Team for sample support, as well as their permission to publish this paper.

Conflicts of Interest

No potential conflict of interest was reported by the authors.

References

  1. Schoell, M. The hydrogen and carbon isotopic composition of methane from natural gases of various origins. Geochim. Cosmochim. Acta 1980, 44, 649–661. [Google Scholar] [CrossRef]
  2. Berner, U.; Faber, E. Maturity related mixing model for methane, ethane and propane, based on carbon isotopes. Org. Geochem. 1988, 13, 67–72. [Google Scholar] [CrossRef]
  3. Dai, J.X.; Li, J.; Luo, X.; Zhang, W.Z.; Hu, G.Y.; Ma, C.H.; Guo, J.M.; Ge, S.G. Alkane carbon isotopic composition and gas source in giant gas fields of Ordos Basin. Acta Pet. Sin. 2005, 26, 18–26, (In Chinese with English abstract). [Google Scholar]
  4. Dong, Z.; Zhang, J.C.; Tang, X.; Liu, G.X.; Dang, W.; Liu, Y.; Tao, J.; Su, Z.X. Origin and diffusion of the over-mature transitional natural gas in multiple lithologic reservoirs: A case study of Carboniferous-Permian strata in the southeastern margin of Ordos Basin. Int. J. Coal Geol. 2020, 219, 103380. [Google Scholar] [CrossRef]
  5. Gunter, B.D.; Gleason, J.D. Isotope fractionation during gas chromatographic separations. J. Chromatogr. Sci. 1971, 9, 191–192. [Google Scholar] [CrossRef]
  6. Smith, J.W.; Rigby, D.; Gould, K.W.; Hart, G.; Hargraves, A.J. An isotopic study of hydrocarbon generation processes. Org. Geochem. 1985, 8, 341–347. [Google Scholar] [CrossRef]
  7. Krooss, B.M. Experimental investigation of the molecular migration of C1-C6 hydrocarbons: Kinetics of hydrocarbon release from source rocks. Org. Geochem. 1988, 13, 513–523. [Google Scholar] [CrossRef]
  8. Zhang, M.J.; Tang, Q.Y.; Cao, C.H.; Lv, Z.G.; Zhang, T.W.; Zhang, D.K.; Li, Z.P.; Du, L. Molecular and carbon isotopic variation in 3.5 years shale gas production from Longmaxi Formation in Sichuan Basin, China. Mar. Pet. Geol. 2018, 89, 27–37. [Google Scholar] [CrossRef]
  9. Ma, Y.; Zhong, N.N.; Yao, L.P.; Huang, H.P.; Larter, S.; Jiao, W.W. Shale gas desorption behavior and carbon isotopic variations of gases from canister desorption of two sets of gas shales in south China. Mar. Pet. Geol. 2020, 113, 104127. [Google Scholar] [CrossRef]
  10. Colombo, U.; Gazzarrini, F.; Sironi, G.; Gonfiantini, R.; Tongiorgi, E. Carbon isotope composition of individual hydrocarbons from Italian natural gases. Nature 1965, 205, 1303–1304. [Google Scholar] [CrossRef]
  11. Hoşgörmez, H.; Yalçın, M.N.; Cramer, B.; Gerling, P.; Mann, U. Isotopic and molecular composition of coal-bed gas in the Amasra region (Zonguldak basin-western Black Sea). Org. Geochem. 2002, 33, 1429–1439. [Google Scholar] [CrossRef]
  12. Richter, F.M.; Mendybaev, R.A.; Christensen, J.N.; Hutcheon, I.D.; Williams, R.W.; Sturchio, N.C.; Beloso, A.D., Jr. Kinetic isotopic fractionation during diffusion of ionic species in water. Geochim. Cosmochim. Acta 2006, 70, 277–289. [Google Scholar] [CrossRef] [Green Version]
  13. Hamilton, S.K.; Golding, S.D.; Baublys, K.A.; Esterle, J.S. Stable isotopic and molecular composition of desorbed coal seam gases from the Walloon Subgroup, eastern Surat Basin, Australia. Int. J. Coal Geol. 2014, 122, 21–36. [Google Scholar] [CrossRef]
  14. Gould, K.W.; Hargraves, A.J.; Smith, J.W. Variation in the composition of seam gases issuing from coal. Bull. Proc. Aust. Inst. Min. Metall. 1987, 292, 69–73. [Google Scholar]
  15. Strąpoć, D.; Schimmelmann, A.; Mastalerz, M. Carbon isotopic fractionation of CH4 and CO2 during canister desorption of coal. Org. Geochem. 2006, 37, 152–164. [Google Scholar] [CrossRef]
  16. Strąpoć, D.; Mastalerz, M.; Schimmelmann, A.; Drobniak, A.; Hasenmueller, N.R. Geochemical constraints on the origin and volume of gas in the New Albany Shale (Devonian-Mississippian), eastern Illinois Basin. AAPG Bull. 2010, 94, 1713–1740. [Google Scholar] [CrossRef]
  17. Niemann, M. Stable Isotope Systematics of Coalbed Methane. Ph.D. Thesis, University of Victoria, Victoria, BC, Canada, 2006. [Google Scholar]
  18. Leythaeuser, D.; Schaefer, R.G.; Yükler, A. Diffusion of light hydrocarbons through near-surface rocks. Nature 1980, 284, 522–525. [Google Scholar] [CrossRef]
  19. Prinzhofer, A.; Pernaton, E. Isotopically light methane in natural gas: Bacterial imprint or diffusive fractionation? Chem. Geol. 1997, 142, 193–200. [Google Scholar] [CrossRef]
  20. Zhang, T.; Krooss, B.M. Experimental investigation on the carbon isotope fractionation of methane during gas migration by diffusion through sedimentary rocks at elevated temperature and pressure. Geochim. Cosmochim. Acta 2001, 65, 2723–2742. [Google Scholar] [CrossRef]
  21. Schloemer, S.; Krooss, B.M. Molecular transport of methane, ethane and nitrogen and the influence of diffusion on the chemical and isotopic composition of natural gas accumulations. Geofluids 2004, 4, 81–108. [Google Scholar] [CrossRef]
  22. Xia, X.; Tang, Y. Isotope fractionation of methane during natural gas flow with coupled diffusion and adsorption/desorption. Geochim. Cosmochim. Acta 2012, 77, 489–503. [Google Scholar]
  23. Fuex, A.N. Experimental evidence against an appreciable isotopic fractionation of methane during migration. Phys. Chem. Earth 1980, 12, 725–732. [Google Scholar] [CrossRef]
  24. Bacsik, Z.; Lopes, J.N.C.; Gomes, M.F.C.; Jancso, G.; Mink, J.; Padua, A.A.H. Solubility isotope effects in aqueous solutions of methane. J. Chem. Phys. 2002, 116, 10816–10824. [Google Scholar] [CrossRef] [Green Version]
  25. Lu, J.; Larson, T.E.; Smyth, R.C. Carbon isotope effects of methane transport through Anahuac Shale—A core gas study. J. Geochem. Explor. 2015, 148, 138–149. [Google Scholar] [CrossRef] [Green Version]
  26. Rahn, T.; Eiler, J.M. Experimental constrains on the fractionation of 13C/12C and 18O/16O ratios due to adsorption of CO2 on mineral substrates at conditions relevant to the surface of Mars. Geochim. Cosmochim. Acta 2001, 65, 839–846. [Google Scholar] [CrossRef]
  27. Su, X.B.; Chen, R.; Lin, X.Y.; Guo, S.Q. Adsorption characteristic curves of 13CH4 and 12CH4 on coal and their application. J. China. Coal Soc. 2007, 32, 539–543, (In Chinese with English abstract). [Google Scholar]
  28. Wang, X.F.; Li, X.F.; Wang, X.Z.; Shi, B.G.; Luo, X.R.; Zhang, L.X.; Lei, Y.H.; Jiang, C.F.; Meng, Q. Carbon isotopic fractionation by desorption of shale gases. Mar. Pet. Geol. 2015, 60, 79–86. [Google Scholar] [CrossRef]
  29. Li, W.B.; Lu, S.F.; Li, J.Q.; Wei, Y.B.; Feng, W.J.; Zhang, P.F.; Song, Z.J. Geochemical modeling of carbon isotope fractionation during methane transport in tight sedimentary rocks. Chem. Geol. 2021, 566, 120033. [Google Scholar] [CrossRef]
  30. Krooss, B.M. Diffusion of C1 to C5 hydrocarbons in water-saturated sedimentary rocks. Erdöl Kohle-Erdgas 1986, 39, 399–402. [Google Scholar]
  31. Li, J.; Liu, Z.L.; Li, Z.S.; Hu, G.Y.; Yan, Q.T.; Shan, X.Q.; Ma, C.H.; Wang, C.Y. Experiment investigation on the carbon isotope and composition fractionation of methane during gas migration by diffusion. Nat. Gas Geosci. 2003, 14, 463–468. (In Chinese) [Google Scholar]
  32. Zumberge, J.E.; Ferworn, K.A.; Curtis, J.B. Gas character anomalies found in highly productive shale gas wells. Geochim. Cosmochim. Acta 2009, 73, A1539. [Google Scholar]
  33. Curtis, J.B. Fractured shale-gas systems. AAPG Bull. 2002, 86, 1921–1938. [Google Scholar]
  34. Jarvie, D.M.; Hill, R.J.; Ruble, T.E.; Pollastro, R.M. Unconventional shale-gas systems: The Mississippian Barnett Shale of north-central Texas as one model for thermogenic shale-gas assessment. AAPG Bull. 2007, 91, 475–499. [Google Scholar] [CrossRef]
  35. Gonzalez, J.; Lewis, R.; Hemingway, J.; Grau, J.; Rylander, E.; Pirie, I. Determination of formation organic carbon content using a new neutron-induced gamma ray spectroscopy service that directly measures carbon. Soc. Petrol. Eng. 2013, 230, 265–269. [Google Scholar]
  36. Bustin, A.; Bustin, R. Total gas-in-place, gas composition and reservoir properties of coal of the Mannville coal measures, Central Alberta. Int. J. Coal Geol. 2016, 153, 127–143. [Google Scholar] [CrossRef]
  37. Liu, J.L.; Zhang, J.C.; Chang, M.H.; Wang, S.; Chen, L.; Yu, H.C. Gas-generation potential of shales in small and medium-sized basins: A case study from the Xuanhua Basin, North China. Aust. J. Earth Sci. 2020, 67, 411–424. [Google Scholar] [CrossRef]
  38. Song, H.L. Basic characteristics and dynamics of Yanshan intraplate orogenic belt. Earth Sci. Front. 1999, 6, 309–310. [Google Scholar]
  39. Cope, T.D.; Shultz, M.R.; Graham, S.A. Detrital record of Mesozoic shortening in the Yanshan belt, NE China: Testing structural interpretations with basin analysis. Basin Res. 2007, 2, 1–20. [Google Scholar] [CrossRef]
  40. Liu, J.; Zhao, Y.; Liu, X.M.; Wang, Y.; Liu, X.W. Rapid exhumation of basement rocks along the northern margin of the North China craton in the early Jurassic: Evidence from the Xiabancheng Basin, Yanshan Tectonic Belt. Basin Res. 2012, 24, 544–558. [Google Scholar] [CrossRef]
  41. Liu, S.F.; Su, S.; Zhang, G.W. Early Mesozoic basin development in Noth China: Indications of cratonic deformation. J. Asian Earth Sci. 2013, 62, 221–236. [Google Scholar] [CrossRef]
  42. Liu, S.F.; Lin, C.F.; Liu, X.B.; Zhuang, Q.T. Syn-tectonic sedimentation and its linkage to fold-thrusting in the region of Zhangjiakou, North Hebei, China. Sci. China Earth Sci. 2018, 61, 49–78. [Google Scholar] [CrossRef]
  43. Zorin, Y.A.; Belichenko, V.G.; Turutanov, E.K.; Mazukabzov, A.M.; Sklyarov, E.V.; Mordvinova, V.V. The East Siberia Transect. Int. Geol. Rev. 1995, 37, 154–175. [Google Scholar] [CrossRef]
  44. Liu, S.F.; Li, Z.; Zhang, J.F. Mesozoic basin evolution and tectonic mechanism in Yanshan, China. Sci. China Ser. D Earth Sci. 2004, 47, 24–38. [Google Scholar] [CrossRef]
  45. Zhang, J.C.; Tang, Y.; Tang, X.; Song, Z.L.; Zhai, D.J.; Xue, H. Adsorbed Gas Content Measuring Instrument and Its Testing Method. U.S. Patent 8578754, 12 November 2013. [Google Scholar]
  46. Moore, T.A. Coalbed methane: A review. Int. J. Coal Geol. 2012, 101, 36–81. [Google Scholar] [CrossRef]
  47. Diamond, W.P.; Schatzel, S.J. Measuring the gas content of coal: A review. Int. J. Coal Geol. 1998, 35, 311–331. [Google Scholar] [CrossRef]
  48. Dang, W.; Zhang, J.C.; Tang, X.; Wei, X.L.; Li, Z.M.; Wang, C.H.; Chen, Q.; Liu, C. Investigation of gas content of organic-rich shale: A case study from Lower Permian shale in southern North China Basin, central China. Geosci. Front. 2018, 9, 559–575. [Google Scholar] [CrossRef]
  49. Ma, Y.; Zhong, N.N.; Li, D.H.; Pan, Z.J.; Cheng, L.J.; Liu, K.Y. Organic matter/clay mineral intergranular pores in the lower Cambrian Lujiaping shale in the north-eastern part of the upper Yangtze area, China: A possible microscopic mechanism for gas preservation. Int. J. Coal Geol. 2015, 137, 38–54. [Google Scholar] [CrossRef]
  50. Ni, Y.Y.; Dai, J.X.; Zhu, G.Y.; Zhang, S.C.; Zhang, D.J.; Su, J.; Tao, X.W.; Liao, F.R.; Wu, W.; Gong, D.Y.; et al. Stable hydrogen and carbon isotopic ratios of coal-derived and oil-derived gases: A case study in the Tarim basin, NW China. Int. J. Coal Geol. 2013, 116–117, 302–313. [Google Scholar] [CrossRef]
  51. Jenden, P.D.; Titley, P.A.; Worden, R.H. Enrichment of nitrogen and 13C of methane in natural gases from the Khuff Formation, Saudi Arabia, caused by thermochemical sulfate reduction. Org. Geochem. 2015, 82, 54–68. [Google Scholar] [CrossRef]
  52. Determination of Total Organic Carbon in Sedimentary Rock; GB/T 19145-2003; Standardization Administration of the People’s Republic of China: Shenzhen, China, 2003. (In Chinese)
  53. Xu, H.; Tang, D.Z.; Zhao, J.L.; Li, S. A precise measurement method for shale porosity with low-field nuclear magnetic resonance: A case study of the Carboniferous-Permian strata in the Linxing area, eastern Ordos Basin, China. Fuel 2015, 143, 47–54. [Google Scholar] [CrossRef]
  54. Measurement of Helium Porosity and Pulse Decay Permeability of Shale; GB/T 34533-2017; Standardization Administration of the People’s Republic of China: Shenzhen, China, 2017. (In Chinese)
  55. Chinese Energy Industry Standard. Shale Scanning and Imagination Method Using X-ray Computed Tomography; NB/T 10122-2018; Standardization Administration of the People’s Republic of China: Shenzhen, China, 2018. (In Chinese)
  56. Cao, Z.; Jiang, H.; Zeng, J.H.; Saibi, H.; Lu, T.Z.; Xie, X.M.; Zhang, Y.C.; Zhou, G.G.; Wu, K.Y.; Guo, J.R. Nanoscale liquid hydrocarbon adsorption on clay minerals: A molecular dynamics simulation of shale oils. Chem. Eng. J. 2021, 420, 127578. [Google Scholar] [CrossRef]
  57. Cheng, A.L.; Huang, W.L. Selective adsorption of hydrocarbon gases on clays and organic matter. Org. Geochem. 2004, 35, 413–423. [Google Scholar] [CrossRef]
  58. Liu, Y.; Zhang, J.C.; Tang, X. Predicting the proportion of free and adsorbed gas by isotopic geochemical data: A case study from lower Permian shale in the Southern North China Basin (SNCB). Int. J. Coal Geol. 2016, 156, 25–35. [Google Scholar] [CrossRef]
  59. Luo, Q.Y.; Gong, L.; Qu, Y.; Zhang, K.; Zhang, G.; Wang, S. The tight oil potential of the Lucaogou Formation from the southern Junggar Basin, China. Fuel 2018, 234, 858–871. [Google Scholar] [CrossRef]
  60. Hunt, J.M. Generation of gas and oil from coal and other terrestrial organic matter. Org. Geochem. 1991, 37, 673–680. [Google Scholar] [CrossRef]
  61. Cui, X.J.; Bustin, R.M.; Dipple, G. Selective transport of CO2, CH4, and N2 in coals: Insights from modeling of experimental gas adsorption data. Fuel 2004, 83, 293–303. [Google Scholar] [CrossRef]
  62. Du, X.D.; Gu, M.; Hou, Z.K.; Liu, Z.J.; Wu, T.F. Experimental study on kinetics of adsorption of CO2 and CH4 in gas-bearing shale reservoirs. Energy Fuels 2019, 34, 12587–12600. [Google Scholar] [CrossRef]
  63. Dai, J.X.; Zou, C.N.; Dong, D.Z.; Ni, Y.Y.; Wu, W.; Gong, D.Y.; Wang, Y.M.; Huang, S.P.; Huang, J.L.; Fang, C.C.; et al. Geochemical characteristics of marine and terrestrial shale gas in China. Mar. Pet. Geol. 2016, 76, 444–463. [Google Scholar] [CrossRef]
  64. Stainforth, J.G. Practical kinetic modeling of petroleum generation and expulsion. Mar. Pet. Geol. 2009, 26, 552–572. [Google Scholar] [CrossRef]
  65. Zhu, Y.N.; Shi, B.Q.; Fang, C.B. The isotopic compositions of molecular nitrogen: Implications on their origins in natural gas accumulations. Chem. Geol. 2000, 164, 321–330. [Google Scholar] [CrossRef]
  66. Whiticar, M.J. Stable isotope geochemistry of coals, humic kerogens and related natural gases. Int. J. Coal Geol. 1996, 32, 191–215. [Google Scholar] [CrossRef]
  67. Chanton, J.P. The effect of gas transport on the isotope signature of methane in wetlands. Org. Geochem. 2005, 36, 753–768. [Google Scholar] [CrossRef]
  68. Luo, S.Y.; Chen, X.H.; Liu, A.; Li, H.; Sun, C. Characteristics and geological significance of canister desorption gas from the Lower Cambrian Shuijingtuo Formation shale in Yichang area, Middle Yangtze region. Acta Petrol. Sin. 2019, 40, 941–955, (In Chinese with English abstract). [Google Scholar]
  69. Dai, J.X.; Gong, D.Y.; Ni, Y.Y.; Huang, S.P.; Wu, W. Stable carbon isotopes of coal-derived gases sourced from the Mesozoic coal measures in China. Org. Geochem. 2014, 74, 123–142. [Google Scholar] [CrossRef]
  70. Dai, J.X.; Zou, C.N.; Liao, S.M.; Dong, D.Z.; Ni, Y.Y.; Huang, W.H.; Gong, D.Y.; Huang, S.P.; Hu, G.Y. Geochemistry of the extremely high thermal maturity Longmaxi shale gas, southern Sichuan basin. Org. Geochem. 2014, 74, 3–12. [Google Scholar] [CrossRef]
  71. Bernard, B.B.; Brooks, J.M.; Sackett, W.M. Light hydrocarbons in recent Texas continental shelf and slope sediments. J. Geophys. 1978, 83, 4053–4061. [Google Scholar] [CrossRef] [Green Version]
  72. Whiticar, M.J. Carbon and hydrogen isotope systematic of microbial formation and oxidation of methane. Chem. Geol. 1999, 161, 291–314. [Google Scholar] [CrossRef]
  73. Niemann, M.; Whiticar, M. Stable isotope systematics of coalbed gas during desorption and production. Geosciences 2017, 7, 43. [Google Scholar] [CrossRef] [Green Version]
  74. Chen, M.J.; Kang, Y.L.; Zhang, T.S.; You, L.J.; Li, X.C.; Chen, Z.X.; Wu, K.L.; Yang, B. Methane diffusion in shales with multiple pore sizes at supercritical conditions. Chem. Eng. J. 2018, 334, 1455–1465. [Google Scholar] [CrossRef]
  75. Nie, H.K.; Yang, Z.H.; Dang, W.; Chen, Q.; Li, P.; Wang, R.J. Study of shale gas release from freshly drilled core samples using a real-time canister monitoring technique: Release kinetics, influencing factors, and upscaling. Energy Fuels 2020, 34, 2916–2924. [Google Scholar] [CrossRef]
  76. Bustin, R.M.; Bustin, A.; Ross, D.; Chalmers, G.; Murthy, V.; Laxmi, C.; Cui, X. Shale gas opportunities and challenges. Search Discov. Artic. 2009, 40382, 20–23. [Google Scholar]
  77. Li, D.H.; Nie, H.K. A new method to calculate shale gas content based on gas reservoir characterization—A case study of Wells JY 1 and PY 1 in Sichuan Basin and its surrounding areas. Oil Gas Geol. 2019, 40, 1324–1332, (In Chinese with English abstract). [Google Scholar]
Figure 1. Geological sketch, location, and cross-section of the Xuanhua Basin. (a) Geological sketch with sampling well location. (b) Study area location. (c) Cross-section A–A’ (modified after [37]). Q: Quaternary, Pt: Proterozoic, XHBT: Xuanhuabei thrust fault, HYST: Huangyangshan thrust fault, XHYT: Xiahuayuan thrust fault.
Minerals 11 00843 g001
Figure 2. Schematic of GOF-I field canister degassing apparatus (modified after [48]).
Minerals 11 00843 g002
Figure 3. Desorbed gas volume curve versus time during three-stage degassing experiment. Stage 1: gases released at room temperature (20 °C); stage 2: gases released at reservoir temperature (35 °C); stage 3: gases released at high tem-perature (90 °C). (a) Desorbed gas volume curve versus time during three-stage degassing experiment of sample JX29. (b) Desorbed gas volume curve versus time during three-stage degassing experiment of sample JX30. (c) Desorbed gas volume curve versus time during three-stage degassing experiment of sample JX31. (d) Desorbed gas volume curve versus time during three-stage degassing experiment of sample JX52. (e) Desorbed gas volume curve versus time during three-stage degassing experiment of sample JX59.
Minerals 11 00843 g003
Figure 4. Gas composition variation during shale gas degassing from shale core samples (gas samples 1 and 2 were collected from stage 1; gas samples 3 and 4 were collected from stage 2; gas samples 5 and 6 were collected from stage 3). All gas components were corrected to remove the effect of air. (a) Variation in methane content during shale gas degassing from shale core samples. (b) Variation in ethane content during shale gas degassing from shale core samples. (c) Variation in propane content during shale gas degassing from shale core samples. (d) Variation in carbon dioxide content during shale gas degassing from shale core samples. (e) Variation in nitrogen content during shale gas degassing from shale core samples.
Minerals 11 00843 g004
Figure 5. Molecular characteristics of shale gas generated from sapropelic source rocks and humic source rocks (all data were collected from [4,63], and our study). (a) Gas content of heavy-hydrocarbons generated from sapropelic source rocks and humic source rocks. (b) Gas content of non-hydrocarbons generated from sapropelic source rocks and humic source rocks.
Minerals 11 00843 g005
Figure 6. Carbon isotope variation of methane, ethane, and propane during degassing of five shale core samples from well ZY-1 (points 1 and 2 represent gas released at stage 1; points 3 and 4 represent gas released at stage 2; points 5 and 6 represent gas released at stage 3).
Minerals 11 00843 g006
Figure 7. Natural gas interpretative “Bernard” diagram (δ13CCH4 versus CH4/(C2H6 + C3H8)). Modified after [71,72].
Minerals 11 00843 g007
Figure 8. Comparison of fractures and microcrack development in sample JX30 (a) and sample JX52 (b) through X-ray computed tomography (CT).
Minerals 11 00843 g008
Figure 9. Variation in the values of δ 13CCH4 with D-A micropore surface area and micropore volume during shale gas degassing.
Minerals 11 00843 g009
Figure 10. Variation in the values of δ 13CCH4, D-A micropore surface area, and micropore volume with TOC during shale gas degassing. (a) Variation in the values of δ 13CCH4 with TOC during shale gas degassing. (b) Variation in the values of D-A micropore surface area, and micropore volume with TOC during shale gas degassing.
Minerals 11 00843 g010
Table 1. Molecular and carbon isotopic data of gases released in canister degassing of shale samples in well ZY-1. n.d. means not detected.
SampleDegassing StageTemperature (°C)Gas Composition (%)δ13C (‰) VPDB
CH4C2H6C3H6CO2N2CH4C2H6C3H6
JX29-112091.433.210.082.362.92−43.5−19.8n.d.
JX29-212093.643.460.091.791.03−42.8−19.5n.d.
JX29-323592.165.190.531.440.67−42.2−19.3−19.2
JX29-423587.527.523.381.020.56−41.7−18.9−19.0
JX29-539081.9410.376.480.760.45−40.6−19.5−19.3
JX29-639078.3913.986.990.320.33−39.7−18.8−18.7
JX30-112093.150.57n.d.2.653.63−44.5−21.6n.d.
JX30-212093.900.83n.d.1.913.36−43.0−21.3n.d.
JX30-323595.260.89n.d.1.552.30−42.7−21.2n.d.
JX30-423595.171.94n.d.0.692.21−42.2−20.6n.d.
JX30-539093.802.711.060.661.78−42.3−20.0−20.1
JX30-639091.974.202.210.401.22−38.8−19.9−19.5
JX31-112090.560.27n.d.4.224.95−44.7−21.2n.d.
JX31-212092.60.51n.d.3.743.14−43.5−20.7n.d.
JX31-323594.080.780.222.522.41−42.9−20.5−19.9
JX31-423593.142.470.971.641.78−42.6−20.2−19.7
JX31-539092.223.521.331.211.73−41.1−19.8−19.8
JX31-639090.314.632.870.871.32−39.5−19.4−19.7
JX52-112091.033.260.542.472.7−39.9−23.4−19.5
JX52-212091.923.671.212.081.12−39.6−23.9−20.1
JX52-323589.095.892.12.250.67−39.2−23.6−20.2
JX52-423587.28.042.931.610.21−38.8−23.6−19.8
JX52-539085.639.473.451.44n.d.−38.2−23.8−19.8
JX52-639078.4815.474.911.15n.d.−37.7−24.0−20.3
JX59-112091.960.590.223.893.35−39.3−24.2−20.9
JX59-212094.60.760.412.212.02−38.3−24.0−20.8
JX59-323595.370.990.541.781.33−37.5−23.4−20.5
JX59-423593.982.70.721.551.05−36.7−23.8−20.6
JX59-539092.823.342.051.230.57−35.5−23.7−20.3
JX59-639087.966.174.150.930.78−34.3−23.8−20.8
Table 2. TOC content, porosity, permeability, micropore characteristics, and desorbed gas content of shale core samples in well ZY-1./means not be obtained.
SampleDepth (m)Desorbed Gas Content (m3/t)TOC (wt.%)Porosity (%)Permeability (mD)D-A Micropore
Surface (m2/g)
D-A Micropore
Volume (cm3/g)
JX291022.131.745.51//37.68780.016196
JX301026.553.3115.1610.970.11653.7680.022476
JX311028.503.0310.7411.55.5442.50840.018089
JX521117.091.951.976.8178.2721.61970.009241
JX591120.952.849.14//38.56430.016072
Publisher’s Note: MDPI stays neutral with regard to jurisdictional claims in published maps and institutional affiliations.

