Article

Decoupling of Sr-Nd Isotopic Composition Induced by Potassic Alteration in the Shapinggou Porphyry Mo Deposit of the Qinling–Dabie Orogenic Belt, China

1
School of Earth and Space Sciences, University of Science and Technology of China, Hefei 230026, China
2
School of Resources and Environmental Engineering, Hefei University of Technology, Hefei 230009, China
3
Laboratory for Nanomineralogy & Environmental Material, School of Resources and Environmental Engineering, Hefei University of Technology, Hefei 230009, China
*
Author to whom correspondence should be addressed.
Minerals 2021, 11(8), 910; https://doi.org/10.3390/min11080910
Submission received: 8 July 2021 / Revised: 15 August 2021 / Accepted: 19 August 2021 / Published: 23 August 2021
(This article belongs to the Section Mineral Deposits)

Abstract

:
In our previous study on petrogenesis of quartz syenite and granite porphyry, the host rocks of the Late Mesozoic Shapinggou Mo deposit in the Qinling–Dabie orogenic belt, we found that the initial Sr isotopic composition of the host rocks is strongly affected by the degree of K-alteration. Here, we provide further isotopic evidence of the host rocks and their minerals to investigate the geochemical behaviour of trace elements and isotopes during the alteration and to explain the phenomenon of decoupling of Sr–Nd isotopic composition. The quartz syenite and granite porphyry are altered by K-alteration in varying degrees and have high K2O and Rb contents and low Na2O, CaO, Sr, and Ba contents. Rock samples of both quartz syenite and granite porphyry have variable Rb/Sr ratios and initial 87Sr/86Sr values (even < 0.70) but contain quite homogeneous εNd(t) values (−12.8 to −14.8). Minerals from the rocks of moderate to intense K-alteration have very low initial 87Sr/86Sr values (even < −17), while those from the weakly altered rocks have 87Sr/86Sr(t) values of 0.7044 to 0.7084. The same phenomenon of the decoupling in Sr–Nd isotopic composition can be observed from several Mo deposits within the eastern Qinling–Dabie orogenic belt. This fact suggests similar hydrothermal features and a comparable origin for both the magmatic rocks and hydrothermal fluids in this belt. A comparison between porphyry Mo and porphyry Cu deposits shows that elements and the Rb–Sr isotope system have different behaviours during the K-alteration, implying distinct material sources and igneous rocks for porphyry Mo and porphyry Cu deposits, respectively.

1. Introduction

Radiogenic isotopic inhomogeneity of granitoid rocks derived by crustal anatexis is commonly attributed to inhomogeneity in the source, incomplete magma mixing, assimilation and contamination, and incongruent melting [1,2]. However, in the last decade, Sr isotopic inhomogeneity of the ore-bearing granite porphyries, previously reported in several studies [3,4,5,6,7] on molybdenum (Mo) deposits within the eastern Qinling–Dabie orogenic belt, is hard to explain through the abovementioned causes, as many of them have very low initial 87Sr/86Sr values, even lower than the recommended value for Basaltic Achondrite Best Initial (0.69899) [8,9]. Yet, they have a consistent Nd isotopic composition. In contrast to the Sm–Nd isotope system hosted mainly by accessory phases (such as apatite, monazite, rutile, and titanite), the Rb–Sr isotope system is controlled dominantly by major rock-forming minerals (such as K-feldspar, plagioclase, biotite, and muscovite) [1,2]. This may cause the Sr isotopic inhomogeneity and decoupling of Sr–Nd isotopic compositions of the host rocks triggered by the exogenesis (such as hydrothermal alteration or weathering).
Potassic (K-) alteration, as a dominant alteration in porphyry Mo–, Cu–, and Cu–Mo deposits, has been widely recognised by previous studies [3,7,10,11,12,13,14]. Research on K-alteration has focused on its geologic nature, fluid source, and mineralisation [15,16,17,18,19,20,21,22]. K-alteration, mainly including K-feldspathisation and biotitisation, is strongly linked to Mo deposits [15,23].
The eastern Qinling–Dabie orogenic belt contains the largest Mo metallogenic belt (also termed as the eastern Qinling–Dabie Mo metallogenic belt) in the world and contains >8 Mt of Mo metal [7,24,25]. There are several world-class porphyry Mo deposits in this belt, including, from west to east, the Jinduicheng, Luanchuan, Yuchiling, Donggou, Qian’echong, Tangjiaping, and Shapinggou deposits [13,14,26,27,28,29,30,31,32]. Previous studies have shown common geologic and geochemical characteristics of ore-bearing granite porphyries, such as extensive K-alteration, Sr isotopic inhomogeneity, and Nd isotopic homogeneity, in, for example, the Yuchiling, Shangfanggou, Tianmugou, Tangjiaping, and Shapinggou deposits [3,12,13,14,33,34].
The Shapinggou deposit is the largest in this Mo metallogenic belt and has been studied for its geology [35], geochronology and related magmatism [7,36,37,38,39,40,41,42], rock-forming scenarios and genesis [43], fluid inclusions [25], and potassic alteration [3,43]. Ore formation occurred between 114 Ma and 111 Ma, based on ages obtained from molybdenite Re–Os dating [25,36,37,40]. It is thought that the ore formation is temporally concurrent with and spatially related to granite porphyry of ~114 Ma to ~112 Ma and quartz syenite of ~117 Ma to ~112 Ma [7,38,40], which formed in a regime of repetitive and rapid decompression [43]. The K-alteration has been widely observed within quartz syenite and granite porphyry, especially in the granite porphyry. They exhibit distinct inhomogeneity in the initial Sr isotopic composition with anomalously low initial 87Sr/86Sr ratios [3,7]. A reasonable explanation and detailed process for this phenomenon are needed, and its relationship with the Mo mineralisation remains to be clarified.
In this study, we focused on the major Mo ore-bearing intrusions, including quartz syenite, and granite porphyry, and their minerals, especially those Sr-hosting minerals, e.g., plagioclase, K-feldspar, quartz, apatite, and biotite, in the Shapinggou porphyry Mo deposit. In order to systematically characterise the nature and extent of hydrothermal alteration and evaluate the cause of anomalously low initial 87Sr/86Sr values and the nature and origin of Mo ore-forming hydrothermal fluids, geochemical and Sr–Nd isotopic data of whole rocks and minerals with various degrees of alteration are reported herein.

2. Geological Setting and the Shapinggou Porphyry Mo Deposit

The Qinling–Dabie orogenic belt (Figure 1) was formed by multiple collisions of the North China and South China blocks and later by continental subduction during the early Silurian and the late Triassic. Tectonically, this orogenic belt can be divided into the Qinling orogenic belt in the west and the Dabie orogenic belt in the east, adjacent to the Nanyang basin [27,29]. The Qinling orogenic belt is subdivided into four tectonic units, from north to south, and includes the southern margin of the North China Block, North Qinling (NQ), South Qinling (SQ), and the northern margin of the South China (or Yangtze) Block [27,29], which are divided by faults and sutures (the Luanchuan fault, the Shangdan suture, and the Mianlue suture). The Dabie orogenic belt is a fault-bound, wedge-shaped terrane between the North and South China blocks [44] and is subdivided into five tectonic units from north to south based on petrology; these units are the Beihuaiyang low-grade metamorphic zone, North Dabie UHP (ultrahigh pressure) zone, Central Dabie UHP zone, South Dabie UHP zone, and Susong high-pressure zone [25,45].
Within the eastern Qinling–Dabie orogenic belt, most of the Mo ores deposited in three pulses occurring at ~220 Ma, ~150–140 Ma, and ~130–110 Ma [27,29,46]. These Mesozoic mineralisation pulses are related to various tectonic environments: (1) in extensional tectonic settings related to the initial exhumation of deep continental subduction, (2) in back-arc extensions related to subduction of the Paleo-Pacific plate (or Izanagi), and (3) in transitional settings from transpression to extension caused by delamination of subducting slabs and thermal erosion [27,29,46].
The Shapinggou porphyry Mo deposit is located in the eastern section of the Beihuaiyang zone and northeast of the intersection between the Shangcheng–Macheng and Tongbai–Tongcheng faults [36,37] (Figure 1). The deposit is located in the centre of the ore district (Figure 2) and comprises a major part of it, with a confirmed reserve of >2 Mt Mo metal and an average grade of ~0.18% [25,35]. Vein-type Pb–Zn deposits and fluorite deposits surround the Mo deposit and are hosted by several NW-, NE-, and EW-trending faults [35,36].
Intrusive rocks of Late Mesozoic ages (termed as the Yanshanian period in the Chinese literatures) are widely distributed in the Shapinggou ore district and range compositionally from ultra-mafic (olivine pyroxenite and gabbro with cumulatic texture) to intermediate (diorite dike and quartz syenite) to felsic rocks (granodiorite, granite, granite porphyry, etc.). These intrusive rocks can be divided into two magmatic stages on the basis of spatial relationship (Figure 2 and Figure 3) and geochronological and geochemical evidence: magmatic stage I comprises granodiorite, monzogranite and granite, and minor ultra-mafic to intermediate rocks which were emplaced before ca. 120 Ma; magmatic stage II contains the major Mo ore-bearing rocks quartz syenite and granite porphyry and formed between 117 Ma and 111 Ma [43].
Previous studies have shown that the main ore bodies in the Shapinggou deposit have a bell-like morphology (Figure 3) [3]. The ore is continuously mineralised and of a high grade. Drill cores indicate that the major body of ore occurs predominantly at the top of granite porphyry and in the contact zones between granite and quartz syenite that enclose the granite porphyry [3]. The high-grade ore is situated in the inner contact zone, and low-grade ore bodies occur in granite and quartz syenite at a substantial distance from the contact zone.
The quartz syenite and granite porphyry formed between 117 Ma and 111 Ma and play a key role in mineralisation [7,40]. They underwent hydrothermal alteration of different types [43], including silicification, K-alteration (K-feldspathisation with minor biotitisation), pyritization-sericitisation-silicification (PSS), and chloritisation. The hydrothermal alteration is strongly developed within the deposit and can be divided into three zones, outwards from the granite porphyry: silicification, K-feldspathisation, and PSS zone. Weak chloritisation zones are also randomly distributed. Spatial relationships between the ore body and the alteration zones indicate that the Mo mineralisation is closely related to the K-feldspathisation and the PSS (Figure 3). Ore-bearing quartz syenite exhibits silicification, K-feldspathisation, biotitisation, PSS, and partially chloritisation. Most of the alterations within the ore-barren quartz syenite are weakly developed, whereas the ore-bearing rocks show moderate K-feldspathisation and biotitisation or distinct PSS.
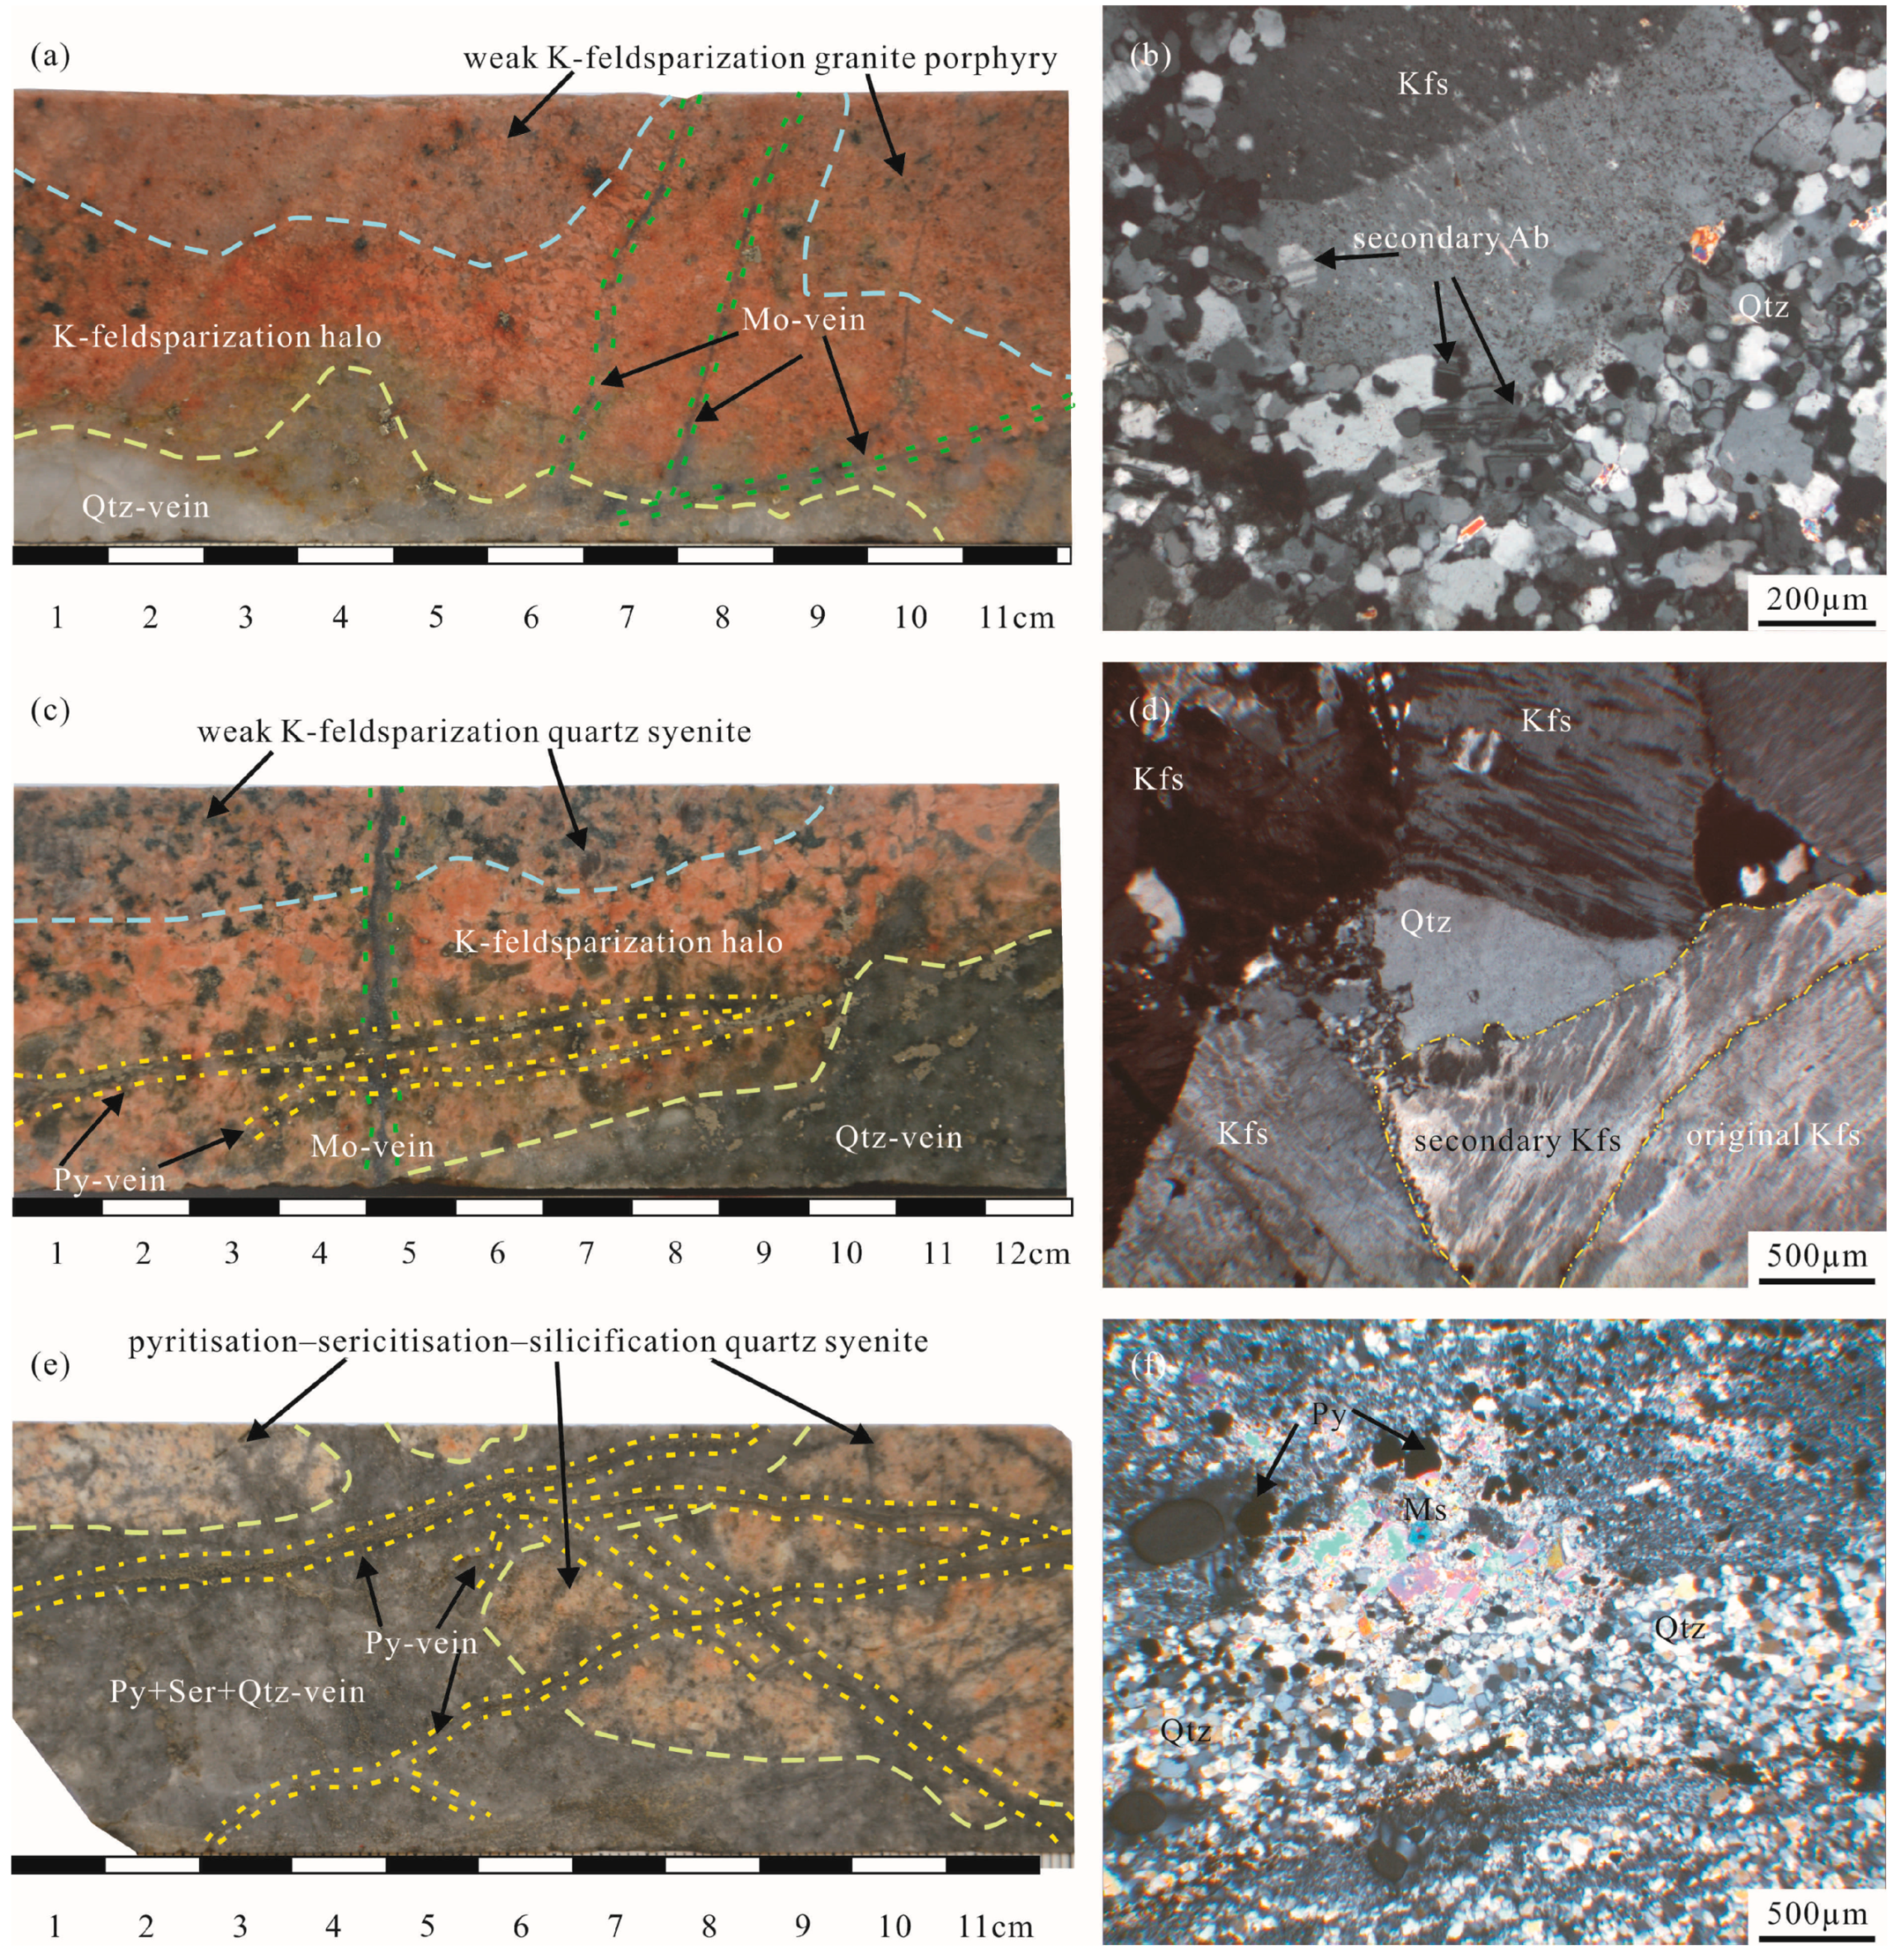
The Shapinggou granite porphyry is a small intrusive stock intruding into the quartz syenite and exhibits considerable alterations, including silicification, K-feldspathisation, and PSS [3]. In hand specimens (Figure 4a,c), K-feldspathisation exhibits a K-feldsparisation halo (darker fleshy red) in the contact zone between rock and hydrothermal veins. Correspondingly, K-feldspathisation can be identified by secondary enlargement of the original K-feldspar (Figure 4d) or by plagioclase replaced by K-feldspar, with fine-grained and vermicular quartz and recrystallised albite around the edges of K-feldspar grains (Figure 4b) under the polarizing microscope. The K-feldspathisation of deeply placed granite porphyry is stronger than that at shallower depths because the latter is overprinted by the PSS, which can be recognised by their alteration mineral assembly of pyrite, sericite (or muscovite), and quartz (Figure 4e,f).

3. Geochemistry and Sr-Nd Isotopic Compositions

3.1. Samples and Analytical Methods

The samples of quartz syenite and granite porphyry analysed were collected from seven drill holes in the deposit area. Twelve samples of quartz syenite are fresh to weakly altered rocks. Eighteen samples of granite porphyry show different degrees from weak to intense K-alteration.
Whole rock powder is obtained by grinding more than 5 kg of rock. Minerals are handpicked under a binocular microscope and crushed in agate mortar to approximately 200 mesh. Major element analyses of whole rock are performed by the Australian Laboratory Services Chemex in Guangzhou, China. Major element compositions are determined using a PANalytical Axios X-ray fluorescence (XRF) spectrometer made in Holland. The analytical conditions of the XRF were 50 kV voltage and 50 mA current. Loss on ignition (LOI) is determined by gravimetric method, that is, weighing 1 g sample powder heated to 1100 °C for 1 hour. Analytical uncertainties of major elements are better than 1%. Trace elements of whole rocks and minerals are determined by a Perkin-Elmer ELAN 6100 DRC II ICP-MS located at the University of Science and Technology of China (USTC). According to the analyses of Chinese and United States Geological Survey (USGS) geochemical reference standards GSR-1, AGV-2, and BHVO-2, the relative deviation of accuracy is better than 5% for most elements and about 10% for Rb, Zr, and Hf. Details of the analytical techniques are available elsewhere [47]. Sr and Nd isotopic compositions of whole rocks and rock-forming minerals are measured on a Finnigan MAT-262 thermal ionisation mass spectrometer located in the Laboratory for Radiogenic Isotope Geochemistry at the USTC. Approximately 200 mg of rock or mineral powder is dissolved by a HF–HNO3–HClO4 acid solution for more than 5 days. Rb–Sr and Sm–Nd are separated on quartz columns by ion-exchange chromatography. NIST SRM 987 and La Jolla standard solution are used as standard for Sr and Nd analyses, respectively. More details on chemical processes and analytical techniques are available elsewhere [48,49].

3.2. Major and Trace Elemental Geochemistry

The major element contents of whole-rock samples are given in Table S1. Quartz syenite and granite porphyry are characterised by high SiO2 and K2O contents, low CaO and Na2O contents, high K2O/Na2O ratios, high differentiation index values (DI; the sum of the mass percentages of quartz, orthoclase, albite, nepheline, leucite, and kalsilite; 90.36–94.55 and 96.39–99.20, respectively), and low molar Al2O3/(CaO+Na2O+K2O) ratio (A/CNK) values, suggesting that they belong to the shoshonite (SHO) series and are metaluminous to weakly peraluminous. Generally, porphyry granites of the Shapinggou Mo deposit with moderate or intense K-alteration exhibited higher SiO2 and K2O contents but lower Na2O and CaO contents than those with weak K-alteration.
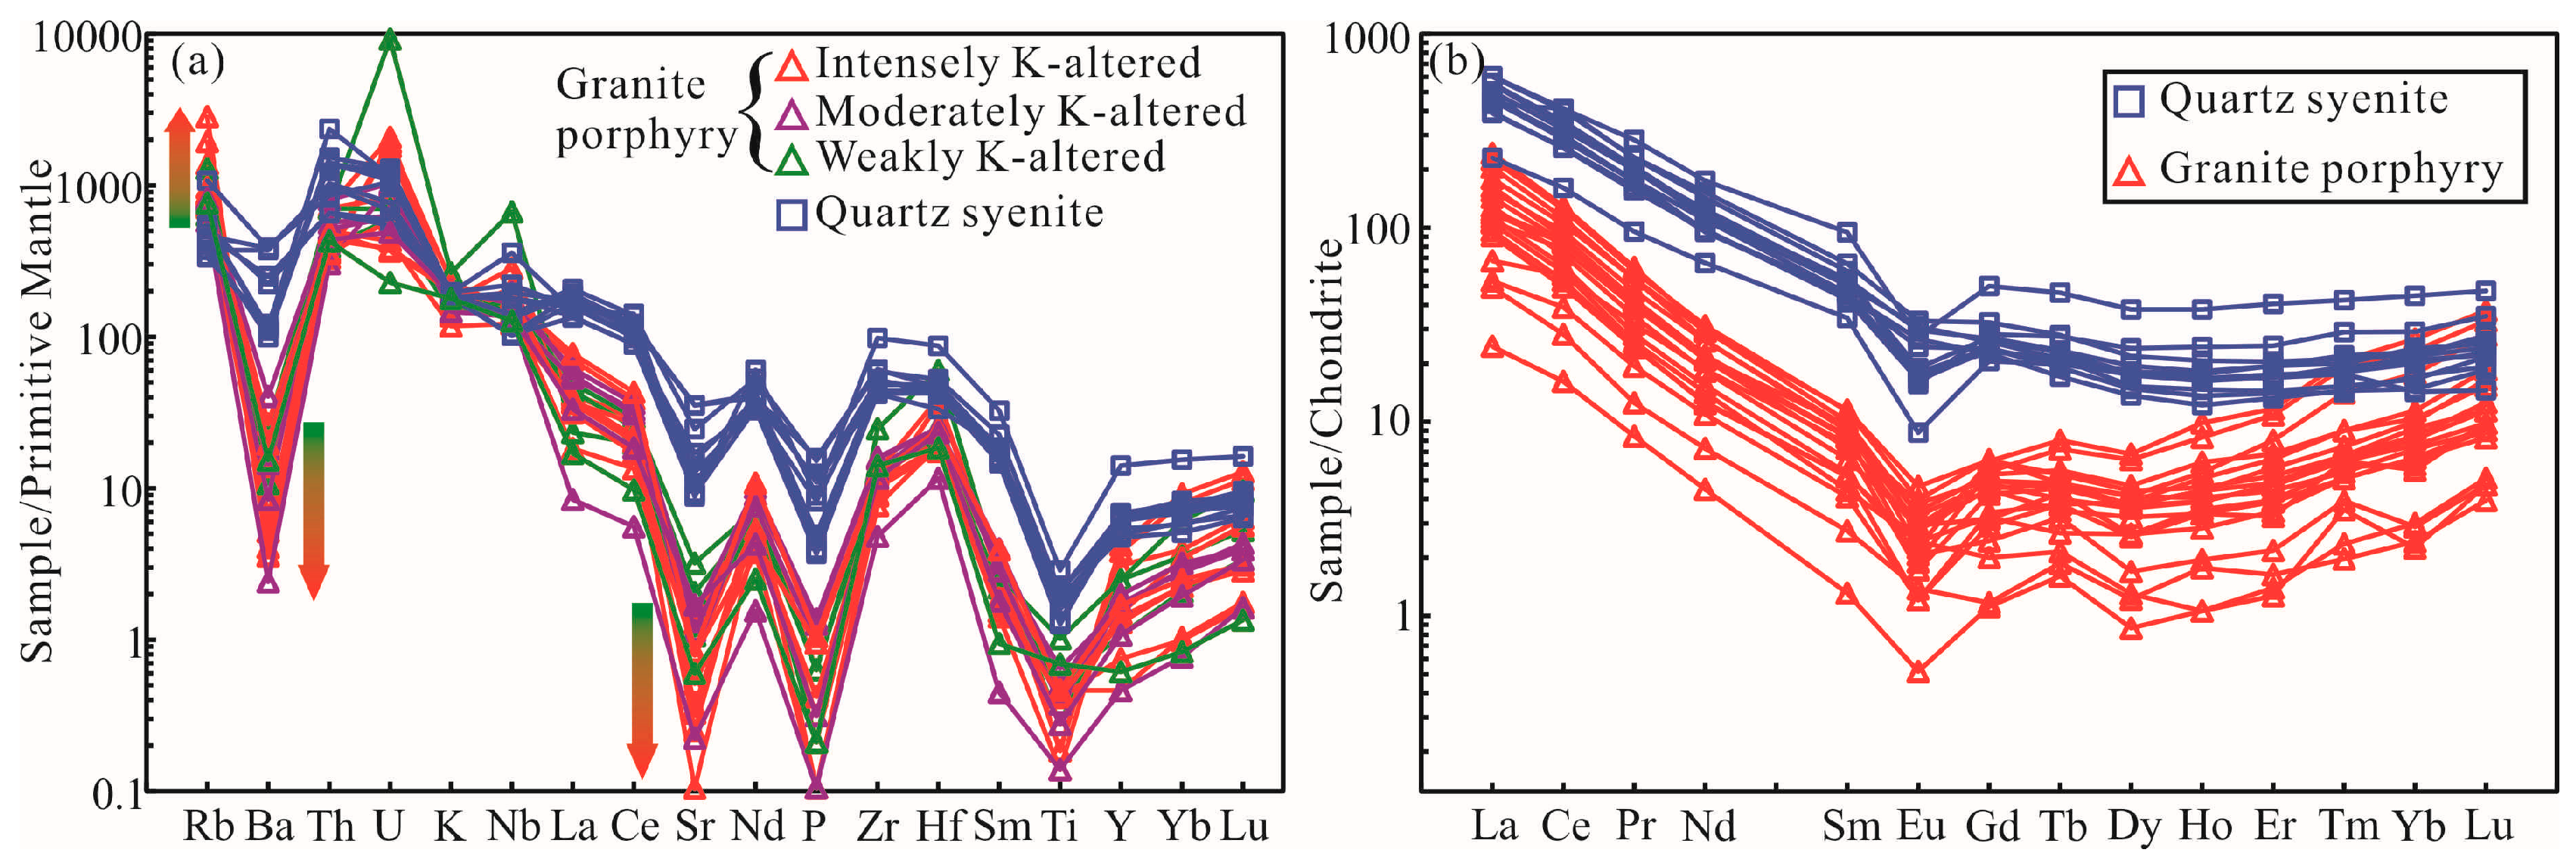
The trace element contents of whole rocks are given in Table S2 and are plotted in a primitive mantle-normalised spider diagram (Figure 5a). The quartz syenite and granite porphyry shared consistent geochemical features regarding trace elements. Both are depleted in large ion lithophile elements (LILEs; e.g., Ba and Sr), P and Ti; enriched in Rb and high field-strength elements (HFSEs; e.g., Th and U); and weakly enriched in Ta, Nb, Zr, and Hf. Increasing intensity of K-alteration is accompanied by increasing concentrations of Rb and K and decreasing Ba and Sr contents (Figure 5a). Both the quartz syenite and granite porphyry had similar rare earth element (REE) patterns (Figure 5b; data in Table S3), showing strong enrichment in LREEs (La–Nd), depletion in MREEs (Sm–Ho), weak enrichment in HREEs (Er–Lu and Y), and consistently moderate negative Eu anomalies. Granite porphyry samples have lower contents of total REEs and stronger MREE depletion than those of quartz syenite, implying that it is highly differentiated and evolved. This observation is also consistent with their differentiation index values.
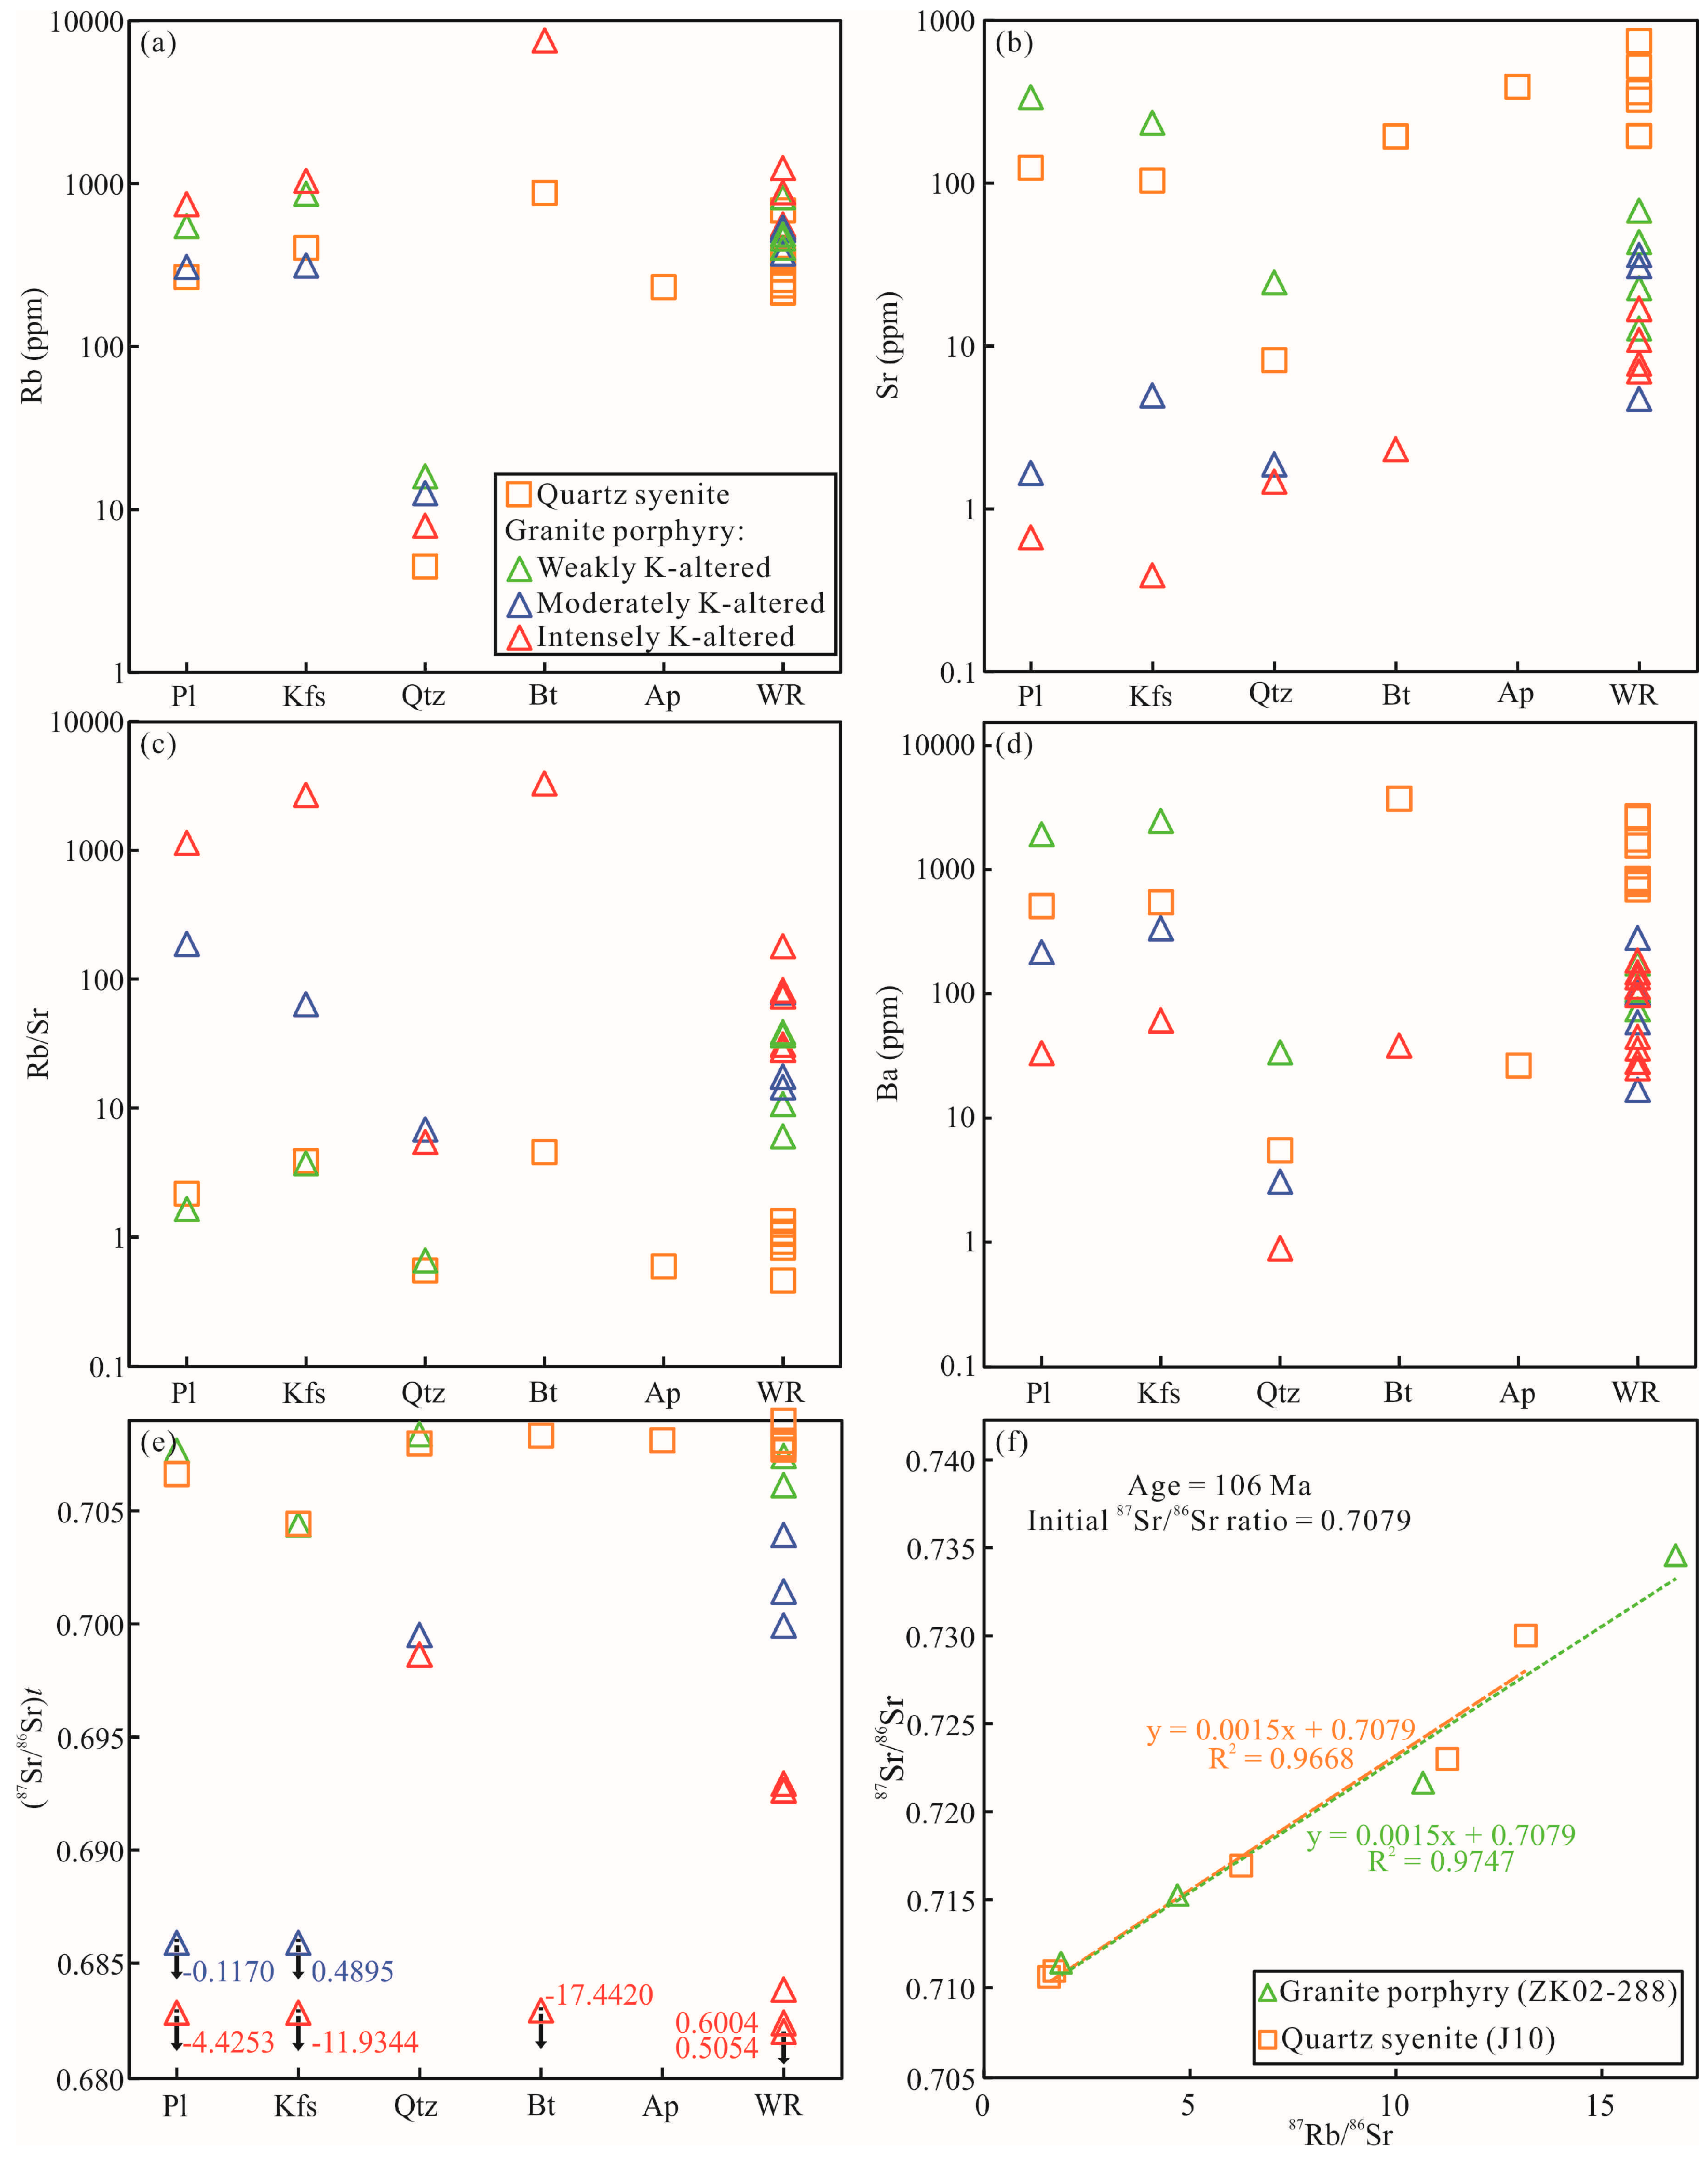
Rb contents of K-feldspar, plagioclase, quartz, and biotite increase an order of magnitude with increasing K-alteration degree, but rocks that have intense K-alteration have lower Sr contents and Rb/Sr ratios than weakly altered rocks by one to three orders of magnitude, and Ba contents are lower by two orders of magnitude (Figure 6a–d).

3.3. Sr-Nd Isotopic Composition

Rb-Sr and Sm-Nd isotopic data of whole-rock samples are given in Table S4. Rb and Sr contents of quartz syenite samples are 215–682 ppm and 194–746 ppm, respectively. Sm and Nd contents of these samples range from 6.52 to 10.0 ppm and 44.4 to 71.2 ppm, respectively. Measured 87Sr/86Sr and 143Nd/144Nd ratios range from 0.710213 to 0.713900 and from 0.511854 to 0.511899, respectively. Initial 87Sr/86Sr ratios and initial εNd values of quartz syenite, calculated back to 116 Ma, vary from 0.7077 to 0.7090 and from −13.9 to −12.8, respectively. Two-stage depleted mantle Nd model ages (TDM2) vary from 2040 Ma to 1957 Ma. Rb and Sr contents of granite porphyry samples are 368–1230 ppm and 4.70–67.4 ppm, respectively, while Sm and Nd contents are 0.20–1.76 ppm and 2.1–13.7 ppm, respectively. Measured 87Sr/86Sr ratios range from 0.734581 to 1.321131 and 143Nd/144Nd ratios from 0.511792 to 0.511862. Initial 87Sr/86Sr ratios and initial εNd values of granite porphyry samples, calculated back to 114 Ma, vary from 0.5054 to 0.7094 and from −14.8 to −13.3, respectively. Their TDM2 values range from 2116 Ma to 1992 Ma.
Rb–Sr isotopic data of minerals (plagioclase, K-feldspar, quartz, apatite, and biotite) of the rocks with different alteration degrees are given in Table S5. Measured 87Sr/86Sr values of minerals from quartz syenite and weakly K-altered granite porphyry range from 0.710925 to 0.730017 and from 0.711408 to 0.721633, respectively. Their initial 87Sr/86Sr values vary from 0.7044 to 0.7083 and from 0.7044 to 0.7084, respectively. Measured 87Sr/86Sr values of minerals in moderately K-altered granite porphyry range from 0.731097 to 0.789201, and initial 87Sr/86Sr values are −0.1170 to 0.6995. Measured 87Sr/86Sr values of minerals within intensely K-altered granite porphyry ranged from 0.723829 to 6.279480, and initial 87Sr/86Sr ratios are −17.442 to 0.6986.

4. Discussion

4.1. Cause for Anomalously Low Initial 87Sr/86Sr Values

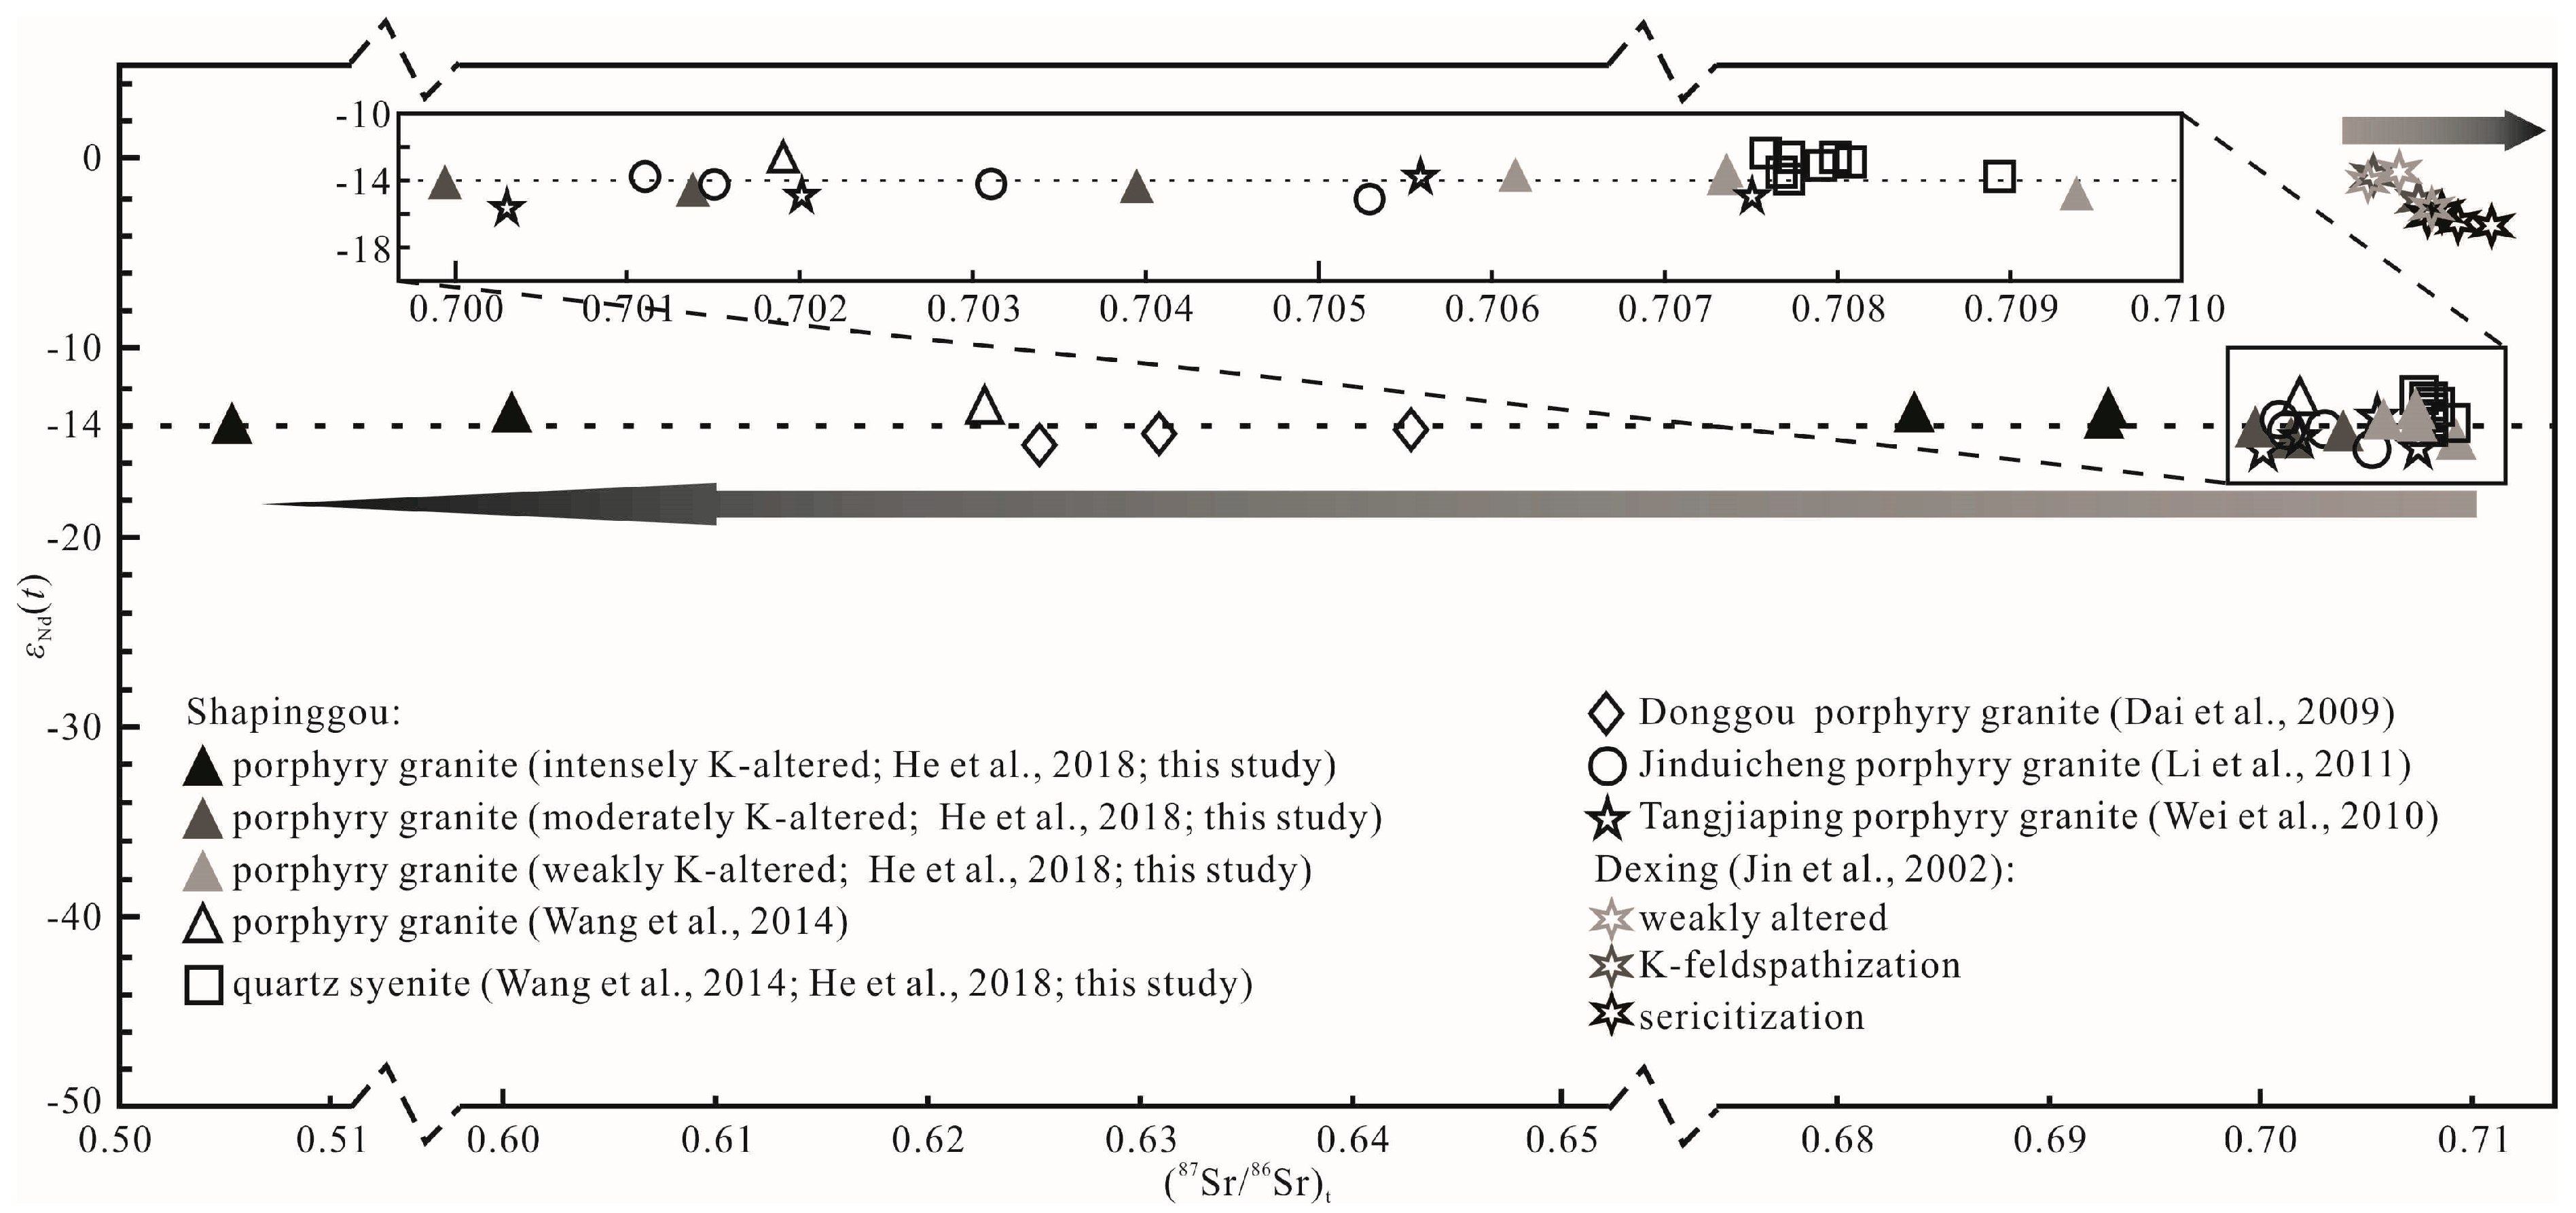
As noted above, intrusive rocks of magmatic stage II in the Shapinggou Mo deposit, including quartz syenite and granite porphyry, are strongly linked to mineralisation. Four lines of evidence are used to evaluate the magmatic origin of these ore-related rocks: (1) close cooling ages and geographic relationships; (2) uniform composition of major elements and trace and rare earth elements; (3) consistent Nd–Hf isotopic compositions, which are notably different from those of intrusive rocks of magmatic stage I [7]; and (4) similar whole-rock initial 87Sr/86Sr values (Figure 7) and identical Rb–Sr isochrons (Figure 6f) between quartz syenite and weakly K-altered granite porphyry (ranging from 0.7077 to 0.7090 with a mean value of 0.7080 and from 0.7061 to 0.7094 with a mean value of 0.7076, respectively). Hence, it can be concluded that the magma of both quartz syenite and granite porphyry were derived from a similar source (or sources). The genetic relationship between quartz syenite and granite porphyry implies that they should have uniform initial 87Sr/86Sr values; however, this does not appear to be supported by the scattered and very low initial 87Sr/86Sr values obtained for granite porphyry with moderate to strong K-alteration.
On a larger scale, ore-bearing granite porphyries in the eastern Qinling–Dabie Mo belt are characterised by uniformly high concentrations of Si, K, and Rb, but low concentrations of Na, Ca, and Sr, and underwent alteration by K-rich hydrothermal fluids [3,4,5,9,27,29,46,51,52]. When the Sr–Nd isotopic data of the porphyry rocks from several typical deposits in the eastern Qinling–Dabie Mo belt are plotted on the εNd(t) versus (87Sr/86Sr)t diagram (Figure 7), all the rocks noticeably have similar εNd(t) values (approximately −14; Figure 7) but scattered initial 87Sr/86Sr values. The similarity in initial εNd values implies that all the porphyry bodies, related to the Mo mineralisation in this belt, are derived by melting of the same material sources.
Quartz syenite and granite porphyry in the Shapinggou Mo deposit have high concentrations of SiO2, K2O, and Rb and low concentrations of CaO, Na2O, and Sr [3,7,39,40], especially moderately and intensely K-altered rocks. When the geochemical data of whole rocks are plotted on a covariance plot for different compounds, such as SiO2, Na2O, CaO, and Sr, decreasing Na2O and CaO contents are correlated with increasing SiO2 contents, and decreasing Sr contents are correlated with decreasing CaO contents (Figure 8a–d). In the major rock-forming minerals, Rb contents and Rb/Sr ratios are increasing appreciably with increasing K-alteration; at the same time, Sr, Ba, and Pb contents are drastically diminishing (Figure 6a–d). These correlations suggest that extra Si, K, and Rb were added, and Ca, Na, Sr, and Ba were removed from the rocks during the fluid–rock interactions. The following fluid–rock reactions have been suggested to illustrate the progression of the process [54]: K+ replaces Na+ and Ca2+ during K-feldspathisation from albite and anorthite (Equations (1) and (2) below), followed by Na+ and Ca2+ being driven into the hydrothermal fluids. Owing to extensive isomorphism between K–Rb and Na–Sr, Rb moves in, whilst Sr is scavenged from rocks with the K-alteration overprint:
NaAlSi3O8 (albite) + K+ → KAlSi3O8 (K-feldspar) + Na+
3CaAl2Si2O8 (anorthite) + 2K+ →2KAlSi3O8 (K-feldspar) + 2Al2O3 + 2CaO + Ca2+
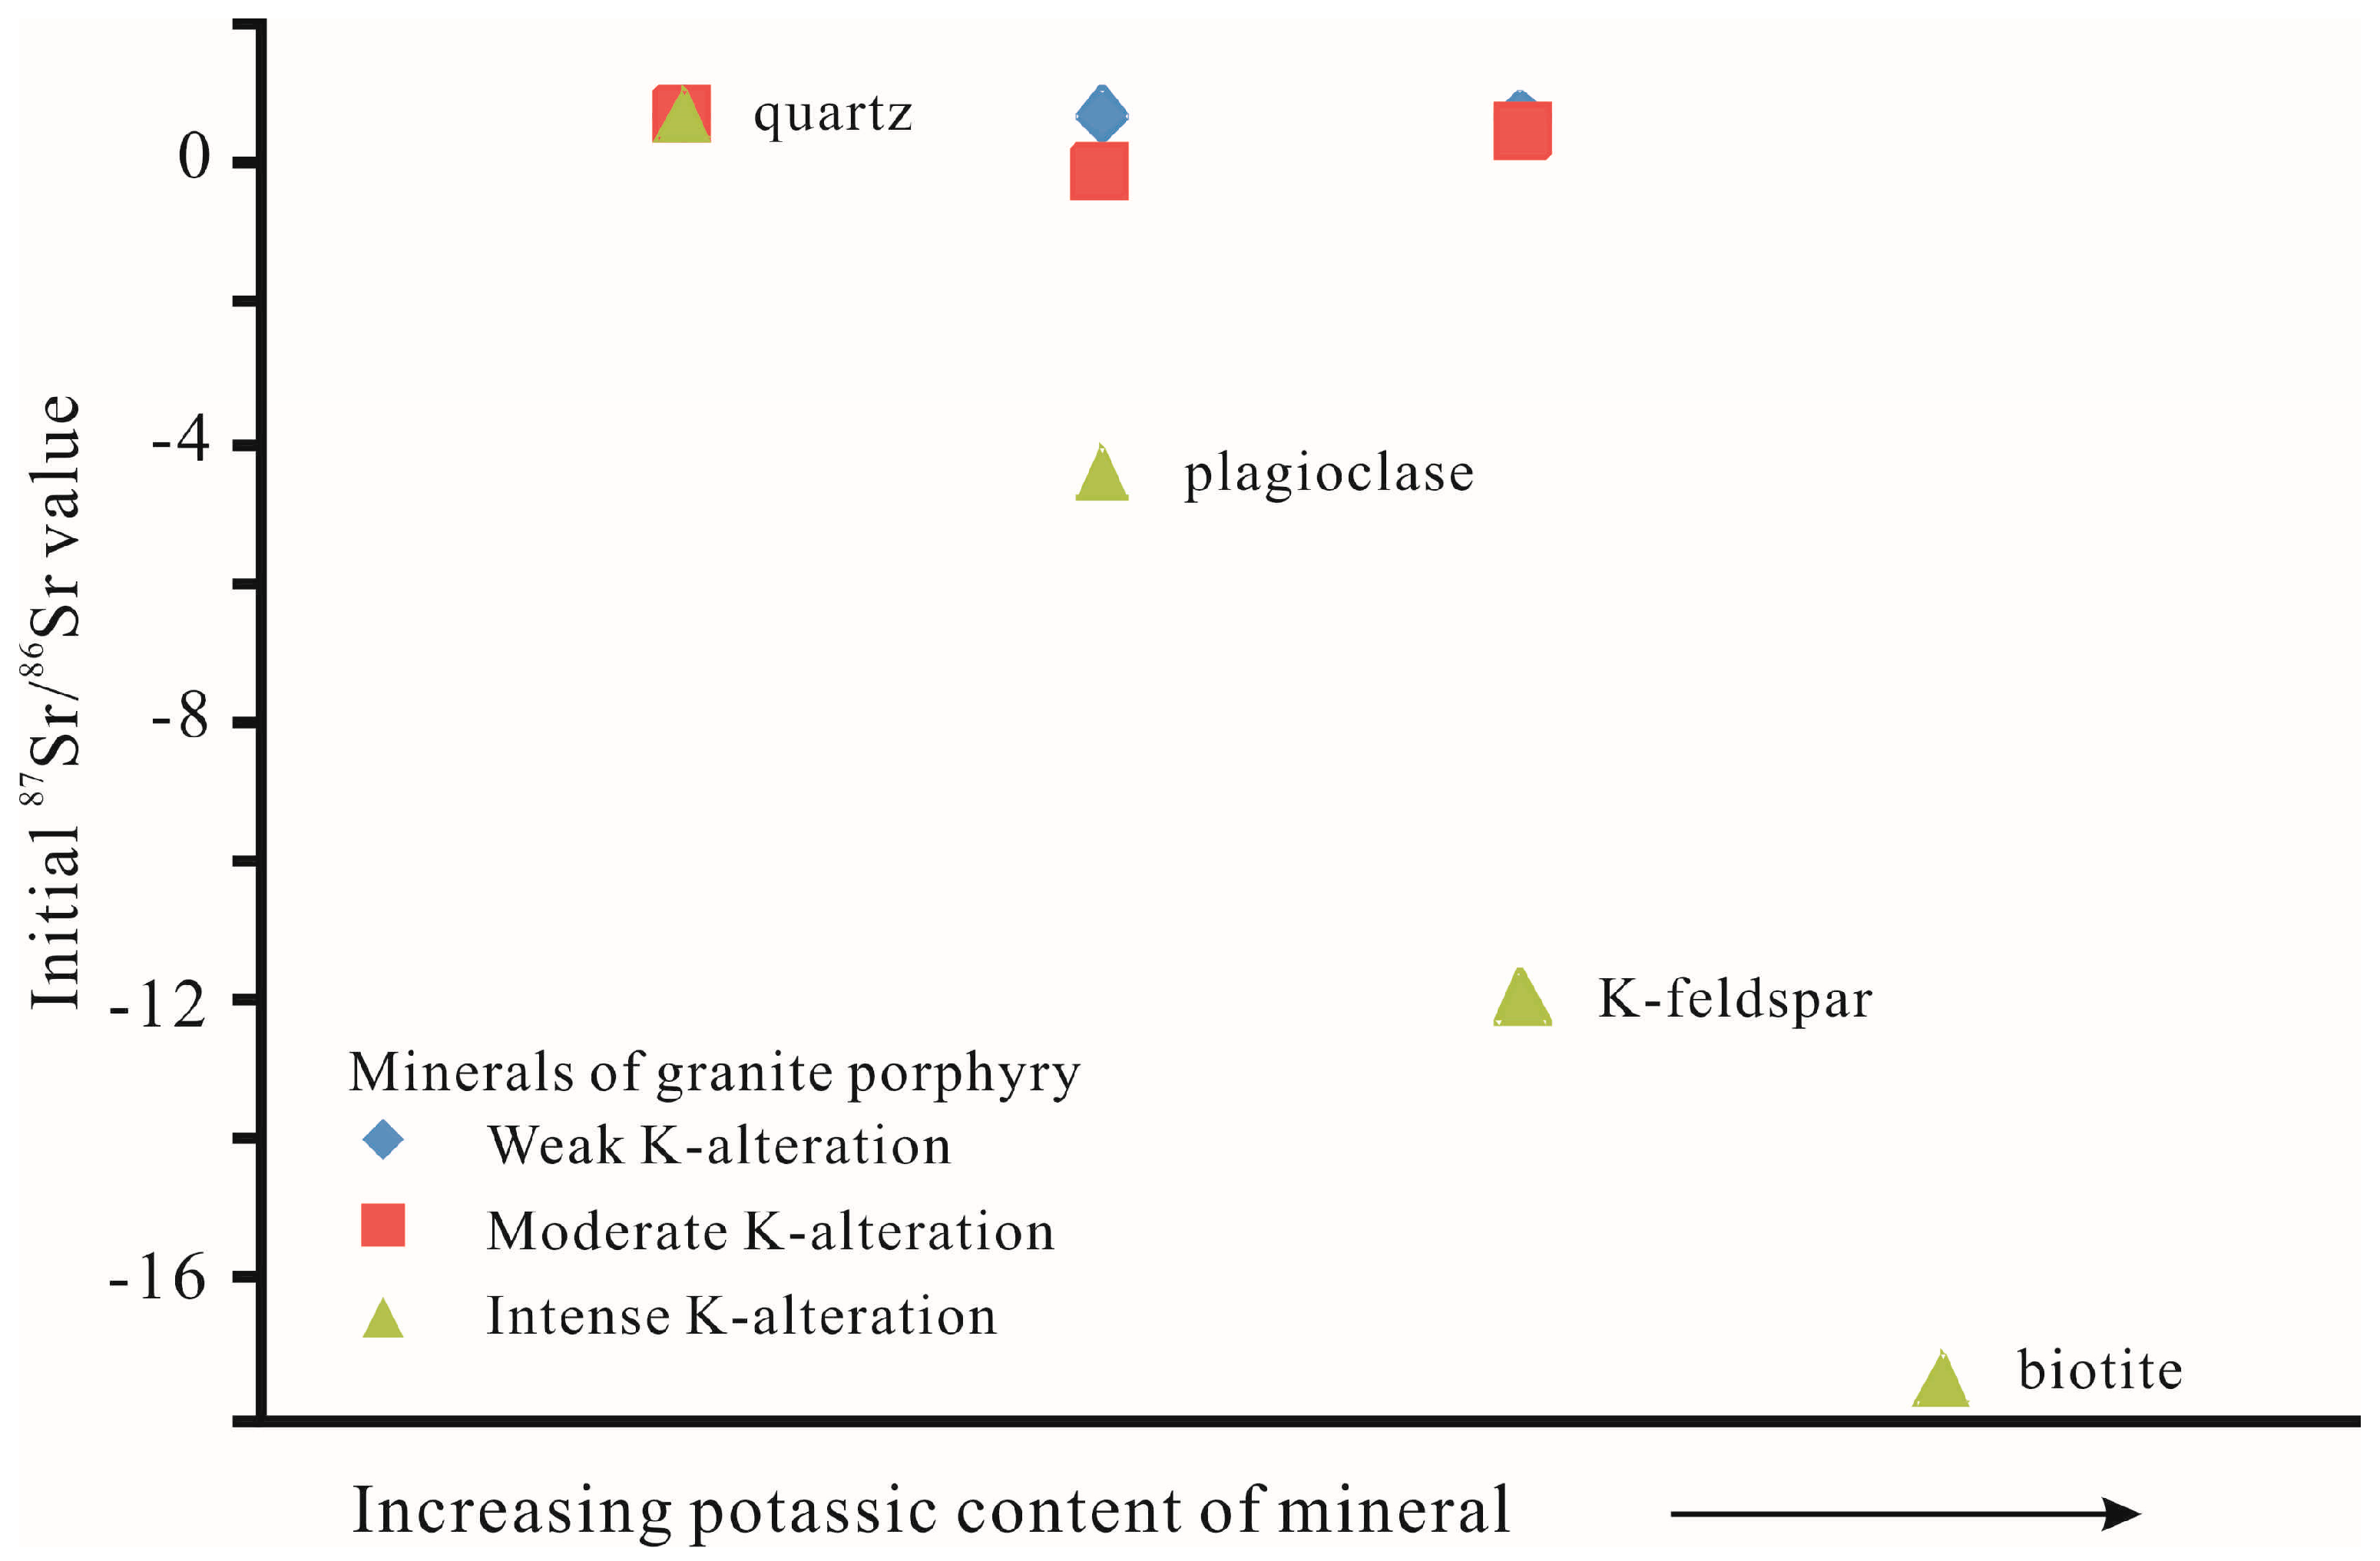
Minerals from quartz syenite and weakly K-altered granite porphyry have similar concentrations of Rb, Sr, and Ba and Rb/Sr ratios (Figure 6a–d). They fall on an isotopic isochron and have similar initial 87Sr/86Sr values (Figure 6e,f). From granite porphyry samples, it can be observed that Sr and Ba contents decrease much more remarkably (by 1–3 orders of magnitude) with increasing their alteration degrees (from weak to intense), compared to the increasing range of Rb contents (by 1 order of magnitude). Moderately and intensely K-altered granite porphyry rocks of the Shapinggou Mo deposit have much lower initial 87Sr/86Sr values than weakly K-altered rocks and are characterised by a large scatter of initial values from 0.505396 to 0.709385 (Figure 7 and Figure 8f), and their minerals have very low initial 87Sr/86Sr values, especially for biotite, K-feldspar, and plagioclase (up to −17.4, −11.9, and −4.4). The minerals and the stronger K-altered rocks have higher K contents and lower initial 87Sr/86Sr values (Figure 9). Such occurrences are not observed in quartz syenite, but both quartz syenite and granite porphyry have almost coincident Nd–Hf isotopic compositions (Figure 8e,f). Thus, this difference in Sr isotopic composition between quartz syenite and granite porphyry of the Shapinggou Mo deposit is most likely related to the K-alteration rather than to different magmatic origins.
Anomalously low and scattered initial 87Sr/86Sr values, but uniform initial 143Nd/144Nd values for ore-bearing granite porphyries of many porphyry Mo deposits in the eastern Qinling–Dabie belt, such as the Jinduicheng, Donggou, Tangjiaping, and Shapinggou deposits, have been reported in previous studies [3,4,5,6,7]. Several conditions can cause anomalously low initial 87Sr/86Sr values of altered rocks: (1) large amounts of Rb from K-rich hydrothermal fluids might result in strong isobaric interference on 87Sr during the analysis [55,56] (this situation, however, is unlikely to occur because of the ionising method of thermal ionisation mass spectrometer); (2) the process of scavenging Sr into fluids from the porphyry body during fluid–rock interactions might lead to fractionation of 87Sr, and it has been suggested that the diffusion of Sr in feldspar under hydrous conditions is an order of magnitude faster than under anhydrous conditions [57,58]; and (3) abnormally low initial 87Sr/86Sr values could result from an over-deduction of radiogenic 87Sr due to additional Rb if the K-alteration occurred several million years later than the formation of granite porphyry.
Previous studies have confirmed that the K-alteration is widespread and is correlated with the main episodes of Mo mineralisation in the eastern Qinling–Dabie orogenic belt; it was often observed in the Yuchiling, Shangfanggou, Tianmugou, Tangjiaping, and Shapinggou Mo deposits [12,13,14,33,34]. Figure 7 shows that the porphyry bodies from representative porphyry Mo deposits, such as the Jinduicheng, Donggou, and Tangjiaping Mo deposits, have scattered and shows low initial 87Sr/86Sr values, similar to the granite porphyry of the Shapinggou Mo deposit. The crust-mantle mixture was suggested to explain low initial 87Sr/86Sr values (0.701 to 0.705) obtained for the Jinduicheng granite porphyry [6]. However, this suggestion is a misstatement or oversimplification, as initial 87Sr/86Sr values cannot be used as an isotopic tracer for assessing magmatic origin in this situation. The Rb-Sr isotopic system is readily affected by fluid infiltration and thermal events because both elements are mobile [57]. In contrast, the solubility of Sm and Nd is too low to be mobile in fluids, and they often concentrate in accessory minerals, such as monazite and apatite, which are geochemically inert in fluid activity [2,53,59,60]. Thus, K-alteration can significantly alter the Rb–Sr isotopic system, whereas the Sm–Nd system is insensitive to alteration and can be a reliable indicator for tracing magma sources (Figure 8e,f).

4.2. Consequences of K-Alteration for Porphyry Mo and Cu Deposits

An experimental study of Mo geochemical behaviour suggested that Mo prefers alkaline fluids for extraction, dissolution, and migration but acidic fluids for precipitation [61]. According to the spatial relationships between the Shapinggou ore bodies and alteration zones (Figure 3) and studies on fluid inclusion [25], the main ore bodies occur predominantly at the top of the K-feldspathisation zone and in the overlapping region with the PSS zone. This finding indicates that the main Mo mineralisation or precipitation from fluids began in the later stage of the K-feldspathisation to the PSS, in which fluid boiling and CO2 separation occurred [25]. Previous studies [15,54,62] have reported that fluids causing K-feldspathisation are alkaline in composition, but those causing PSS are acidic; thus, it can be inferred that the Mo precipitation is triggered by the pH value in the fluid changing from alkaline to acidic. Thus, it can be proposed that the CO2 separation from fluids during the K-feldspathisation and PSS stages might alter the alkaline–acid balance and trigger Mo precipitation owing to the variable solubility of Mo at different pH values. It has been reported that the rock- and ore-forming processes occurred under a decompression mechanism, likely triggering CO2 separation from original fluids [43].
Previous studies have paid extensive attention to tectonic setting, ore deposit geology, magma and fluid evolution, metallogenic material sources and genesis, and metallogenic specialisation of porphyry deposits [9,12,13,27,29,47,63,64,65,66,67,68,69,70,71,72,73]. In the present study, we take the Dexing porphyry Cu deposit in Jiangxi Province and the Shapinggou porphyry Mo deposit as representative examples for a comparison to evaluate different outcomes of hydrothermal alteration by fluids.
In porphyry Cu deposits, it has been documented that metallogenic material (such as metals, sulphur, and fluids) can be provided by mafic magmas [72,73,74]. However, metallogenic materials still remain debated in porphyry Mo deposits. Porphyry Cu deposits are considered to have a close genetic relationship with adakite due to its high oxygen fugacity (fO2) and high contents of sulphur and H2O [64,70,75,76]. High fO2 and high contents of sulphur and H2O can contribute to destroying the saturated sulphide in magma sources and release metal and S to initial magma. The metal content increases in early-stage magma due to the high solubility of sulphur and high partition coefficient of Cu (chalcophile elements) between sulphide and silicate. Metal precipitates and porphyry Cu mineralisation forms accompanied sulphate reduction and a corresponding decrease in pH value [70,75,76]. However, the oxygen fugacity of a pure porphyry Mo deposit is hard to predict because limited indicator minerals for redox state have been reported, such as magnetite and hematite for oxidised state or pyrrhotite for reduced state.
Compared to porphyry Mo deposits, such as the Shapinggou deposit mentioned above, porphyry Cu deposits, represented by the Dexing porphyry Cu deposit, have different characteristics in Sr isotopic composition during the K-alteration. Extensively altered rocks associated with the Dexing porphyry Cu deposit have higher Rb and lower Sr concentrations (ranging from 101 to 102 ppm and from 103 to 101 ppm, respectively) and higher Rb/Sr ratios (ranging from 10−1 to 101; Figure 8) [53] but slightly higher initial 87Sr/86Sr values (ranging from 0.705 to 0.711; Figure 8e,f) [53] than unaltered rocks from the same rock unit. This implies that hydrothermal fluid introduced additional Rb and removed minor Sr from the igneous rocks. The difference between porphyry Cu and Mo deposits can be explained by the following two factors. Firstly, fresh igneous rocks associated with the porphyry Cu and porphyry Mo deposits have different geochemical compositions. Porphyry bodies related to porphyry Mo deposits are characterised by relatively high K and Rb concentrations and low Ca and Sr concentrations and are of an A-type granite composition (e.g., granite porphyry). In contrast, porphyry rocks related to porphyry Cu deposits are normally of adakitic composition (e.g., granodiorite porphyry or quartz monzonite porphyry): for example, porphyry rocks in the Dexing porphyry Cu deposit [10,42]. These rocks have high Ca and Sr concentrations, and as a result, their Rb/Sr ratios increase much less than those of the granite porphyry related to a Mo deposit after K-alteration by hydrothermal fluids. Secondly, the origin and geochemical composition of the hydrothermal fluids in the alteration can differ substantially between porphyry Cu and Mo deposits, which can be reflected in different types of alterations; the K-feldspathisation is the predominant alteration in porphyry Mo deposits but not in porphyry Cu deposits. Fluids in the Dexing porphyry Cu deposit contain less K and more Ca than those in the Shapinggou porphyry Mo deposit. Furthermore, the varieties in geochemistry and Re contents of molybdenite minerals from the porphyry Cu and Mo deposits in South Qinling and the southern margin of North China [9] also seem to support the above-mentioned interpretation.

5. Conclusions

Extremely anomalous Sr isotopic compositions, observed in granite porphyry rocks associated with the Late Mesozoic Shapinggou porphyry Mo deposit and their minerals, especially biotite and K-feldspar of high potassic contents, were caused mainly by extensive alteration of K-rich fluids. This explanation may hold for other Late Mesozoic porphyry Mo deposits in the eastern Qinling–Dabie orogenic belt.
Decoupling of Sr-Nd isotopic compositions provides evidence to determine geochemical features or the origin of hydrothermal fluids that have flushed porphyry rocks related to the Mo deposits. On the other hand, caution must be taken when using Sr isotopic composition as a tracer to assess the magmatic origin of porphyry rocks, particularly for those undergoing strong K-alteration by fluids.
Porphyry Mo and Cu deposits show distinguishable behaviours of trace elements and the Rb–Sr isotope system during the alteration of hydrothermal fluid, likely owing to differences in magma origins, hydrothermal alteration types, and rock-/ore-forming materials.

Supplementary Materials

The following are available online at https://www.mdpi.com/article/10.3390/min11080910/s1, Table S1: Major element contents of quartz syenite and granite porphyry in the Shapinggou porphyry Mo deposit, Table S2: Trace element contents of quartz syenite and granite porphyry, Table S3: Rare earth element contents of quartz syenite and granite porphyry, Table S4: Whole rock Sr-Nd isotopic composition of quartz syenite and granite porphyry, Table S5: Trace element contents and Sr isotopic composition of minerals from quartz syenite and granite porphyry.

Author Contributions

X.X. and J.H. designed the study. J.H. and F.C. co-wrote the manuscript. J.H., Z.F., Y.A., T.C. and Q.X. carried out the field work and the analyses. All authors have read and agreed to the published version of the manuscript.

Funding

This study was funded by the National Natural Science Foundation of China (NSFC) (Grant No. 41172085), the National Key R&D Program of China (Grant No. 2016YFC0600404), the China Geological Survey (Grant No. 12120114028401), and the Fundamental Research Funds for the Central Universities (Grant No. WK2080000117).

Acknowledgments

Thanks are due to colleagues from No. 313 Geological Division of the Anhui Bureau of Geology and Mineral Exploration for assistance during field work. Sincere thanks are due to the two anonymous reviewers for their constructive comments.

Conflicts of Interest

The authors declare no conflict of interest.

References

  1. Zeng, L.S.; Saleeby, J.B.; Ducea, M. Geochemical characteristics of crustal anatexis during the formation of migmatite at the Southern Sierra Nevada, California. Contrib. Mineral. Petrol. 2005, 150, 386–402. [Google Scholar] [CrossRef]
  2. Zeng, L.S.; Asimow, P.D.; Saleeby, J.B. Coupling of anatectic reactions and dissolution of accessory phases and the Sr and Nd isotope systematics of anatectic melts from a metasedimentary source. Geochim. Cosmochim. Acta 2005, 69, 3671–3682. [Google Scholar] [CrossRef]
  3. He, J.; Xu, X.C.; Wang, P.; Fan, Z.L.; Fu, Z.Y.; Wang, B.H.; Zhuang, H.D.; Xie, Q.Q. Potassic metasomatism of ore-bearing igneous rocks and response from trace elements and Sr-Nd isotopes in Shapinggou porphyry Mo deposit, Anhui Province. Miner. Depos. 2018, 37, 611–629. [Google Scholar]
  4. Dai, B.Z.; Jiang, S.Y.; Wang, X.L. Petrogenesis of the granitic porphyry related to the giant molybdenum deposit in Donggou, Henan province, China: Constraints from petrogeochemistry, zircon U-Pb chronology and Sr-Nd-Hf isotopes. Acta Petrol. Sin. 2009, 25, 2889–2901. [Google Scholar]
  5. Wei, Q.G.; Gao, X.Y.; Zhao, T.P.; Chen, W.; Yang, Y.H. Petrogenesis of Tangjiaping granite porphyry in northern Dabie:Evidence from Zircon LA-ICPMS U-Pb dating and geochemical characteristics. Acta Petrol. Sin. 2010, 26, 1550–1562. [Google Scholar]
  6. Li, H.Y.; Mao, J.W.; Wang, X.X.; Ye, H.S.; Yang, L. Sr, Nd, Pb isotopic characteristics of granite in Jinduicheng area and their geological significance. Geol. China 2011, 38, 1536–1550. [Google Scholar]
  7. Wang, G.G.; Ni, P.; Yu, W.; Chen, H.; Jiang, L.L.; Wang, B.H.; Zhang, H.D.; Li, P.F. Petrogenesis of Early Cretaceous post-collisional granitoids at Shapinggou, Dabie Orogen: Implications for crustal architecture and porphyry Mo mineralization. Lithos 2014, 184–187, 393–415. [Google Scholar] [CrossRef]
  8. Faure, G. Principles of Isotope Geology, 2nd ed.; John Wiley and Sons: Chichester, UK, 1986. [Google Scholar]
  9. Xie, G.; Mao, J.; Wang, R.; Meng, D.; Sun, J.; Dai, J.; Ren, T.; Li, J.; Zhao, H. Origin of the Lengshuigou porphyry–skarn Cu deposit in the Zha-Shan district, South Qinling, central China, and implications for differences between porphyry Cu and Mo deposits. Miner. Depos. 2017, 52, 621–639. [Google Scholar] [CrossRef]
  10. Zhou, Q.; Jiang, Y.H.; Zhao, P.; Liao, S.Y.; Jin, G.D. Origin of the Dexing Cu-bearing porphyries, SE China: Elemental and Sr-Nd-Pb-Hf isotopic constraints. Int. Geol. Rev. 2012, 54, 572–592. [Google Scholar] [CrossRef]
  11. Qin, K.Z.; Xia, D.X.; Li, G.M.; Xiao, B.; Duo, J.; Jiang, G.W.; Zhao, J.X. Qulong Porphyry-Skarn Cu-Mo Deposit, Tibet; Science Press: Beijing, China, 2014. (In Chinese) [Google Scholar]
  12. Pirajno, F.; Zhou, T.F. Intracontinental Porphyry and Porphyry-Skarn Mineral Systems in Eastern China: Scrutiny of a Special Case “Made-in-China”. Econ. Geol. 2015, 110, 603–629. [Google Scholar] [CrossRef]
  13. Chen, Y.J.; Wang, P.; Li, N.; Yang, Y.F.; Pirajno, F. The collision-type porphyry Mo deposits in Dabie Shan, China. Ore Geol. Rev. 2017, 81, 405–430. [Google Scholar] [CrossRef]
  14. Li, N.; Pirajno, F. Early Mesozoic Mo mineralization in the Qinling Orogen: An overview. Ore Geol. Rev. 2017, 81, 431–450. [Google Scholar] [CrossRef]
  15. Hu, S.X.; Zhou, Y.S.; Sun, M.Z. The genesis relationship of K-metasomatism and Mo deposit. J. Nanjing Univ. 1963, 14, 99–117. (In Chinese) [Google Scholar]
  16. Hu, S.X. The Geology and Mineralization in the Suture Zone between North China Craton and South China Craton; Nanjing University Press: Nanjing, China, 1988. (In Chinese) [Google Scholar]
  17. Du, L.T. Geochemical principle of K-metasomatism. Sci. China Chem. 1986, 16, 81–90. (In Chinese) [Google Scholar]
  18. Du, L.T. The important significance of alkali-metasomatic rock studies. Miner. Depos. 2002, 21, 953–958. [Google Scholar]
  19. Fitton, J.G.; Upton, B.G.J. Alkaline Igneous Rocks; Blackwell Scientific Publication: New York, NY, USA, 1987. [Google Scholar]
  20. Zhang, Z.W.; Zhu, B.Q.; Chang, X.Y.; Xie, J. Major element characteristics of the alkali-rich intrusive rocks zone and distribution of the subzones in the north ern part of east Qinling, China. Acta Petrol. Sin. 2002, 18, 468–474. [Google Scholar]
  21. Zhao, Z.H.; Xiong, X.L.; Wang, Q.; Bao, Z.W.; Zhang, Y.-Q.; Xie, Y.-W.; Ren, S.-K. Alkaline rich igneous rock and giant-super giant Au-Cu deposit. Sci. China Earth Sci. 2002, 32, 1–10. (In Chinese) [Google Scholar]
  22. Du, L.T.; Wang, W.G. Alkaline mantle fluids and alkali-rich hydrothermal metallogenesis. Miner. Depos. 2009, 28, 599–610. [Google Scholar]
  23. Xie, R.J.; Peng, S.L. K2O content, K-metasomatism of rock and metallogenesis. Geotecton. Metallog. 1998, 22, 274–279. [Google Scholar]
  24. Li, C.Y.; Wang, F.Y.; Hao, X.L.; Ding, X.; Zhang, H.; Ling, M.X.; Zhou, J.B.; Li, Y.L.; Fan, W.M.; Sun, W.D. Formation of the world’s largest molybdenum metallogenic belt: A plate-tectonic perspective on the Qinling molybdenum deposits. Int. Geol. Rev. 2012, 54, 1093–1112. [Google Scholar] [CrossRef]
  25. Ni, P.; Wang, G.G.; Yu, W.; Chen, H.; Jiang, L.L.; Wang, B.H.; Zhang, H.D.; Xu, Y.F. Evidence of fluid inclusions for two stages of fluid boiling in the formation of the giant Shapinggou porphyry Mo deposit, Dabie Orogen, Central China. Ore Geol. Rev. 2015, 65, 1078–1094. [Google Scholar] [CrossRef]
  26. Stein, H. Highly precise and accurate Re-Os ages for molybdenite from the East Qinling molybdenum belt, Shaanxi Province, China. Econ. Geol. 1997, 92, 827–835. [Google Scholar] [CrossRef]
  27. Mao, J.W.; Pirajno, F.; Xiang, J.F.; Gao, J.J.; Ye, H.S.; Li, Y.F.; Guo, B.J. Mesozoic molybdenum deposits in the east Qinling–Dabie orogenic belt: Characteristics and tectonic settings. Ore Geol. Rev. 2011, 43, 264–293. [Google Scholar] [CrossRef]
  28. Chen, W.; Xu, Z.; Lu, X.; Yang, X.; Li, H.; Qu, W.; Chen, J.; Wang, H.; Wang, S. Petrogenesis of the Bao’anzhai granite and associated Mo mineralization, western Dabie orogen, east-central China: Constraints from zircon U-Pb and molybdenite Re-Os dating, whole-rock geochemistry, and Sr-Nd-Pb-Hf isotopes. Int. Geol. Rev. 2013, 55, 1220–1238. [Google Scholar] [CrossRef]
  29. Gao, Y.; Mao, J.; Ye, H.; Meng, F.; Li, Y. A review of the geological characteristics and geodynamic setting of the late Early Cretaceous molybdenum deposits in the East Qinling–Dabie molybdenum belt, East China. J. Asian Earth Sci. 2015, 108, 81–96. [Google Scholar] [CrossRef]
  30. Mi, M.; Li, C.Y.; Sun, W.D. Qian’echong low-F porphyry Mo deposits in the Dabie Mountains, central China. Lithos 2015, 239, 157–169. [Google Scholar] [CrossRef]
  31. Wang, P.; Wang, Y.; Yang, Y.F. Zircon U-Pb geochronology and isotopic geochemistry of the Tangjiaping Mo deposit, Dabie Shan, eastern China: Implications for ore genesis and tectonic setting. Ore Geol. Rev. 2017, 81, 466–483. [Google Scholar] [CrossRef]
  32. Zhang, J.; Ye, H.S.; Zhou, K.; Meng, F. Processes of ore genesis at the world-class Yuchiling molybdenum deposit, Henan province, China. J. Asian Earth Sci. 2014, 79, 666–681. [Google Scholar] [CrossRef]
  33. Li, N.; Ulrich, T.; Chen, Y.J.; Thomsen, T.B.; Pease, V.; Pirajno, F. Fluid evolution of the Yuchiling porphyry Mo deposit, East Qinling, China. Ore Geol. Rev. 2012, 48, 442–459. [Google Scholar] [CrossRef]
  34. Yang, Y.F.; Wang, P.; Chen, Y.J.; Li, Y. Geochronology and geochemistry of the Tianmugou Mo deposit, Dabie Shan, eastern China: Implications for ore genesis and tectonic setting. Ore Geol. Rev. 2017, 81, 484–503. [Google Scholar] [CrossRef]
  35. Zhang, H.D.; Wang, B.H.; Hao, Y.J.; Cheng, S.; Xiang, B. Geological characteristics and comprehensive ore-prospecting information of Shapinggou porphyry-type molybdenum deposit in Anhui Province. Miner. Depos. 2012, 31, 41–51. [Google Scholar]
  36. Xu, X.C.; Lou, J.W.; Xie, Q.Q.; Xiao, Q.; Liang, J.; Lu, S.M. Geochronology and tectonic setting of Pb-Zn-Mo deposits and related igneous rocks in the Yinshan region, Jinzhai, Anhui province, China. Ore Geol. Rev. 2011, 43, 132–141. [Google Scholar] [CrossRef]
  37. Huang, F.; Wang, D.H.; Lu, S.M.; Chen, Y.C.; Wang, B.H.; Li, C. Molybdenite Re-Os isotopic age of Shapinggou Mo deposit in Anhui Province and Mesozoic Mo ore-forming stages in East Qinling–Dabie Mountain region. Miner. Depos. 2011, 30, 1039–1057. [Google Scholar]
  38. Chen, H.J.; Chen, Y.J.; Zhang, J.; Chen, X.Z.; Zhang, H.D. Zircon U-Pb ages and Hf isotope characteristics of the ore-bearing intrusion from the Shapinggou molybdenum deposit, Jinzhai County, Anhui Province. Acta Petrol. Sin. 2013, 29, 131–145. [Google Scholar]
  39. Ren, Z.; Zhou, T.; Hollings, P.; White, N.C. Magmatism in the Shapinggou district of the Dabie orogen, China: Implications for the formation of porphyry Mo deposits in a collisional orogenic belt. Lithos 2018, 308–309, 346–363. [Google Scholar] [CrossRef]
  40. Zhang, H.; Li, C.Y.; Yang, X.Y.; Sun, Y.L.; Deng, J.H.; Liang, H.Y.; Wang, R.L.; Wang, B.H.; Wang, Y.X.; Sun, W.D. Shapinggou: The largest climax-type porphyry mo deposit in China. Int. Geol. Rev. 2014, 56, 313–331. [Google Scholar] [CrossRef]
  41. He, T.; Yang, X.; Deng, J.; Zhang, H.; Zha, S.; Li, C.; Zhang, H. Geochronology, geochemistry and Hf–Sr–Nd isotopes of the ore-bearing syenite from the Shapinggou porphyry Mo deposit, East Qinling–Dabie orogenic belt. Solid Earth Sci. 2016, 1, 101–117. [Google Scholar] [CrossRef]
  42. Lu, H.Z.; Bi, X.W.; Wang, D.; Shan, Q. Ore-forming fluids of porphyry copper (molybdenum-gold) deposits. Miner. Depos. 2016, 35, 933–952. [Google Scholar] [CrossRef]
  43. He, J.; Xu, X.C.; Xie, Q.Q.; Fan, Z.L.; Chen, T.H. Evidence from pseudomorphous β-quartz phenocryst for decompression of rock-forming and ore-forming processes in Shapinggou porphyry Mo deposit. Sci. China Earth Sci. 2016, 59, 1014–1024. [Google Scholar] [CrossRef]
  44. Xu, Z.Q.; Li, Y.; Liang, F.H.; Pei, X.Z. A Connection between of the Paleo-Tethys Suture Zone in the Qinling–Dabie-Sulu Orogenic Belt. Acta Geol. Sin. 2015, 89, 671–680. [Google Scholar]
  45. Wang, Y.S.; Jiang, L.L.; Zhu, G.; Song, C.Z. Formation of present tectonic framework in Dabie Mountains: Evidences from quartz C-axis fabrics. Acta Petrol. Sin. 2009, 25, 219–231. [Google Scholar]
  46. Mao, J.W.; Xie, G.Q.; Bierlein, F.; Qü, W.J.; Du, A.D.; Ye, H.S.; Pirajno, F.; Li, H.M.; Guo, B.J.; Li, Y.F.; et al. Tectonic implications from Re-Os dating of Mesozoic molybdenum deposits in the East Qinling–Dabie orogenic belt. Geochim. Cosmochim. Acta 2008, 72, 4607–4626. [Google Scholar] [CrossRef]
  47. Hou, Z.H.; Wang, C.X. Determination of 35 trace elements in geological samples by inductively coupled plasma mass spectrometry. J. Univ. Sci. Technol. China 2007, 37, 940–944. [Google Scholar]
  48. Chen, F.; Li, X.H.; Wang, X.L.; Li, Q.L.; Siebel, W. Zircon age and Nd-Hf isotopic composition of the Yunnan Tethyan belt, southwestern China. Int. J. Earth Sci. 2007, 96, 1179–1194. [Google Scholar] [CrossRef]
  49. Yang, L.; Chen, F.; Liu, B.X.; Hu, Z.P.; Qi, Y.; Wu, J.D.; He, J.F.; Siebel, W. Geochemistry and Sr-Nd-Pb-Hf isotopic composition of the Donggou Mo-bearing granite porphyry, Qinling orogenic belt, central China. Int. Geol. Rev. 2013, 55, 1261–1279. [Google Scholar] [CrossRef]
  50. Sun, S.S.; Mcdonough, W.F. Chemical and isotopic systematics of oceanic basalts: Implications for mantle composition and processes. Geol. Soc. Lond. Spec. Publ. 1989, 42, 313–345. [Google Scholar] [CrossRef]
  51. Zhang, Z.W.; Zhang, Z.S.; Dong, Y.; Peng, W.F.; Zhang, J.J. Molybdenum deposits in eastern qinling, central china: Deep structural constraints on their formation. Acta Mineral. Sin. 2007, 27, 372–378. [Google Scholar]
  52. Guo, B.; Zhu, L.M.; Li, B.; Xu, J.; Wang, J.Q.; Gong, H.J. Isotopic and element geochemical study of Jinduicheng superlarge porphyry Mo deposit in East Qinling area. Miner. Depos. 2009, 28, 265–281. [Google Scholar]
  53. Jin, Z.D.; Zhu, J.C.; Li, F.C. O, Sr and Nd Isotopic Tracing of Ore-forming Process in Dexing Porphyry Copper Deposit, Jiangxi Province. Miner. Depos. 2002, 21, 341–349. [Google Scholar]
  54. Wang, Y.R.; Hu, S.X. The experiment study on Au activation and transfer: The example from Au deposit on North China Craton. Sci. China Earth Sci. 2000, 30, 499–508. (In Chinese) [Google Scholar]
  55. Cheng, P.; Koyanagi, G.K.; Bohme, D.K. On the chemical resolution of the 87Rb+(s0)/87Sr+(s1) isobaric interference: A kinetic search for an optimum reagent. Anal. Chim. Acta 2008, 627, 148–153. [Google Scholar] [CrossRef]
  56. Bolea-Fernandez, E.; Van Malderen, S.J.M.; Balcaen, L.; Resano, M.; Vanhaecke, F. Laser ablation-tandem ICP-mass spectrometry (LA-ICP- MS/MS) for direct Sr isotopic analysis of solid samples with high Rb/Sr ratios. J. Anal. At. Spectrom. 2016, 31, 464–472. [Google Scholar] [CrossRef]
  57. Zhu, X.Y.; Chen, F.; Liu, B.X.; Siebel, W. Zircon U-Pb and K-feldspar megacryst Rb-Sr isotopic ages and Sr-Hf isotopic composition of the Mesozoic Heyu pluton, eastern Qingling orogen, China. Lithos 2013, 156–159, 31–40. [Google Scholar] [CrossRef]
  58. Giletti, B.J.; Casserly, J.E.D. Strontium diffusion kinetics in plagioclase feldspars. Geochim. Cosmochim. Acta 1994, 58, 3785–3793. [Google Scholar] [CrossRef]
  59. Allègre, C.J.; Othman, D. Ben Nd-Sr isotopic relationship in granitoid rocks and continental crust development: A chemical approach to orogenesis. Nature 1980, 335–342. [Google Scholar] [CrossRef]
  60. Solomon, G.C.; Taylor, H.P., Jr. Isotopic evidence for the origin of Mesozoic and Cenozoic granitic plutons in the northern Great Basin. Geology 1989, 17, 591–594. [Google Scholar] [CrossRef]
  61. Chen, S.Q. Experimental geochemical study on Cu and Mo. Earth Environ. 1990, 4, 62–63. (In Chinese) [Google Scholar]
  62. Hu, S.X.; Ye, Y.; Fang, C.Q. Petrology of the Metasomatically Altered Rocks and Its Significance in Prospecting; Geological Publishing House: Beijing, China, 2004. (In Chinese) [Google Scholar]
  63. Richards, J.P. Postsubduction porphyry Cu-Au and epithermal Au deposits: Products of remelting of subduction-modified lithosphere. Geology 2009, 37, 247–250. [Google Scholar] [CrossRef]
  64. Cooke, D.R.; Hollings, P. Giant Porphyry Deposits: Characteristics, Distribution, and Tectonic Controls. Econ. Geol. 2005, 100, 801–818. [Google Scholar] [CrossRef]
  65. Audétat, A. Compositional evolution and formation conditions of magmas and fluids related to porphyry mo mineralization at Climax, Colorado. J. Petrol. 2014, 56, 1519–1546. [Google Scholar] [CrossRef] [Green Version]
  66. Sun, W.D.; Huang, R.F.; Li, H.; Hu, Y.B.; Zhang, C.C.; Sun, S.J.; Zhang, L.P.; Ding, X.; Li, C.Y.; Zartman, R.E. Porphyry deposits and oxidized magmas. Ore Geol. Rev. 2015, 65, 97–131. [Google Scholar] [CrossRef]
  67. Cox, S.F.; Knackstedt, M.A.; Braun, J. Principles of structural control on permeability and fluid flow in hydrothermal systems. Soc. Econ. Geol. Rev. 2001, 14, 1–24. [Google Scholar]
  68. Sillitoe, R.H. A Plate Tectonic Model for the Origin of Porphyry Copper Deposits. Econ. Geol. 1972, 67, 184–197. [Google Scholar] [CrossRef]
  69. Sillitoe, R.H. Porphyry Copper Systems. Econ. Geol. 2010, 105, 3–41. [Google Scholar] [CrossRef] [Green Version]
  70. Solomon, M. Subduction, arc reversal, and origin of porphyry copper-gold deposits in island arcs. Geology 1990, 18, 630–633. [Google Scholar] [CrossRef]
  71. Richards, J.P. Tectono-magmatic precursors for porphyry Cu-(Mo-Au) deposit formation. Econ. Geol. 2003, 98, 1515–1533. [Google Scholar] [CrossRef]
  72. Audétat, A. Source and evolution of molybdenum in the porphyry Mo(-Nb) deposit at Cave Peak, Texas. J. Petrol. 2010, 51, 1739–1760. [Google Scholar] [CrossRef]
  73. Buret, Y.; von Quadt, A.; Heinrich, C.; Selby, D.; Wälle, M.; Peytcheva, I. From a long-lived upper-crustal magma chamber to rapid porphyry copper-emplacement: Reading the geochemistry of zircon crystals at Bajo de la Alumbrera (NW Argentina). Earth Planet. Sci. Lett. 2016, 450, 120–131. [Google Scholar] [CrossRef] [Green Version]
  74. Zheng, Y.C.; Liu, S.A.; Wu, C.D.; Griffin, W.L.; Li, Z.Q.; Xu, B.; Yang, Z.M.; Hou, Z.Q.; O’Reilly, S.Y. Cu isotopes reveal initial Cu enrichment in sources of giant porphyry deposits in a collisional setting. Geology 2019, 47, 135–138. [Google Scholar] [CrossRef]
  75. Sun, W.D.; Ling, M.X.; Yang, X.Y.; Fan, W.M.; Ding, X.; Liang, H.Y. Ridge subduction and porphyry copper-gold mineralization: An overview. Sci. China Earth Sci. 2010, 53, 475–484. [Google Scholar] [CrossRef]
  76. Sun, W.D.; Liang, H.Y.; Ling, M.X.; Zhan, M.Z.; Ding, X.; Zhang, H.; Yang, X.Y.; Li, Y.L.; Ireland, T.R.; Wei, Q.R.; et al. The link between reduced porphyry copper deposits and oxidized magmas. Geochim. Cosmochim. Acta 2013, 103, 263–275. [Google Scholar] [CrossRef]
Figure 1. Sketch map of the eastern Qinling–Dabie orogenic belt and distribution of Mo deposits [27,29]. Mo deposit: (1) Xigou, (2) Huanglongpu, (3) Shijiawan, (4) Jinduicheng, (5) Balipo, (6) Dahu, (7) Mulonggou, (8) Nantai, (9) Yinjiagou, (10) Yechangping, (11) Zhaiwa, (12) Shapoling, (13) Longmendian, (14) Leimengou, (15) Huangshui’an, (16) Shiyaogou, (17) Majuan, (18) Nannihu-Sandaozhuang, (19) Shangfanggou, (20) Zhuyuangou, (21) Dawanggou, (22) Luocun, (23) Saozhoupo, (24) Donggoukou, (25) Laojieling, (26) Nangou, (27) Yuchiling, (28) Banchang, (29) Zhuyuangou, (30) Donggou, (31) Qiushuwan, (32) Tianmushan, (33) Xiaofan, (34) Mushan, (35) Doupo, (36) Qian’echong, (37) Bao’anzhai, (38) Dayinjian, (39) Yaochong, (40) Tangjiaping, and (41) Shapinggou.
Minerals 11 00910 g001
Figure 2. Geological map of the Shapinggou Mo ore district [3,36,43].
Minerals 11 00910 g002
Figure 3. Geological cross-section of the Shapinggou porphyry Mo deposit [3,35].
Minerals 11 00910 g003
Figure 4. Photographs and photomicrographs of quartz syenite and granite porphyry in the Shapinggou porphyry Mo deposit: (a) K-feldspathisation of granite porphyry; (b) weak K-feldspathisation of granite porphyry (cross-polarised light); (c) K-feldspathisation of quartz syenite; (d) weak K-feldspathisation of quartz syenite (cross-polarised light); (e) pyritisation–sericitisation–silicification (PSS) of quartz syenite; (f) PSS (cross-polarised light). Similar phenomena have been reported [3]. Mineral abbreviations: Ab, albite; Kfs, K-feldspar; Qtz, quartz; Pl, plagioclase; Ser, sericite; Ms, muscovite; Py, pyrite; Mo, molybdenite.
Minerals 11 00910 g004
Figure 5. (a) Primitive mantle-normalised trace element diagram; (b) Chondrite-normalised REE pattern for quartz syenite and granite porphyry of the Shapinggou porphyry Mo deposit. Values for primitive mantle and chondrite are from Sun and McDonough, 1989 [50].
Minerals 11 00910 g005
Figure 6. Trace element and Rb-Sr isochron diagrams of minerals from quartz syenite and granite porphyry: (ad) trace element of minerals from quartz syenite and granite porphyry; (e) Sr isotope of minerals from quartz syenite and granite porphyry; (f) Rb-Sr isochron diagrams of minerals from quartz syenite and granite porphyry. Mineral abbreviations: Ap, apatite; Bi, biotite; Kfs, K-feldspar; Qtz, quartz; Pl, plagioclase.
Minerals 11 00910 g006
Figure 7. Sr-Nd isotopic composition of ore-related intrusions of porphyry Mo deposits in the eastern Qinling–Dabie orogenic belt and the Dexing Cu deposit. Data source: [3,4,5,6,7,53] and this study.
Minerals 11 00910 g007
Figure 8. (ad) Plots of Na2O versus SiO2, CaO versus SiO2, CaO versus Na2O, and Sr versus CaO; (e) εNd(t) versus 87Rb/86Sr diagram; (f) (87Sr/86Sr)t versus 87Rb/86Sr diagram for quartz syenite and granite porphyry in the Shapinggou porphyry Mo and the Dexing porphyry Cu deposits. Data source: [3,7,53] and this study.
Minerals 11 00910 g008
Figure 9. Comparison of initial 87Sr/86Sr values of minerals from the Shapinggou granite porphyry having different degrees of K-alteration, showing that the minerals and stronger K-altered rocks have higher K contents and lower initial 87Sr/86Sr values.
Minerals 11 00910 g009
Publisher’s Note: MDPI stays neutral with regard to jurisdictional claims in published maps and institutional affiliations.