Article

Effect of Water Immersion on Raw and Expanded Ugandan Vermiculite

Department of Geology and Enrique Moles Institute, University of Oviedo, 33005 Oviedo, Spain
Minerals 2022, 12(1), 23; https://doi.org/10.3390/min12010023
Submission received: 20 November 2021 / Revised: 16 December 2021 / Accepted: 21 December 2021 / Published: 23 December 2021

Abstract

:
Effect of water immersion at different times (from 1/2 h to 24 h) on raw and expanded vermiculite from Uganda was investigated. The expansion was carried out by electrical heating at different temperatures and by irradiation with microwaves. After, the expansibility (k) and the water absorption content (WA) were obtained and the samples were characterized. The elemental and mineral composition was determined by X-ray fluorescence and X-ray diffraction, respectively; the thermal behavior by thermal gravimetric analyses; and the textural parameters by BET. The expansibility of Ugandan vermiculite is relatively lower than the other commercial vermiculites due basically to its lower K2O content (0.36%) and higher water content (about 20%). The water absorption capacity of samples significantly increased with the increase in heating temperature. The maximum WA content, about 130 mg/g, was obtained at 900 °C for 24 h. The loss of water during the expansion process in the Ugandan vermiculite caused loss of structural order and crystallinity. Moreover, in the samples expanded and subsequently immersed in water, the structural order and crystallinity increased with increasing WA values. Specific surface area and porosity hardly vary with temperature and are practically independent of vermiculite purity. Expanded commercial vermiculites could be a suitable hygroscopic material, given its efficient water absorption. Microwave expanded commercial vermiculites, in this case, would not be recommended.

1. Introduction

The materials used as pavement in large cities are generally characterized by their low thermal conductivity and high absorption of solar energy due to their dark color. This absorption causes day-time temperatures to be higher, as well as night-time temperatures, especially in the summer. Consequently, the number of nights exceeding 25 °C (the so-called tropical night) is increasing (e.g., see [1]). The increase in daytime temperature is also due to heat from automobile exhaust and air conditioners. In addition, refrigeration by evaporation of vapor from ground surfaces is decreasing.
The other effective way is to improve energy efficiency, which can be realized through the use of thermal insulating materials with high performance [2].
For various types of functional pavement systems, many materials have been developed with water retention properties and a particular cooling effect on the evaporation of vapor from the pavement surface containing such water retention materials. Water retaining materials for use in pavements must, therefore, have a fast water absorption rate, a high water absorption capacity, and a slow release of adsorbed water. Hygroscopic materials can be differentiated and classified according to the adsorption characteristic and their natural and synthetic origin [3,4,5,6,7,8,9].
Hygroscopic materials can also regulate the humidity of the air in a room and reduce energy consumption. In addition, the whole life cycle cost can be minimized. Therefore, hygroscopic materials can improve human comfort [3,10].
Vermiculite is appropriate for improving the water absorption capacity, water/fertilizer retention properties of cementitious materials [11,12]. These materials constitute the most important components of planting concrete [13,14,15].
The main characteristic of vermiculite, well known by all, is their exfoliation and expansion capacity when it is heated, and it is due to the loss of water molecules located between the silicate sheets [16,17,18,19,20,21]. The expansion occurs only at right angles to the cleavage planes, and the sheets spread apart into an accordion like structure causing spaces between them and, therefore, increasing the spaces available for water adsorption. Thus, the exfoliated vermiculite becomes a powerful desiccant. This structure is also excellent for its breathability, drainage, and cation decomposition ability.
In order to use vermiculite as roof and floor insulation in a house, it is necessary to know its water retention capacity. So far, some research has been carried out on the behavior of vermiculite in in a controlled humid atmosphere [2], and with vermiculite mixed with allophane or other materials [11]. The objective of this work was, on the one hand, to investigate whether the water absorption capacity of expanded vermiculite, by heating at different temperatures and by microwave irradiation, is suitable for use it as a hygroscopic material; on the other hand, to study the effect of water immersion on vermiculite.
Several techniques were used for the characterization: The composition of raw sample was obtained using X-ray fluorescence (XRF); the expansibility of the vermiculite at different temperatures and with irradiation with microwaves was obtained by heating the samples at different temperatures with an electric muffle furnace and irradiating them with microwaves into microwave oven, respectively; X-ray diffraction (XRD) was used for the identification of the mineral composition; thermal behavior was obtained using thermal gravimetric (TG) and analyses textural parameters with Brunauer–Emmett–Teller (BET).

2. Materials and Methods

2.1. Materials

Ugandan vermiculite was supplied by the company VERMICULITA Y DERIVADOS S.L. (Gijón, Spain). The packets dimensions are smaller than 5 mm in diameter and 0.5–1 mm in thickness and gold-colored (Figure 1).

2.2. Experiments

2.2.1. Vermiculite Expansion

No previous treatment was performed on the vermiculite samples, in order to preserve their natural characteristics as much as possible.
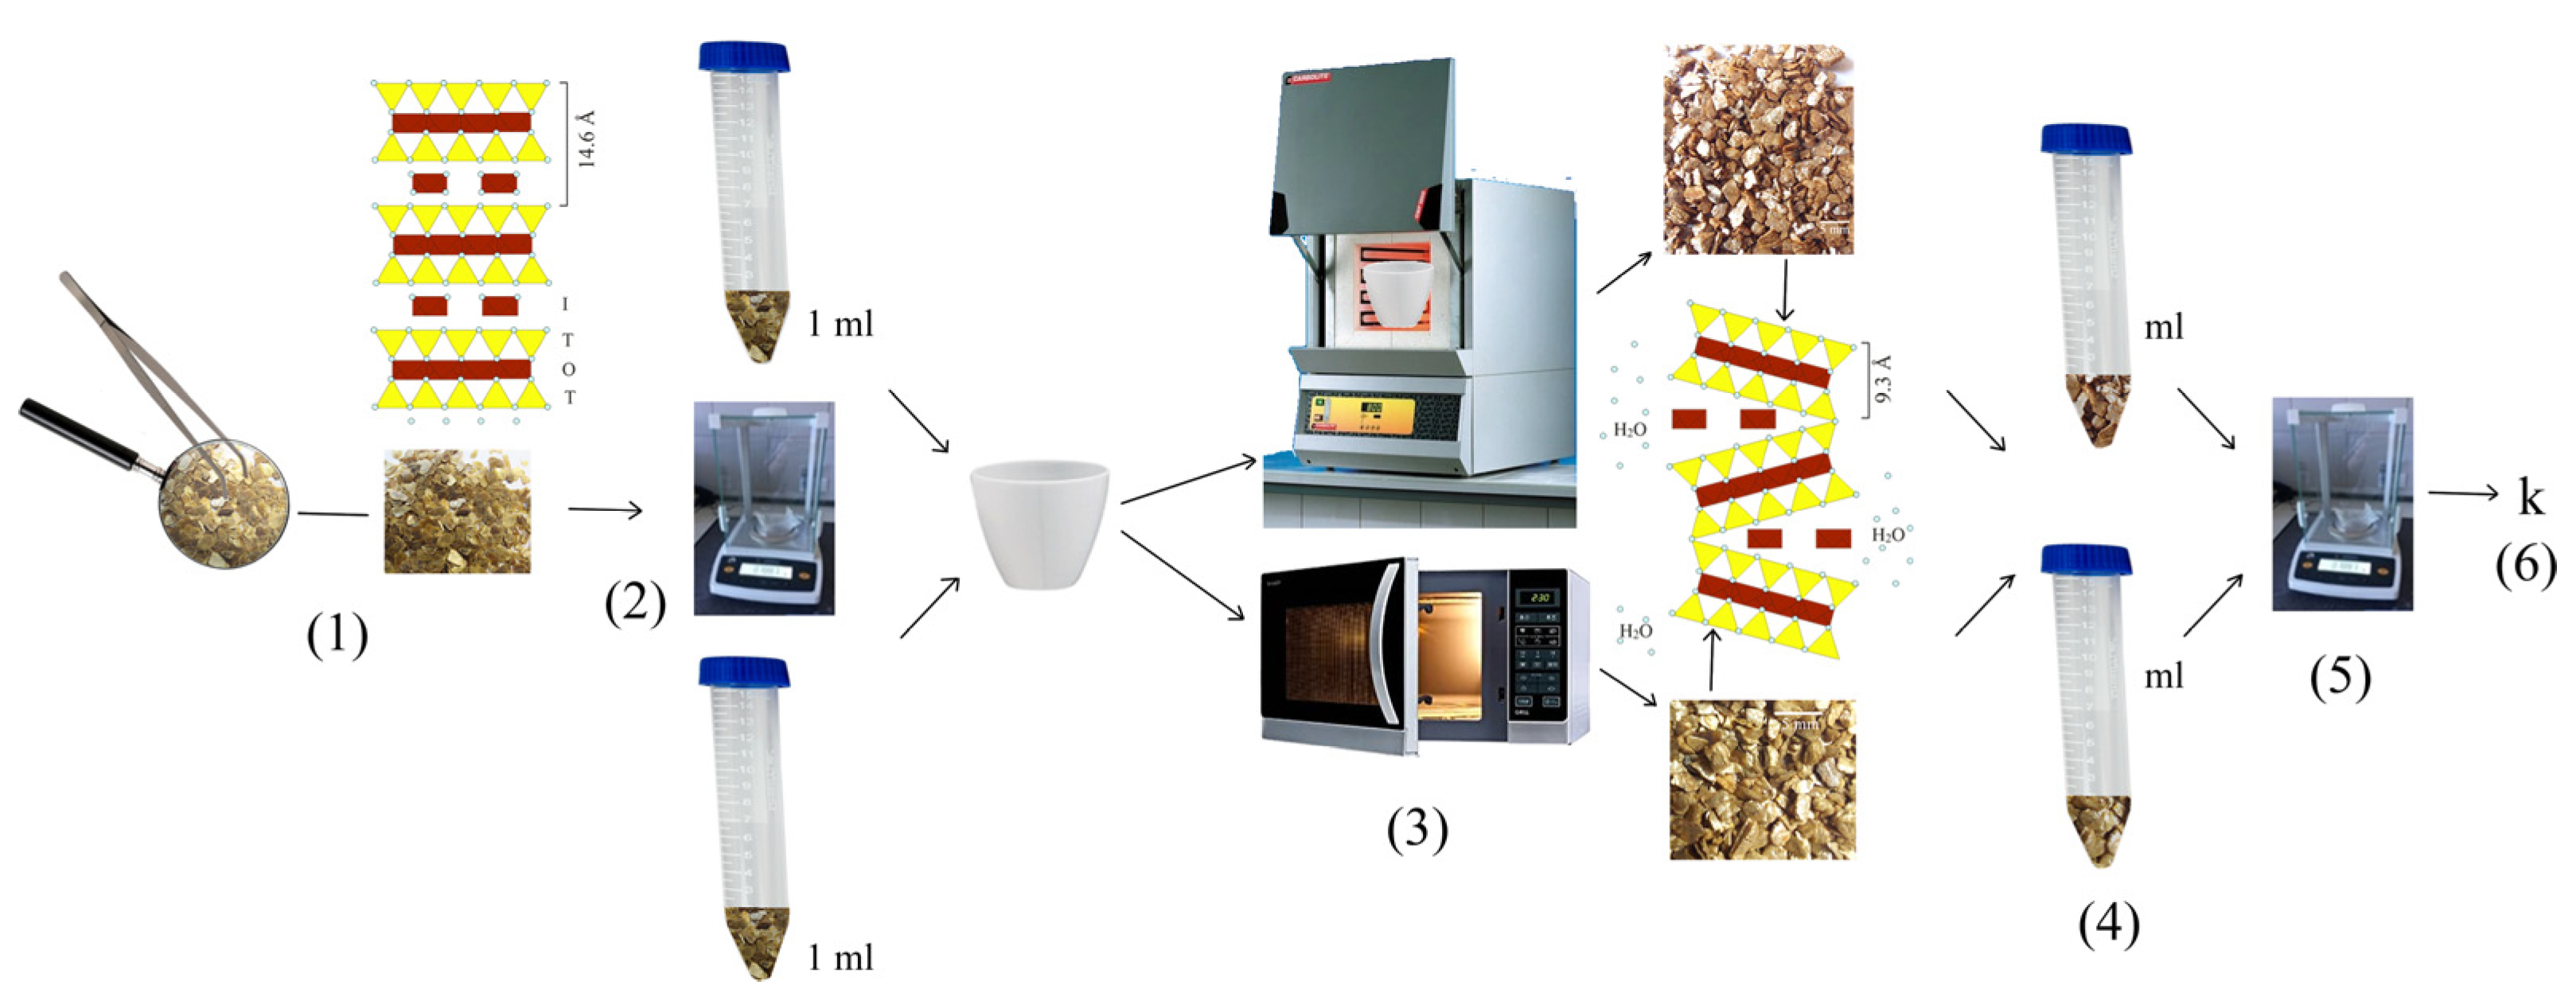
Raw samples heating in an electric muffle furnace at 300, 400, 500, 600, 700, 800, and 900 °C, respectively, for about 1 min. Additionally, the raw sample was irradiated with microwaves. The expansibility (k) was obtained by the change in the apparent density [22] (Figure 2). One milliliter of the raw sample was weighed and heated at 300, 400, 500, 600, 700, 800, and 900 °C, respectively, for about 1 min, in the electric muffle furnace. In addition, one milliliter of the raw sample was weighed and irradiated with microwaves. Then, the apparent volume for the heated and irradiated samples was measured again as in the raw samples by tipping the loose fragments into a measuring cylinder (Figure 2).

2.2.2. Water Immersion

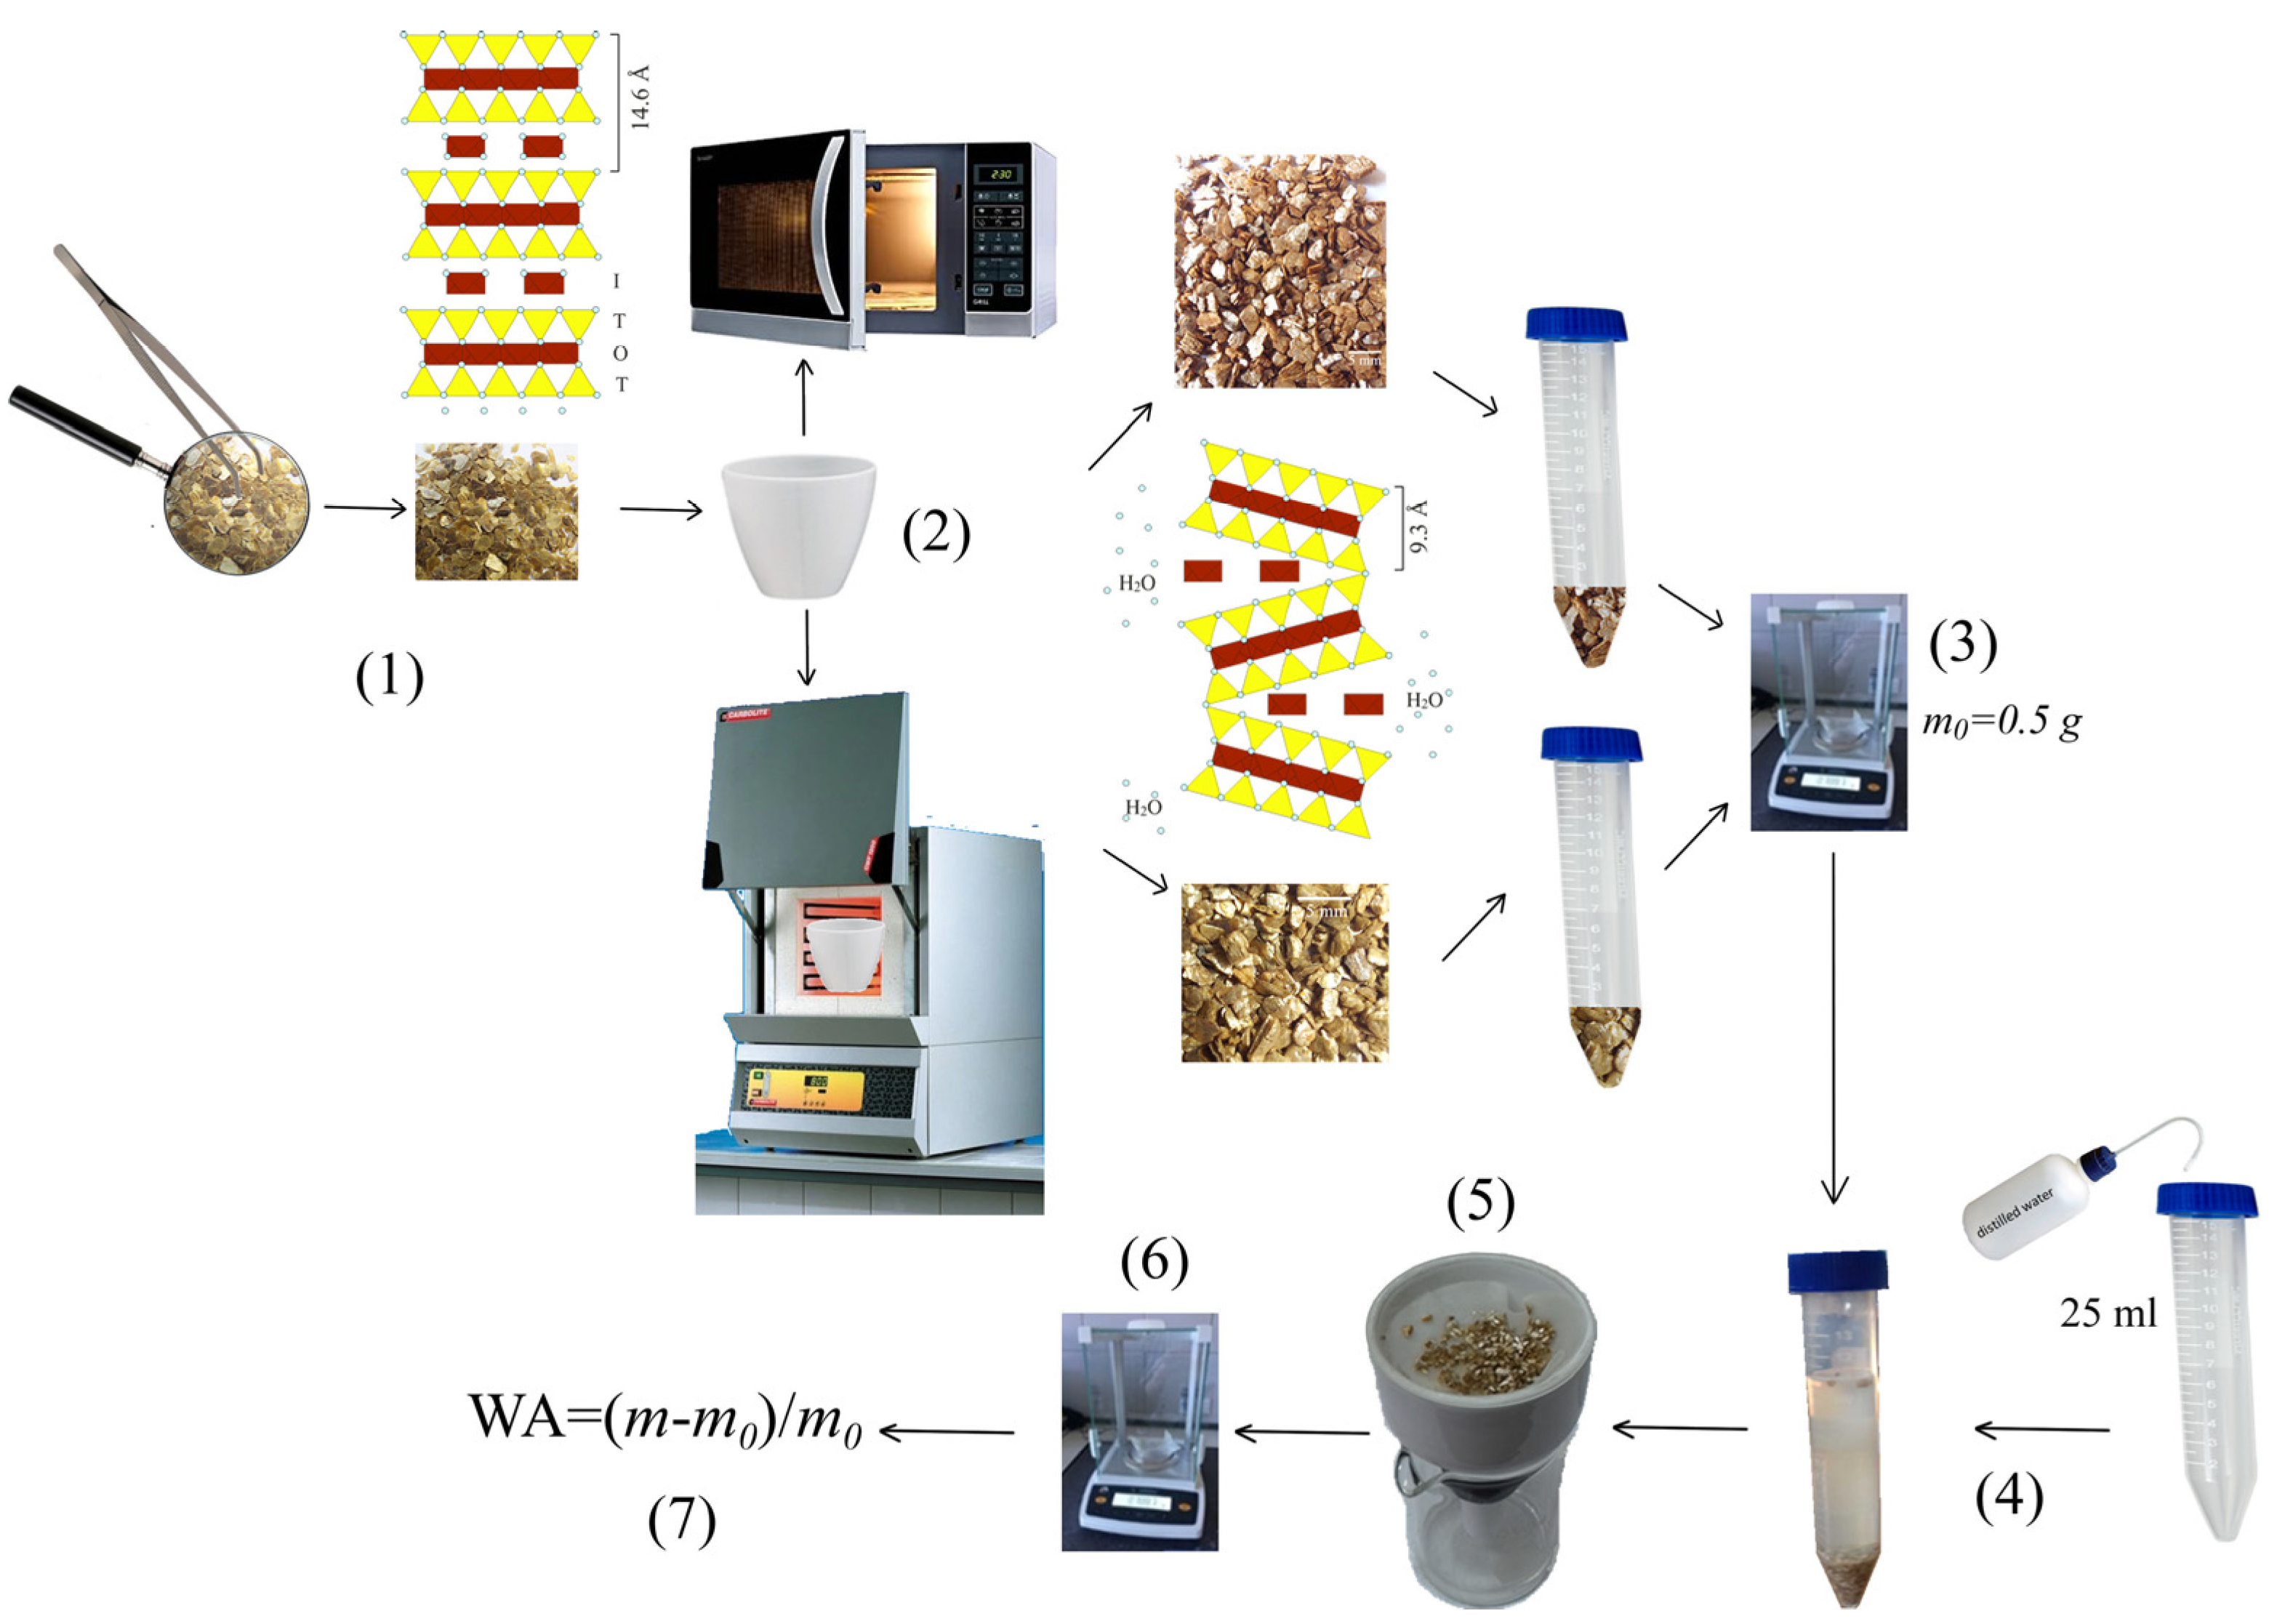
Raw, heated, and microwave irradiated samples with initial mass each one, m0, of 0.5 g were immersed in 25 mL of water distilled for 0.5, 1, 1.5, 2, 2.5, 3, 3.5, 5.5, 7.5, 9.5, 11.5, 23 and 24 h, respectively. Afterwards, the samples were filtered and dried at room temperature (20 °C), and the weight of each sample (m) was recorded (Figure 3). Finally, the water absorption content (WA) was calculated through the formula:
W A = m m 0 m 0

2.3. Characterizations

Raw and treated samples were subjected to characterization of the composition using X-ray fluorescence, expansibility, identification of the mineral composition by X-ray diffraction, thermal behavior using thermal gravimetric and analyses textural parameters with BET.
The chemical composition of the Uganda raw vermiculite has been determined with an X-ray fluorescence spectrometer PHILIPS PW2404 and Automatic Charger PW2540 (Malvern Panalytical B V sucursal in Madrid, Spain) equipped with a rhodium anode (Rh) tube with 4 kW of power, five analyzer crystals (Fli 200, Fli 220, Pe, Ge, and Px1) and three detectors: xenon sealing, scintillation and gas flow. In the quantitative analysis, a calibration for geological samples was available, with international reference standards. The major elements determined were: Al2O3, P2O5, K2O, CaO, SiO2, TiO2, MnO2, Fe2O3, MgO, and Na2O. To analyze the major elements, bead from the U-20 sample was prepared by fusion with a Quielab pearl.
An electric furnace Carbolite CWF 1100 (Carbolite, Hope, England) was used for heating samples.
A SHARP R64sT microwave oven (SHARP Electronics (Europe) Limited, Spain) working at 2.45 GHz of frequency and 800 W of energy was used for microwave irradiation. The samples were placed in the center of the glass rotating disc of the microwave oven.
XRD patterns of the raw and treated samples, 0.5 g from each one previously grinded with an agate mortar, were taken with a PANalytical X’pert Pro diffractometer (Malvern Panalytical B V, Madrid, Spain). Setting conditions were 40 mA and 45 kV (Cu-Kα radiation; λ = 1.5418 Å), 2θ range of 4.5 to 70 degrees, 2θ step scans of 0.007° and a counting time of 1s per step. The standard reference material used was 660a NIST LaB6 with Full Width at Half Maximum (FWHM) of 0.06° for 2θ = 21.36°. Changes in the intensity and position of the basal reflections were used to indicate changes in the structural order and hydration states.
The thermal gravimetric analyses were performed between 25 °C and 1000 °C using a Mettler Toledo Stare System thermo-balance (Mettler Toledo, Madrid, Spain) with a heating rate of 10 °C/min. The total mass loss was determined gravimetrically by heating the samples in an inert atmosphere (N2) at 1000 °C in a muffle furnace and assumed due entirely as water. The initial sample mass was about 20 mg.
Textural parameters of the powdered samples were determined with the ASAP 2020 equipment (Iberfluid Instruments, Barcelona, Spain) under the following conditions: nitrogen adsorption at −195.8 K, with σm (N2) of 0.162 nm2; unrestricted evacuation of 30.0 mm Hg; vacuum pressure of 10 μm Hg; evacuation time of 1 h; and temperature of sample evacuation prior to N2 adsorption measurements of 22 °C. The data were recorded with equilibration times (p/p0 between 0.001 and 1.000) between 50 and 25 s and a minimum equilibrium delay of 600 s at p/p0 ≥ 0.995. Specific surface area and pore size data have been determined by using a mathematical description of the adsorption isotherms with the software of the equipment.
The generic code used for the samples is U-T-t, where U refers to the country of origin of the vermiculite—Uganda-, T refers to the temperature used in °C or microwave irradiation—MW-, and t refers to the time of immersion in distilled water of the vermiculite.

3. Results

The major elements percentages expressed in oxides for the raw sample U-20 obtained by XRF are in Table 1. The potassium content is low and the loss on ignition value (L.O.I.), mainly due to evaporation of water when the sample is heated to high temperatures, is similar, as expected, to the weight loss obtained after heating at 900 °C for one minute.
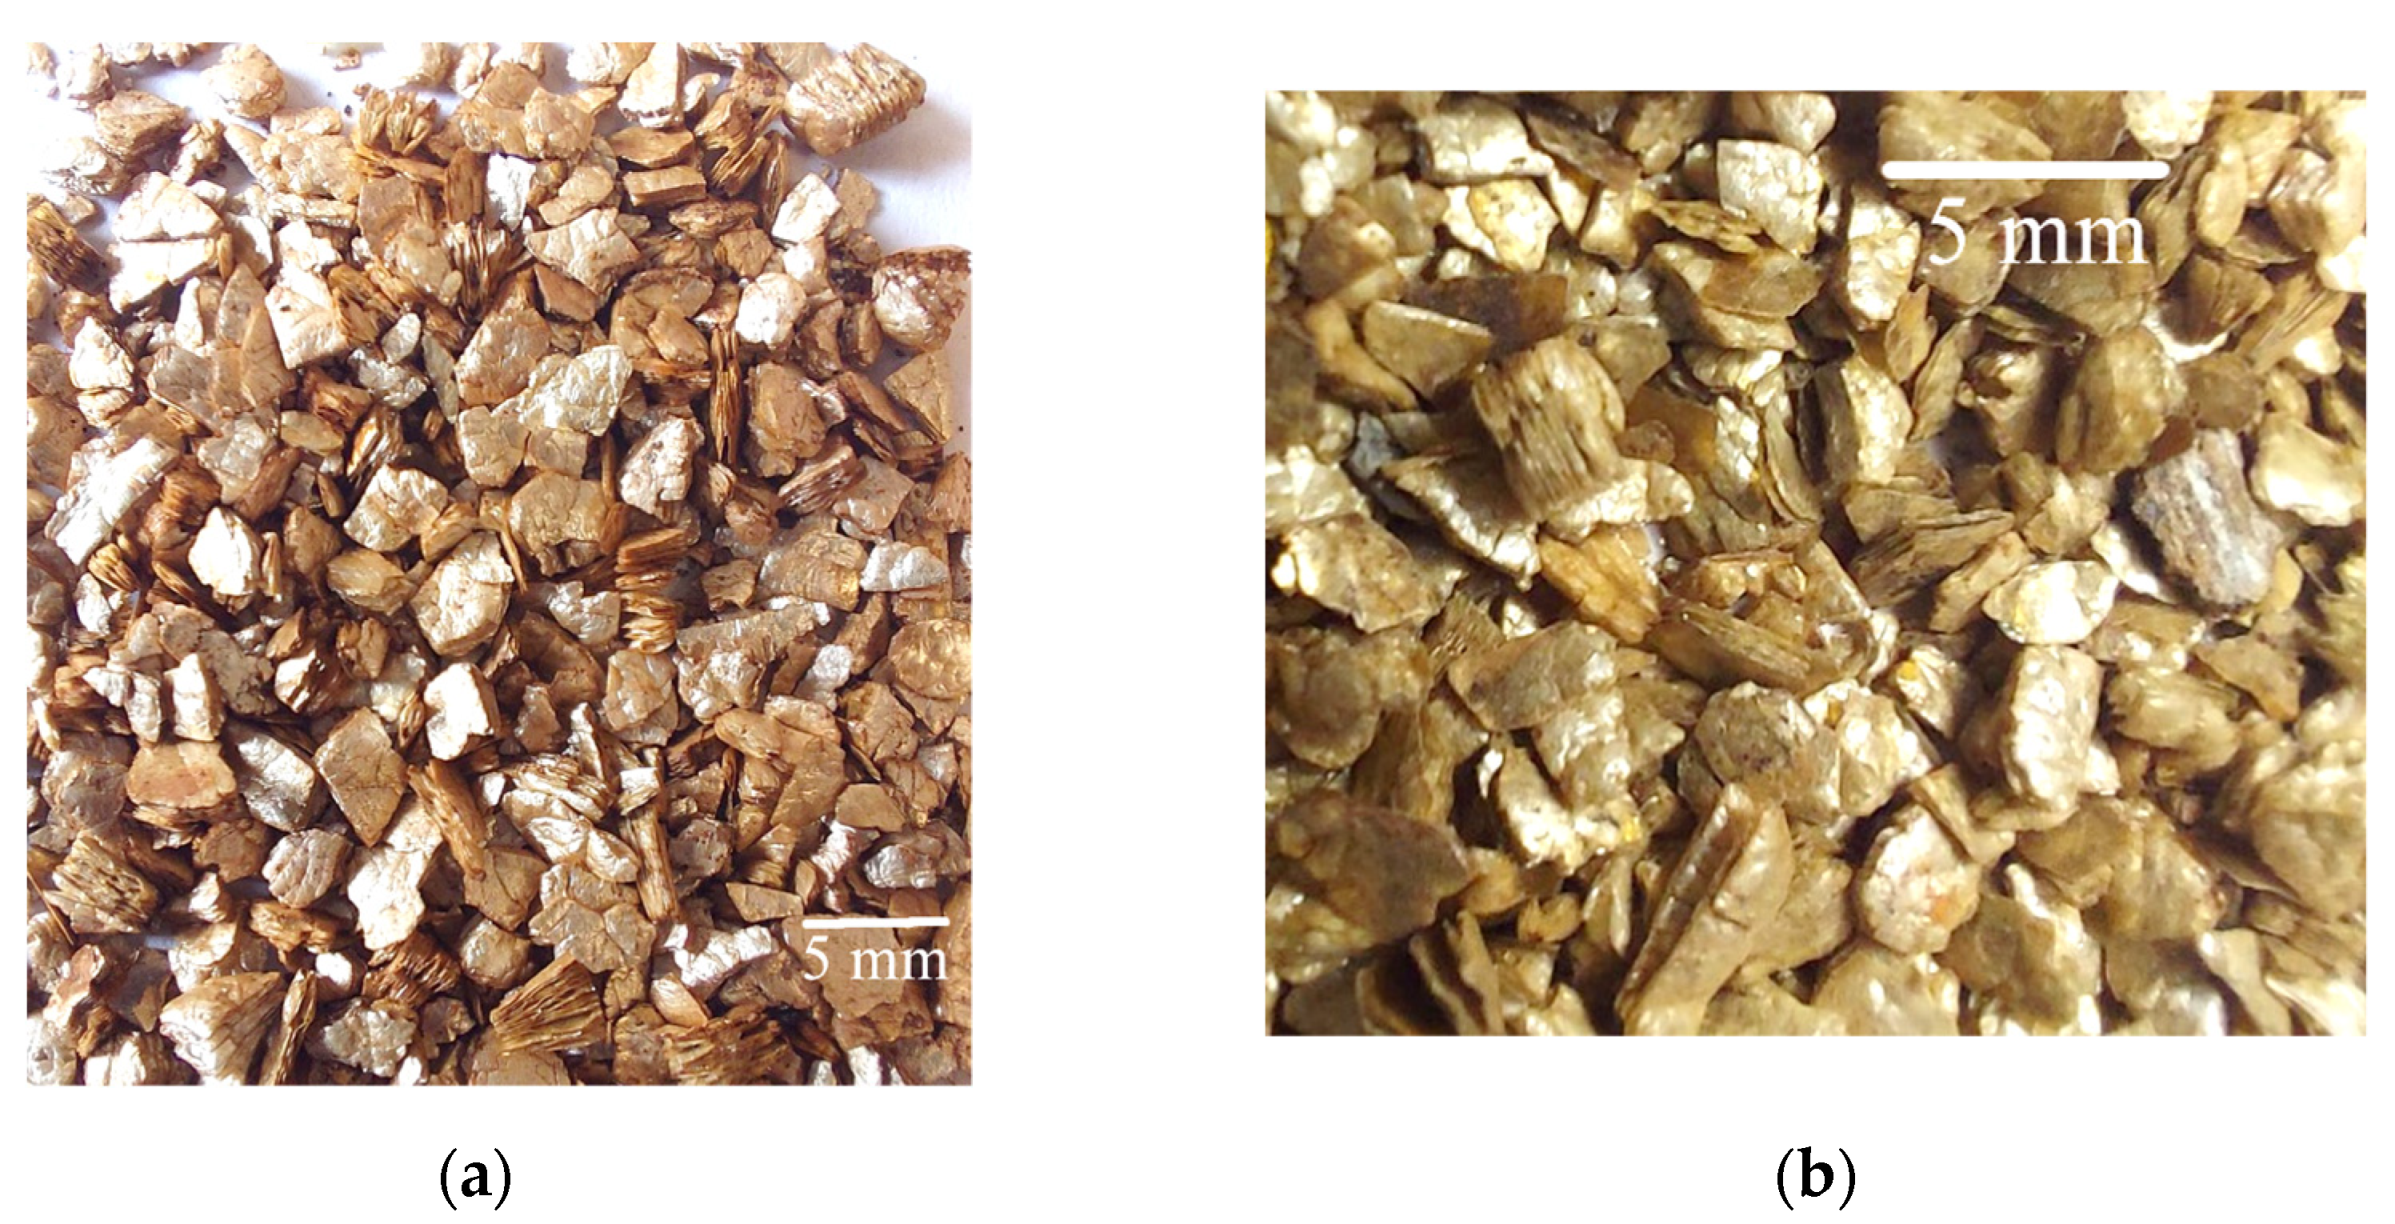
The expansion occurred at right angles to the exfoliation and the sheets spread apart into an accordion-like structure; the color meanwhile changing to a golden brown (Figure 4a for U-900 sample as an example) and U-MW (Figure 4b).
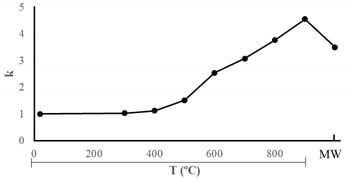
The expansibility of vermiculite increases with temperature (Table 2), as expected. The expansibility of microwave-irradiated vermiculite is similar to that of vermiculite heated for 1 min at 800 °C.
Vermiculite heated at different temperatures did not absorb water up to 700 °C and from this temperature, WA increased with it. The WA (mg/g) values for vermiculite heated between 700 °C and 900 °C are given in Table 3. The WA value is independent of the immersion time of the vermiculite.
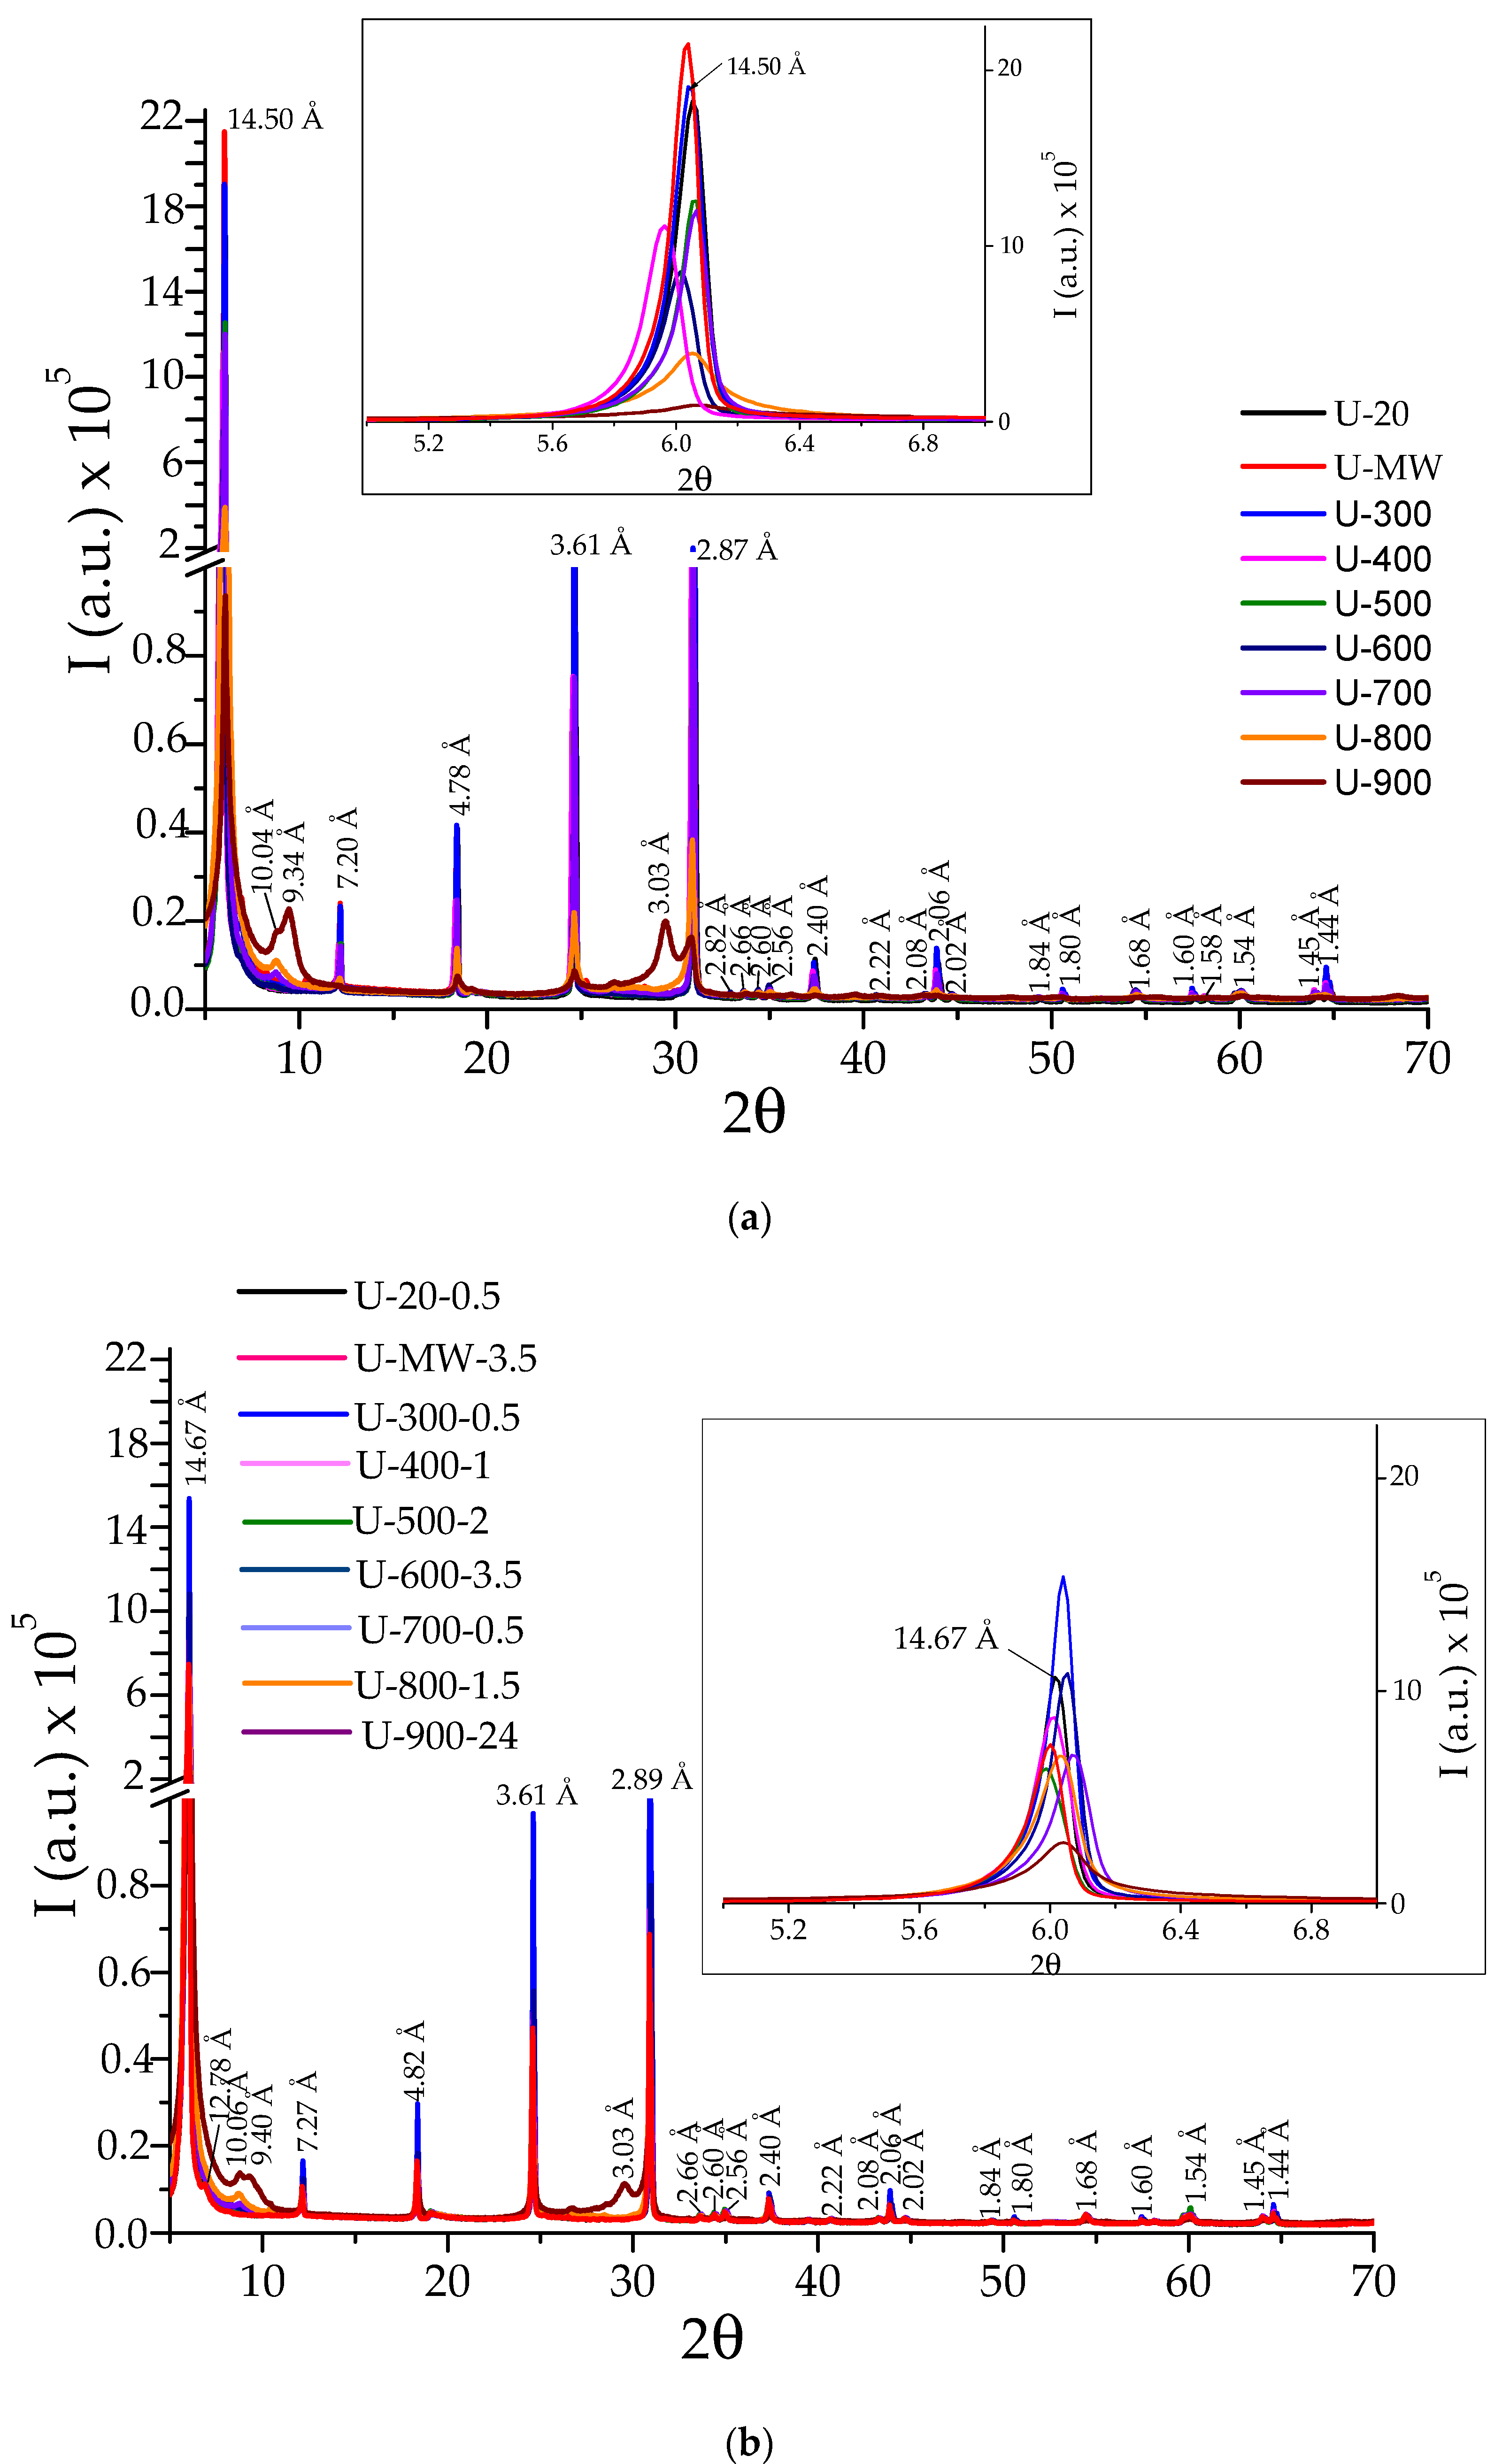
The XRD patterns performed at room temperature for the raw and treated samples are presented in Figure 5. The reflections shown in the XRD pattern of the raw vermiculite correspond to those of vermiculite (JCPDS-ICCD card No. 16-613). In the inset of Figure 4a only the principal reflection, (002), is shown (Figure 4). At room temperature (20 °C), this reflection, at 14.50 Å, corresponds to vermiculite with 2-WLHS (state of hydration with 2 water layers) and their intensity decreases with increasing temperature, until the crystalline structure practically collapses at 900 °C. The principal reflection of the U-MW sample is slightly displaced towards lower values of 2θ and has a somewhat higher intensity than that of the U-20 starting sample. In order to clearly appreciate the effect of the water immersion time of the expanded vermiculite, XRD patterns of the vermiculite expanded between 700 °C and 900 °C with the highest WA value for the investigated times are presented in Figure 4b. In addition, XRD patterns of vermiculite expanded at temperatures below 700 °C and microwave irradiated vermiculite with the lowest m-m0 value are also presented in the same Figure 4b. In the inset of Figure 4b it is observed that the intensity of the 002 reflection, at 14.67 Å, decreases in relation to that of the samples expanded and not immersed in water, and its position varies very little. In addition, the intensity of the principal reflection is greater in the expanded samples up to 500 °C not immersed in water than in those immersed; in the samples expanded at 600 °C, 800 °C, and 900 °C the opposite occurs.
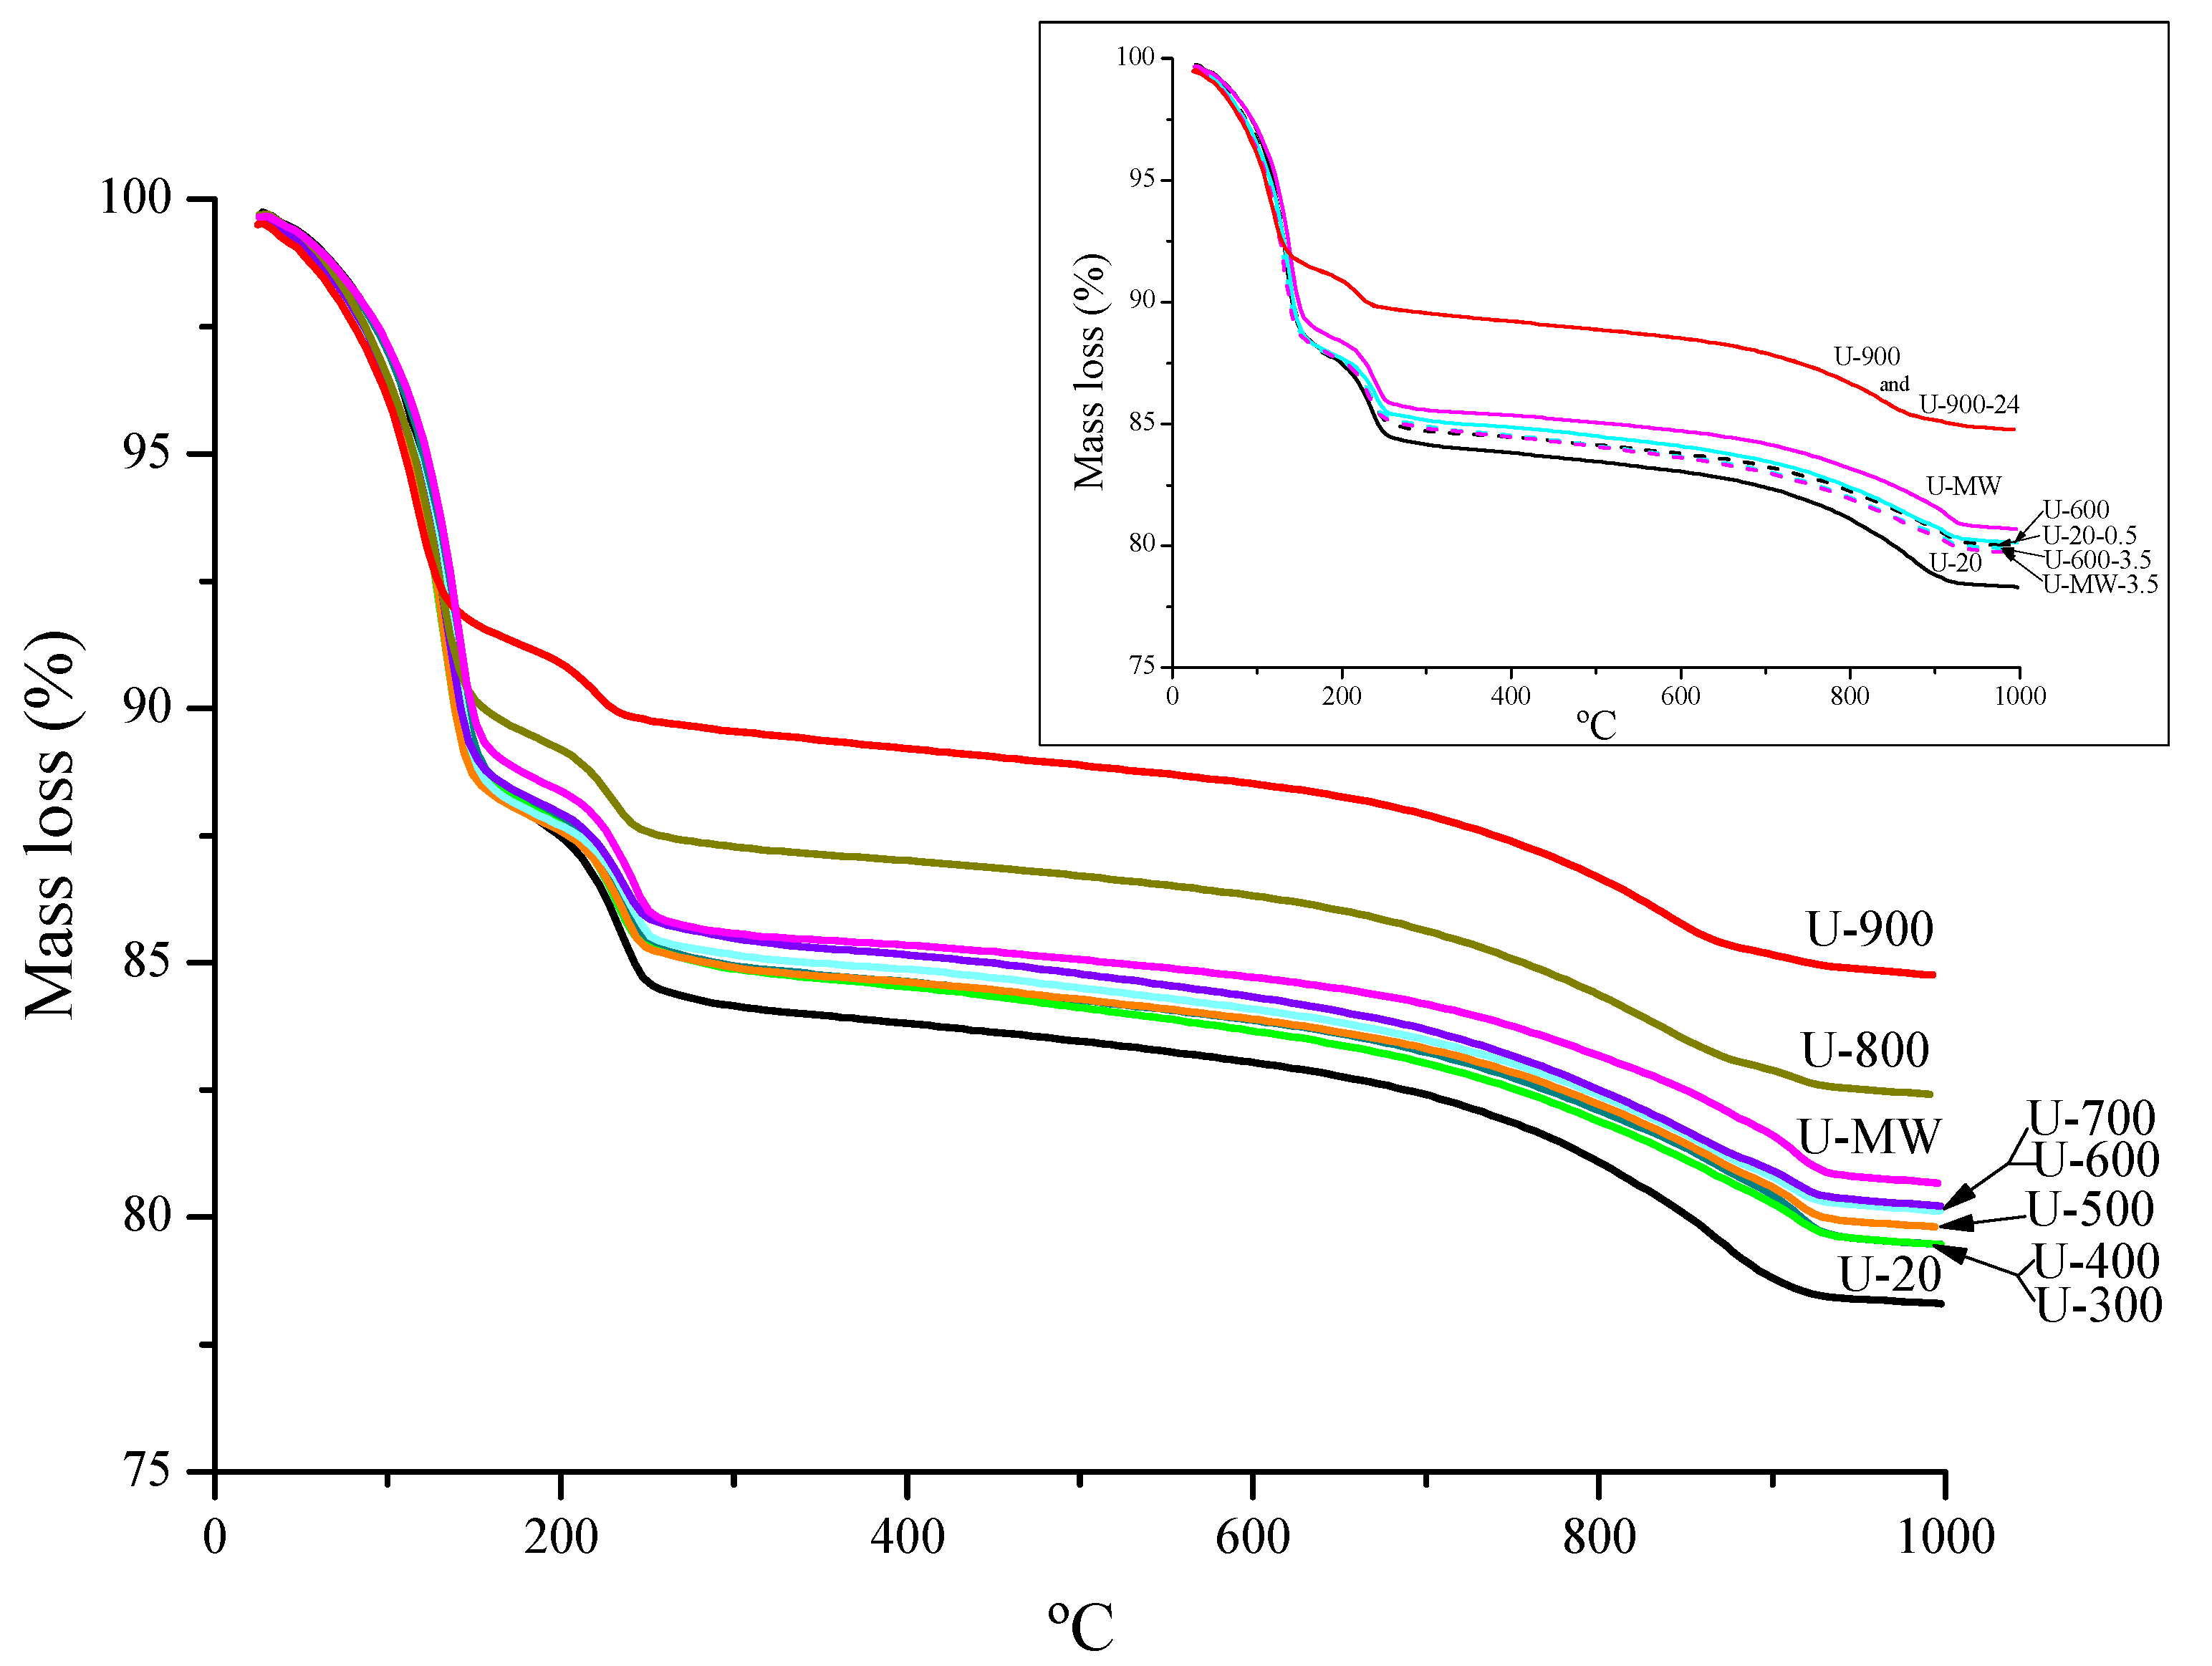
The thermal behavior of all the samples (Figure 6) is very similar. The decomposition of samples takes place in three steps. The first and second steps extends from 25 to ca. 250 °C and is due to the loss of the water adsorbed at the surface and/or located in the interlayer space as has been previously reported for vermiculite [23,24,25]. In a second step, at temperatures above 800 °C, an additional mass loss is observed. This mass loss is due to either recrystallization into new phases or a transformation process associated with the dehydroxylation of the OH- anions in the octahedral layer [19,23]. The mass loss (%) is presented in Table 4, which shows that in the first stage it is less than 16% and in the second stage it is 4.5%. Above 800 °C the mass loss in the first stage is much lower than at lower temperatures. There are some samples that depart a little from this behavior and that lose less mass in the first stage. These samples are U-800, U-900, U, U-900-24. Mass loss decreases slightly with temperature. The mass loss of the sample irradiated with microwaves is similar to that heated in an oven at 700 °C. The first mass loss stage is endothermic and the second is exothermic (Figure 7).
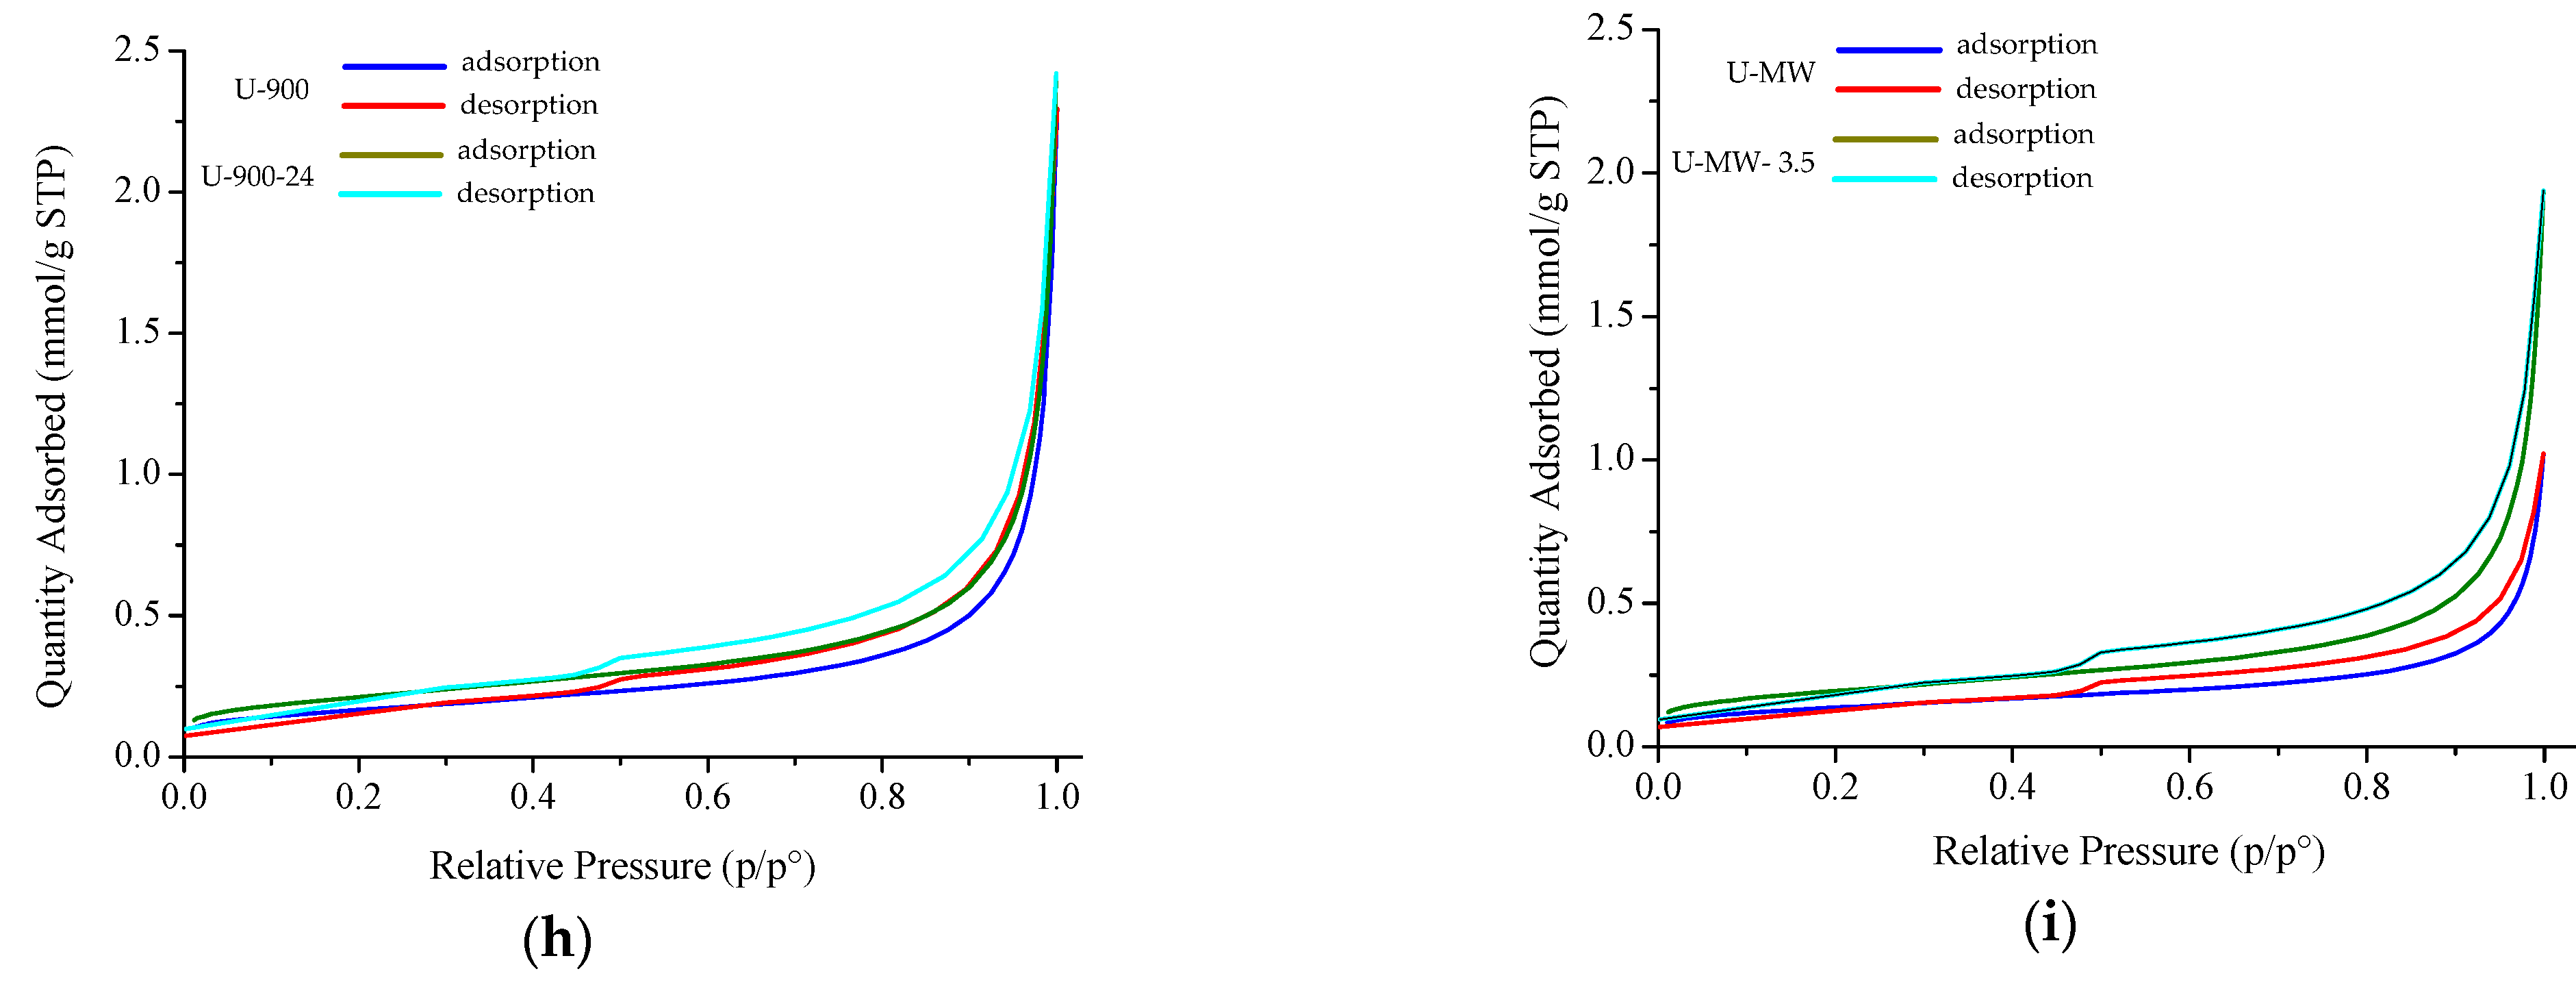
The nitrogen adsorption-desorption isotherms of the untreated vermiculites and the vermiculites treated are shown in Figure 8. The isotherms of the treated vermiculites could be of type IV, based on IUPAC classification, showing characteristics of mesoporous solids [26]. The slight hysteresis H3 shown by samples is a characteristic of plate-like particles of vermiculites [26].
The specific surface area (SBET), adsorption capacity (Qm), total pore volume (Vp), pore size (nm), BET constant (C), and correlation coefficient (R2) values obtained from the adsorption–desorption tests are shown in Table 5. The BET constant (C) values of the investigated untreated and treated samples confirmed that micropores are not present, indicating the validity of the BET method.
The SBET and Qm follow the relationship U-20 > U-300 > U400 < U-500 < U-600 > U700 < U-800 > U-900. The specific surface area varies with temperature, from 6.6 to 18.1 m2/g, but shows no correlation with it. However, an increase in this area and in the adsorption capacity is observed in the case of expanded samples and subsequently immersed in water. Meanwhile, the pore size remains constant up to 700 °C, then decreases and at 800 °C increases, decreasing again at 900 °C. The microwave irradiated sample shows the highest pore size value. The sample expanded with microwave radiation U-MW shows a slightly lower SBET than the starting sample U-20, while the Vp and pore size are higher. As for the samples expanded and subsequently immersed in water, they show almost equal values of SBET and Vp but the E-MW-3.5 shows a slightly lower pore size than the U-20-0.5 sample. The Vp values do not differ much with temperature, although a slight increase is observed at higher temperatures. The sample at room temperature has the lowest Vp value.

4. Discussion

The expansibility of Ugandan vermiculite is much lower than that of Xinjiang (China) [2] at any of the temperatures used. The reason is due to differences in composition of the two vermiculites, basically to K2O and water contents. The results of K2O content in the analyzed sample suggest that vermiculite from Uganda is quite pure (K2O content of 0.36% ≅ 0.35%), in agreement with authors such as Justo et al. and Velde [27,28]. On the contrary, the sample from China is not pure vermiculite, as K2O content is high (6.16%). In relation to water content, the percentage of Ugandan vermiculite is approximately 20%, while that of Chinese vermiculite is approximately 11%. The low potassium content and high water content are the reason why the Ugandan vermiculite has much lower expansibility values than the Chinese sample [16,29].
The decrease in the intensity of the main X-ray reflection, 002, from vermiculite with increasing temperature is related to the loss of water due to the expansion process, which implies loss of structural order and crystallinity, according to Marcos [29]. This loss is greater in samples immersed in water after expansion. The slight variations of 2θ of the main reflection of the XRD patterns of the samples may be due to structural readjustments induced by temperature and the water absorption. The slight displacement of the main reflection (002) of the expanded sample by microwave irradiation towards lower values of 2θ and its intensity somewhat higher than that of the starting sample U-20 indicates that its structural order and crystallinity have increased only slightly as observed in Marcos and Rodríguez [30]. The explanation for the fact that the structural order and crystallinity increased in the samples expanded and subsequently immersed in water up to 600 °C, despite a higher loss of water in the expansion process, lies in the fact that up to 600 °C the Ugandan sample did not absorb water, regardless of the immersion time.
Otherwise, the maximum water absorption content was very close 130 mg/g for U-900 for 24 h, followed of 127.1 mg/g for U-900 for 7.5 h and 121.5 mg/g for U-800 for 1.5 h. These values were much higher than those shown in the humidity absorption experiments carried out by Feng et al. [2]. According to Melero and Li [31,32], expanded commercial vermiculites could be a suitable hygroscopic material, due to their efficient water absorption, and mainly those with a composition similar to Ugandan vermiculite.
Probably, the reason why the textural parameters of the microwave-irradiated expanded vermiculite and the raw vermiculite are similar is that they are structurally quite similar, as evidenced by their respective XRD patterns, although their appearance is very different. The same reason can be applied to the behavior of both samples upon immersion in water. Therefore, expansion with microwave radiation, in this case, would not be appropriate. The order of magnitude of the SBET and Vp values of the raw and treated vermiculite from Uganda is similar to the values of the raw and treated sample, at the same temperatures, from China [2]. In addition, in both cases, no correlation of these values with temperature is clearly observed; however, water loss from vermiculite with increasing temperature seems to cause a slight increase in pore volume. On the other hand, it seems that SBET and Vp are independent of the vermiculite purity, remember that Ugandan vermiculite is purer than the Chinese one. The decrease in Vp with increasing heating temperature in Ugandan vermiculite is opposite to what occurs in Chinese vermiculite [2]. In the former the explanation may be as follows: In the first stage of expansion process, the porous channel was formed due to the vapor escape and the porosity was improved. With the increase in heating temperature, the Vp varied slightly, although it remained more or less in the same order of magnitude. The reason is due to the fact that the interlayer structure of vermiculite did not undergo a reduction in interlamellar spacing as the heating temperature increased, according to the XRD results.

5. Conclusions

The decrease in the intensity of the main reflection of the Ugandan vermiculite with increasing temperature is related to the loss of water due to the expansion process, which implies loss of structural order and crystallinity. In addition, in expanded samples and subsequently immersed in water, as the WA values increased, the structural order and crystallinity increased.
The specific superficial area and porosity barely vary with temperature and they are practically independent of the vermiculite purity.
Relatively pure commercial vermiculites, with very low potassium contents, expanded at high temperature could be suitable hygroscopic materials, given their efficient water absorption. Expansion of commercial vermiculites with microwave radiation, in this case, would not be recommended because its water absorption capacity is very similar to that of the raw sample; both samples are structurally very similar although their appearance is very different.

Funding

This research was funded by C.M.

Acknowledgments

The author would like to acknowledge the technical assistance provided at the Scientific-Technical Services, University of Oviedo, Spain, namely, executing X-ray diffraction, fluorescence analyses, thermal gravimetric analyses, and textural parameters.

Conflicts of Interest

The author declares no conflict of interest.

References

  1. Increase in the Number of Combined Tropical Nights (Minimum Temperature Exceeding 20 °C) and Hot Days (Maximum Temperature Exceeding 35 °C) under Present and Future Climate Conditions. Available online: https://www.eea.europa.eu/data-and-maps/figures/ (accessed on 24 April 2021).
  2. Feng, J.; Liu, M.; Mo, W.; Su, X. Heating temperature effect on the hygroscopicity of expanded vermiculite. Ceram. Int. 2021, 47, 25373–25380. [Google Scholar] [CrossRef]
  3. De Silva, G.H.M.J.S.; Surangi, M.L.C. Effect of waste rice husk ash on structural, thermal and run-off properties of clay roof tiles. Constr. Build. Mater. 2017, 154, 251–257. [Google Scholar] [CrossRef]
  4. Thomson, A.; Maskell, D.; Walker, P.; Lemke, M.; Shea, A.; Lawrence, R. Improving the hygrothermal properties of clay plasters. In Proceedings of the International Conference on 16th Non-Conventional Materials and Technologies, Winnipeg, MB, Canada, 10–13 August 2015. [Google Scholar]
  5. Nguyen, D.M.; Grillet, A.-C.; Diep, T.M.H.; Ha Thuc, C.N.; Woloszyn, M. Hygrothermal properties of bio-insulation building materials based on bamboo fibers and bio-glues. Constr. Build. Mater. 2017, 155, 852–866. [Google Scholar] [CrossRef]
  6. Padfield, T.; Jensen, L.A. Humidity buffering of building interiors by absorbent materials. In Proceedings of the 9th Nordic Symposium on Building Physics, Tampere, Finland, 29 May–2 June 2011. [Google Scholar]
  7. Rode, C. Moisture Buffering of Building Materials; Department of Civil Engineering Technical University of Denmark: Lyngby, Denmark, 2005. [Google Scholar]
  8. Padfield, T. The Role of Absorbent Building Materials in Moderating Changes of Relative Humidity. Ph.D. Thesis, The Technical University of Denmark, Lyngby, Denmark, 1998. Available online: https://www.conservationphysics.org/phd//phd-indx.html (accessed on 6 October 2021).
  9. Kim, H.J.; Kim, S.S.; Lee, Y.G.; Song, K.D. The Hygric Performances of Moisture Adsorbing/Desorbing Building Materials. Aerosol Air Qual. Res. 2010, 2010, 625–634. [Google Scholar] [CrossRef] [Green Version]
  10. Fořt, J.; Doleželová, M.; Černý, R. Moisture Buffering Potential of Plasters for Energy Efficiency in Modern Buildings. In Proceedings of the International Environmental Engineering Conference, Vilnius, Lithuania, 27–28 April 2017. [Google Scholar]
  11. Okada, K.; Matsui, S.; Isobe, T.; Kameshima, Y.; Nakajima, A. Water-retention properties of porous ceramics prepared from mixtures of allophane and vermiculite for materials to counteract heat island effects. Ceram. Int. 2008, 34, 345–350. [Google Scholar] [CrossRef]
  12. Valášková, M.; Martynková, G.S.; Smetana, B.; Študentová, S. Influence of vermiculite on the formation of porous cordierites. Appl. Clay Sci. 2009, 46, 196–201. [Google Scholar] [CrossRef]
  13. Tarnai, M.; Mizuguchi, H. Design, construction and recent applications of porous concrete in Japan. In Proceedings of the JCI Symposium on Design, Construction and Recent Applications of Porous Concrete; Concrete Institute: Tokyo, Japan, 2004; pp. 1–10. [Google Scholar]
  14. Bhutta, M.A.R.; Hasanah, N. Properties of porous concrete from waste crushed concrete (recycled aggregate). Constr. Build. Mater. 2013, 47, 1243–1248. [Google Scholar] [CrossRef]
  15. Mohan Ram, P.; Shanmugam, V.; Senthilkumar, P. Impact of particle size of solid desiccant mould on moisture absorption and regeneration time. Renew. Sust. Energy Rev. 2014, 6, 013124. [Google Scholar] [CrossRef]
  16. Midgley, H.G.; Midgley, C.M. The mineralogy of some commercial vermiculites. Clay Miner. Bull. 1960, 23, 142–150. [Google Scholar] [CrossRef]
  17. Couderc, P.; Douillet, P. Les vermiculites industrielles: Exfoliation, caracteristiques mineralogiques et chimiques. Bull. Soc. Fr. Céram. 1973, 99, 51–59. [Google Scholar]
  18. Justo, A.; Perez-Rodriguez, J.L.; Sanchez-Soto, P.J. Thermal studies of vermiculites and mica-vermiculite interstratifications. J. Therm. Anal. 1993, 40, 59–65. [Google Scholar] [CrossRef]
  19. Marcos, C.; Arango, Y.C.; Rodriguez, I. X-ray diffraction studies of the termal behaviour of commercial vermiculites. Appl. Clay Sci. 2009, 42, 368–378. [Google Scholar] [CrossRef]
  20. Marcos, C.; Rodriguez, I. Expansion behaviour of commercial vermiculites at 1000 °C. Appl. Clay Sci. 2010, 48, 492–498. [Google Scholar] [CrossRef]
  21. Hillier, S.; Marwa, E.M.M.; Rice, C.M. On the mechanism of exfoliation of ‘Vermiculite’. Clay Miner. 2013, 48, 563–582. [Google Scholar] [CrossRef] [Green Version]
  22. Justo, A.; Maqueda, C.; Pérez Rodriguez, J.L.; Morillo, E. Expansibility of some vermiculites. Appl. Clay Sci. 1989, 4, 509–519. [Google Scholar] [CrossRef]
  23. de la Calle, C.; Suquet, H. Vermiculite. In Hydrous Phyllosilicates; Bailey, S.W., Ed.; Reviews in Mineralogy; Mineralogical Society of America: Washington, DC, USA, 1988. [Google Scholar]
  24. Argüelles, A.; Leoni, M.; Blanco, J.A.; Marcos, C. Structure and microstructure of Mg-vermiculite. Z. Kristallogr. Suppl. 2009, 30, 429–434. [Google Scholar] [CrossRef] [Green Version]
  25. Argüelles, A.; Leoni, M.; Blanco, J.; Marcos, C. Semi-ordered crystalline structure of the Sta. Olalla vermiculite inferred from X-ray powder diffraction. Am. Mineral. 2010, 95, 126–134. [Google Scholar] [CrossRef]
  26. Thommes, M.; Kaneko, K.; Neimark, A.V.; Olivier, J.P.; Rodriguez-Reinoso, F.; Rouquerol, J.; Sing, K.S.W. Physisorption of gases, with special reference to the evaluation of surface area and pore size distribution (IUPAC Technical Report). Pure Appl. Chem. 2015, 87, 1051–1069. [Google Scholar] [CrossRef] [Green Version]
  27. Justo, A.; Maqueda, C.; Pérez Rodriguez, J.L. Estudio Químico de Vermiculitas de Andalucia y Badajoz. Bol. Soc. Esp. Mineral. 1986, 9, 123–129. [Google Scholar]
  28. Velde, B. High temperature or metamorphic vermiculites. Contrib. Mineral. Petrol. 1978, 66, 319–323. [Google Scholar] [CrossRef]
  29. Marcos, C. Structural Changes in Vermiculites Induced by Temperature, Pressure, Irradiation, and Chemical Treatments. In Clay Science and Technology; Morari Do Nascimento, G., Ed.; IntechOpen Book Series; IntechOpen: London, UK, 2021. [Google Scholar]
  30. Marcos, C.; Rodríguez, I. Expansibility of vermiculites irradiated with microwaves. Appl. Clay Sci. 2011, 51, 33–37. [Google Scholar] [CrossRef]
  31. Melero Tur, S.; García Morales, S.; Neila Gonzalez, F.J. Design and evaluation of a dehumidifying plaster panel for passive architecture integration. Rev. Constr. 2015, 14, 21–28. [Google Scholar] [CrossRef] [Green Version]
  32. Li, Y.; Fazio, P.; Rao, J. An investigation of moisture buffering performance of wood paneling at room level and its buffering effect on a test room. Build. Environ. 2012, 47, 205–216. [Google Scholar] [CrossRef]
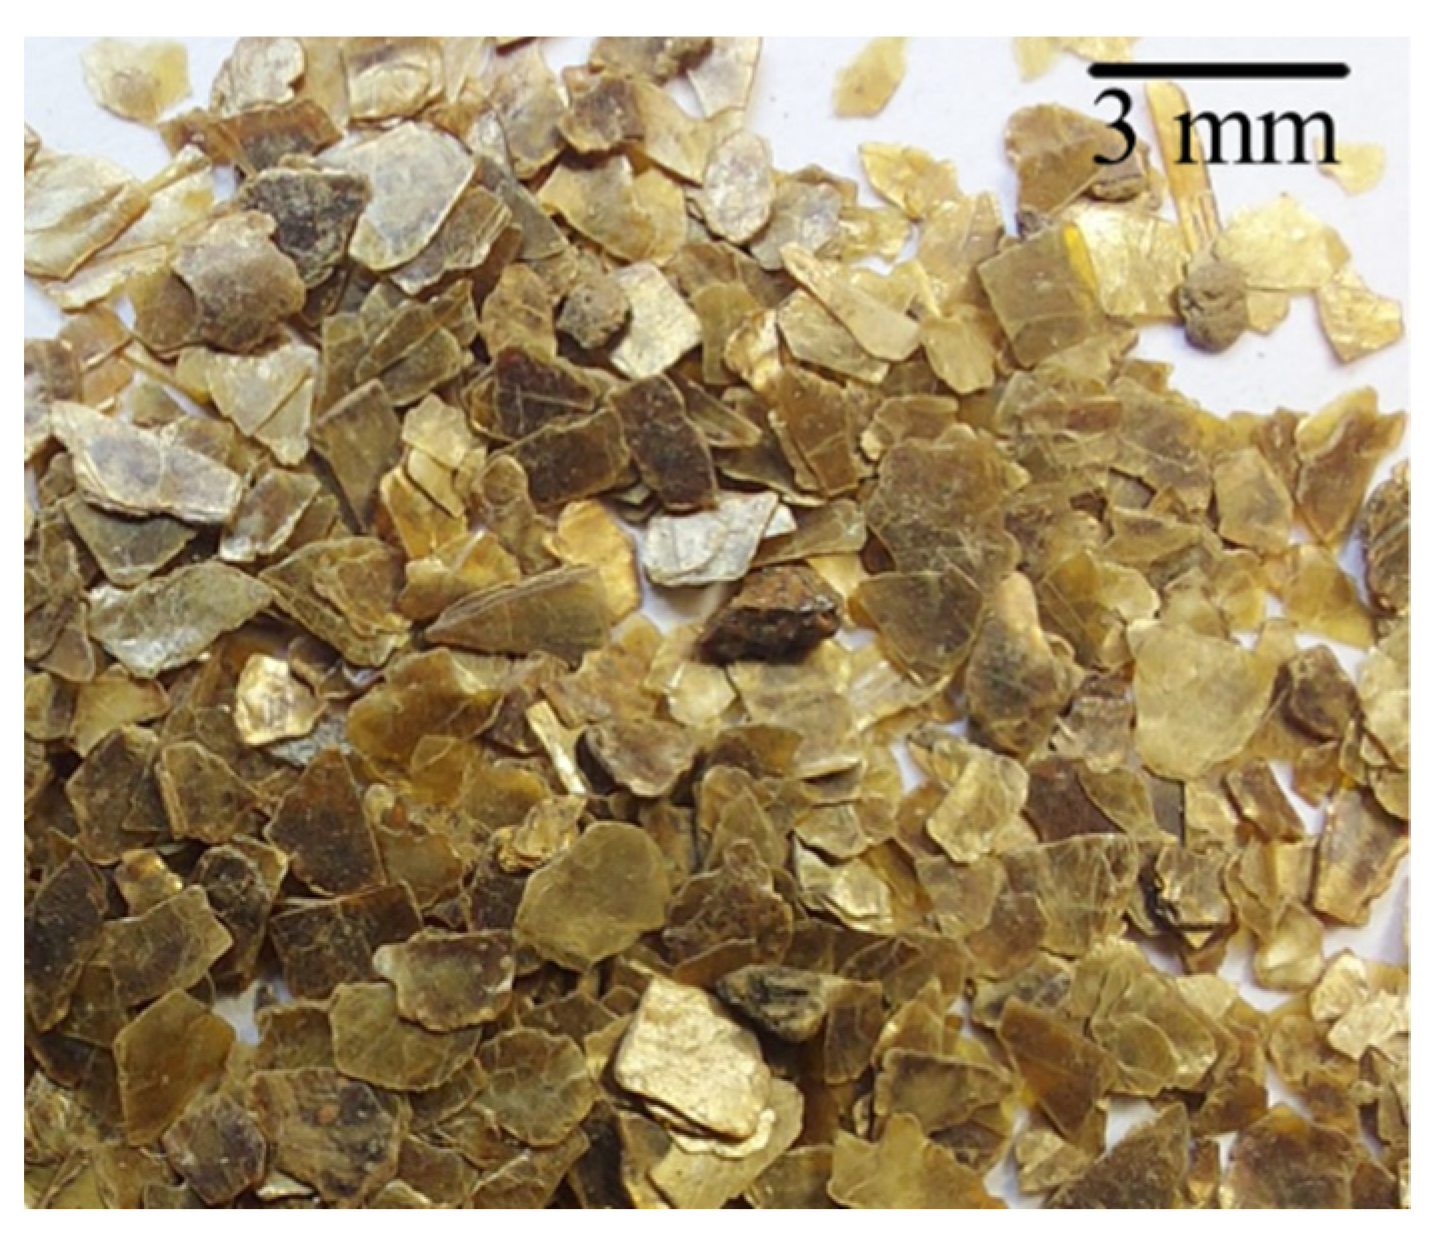
Figure 1. Aspect of raw vermiculite.
Minerals 12 00023 g001
Figure 2. Illustration of the expansibility. (1) Cleaning of vermiculite by hand-picking of minerals other than vermiculite. (2) Weight of the raw sample occupying a volume of 1 mL. (3) Vermiculite expansion by heating in an electric furnace at different temperatures and by microwave irradiation. (4) Measurement of the volume of the expanded vermiculite in (3). (5) Expanded vermiculite weighing. (6) Obtaining expansibility k.
Minerals 12 00023 g002
Figure 3. Illustration of the water immersion experiment of the vermiculite. (1) Cleaning of vermiculite by hand-picking of minerals other than vermiculite. (2) Vermiculite expansion by heating in an electric furnace at different temperatures and by microwave irradiation. (3) Weight of 0.5 g of expanded vermiculite (m0). (4) Immersion of expanded vermiculite in 25 mL of distilled water during different times. (5) Filtered and dried at room temperature (20 °C) of vermiculite. (6) Weight of vermiculite (m). (7) Obtaining WA.
Minerals 12 00023 g003
Figure 4. Aspect of U-900 (a) and U-MW (b).
Minerals 12 00023 g004
Figure 5. X-ray diffraction patterns of the pristine and treated samples.: (a) Pristine and expanded samples; in the inset X-ray diffraction patterns showing the principal reflection 002 at 14.50 Å. (b) Pristine and expanded samples after immersion in water; in the inset X-ray diffraction patterns showing the principal reflection 002 at 14.67 Å.
Minerals 12 00023 g005
Figure 6. Temperature dependence of the mass loss, TG-curve, for Ugandan samples: pristine, heat-treated and microwave-irradiated. In the inset, temperature dependence of the mass loss, TG-curve, for Ugandan samples: pristine and heat-treated (600 °C and 900 °C) and microwave-irradiated and their counterparts after immersion in distilled water.
Minerals 12 00023 g006
Figure 7. SDTA curves for Ugandan samples: pristine, heat-treated and microwave-irradiated. In the inset, SDTA curves for Ugandan samples: pristine and heat-treated (600 °C and 900 °C) and microwave-irradiated and their counterparts after immersion in distilled water.
Minerals 12 00023 g007
Figure 8. Nitrogen adsorption–desorption isotherms of raw and treated vermiculites at different temperature: (a) 20 °C; (b) 300 °C; (c) 400 °C; (d) 500 °C; (e) 600 °C; (f) 700 °C; (g) 800 °C; (h) 900 °C, and microwave irradiated (i).
Minerals 12 00023 g008aMinerals 12 00023 g008b
Table 1. Major elements mass percentages expressed in oxides.
Element Oxides Mass%
SiO234.96
Al2O312.05
Fe2O38.38
MnO0.11
MgO21.52
CaO0.36
Na2O0.14
K2O0.36
TiO21.42
P2O50.11
L.O.I.20.52
TOTAL99.92
Table 2. The expansibility k and its evolution with the temperature of the studied samples.
T °CK Minerals 12 00023 i001
U-201.00
U-3001.03
U-4001.12
U-5001.51
U-6002.54
U-7003.07
U-8003.76
U-9004.55
U-MW3.50
Table 3. The WA content (mg/g) with time of the vermiculite heated at temperatures between 700 °C and 900 °C.
Time (h)U-700U-800U-900
0.54.771.1106.3
10.879.3105.6
1.54.1121.568.5
23.066.2112.5
2.52.467.088.8
3.52.669.229.3
5.54.668.838.3
7.52.265.5127.1
9.52.067.5101.9
11.53.569.784.6
232.070.667.0
244.172.0129.6
Table 4. Mass loss (%) in the two steps.
Mass Loss (%)
Sample1st Step2nd Step
U-2015.64.5
U-0.515.03.6
U-30014.94.3
U-40014.74.0
U-50014.84.0
U-60014.53.9
U-600-3.514.93.6
U-70014.14.0
U-80012.54.1
U-9006.33.6
U-900-249.93.7
U-MW14.24.0
U-MW-3.514.84.0
Table 5. Specific surface area (SBET), adsorption capacity (Qm), pore volume (Vp), BET constant C, and correlation coefficient (R2) results from adsorption-desorption nitrogen measurements for raw and treated vermiculites.
SampleSBET (m2/g)Qm (mmol/g STP)Vp (mmol/g STP)Pore Size (nm)CR2
U-2011.7 ± 0.10.120.0052.9355.10.9999
U-20-0.515.7 ± 0.10.160.042.93109.30.9998
U-3008.0 ± 0.00.080.022.93303.60.9999
U-4006.6 ± 0.10.070.032.9360.60.9996
U-50014.6 ± 0.00.150.042.79164.60.9999
U-60018.1 ± 0.00.190.052.52180.60.9999
U-600-3.517.9 ± 0.10.180.052.52156.60.9999
U-70012.2 ± 0.10.130.042.52135.30.9999
U-80018.3 ± 0.00.180.062.93282.60.9999
U-90013.2 ± 0.00.140.062.52184.70.9999
U-900-2416.9 ± 0.00.170.062.52163.20.9999
U-MW11.0 ± 0.00.110.023.24168.40.9999
U-MW-3.515.6 ± 0.00.160.042.79144.40.9999
Publisher’s Note: MDPI stays neutral with regard to jurisdictional claims in published maps and institutional affiliations.