Article

Study on the Effect of Bond Strength on the Failure Mode of Coarse-Grained Sandstone in Weakly Cemented Stratum

1
School of Resources and Environmental Engineering, Jiangxi University of Science and Technology, Ganzhou 341000, China
2
College of Mining and Geomatics, Hebei University of Engineering, Handan 056038, China
*
Author to whom correspondence should be addressed.
Minerals 2022, 12(1), 55; https://doi.org/10.3390/min12010055
Submission received: 4 November 2021 / Revised: 22 December 2021 / Accepted: 30 December 2021 / Published: 31 December 2021

Abstract

:
Bond strength is one of the most important parameters and can affect the macroscopic mechanical properties and the damage state of rock to some degree. Coarse-grained sandstone was studied using the controlled variable method. The influence of parallel bond strength on the peak strength and failure mode of coarse-grained sandstone was simulated, and the evolution law of peak strength and the failure mode of bond strength were comprehensively analyzed. The results show that the peak strength of the rock was positively correlated with the bond strength; the difference in quantity between the tensile and shear cracks was negatively correlated with tensile bond strength and positively correlated with shear bond strength. With a tensile-shear bond strength ratio of less than 0.5, the peak strength of the rock was usually stable at the certain extreme value under a constant tensile bond strength. The tensile cracks were negatively correlated with the tensile-shear bond strength ratio, and the shear cracks were positively correlated with the tensile-shear bond strength ratio. The main failure mode of the coarse-grained sandstone in the weakly cemented stratum of the Hongqinghe coal mine is shear failure. The research results can be used to guide the ground control of other mine stopes or roadways with weak cementation lithology.

1. Introduction

Weakly cemented coal measures are widespread in western China. However, the diagenesis environment in western China is different from that in central and eastern China [1]. Insufficient diagenesis results in the low strength, easy disintegration, easy weathering, and poor cementation of weakly cemented rock; once exposed to water, weakly cemented rock tends to be muddy [2]. As a result, the failure, rupture, and fracture of the surrounding rock under mining disturbance in the western mining area are different from those in the central/eastern mining area [3]. When the macroscopic cracks of weakly cemented rock do not run from one end to the other end, the rock can be considered as an entirety. When the main failure occurs, the rock becomes a loose mass, which has an important connection with the cementation performance of the rock. Bond strength is an important index to characterize the performance of rock cementation. The mechanical properties and failure mode of weakly cemented rocks can be further explored by studying the relationship between bond strength and rock strength.
The discontinuous deformation analysis (DDA) was developed by Shi and Goodman. The DDA accounts for the deformability of blocks through implicit integration, adopting hard contact [4,5,6]. The combined finite–discrete element method (FDEM) was proposed by Munjiza [7,8,9]. Its basic idea is to divide three–node constant strain triangular elements inside the continuum and insert four-node initial zero-thickness joint elements as bonding on the common edge of adjacent triangular elements so that each triangular element does not share nodes [10]. The DDA and the FDEM are used to focus mainly on tunnelling, caverns, fracturing, and fragmentation processes of geological and structural materials, especially in actual engineering case simulation.
The discrete element method (DEM) was originally developed by Cundall and Strack for the analysis of rock mechanics problems [11]. The DEM is a suitable method for the simulation of the dynamical behavior of an assembly of particles. This approach explicitly provides the mechanical behavior of the individual particles and their contacts. It allows finite displacements and rotations of discrete particles to be calculated and new contacts to be detected automatically. This causes changes in the contact status, and interaction forces influence the subsequent movement of bodies. The translational and rotational displacements of each particle are obtained by explicitly integrating the governing differential equations based on Newton’s second law of motion [12]. The particle flow discrete element method has been widely used to study the microscopic mechanical properties of rocks. In the PFC software, the particle flow discrete element method is used as the basis for the theory, the rigid bodies with masses are used as particles, and the interaction motion and force action between the particles are studied to solve the macroscopic and complex practical problems. Therefore, this paper uses DEM to study the failure mode of coarse-grained sandstone.
To date, the relationship between the micro-parameters and macro-mechanical properties of rocks has been studied by PFC software [13,14,15,16,17,18,19,20,21,22,23,24]. Potyondy proposed a new stress corrosion model to simulate static fatigue curves and the damage mechanisms and deformation behavior of granite [25]. By adjusting the microscopic parameters, the numerical model results conform to the stress–strain curve of granite tested indoors [26]. Manso presented a methodology to implement a clumped particle model that simulates the mechanical behavior of granite [27]. Abi analyzed the quantitative relationship between the micro-parameters and the macro-parameters by means of variable control, and the results of the laboratory tests were consistent with those of the numerical simulation, indicating that the micro-parameter results were reliable [28]. Cong analyzed the correlation between the macroscopic mechanical characteristics of the rock and the microscopic parameters using loading and unloading tests on marble. The elastic modulus of the parallel bond was linearly related to the macroscopic elastic modulus; in particular, the secondary failure surface of the rock sample decreased with the increase in the friction factor [29]. Zhao discussed the influence of some of the microscopic parameters of the parallel bonding model on the macroscopic deformation parameters [30]. Su analyzed the effect of particle size on macro-mechanical properties using uniaxial compression simulation tests [31]. Through different experimental design methods, Yoon obtained microscopic parameters that had a significant influence on the failure characteristics of the model [32]. Using numerical experiments, Yang fitted the approximate expressions of the compressive strength, elastic modulus, and Poisson’s ratio of the parallel bonding model [33]. Xu developed a fine-scale structural model of limestone and obtained its microscopic and mechanical parameters [34]. Through uniaxial compression and Brazilian splitting tests, Deng concluded that the peak strength of hard rocks was mainly influenced by the bond strength [35]. Saadat investigated the effect of grain size on the mechanical properties and cracking response of granite containing cracks [36]. By adjusting the model parameters, the behavior of the model rock prior to the peak strength phase was very similar to the behavior observed in the laboratory results [37]. Lie proposed a coupled hydro-grain-based discrete element method model to simulate the fluid-driven micro-behavior of heterogenous rock [38].
In previous studies, the relationship between the macroscopic mechanical properties and micro-parameters of rocks was discussed from different perspectives. It was pointed out that microscopic parameters determine the mechanical behavior characteristics of rocks. Hard rocks were mainly studied in these studies, while soft rocks have been rarely discussed. In western China mines, the rock strength of most coal seams is relatively low, and the surrounding rock of roadways is subject to frequent deformation. It is of guiding significance for roadway support to deeply study the influence of weakly cemented rocks.
Considering the real conditions of weakly cemented rocks in western mining areas, the influence of the bond strength on the peak strength and the failure mode of the rocks were investigated through numerical simulation. This paper provides a basis and reference for further understanding of the relationship between the strength of weakly cemented rocks and the development of cracks in surrounding rocks after engineering disturbances.

2. Methods

Previous research has shown that the parallel bond model (PBM) and the discrete element particle model can be used to simulate many kinds of mechanical properties of rock-like materials [32]. The tensile bond strength and shear bond strength in the parallel bond model have a great influence on the change in peak strength and the evolution of the failure mode.
The research results of previous scholars generally concerned the study of multiple micro-parameters and macro-parameters, and there were few studies on the macroscopic properties of rock using a single parameter. This article only studies the influence of bond strength (tensile bond strength and shear bond strength) on rock failure.
Based on the basic mechanical properties of the weakly cemented coarse-grained sandstone in Hongqinghe coal mine, rock with a peak strength of less than 40 MPa was used for analysis. This was according to the basic mechanical data of coarse-grained sandstone in Hongqinghe coal mine and the parameter of previous research [31]. When running PFC2D software, the model shape was determined to be a cylinder with a diameter of 0.5 and a height of 1. The loading method was uniaxial compression, the two-dimensional granular flow coarse-grained sandstone model was constructed, and the main parameters of the model were specified (Table 1). The stopping condition was set to 20% of the peak strength, and all parameter units were selected based on international standards. After the completion of the numerical simulation test, the experimental data were collated and recorded. Since coarse-grained sandstone with a peak strength of less than 40 MPa was used, the upper limits of the tensile bond strength and shear bond strength were considered. For simplicity, it was assumed that the same values of tensile bond strength and shear bond strength were the maximum values of the peak strength of the coarse-grained sandstone model within the numerical range as shown in Figure 1.
According to Figure 1, the bond strength was less than 40 MPa, the peak strength ranged from 1–27 MPa. When the value of the bond strength was the integer, the number of the experimental results was 27 × 27 = 729, which is a large amount of data. If the value of the bond strength was taken as an integral multiple of 5, the number of the experimental results was 6 × 6 = 36, which made it difficult to characterize the macro-parameter law of the rock. For the above reasons, the integral multiple of 2 was selected as the value of the bond strength, and the total number of experimental results was 14 × 14 = 196.

3. Results

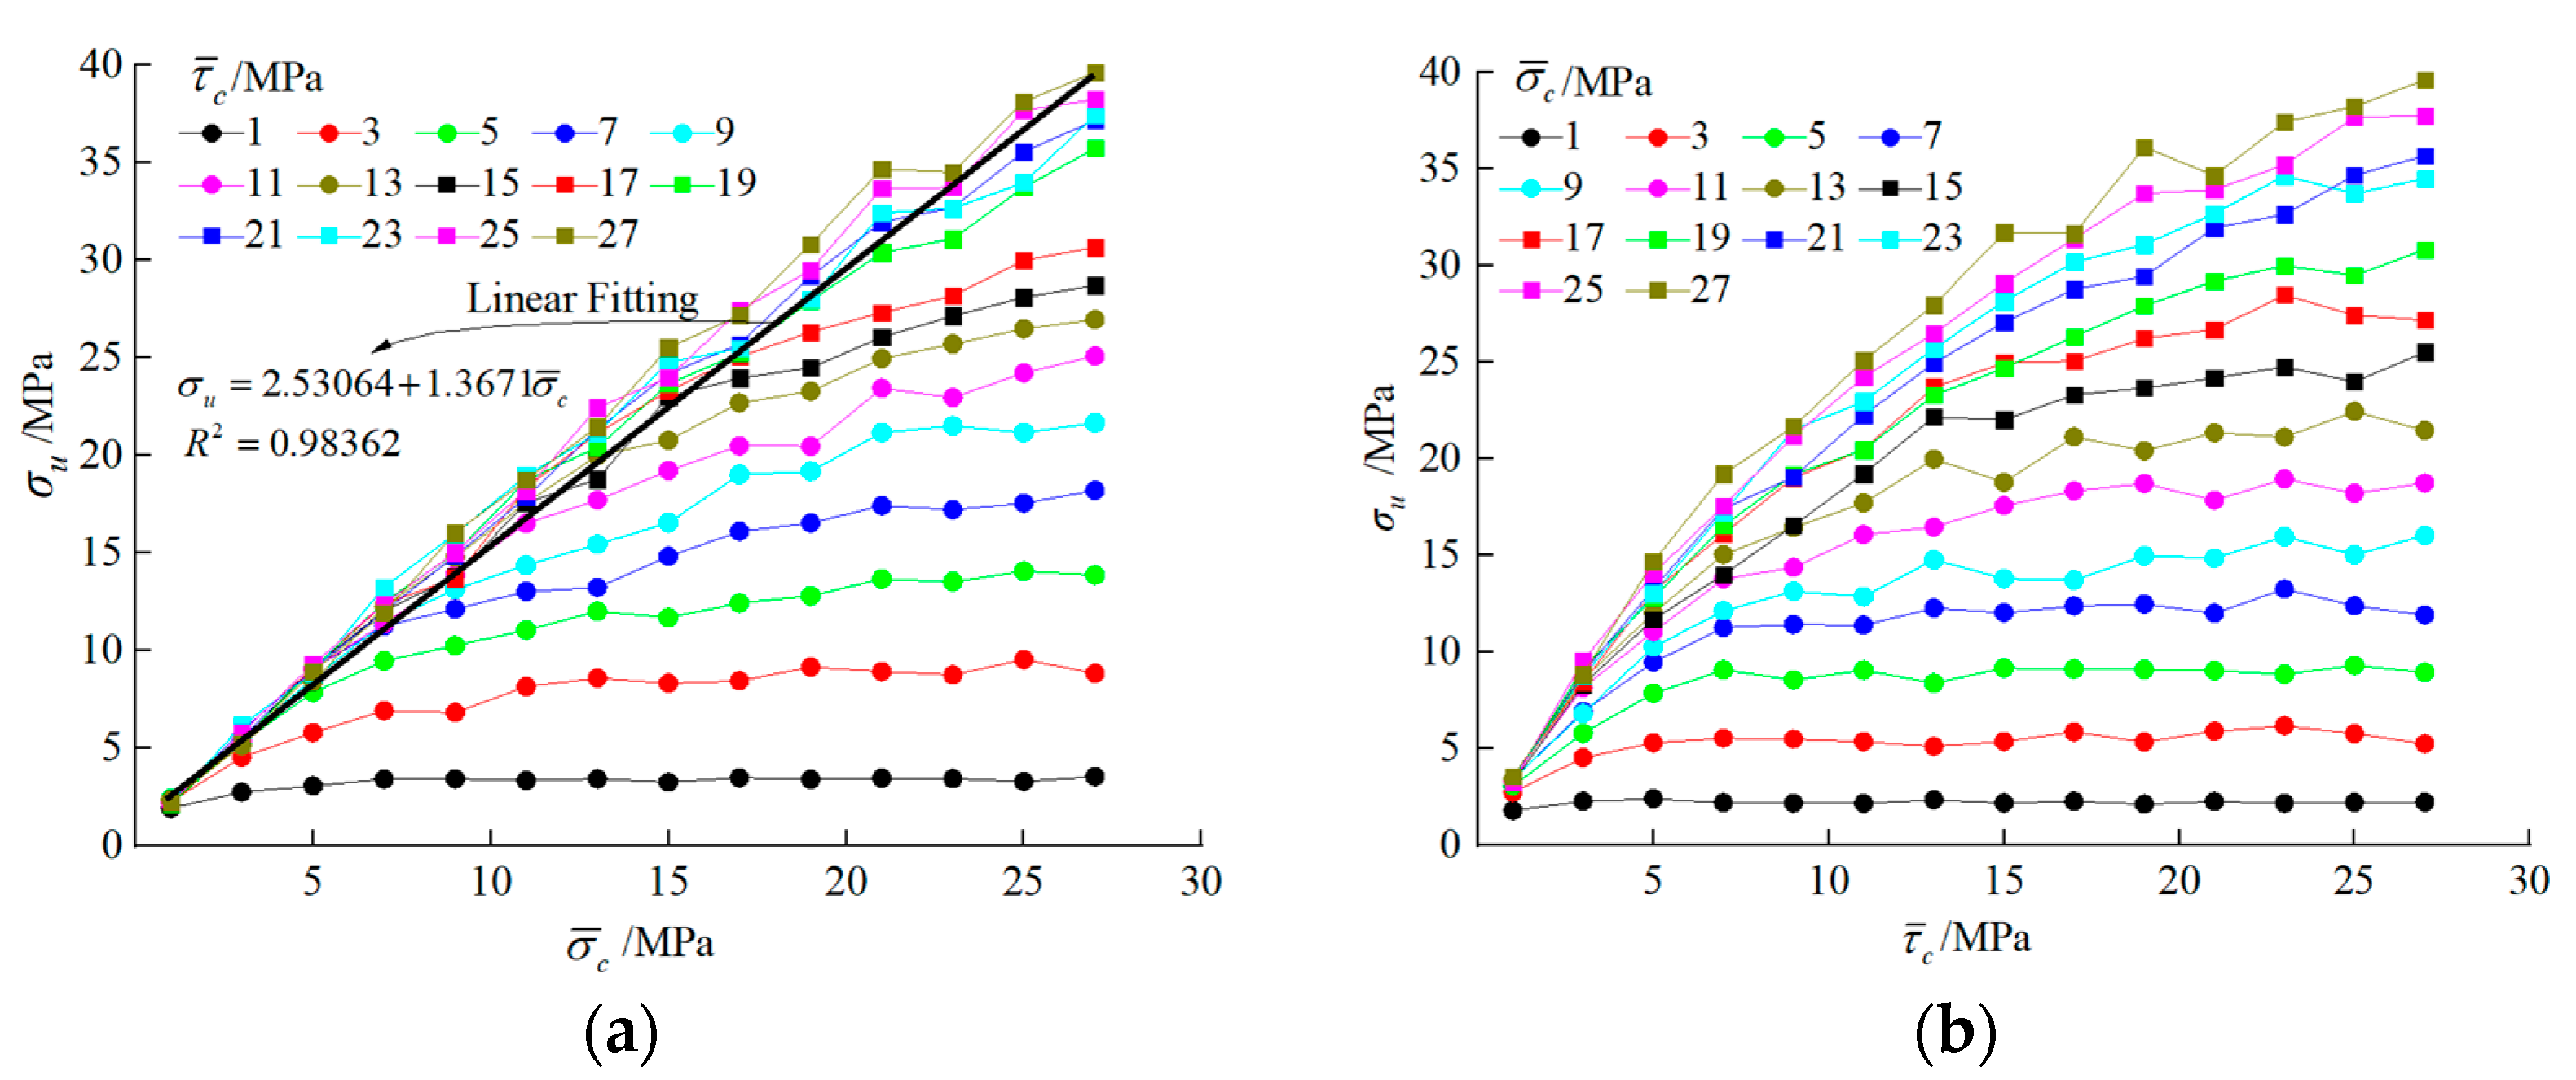
3.1. Relationship between Bond Strength and Peak Strength

Figure 2a shows the effect of the tensile bond strength on the peak strength. When the shear bond strength was 1 MPa, the change in the tensile bond strength had little effect on the peak strength. When the shear bond strength was 3–17 MPa, the growth rate of the curve decreased when the two bond strengths were equal. When the shear bond strength was 19–27 MPa, the relationship between the peak strength and the tensile bond strength had a linearly increased relationship as discussed below.
Figure 2b shows the effect of the shear bond strength on the peak strength. It can be seen that when the tensile bond strength was 1–13 MPa, the peak strength increased rapidly at first and then increased slowly; when the upper limit of the peak strength was reached, it no longer increased. However, when the tensile bond strength was 13–27 MPa, there was no upper limit of the peak strength.
Through the comparison of Figure 2, it can be seen that the relationship between the peak strength and the tensile bond strength was positively correlated, and the relationship between the peak strength and the shear bond strength was positively correlated. However, the influence of the tensile bond strength and the shear bond strength on the peak strength was different. Through the comparison, the relationship between the peak strength and the shear bond strength can be divided into three stages: if the shear bond strength ranged from 1 to 7 MPa, the peak strength was in the accelerated increase stage; if the shear bond strength ranged from 9 to 17 MPa, the peak strength was in the slow increase stage; and if shear bond strength ranged from 19 to 27 MPa, the peak strength was in the stable fluctuation stage. The relationship between the peak strength and the tensile bond strength also experienced a three-stage change, which was more convergent than that between the peak strength and the shear bond strength. In addition to this, if the tensile bond strength or the shear bond strength increased, the value of the peak strength did not change from the curve of the tensile bond strength or the shear bond strength of 1 MPa. Because the rock formations mined in western mines are mostly weakly cemented rock formations, the rock strength was generally low, and the tensile bond strength was more important than the shear bond strength for the rock strength adjustment. The focus of future research can be on the influence of the tensile bond strength on other low-strength weakly cemented rocks.

3.2. Effect of Bond Strength on Failure Mode

Under uniaxial compression, tensile and shear cracks were generated on the rock by tensile and shear bond fractures caused by stress. If there were more tensile cracks than shear cracks, the failure mode would have been tensile failure; otherwise, it would have been shear failure. In this paper, the failure mode was characterized by the difference in quantity between the tensile cracks and shear cracks (Cd ). If the difference in quantity between the tensile cracks and shear cracks was positive, the failure mode would have been tensile failure. If the difference in quantity between the tensile cracks and shear cracks was negative, the failure mode would have been shear failure. If the difference in quantity between the tensile cracks and shear cracks was zero, the failure mode would have been composite tensile-shear failure.
Figure 3a shows the effect of tensile bond strength on the difference in quantity between the tensile cracks and shear cracks. It can be seen that there was a negative correlation between the tensile bond strength and the difference in quantity between the tensile cracks and shear cracks. When the shear bond strength was 1 MPa, the difference in quantity between the tensile cracks and shear cracks rapidly decreased from a positive value to a negative value and then tended to be stable. When the shear bond strength was 3–13 MPa, the difference in quantity between the tensile cracks and shear cracks decreased slowly from a positive value to a negative value. When the shear bond strength was 15–27 MPa, the difference in quantity between the tensile cracks and shear cracks was positive.
Figure 3b shows the effect of the tensile bond strength on the difference in quantity between the tensile cracks and shear cracks. It can be seen that there was a positive correlation between the difference in quantity between the tensile cracks and shear cracks and tensile bond strength. When the tensile bond strength was 1 MPa, the difference in quantity between the tensile cracks and shear cracks was positive. When the tensile bond strength was 3–27 MPa, the difference in quantity between the tensile cracks and shear cracks increased rapidly at first, then increased slowly, and then gradually increased from a negative value to a positive value.
When the tensile bond strength increased, the shear bond was broken before the tensile bond, and then shear cracks were generated. That is, as shown in Figure 3a, with the increase in tensile bond strength, the difference in quantity between the tensile cracks and shear cracks decreased, more shear cracks were generated, and the failure mode of rock transferred from tensile failure to shear failure. When the shear bond strength increased, the tensile bond was broken before the shear bond, and tensile cracks were generated. As shown in Figure 3b, with the increase in shear bond strength, more tensile cracks were generated, the difference in quantity between the tensile cracks and shear cracks increased, and the failure mode of the rock changed from shear failure to tensile failure. Studying the failure modes of weakly cemented rocks is the prerequisite for exploring the failure laws of rock formations in western mining areas. The control strength of the rock formations is an important factor for the safe production of the mine. Further research on the failure modes of the rocks is needed.

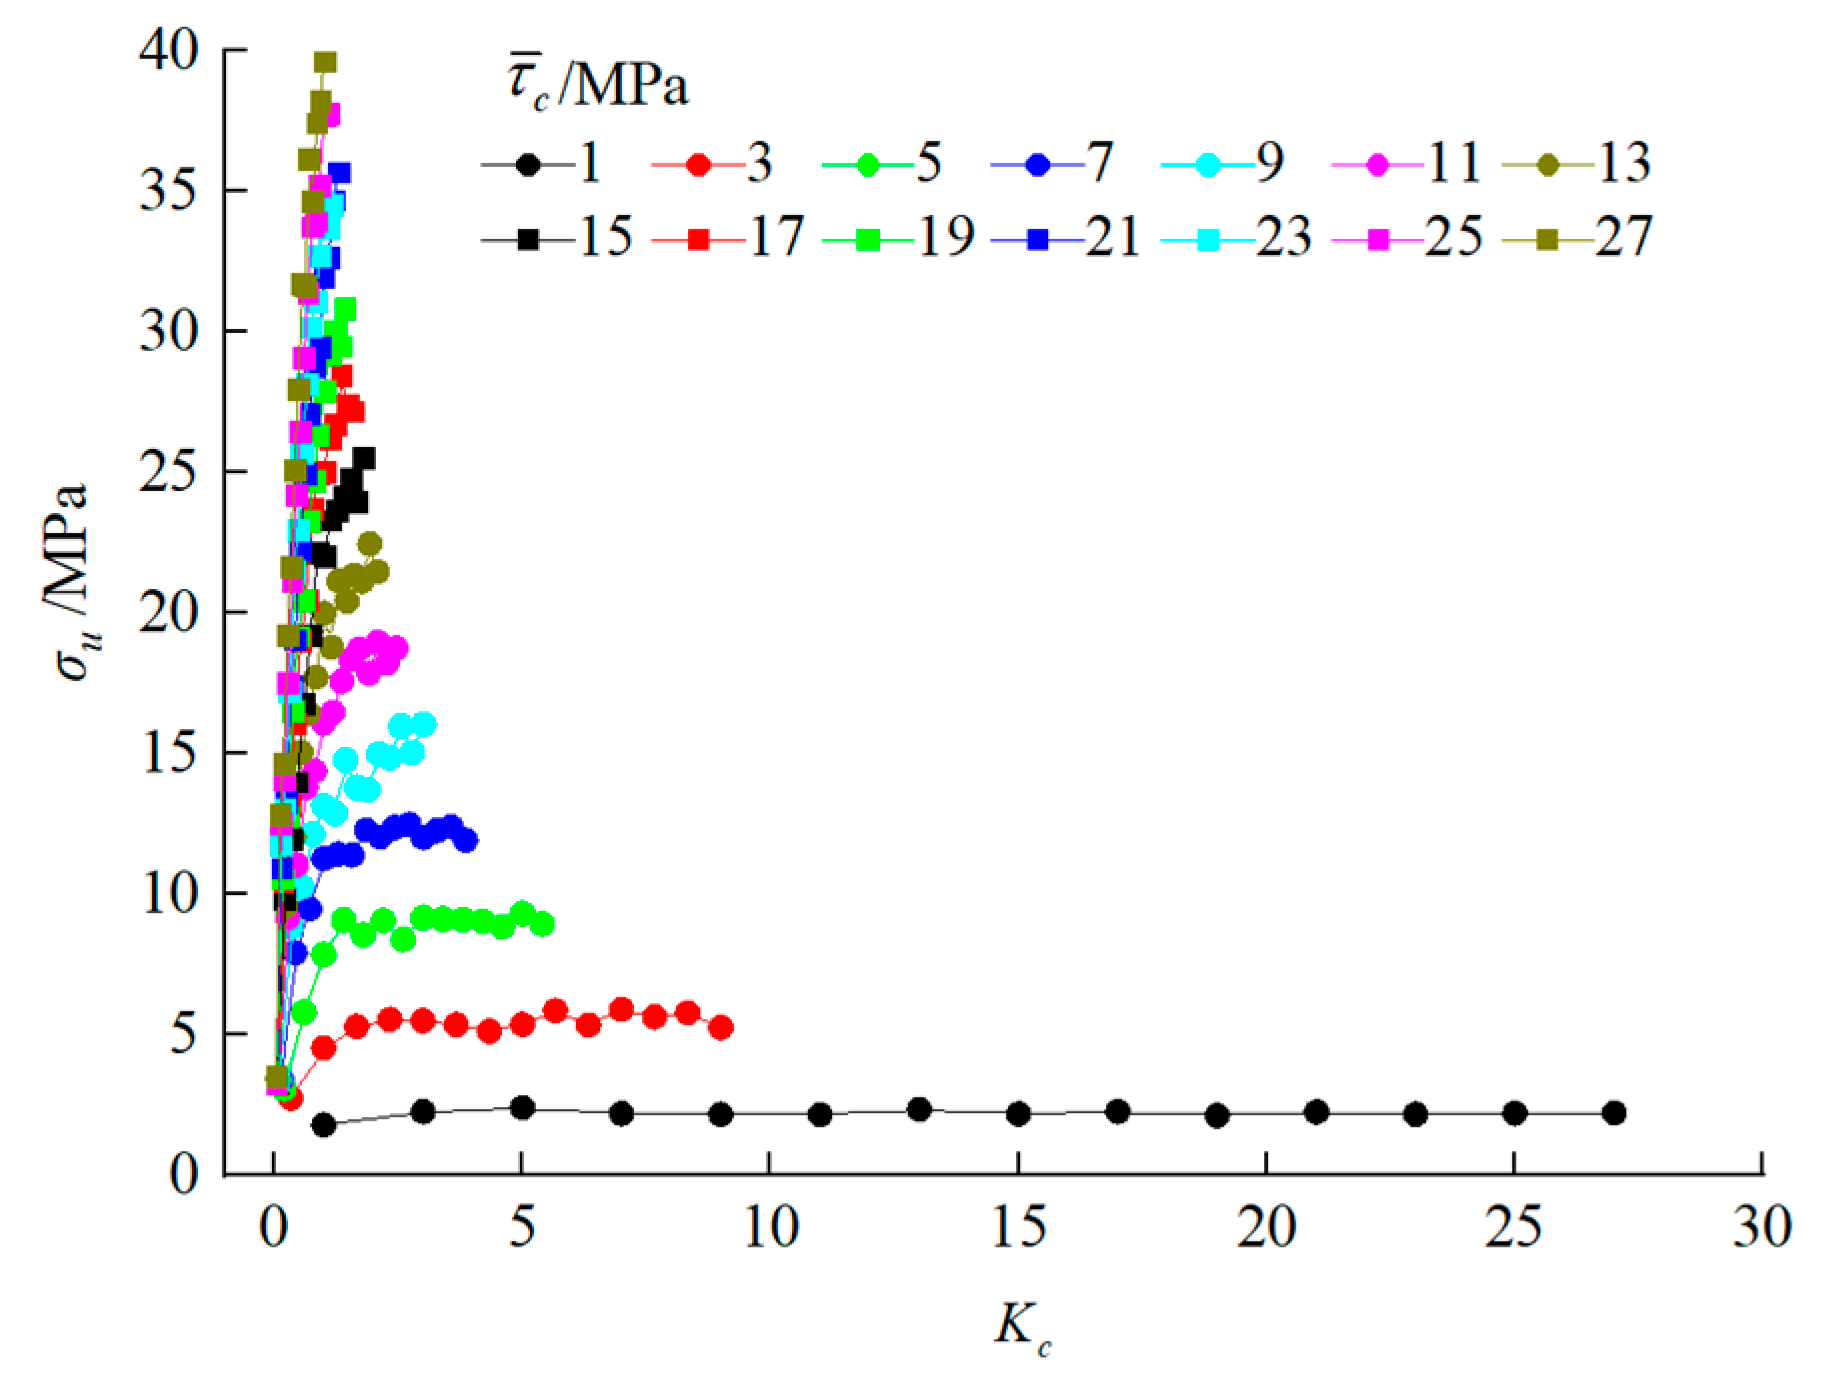
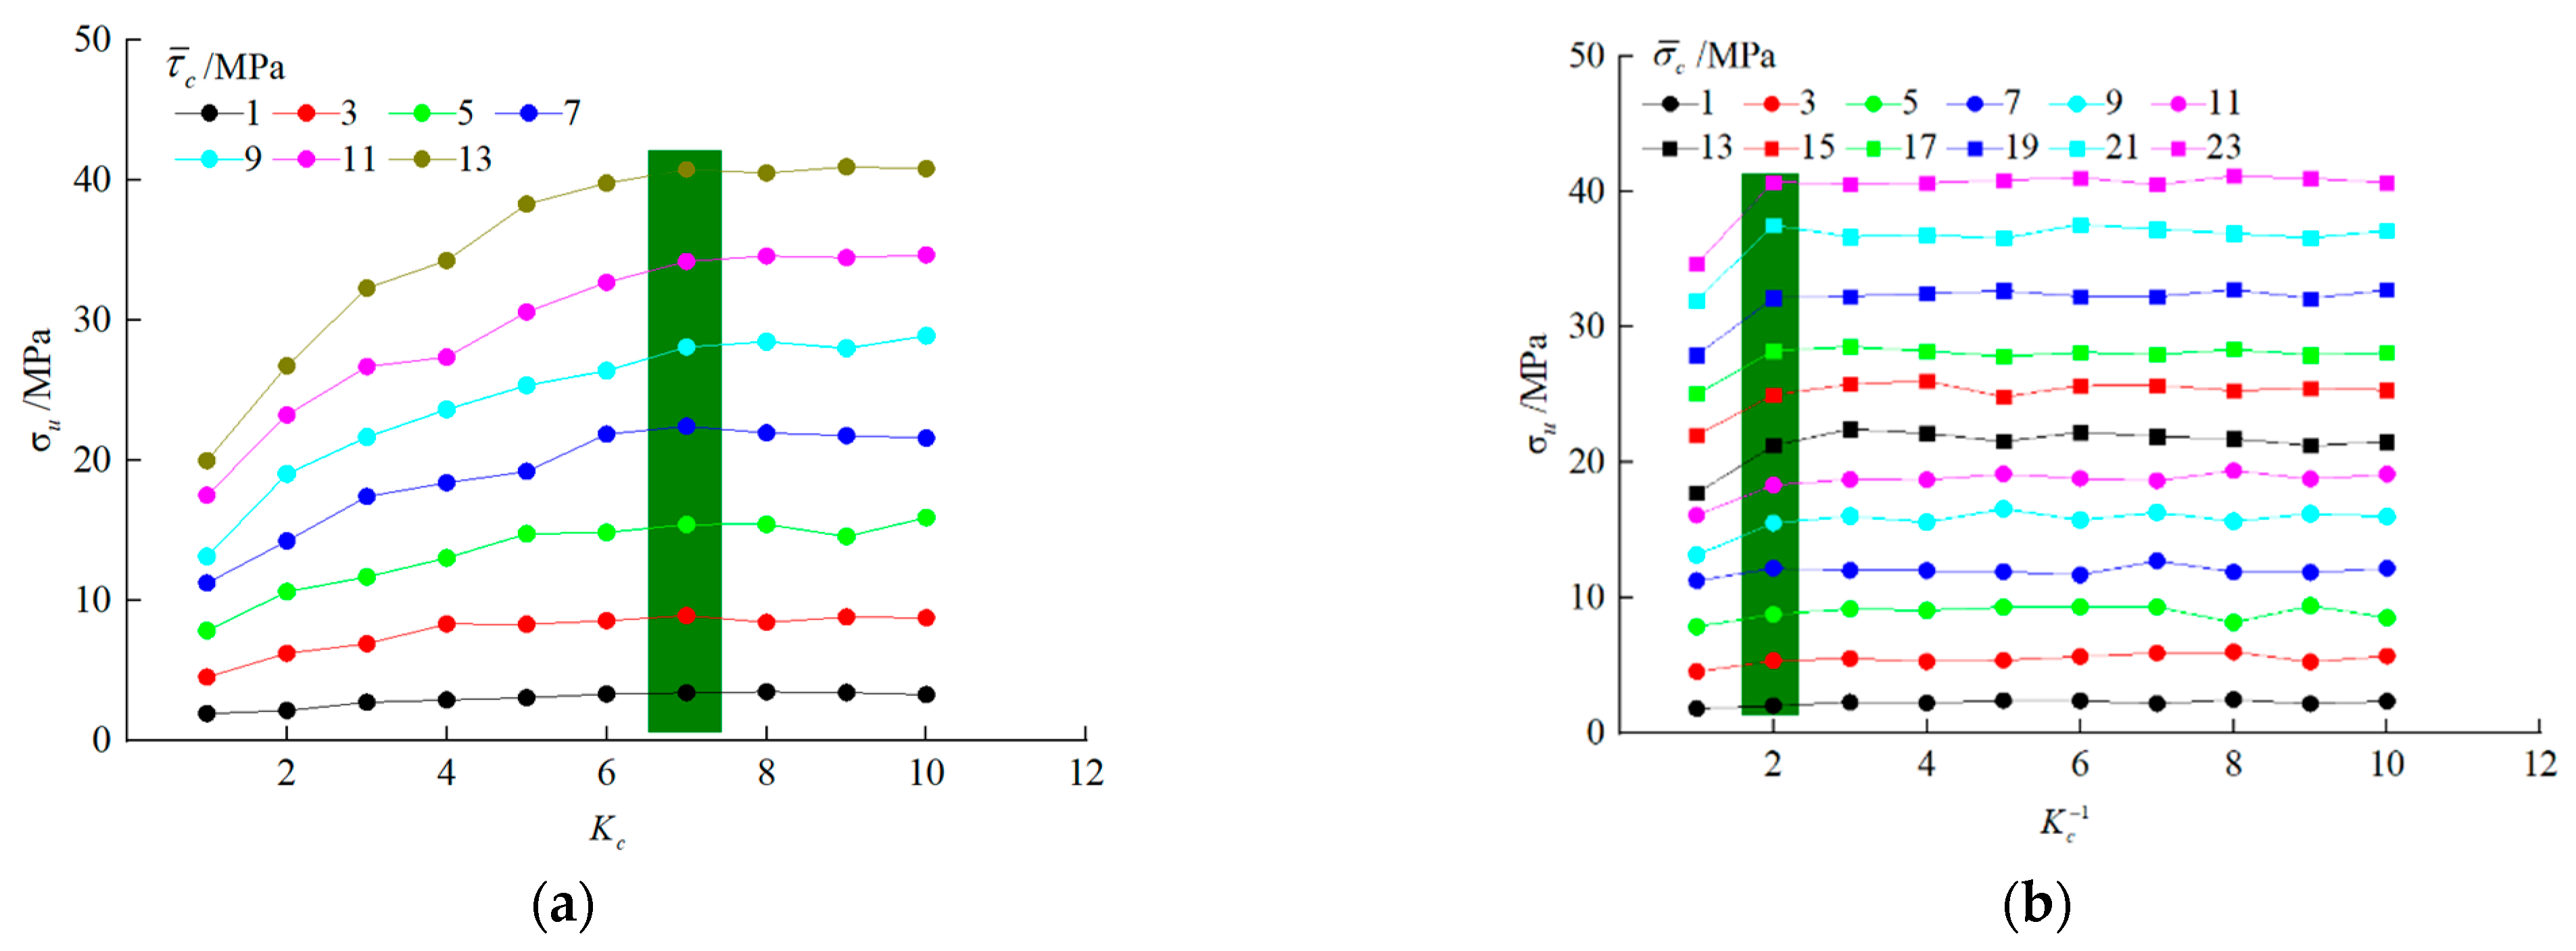
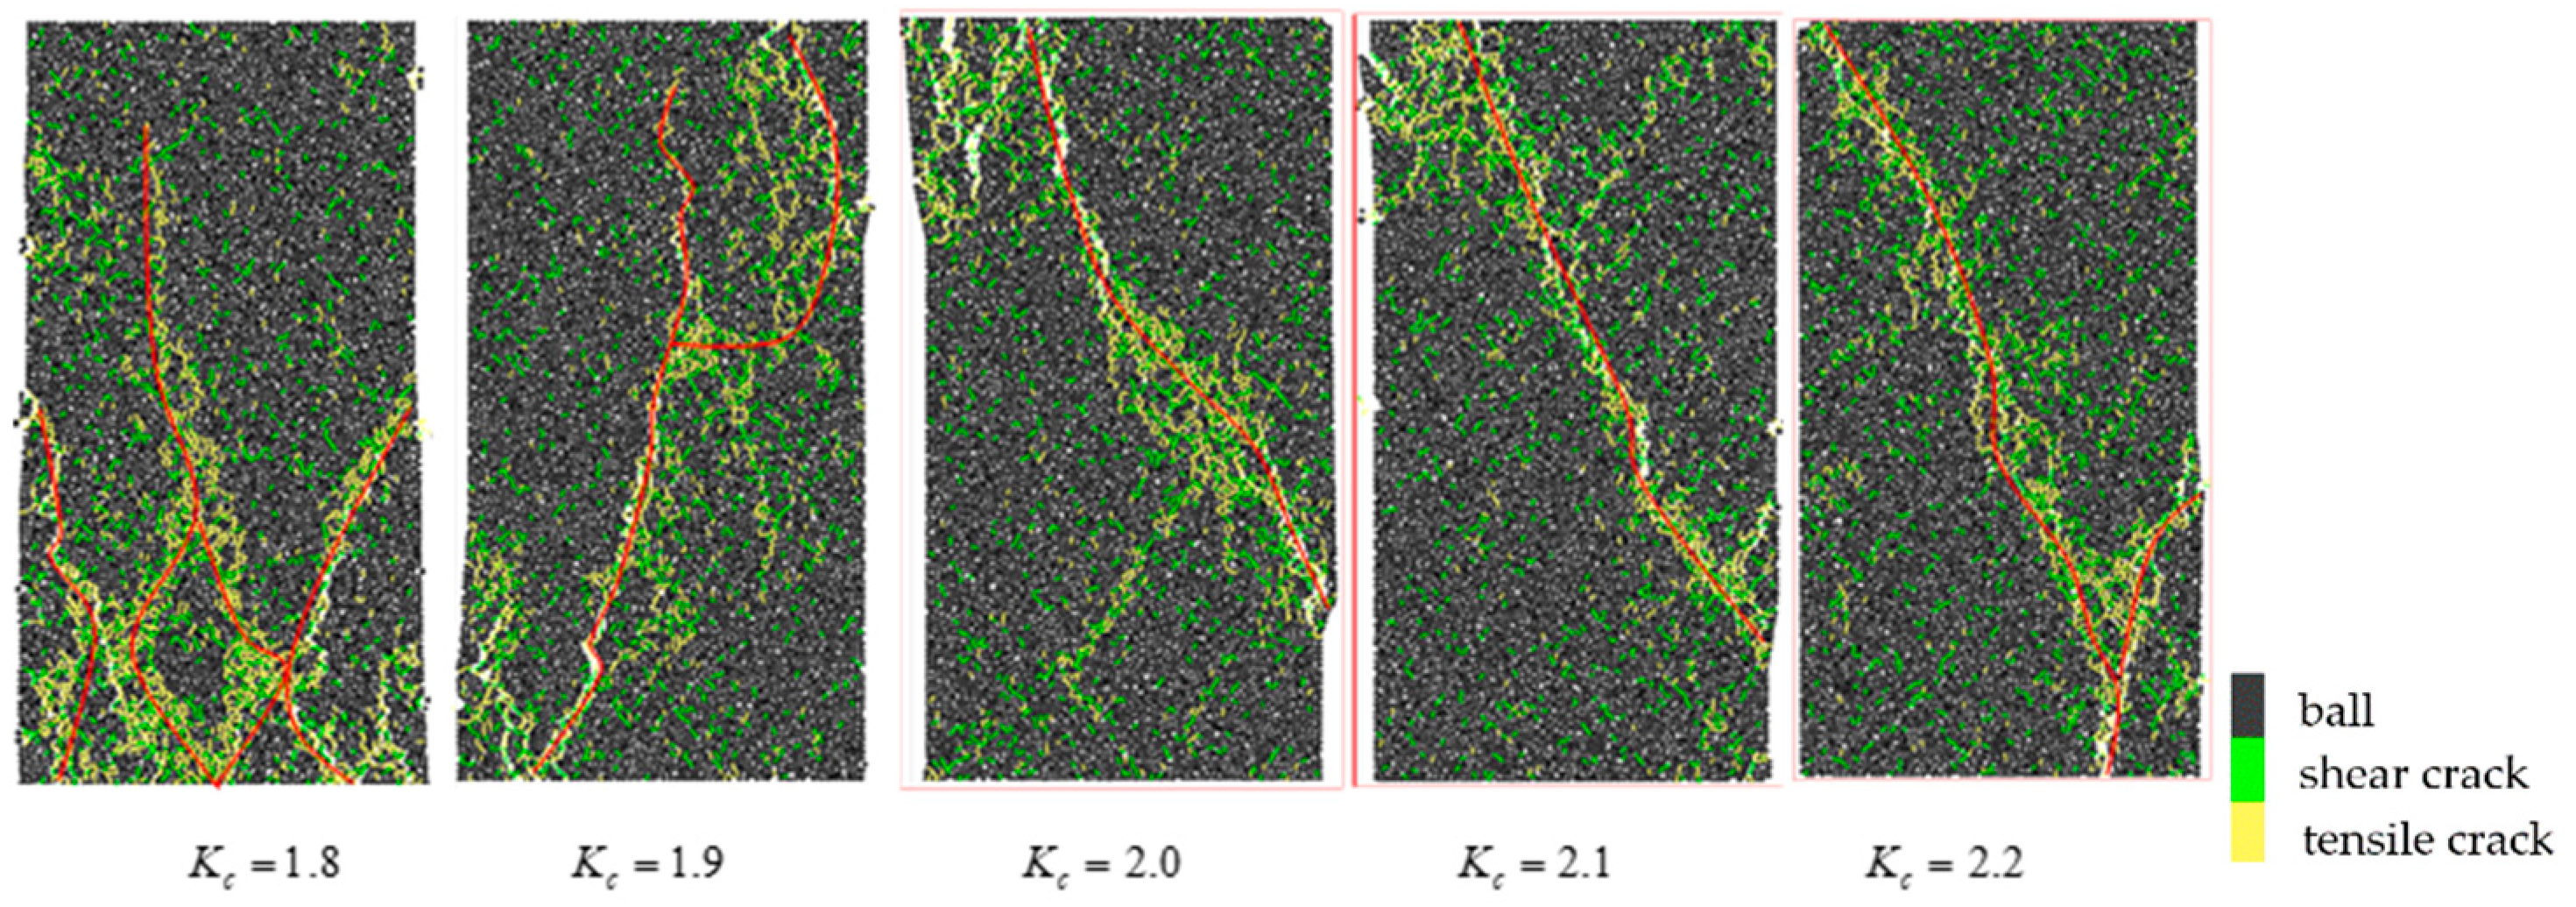
3.3. Effect of Tensile−Shear Bond Strength Ratio

In this section, the influence of the tensile−shear bond strength ratio (Kc) on the peak strength of the rock is accurately characterized. Figure 4 shows the effect of the tensile–shear bond strength ratio on the peak strength. When the shear bond strength was 1–7 MPa, the peak strength increased to the maximum value, and the increase in the tensile−shear bond strength ratio had little effect on the peak strength. Combining Figure 3, it can be seen that the peak strength had the maximum value in the same two bond strengths. As shown in Figure 4, the rock with a shear bond strength of more than 7 MPa also had the maximum value.
Figure 5 shows the effect of the tensile-shear bond strength ratio on the difference in quantity between the tensile cracks and shear cracks. When the tensile-shear bond strength ratio was less than 2, the difference in quantity between the tensile cracks and shear cracks was more than 0, and tensile failure occurred in the rock. When the tensile–shear bond strength ratio was more than 2, the difference in quantity between the tensile cracks and shear cracks was less than 0, and shear failure occurred in the rock. When the tensile-shear bond strength ratio was 2, the difference in quantity between the tensile cracks and shear cracks was 0, and the composite tensile–shear failure occurred in the rock.

4. Discussion

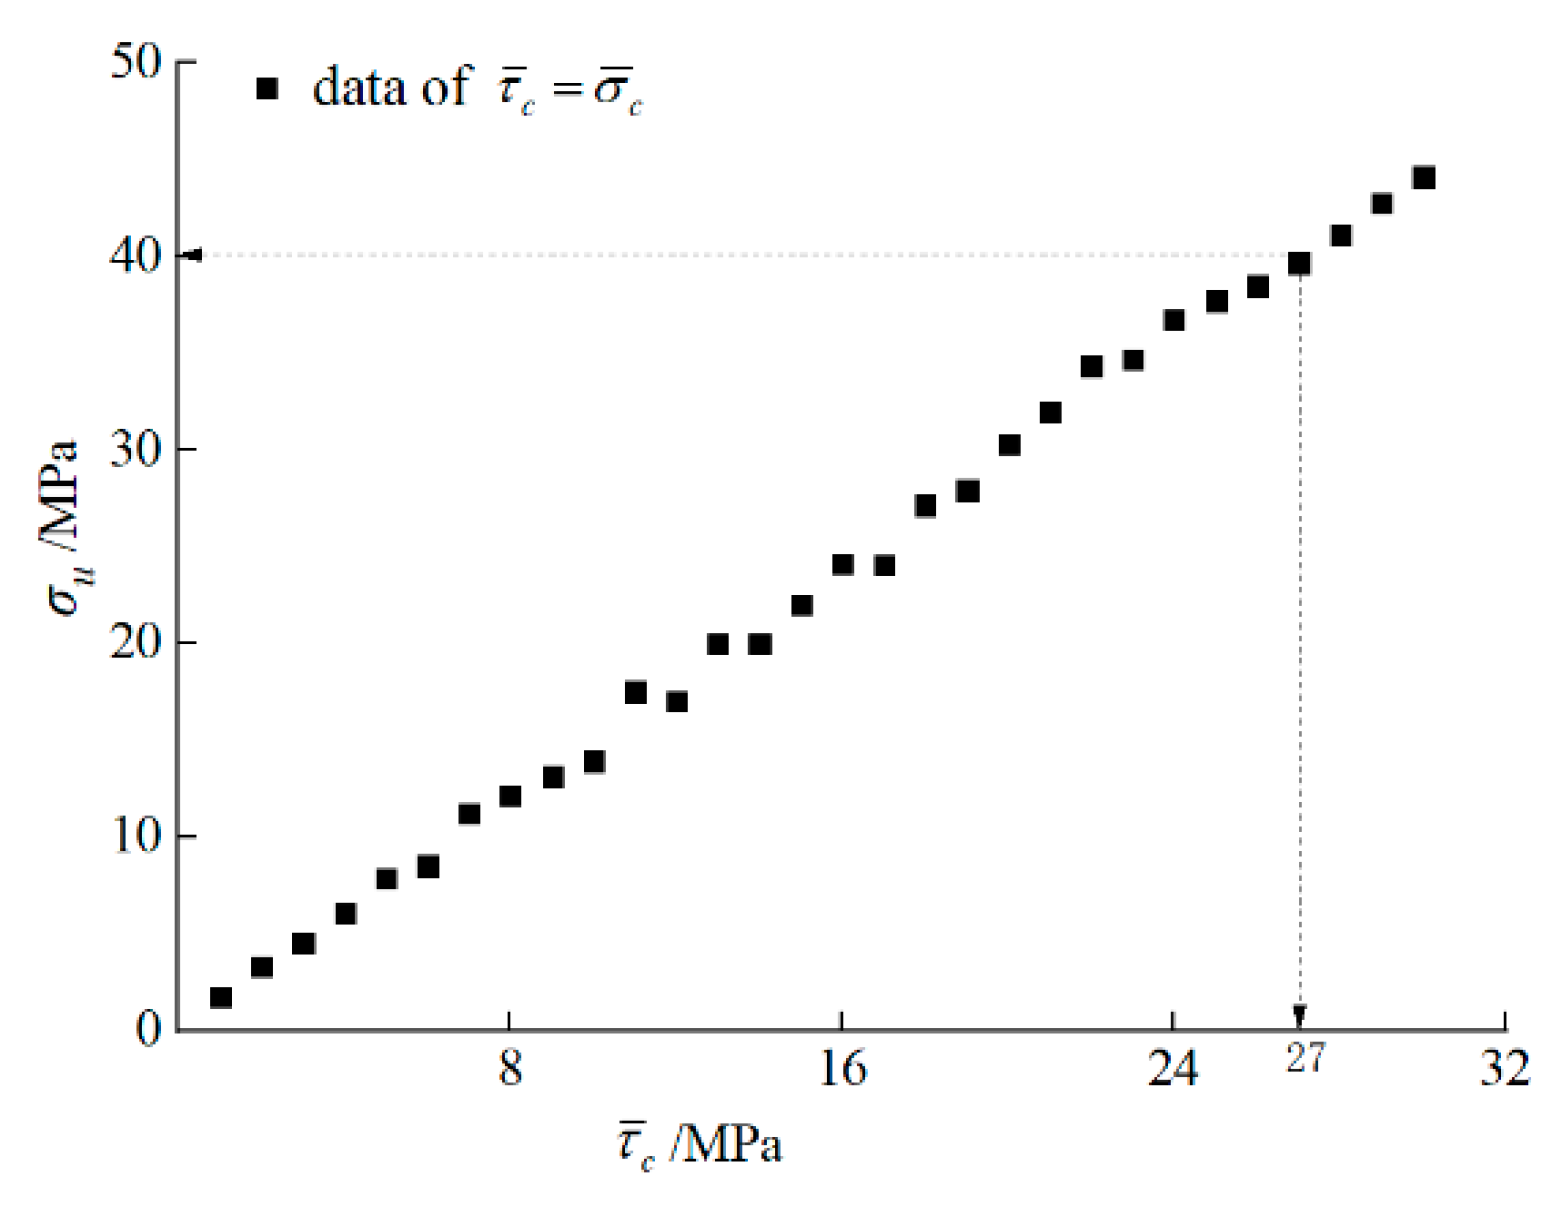
4.1. Analysis of Maximum Value of Peak Strength

As shown in Figure 4, the hypothesis was not true that the peak strength was the maximum value when the tensile-shear bond strength ratio was 1. Therefore, the relationship between the tensile-shear bond strength ratio and the peak strength is further discussed.
Since the assumption was not valid, the regularity obtained in Figure 4 was considered, and the integer of the tensile-shear bond strength ratio within 1–10 was taken. First, the shear bond strength remained unchanged, and the tensile-shear bond strength ratio was taken as an integer within 1–10. Second, the tensile bond strength was unchanged, and the tensile-shear bond strength ratio was taken as the value; the peak strength decreased gradually, and the maximum value of the peak strength could not be judged. Therefore, the tensile bond strength was unchanged, and the value of the tensile bond strength was based on the inverse of the tensile-shear bond strength ratio K c 1 (the shear-tensile bond strength ratio) as shown in Figure 6.
Figure 6a shows that when the tensile-shear bond strength ratio was 7, the maximum peak strength was that with different shear bond strengths. Figure 6b shows that when the inverse of the tensile-shear bond strength ratio was 2, i.e., the tensile-shear bond strength ratio was 0.5, the peak strength was the maximum value. When the tensile-shear bond strength ratio was less than 0.5, the peak strength was the maximum value and no longer increased with the increase in the shear bond strength. Therefore, when the tensile bond strength is constant, the tensile-shear bond strength ratio of less than 0.5 should be avoided when the shear bond strength is increased.
According to the data fitting in Figure 6a, the functional relationship between the tensile-shear bond strength ratio and the shear bond strength, as well as the functional relationship between the maximum value of the peak strength and the shear bond strength of the rock, was obtained as follows:
K c = 7
σ m = 0.23252 + 3.10425 τ ¯ c 0.00477 τ ¯ c 2
where Kc is the tensile-shear bond strength ratio; σ m is the maximum value of the peak strength; τ ¯ c is the shear bond strength.
According to the data fitting in Figure 6b, the functional relationship between the inverse of the tensile-shear bond strength ratio and the tensile bond strength, as well as the functional relationship between the maximum value of the peak strength and the tensile bond strength of the rock, was obtained.
K c 1 = 2
σ m = 1.28799 + 1.44852 σ ¯ c + 0.01121 σ ¯ c 2
where K c 1 is the inverse of the tensile-shear bond strength ratio; σ ¯ c is the tensile bond strength.
When the tensile bond strength or the shear bond strength is set, the maximum value of the peak strength and the tensile-shear bond strength ratio can be calculated. In Figure 7a, the shear bond strength was 13 MPa, and the tensile-shear bond strength ratio was 7. In Figure 7b, the tensile bond strength was 23 MPa, and the inverse of the tensile-shear bond strength ratio was 2; i.e., the tensile-shear bond strength ratio was 0.5, and the peak strength was 40 MPa. The function slope of the maximum value of the peak strength and tensile bond strength was smaller than that of the maximum value of the peak strength and shear bond strength. The change in the tensile bond strength had a more delicate influence on the maximum value of the peak strength. Therefore, the tensile bond strength was more effective than the shear bond strength in controlling the peak strength of the rock. The strength of the rock can be adjusted within the range of greater than 0.5 and less than 7 by adjusting the tensile-shear bond strength ratio, and according to the law of the extreme value of the peak strength of the rock, combined with the in-situ stress, the corresponding support and support methods can be adjusted.

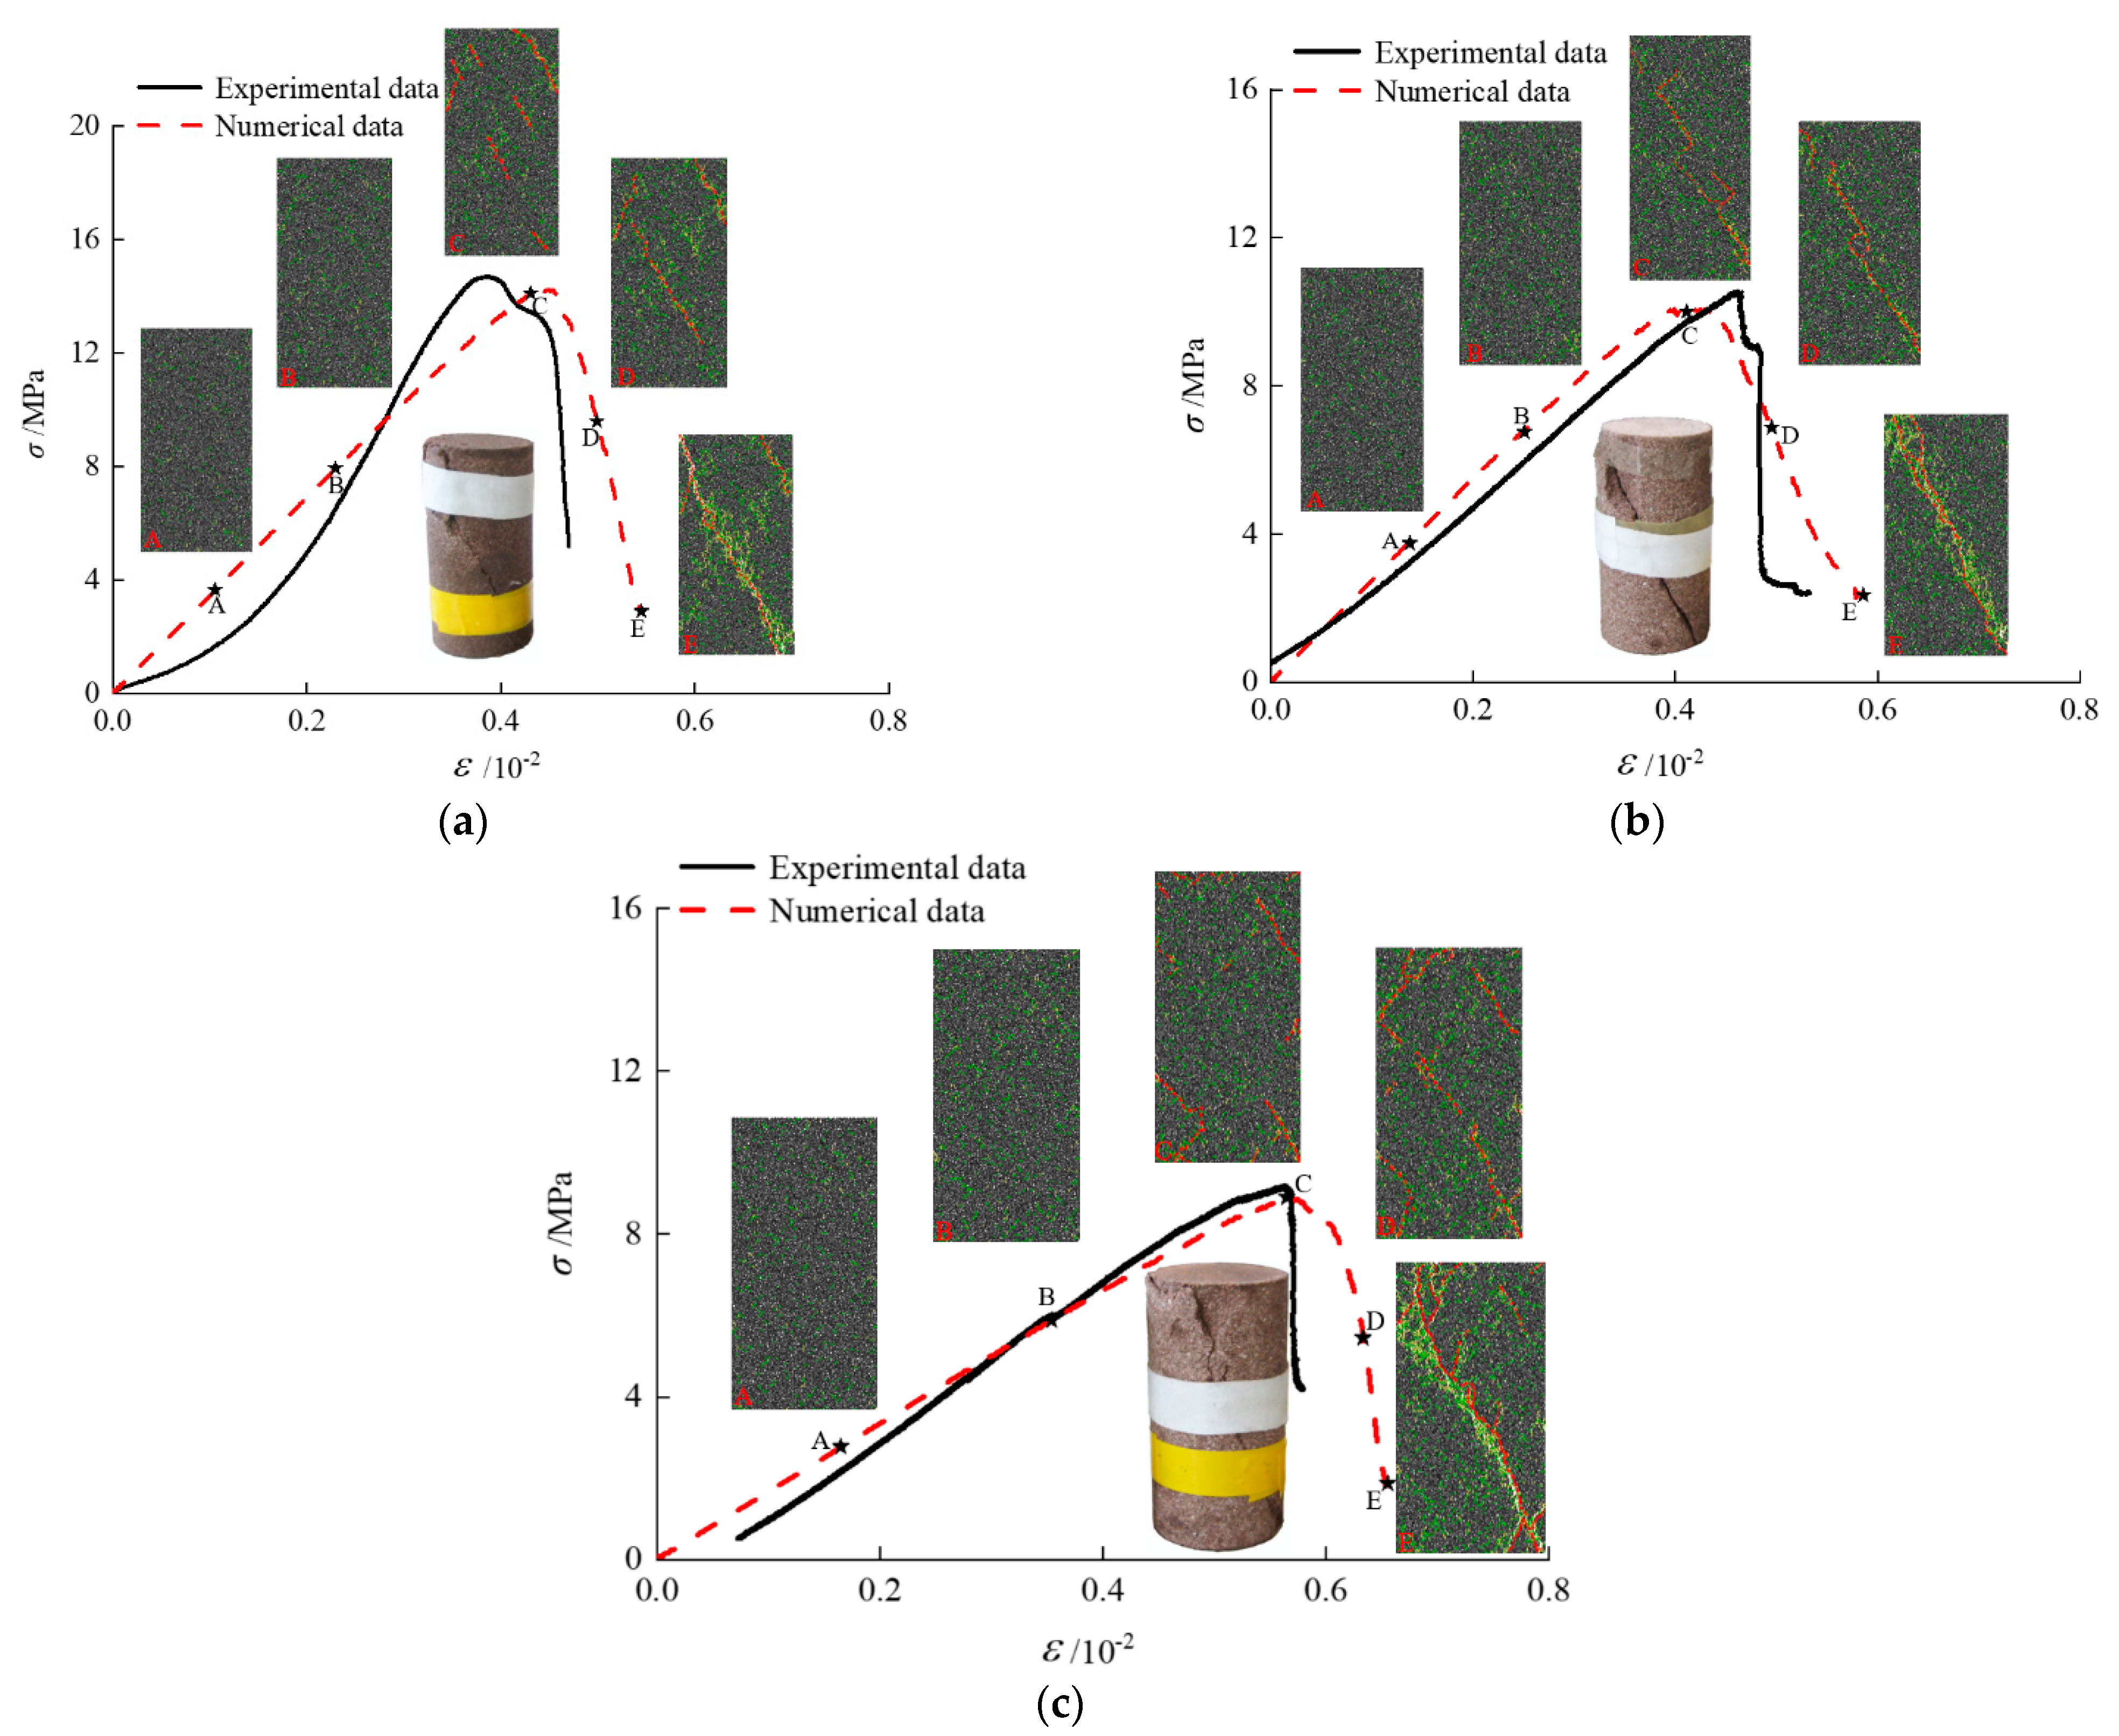
4.2. Analysis of Failure Mode Limit and Crack Evolution

In Figure 5, when the tensile-shear bond strength ratio was 2, the difference in quantity between the tensile cracks and shear cracks was 0, and the failure mode of the rock was more complex. In this section, the situation of the difference in quantity between the tensile cracks and shear cracks is discussed concerning a tensile-shear bond strength ratio near 2 (Kc = 1.8, 1.9, 2.0, 2.1, 2.2). Because the tensile bond strength was negatively correlated with the tensile–shear bond strength ratio, the experimental data were arranged according to the same shear bond strength.
Figure 8 shows the relationship between the difference in quantity between the tensile cracks and shear cracks and the tensile-shear bond strength ratio. When the shear bond strength was 19 MPa, the peak strength was 42.4 MPa, which is beyond the scope of this study; therefore, the test data were not added. It can be seen that when the difference in quantity between the tensile cracks and shear cracks was 0, the tensile-shear bond strength ratio was concentrated on 1.9–2.0; therefore, the limit of tensile failure and shear failure was 1.9–2.0, and the failure mode of the rock was composite tensile-shear failure. Combined with the data in Figure 5, it was concluded that (1) the failure mode of the rock was tensile failure if the tensile-shear bond strength ratio was less than 1.9; (2) composite tensile-shear failure if the tensile-shear bond strength ratio was 1.9–2.0; and (3) shear failure if the tensile–shear bond strength ratio was more than 2.0.
Figure 9 shows a comparison of the failure modes on the tensile-shear bond strength ratio. The shear cracks are green, and the tensile cracks are yellow. The regularity of the tensile cracks and shear cracks with the increase in the tensile-shear bond strength ratio can be clearly seen. The bond strength was relatively low; the cracks generated by bond fracture were distributed all over the rock interior, and then the cracks gathered together to form the failure zone (tensile failure or shear failure). With the increase in the tensile-shear bond strength ratio, the shear cracks increased gradually, and the tensile cracks decreased gradually. The failure mode changed from the tensile failure of multiple fracture zones in the middle of the rock to the shear failure in the direction of a single diagonal fracture zone.

4.3. Failure Mode of Coarse Sandstone

Hongqinghe coal mine is located in the southwest of Erdos City, Inner Mongolia Autonomous Region, China. Coal seams in this mine are of a typical weakly cemented formation, with low rock strength and easy disintegration once exposed to water. During the roadway excavation of Hongqinghe coal mine, coarse-grained sandstone samples were collected and processed into standard test pieces of the cylinder according to the method recommended by the International Society for Rock Mechanics. Table 2 shows the basic mechanical properties of the weakly cemented coarse-grained sandstone after laboratory tests.
The rock sample used in the test was weakly cemented coarse-grained sandstone in Hongqinghe coal mine. The core was cut according to the international rock mechanics test standard, and the SAS-2000 servo testing machine was used to perform this test. Figure 10 show the stress–strain evolution curve and the crack evolution process of the laboratory test and numerical simulation. The stress–strain curves of the laboratory test and numerical test were approximately the same, and there were some differences between the growth rate of the elastic stage and the decline rate of the post-peak stage. The local difference in the evolution of the stress–strain curve was explained as follows: there were original micro-cracks in the coarse-grained sandstone samples, while there were no micro-cracks in the numerical simulation model. According to the crack evolution rule in Figure 10 and the failure results of the laboratory tests, it can be seen that the crack was first generated from the ends of the rock, which affected the peak strength of the coarse-grained sandstone. In the middle section of the post-peak stage, the main cracks of the failure mode of the coarse-grained sandstone were basically formed. The failure mode of the coarse-grained sandstone was the shear failure, and the cracks in the coarse-grained sandstone in the numerical simulation were mainly shear cracks (green cracks). The failure mode of the coarse-grained sandstone in the numerical simulation was also consistent with that of the coarse-grained sandstone in the laboratory test. The peak strength and the elastic modulus of the numerical simulation and laboratory test were the same, the evolution rule of the stress–strain curve was consistent, and the failure crack was the same.
According to the experiment and the study of the influence of bond strength on rock properties, it was concluded that the strength of the weakly cemented coarse-grained rock formation in Hongqinghe coal mine was about 20 Mpa and that the rock formation was characterized by shear failure, combined with the law of mine pressure in the western mines. Targeted control was carried out according to the characteristics of rock formation, and the research results of this paper are instructive for the control of mine rock formations.

5. Conclusions

By simulating different parameters of bond strength of weakly cemented coarse-grained sandstone, the influence of bond strength on the peak strength and failure mode was determined. The mechanical parameters and the failure cracks of weakly cemented coarse-grained sandstone were verified by laboratory tests. The following conclusions were drawn:
(1)
In the numerical simulation of the bond strength of the weakly cemented coarse-grained sandstone, the tensile bond strength is more sensitive to changes in the peak strength and the failure mode of the weakly cemented coarse-grained sandstone than the shear bond strength. When other weakly cemented rocks are studied, the tensile bond strength should be emphasized.
(2)
Tensile bond strength and shear bond strength are established separately as a function of peak strength. When the tensile-shear bond strength ratio ranges from 0.5 to 7, the peak strength of the weakly cemented coarse-grained sandstone can vary with the change in bond strength. When the tensile-shear bond strength ratio is out of this range, the peak strength will not change. Therefore, the tensile-shear bond strength ratio should be emphasized when studying weakly cemented rocks.
(3)
When the tensile-shear bond strength ratio is greater than 2.0, the failure mode of the rock is shear failure. When the bond strength ratio is less than 1.9, the failure mode of the rock is tensile failure. When the bond strength ratio is 1.9–2.0, the failure mode of the rock is tensile-shear composite failure. The failure mode of weakly cemented coarse-grained sandstone is shear failure, and the bond strength ratio is more than 2.0.
The innovation of this paper is to investigate the effect of the failure mode on weakly cemented rocks by controlling variables and studying only two microscopic parameters, and the simulation results are consistent with laboratory tests.
This research has guiding significance for the control of mine rock formation. Through the detection and experimentation of rock samples, according to the strength and fracture mode of the reference rock, the precursor traces of the rock formation fracture in the stope can be identified, and the rock formation can be controlled in time to prevent major fracture damage.

Author Contributions

Conceptualization, X.Y. and L.S.; methodology, X.Y. and L.S.; software, X.Y.; validation, X.Y., L.S., J.S., B.Y., C.L. and Q.H.; formal analysis, X.Y. and J.S.; investigation, L.S., J.S., B.Y. and C.L.; resources, X.Y., L.S. and J.S.; data curation, X.Y., L.S., J.S. and B.Y.; writing—original draft preparation, X.Y.; writing—review and editing, X.Y., L.S. and J.S.; visualization, X.Y., L.S., and J.S.; supervision, X.Y. and L.S.; project administration, X.Y. and L.S.; funding acquisition, L.S. All authors have read and agreed to the published version of the manuscript.

Funding

This research was funded by the National Natural Science Foundation of China (grant No. 52074100, grant No. 51874113); the Key Research and Development Plan Project of Hebei province (grant No. 19275508D); and the Key Laboratory of Mine Geological Disaster Mechanism and Prevention and Control (grant No. KF2018-07).

Data Availability Statement

Not applicable.

Acknowledgments

The authors would like to acknowledge the Jiangxi University of Science and Technology and the Hebei University of Engineering.

Conflicts of Interest

The authors declare no conflict of interest.

References

  1. Wang, Z.K.; Li, W.P.; Wang, Q.Q.; Liu, S.L.; Hu, Y.B.; Fan, K.F. Relationships between the petrographic, physical and mechanical characteristics of sedimentary rocks in Jurassic weakly cemented strata. Environ. Earth Sci. 2019, 78, 131. [Google Scholar] [CrossRef]
  2. Zhang, J.H.; Wang, L.G.; Li, Q.H.; Zhu, S.S. Plastic zone analysis and support optimization of shallow roadway with weakly cemented soft strata. Int. J. Min. Sci. Technol. 2015, 25, 395–400. [Google Scholar] [CrossRef]
  3. Meng, Q.B.; Han, L.J.; Xiao, Y.; Li, H.; Wen, S.Y.; Zhang, J. Numerical simulation study of the failure evolution process and failure mode of surrounding rock in deep soft rock roadways. Int. J. Min. Sci. Technol. 2016, 26, 209–221. [Google Scholar] [CrossRef]
  4. Shi, G.H.; Goodman, R.E. Two-dimensional discontinuous deformation analysis. Int. J. Numer. Anal. Methods Geomech. 1985, 9, 541–556. [Google Scholar] [CrossRef]
  5. Shi, G.H.; Goodman, R.E. Generalization of two-dimensional discontinuous deformation analysis for forward modeling. Int. J. Numer. Anal. Methods Geomech. 1989, 13, 359–380. [Google Scholar] [CrossRef]
  6. Shi, G.H.; Pei, J.M. Numerical Manifold Method (NMM) and Discontinuous Deformation Analysis (DDA); Tsinghua University Press: Beijing, China, 1987. [Google Scholar]
  7. Munjiza, A.; Owen, D.R.J.; Bicanic, N. A combined finite-discrete element method in transient dynamics of fracturing solids. Eng. Comput. 1995, 12, 145–174. [Google Scholar] [CrossRef]
  8. Munjiza, A. The Combined Finite-Discrete Element Method; John Wiley: Chichester, UK, 2004. [Google Scholar]
  9. Munjiza, A.; Rougier, E.; Knight, E.E. Large Strain Finite Element Method: A Practical Course; John Wiley: Chichester, UK, 2015. [Google Scholar]
  10. Xu, C.Y.; Liu, Q.S.; Wu, J.; Deng, P.H.; Liu, P.; Zhang, H.H. Numerical study on P-wave propagation across the jointed rock masses by the combined finite-discrete element method. Comput. Geotech. 2022, 142, 104554. [Google Scholar] [CrossRef]
  11. Cundall, P.A.; Strack, O.D.L. A discrete numerical model for granular assemblies. Geotechnique 1979, 29, 47–65. [Google Scholar] [CrossRef]
  12. Kafashan, J.; Wiącek, J.; Rahman, N.A.; Gan, J.Q. Two-dimensional particle shapes modelling for DEM simulations in engineering: A review. Granul. Matter 2019, 21, 80. [Google Scholar] [CrossRef]
  13. Shimizu, H.; Murata, S.; Ishida, T. Effects of particle number and size distribution on macroscopic mechanical properties of rock models in DEM. J. Soc. Mater. Sci. Jpn. 2010, 59, 219–226. [Google Scholar] [CrossRef] [Green Version]
  14. Potyondy, D.O.; Cundall, P.A. A bonded-particle model for rock. Int. J. Rock Mech. Min. Sci. 2004, 41, 1329–1364. [Google Scholar] [CrossRef]
  15. Hsieh, Y.M.; Li, H.H.; Huang, T.H.; Jeng, F.S. Interpreta-tions on how the macroscopic mechanical behavior of sand-stone affected by microscopic properties—Revealed by bonded-particle model. Eng. Geol. 2008, 99, 1–10. [Google Scholar] [CrossRef]
  16. Kazerani, T.; Zhao, J. Micromechanical parameters in bonded particle method for modeling of brittle material failure. Int. J. Numer. Anal. Methods Geomech. 2010, 34, 1877–1895. [Google Scholar] [CrossRef]
  17. Obermayr, M.; Dressler, K.; Vrettos, C.; Eberhard, P. A bonded-particle model for cemented sand. Comput. Geotech. 2013, 49, 299–313. [Google Scholar] [CrossRef]
  18. Zhang, S.H.; Wu, S.C.; Duan, K. Study on the deformation and strength characteristics of hard rock under true triaxial stress state using bonded-particle model. Comput. Geotech. 2019, 112, 1–16. [Google Scholar] [CrossRef]
  19. Kulatilake, P.H.S.W.; Malama, B.; Wang, J.L. Physical and particle flow modeling of jointed rock block behavior under uniaxial loading. Int. J. Rock Mech. Min. Sci. 2001, 38, 641–657. [Google Scholar] [CrossRef]
  20. Holt, R.M.; Kjølaas, J.; Larsen, I.; Li, L.; Pillitteri, A.G.; Sønstebø, E.F. Comparison between controlled laboratory experiments and discrete particle simulations of the mechanical behaviour of rock. Int. J. Rock Mech. Min. Sci. 2005, 42, 985–995. [Google Scholar] [CrossRef]
  21. Bahaaddini, M.; Sharrock, G.; Hebblewhite, B.K. Numerical investigation of the effect of joint geometrical parameters on the mechanical properties of a non-persistent jointed rock mass under uniaxial compression. Comput. Geotech. 2013, 49, 206–225. [Google Scholar] [CrossRef]
  22. Helmons, R.L.J.; Miedema, S.A.; Rhee, C.V. Simulating hydro mechanical effects in rock deformation by combination of the discrete element method and the smoothed particle method. Int. J. Rock Mech. Min. Sci. 2016, 86, 224–234. [Google Scholar] [CrossRef]
  23. Mehranpour, M.H.; Kulatilake, P.H.S.W. Improvements for the smooth joint contact model of the particle flow code and its applications. Comput. Geotech. 2017, 87, 163–177. [Google Scholar] [CrossRef]
  24. Saadat, M.; Taheri, A.; Kawamura, Y. Investigating asperity damage of natural rock joints in polycrystalline rocks under confining pressure using grain-based model. Comput. Geotech. 2021, 135, 104144. [Google Scholar] [CrossRef]
  25. Potyondy, O. David. Simulating stress corrosion with a bonded-particle model for rock. Int. J. Rock Mech. Min. Sci. 2007, 44, 677–691. [Google Scholar] [CrossRef]
  26. Filgueira, U.C.; Alejano, L.R.; Arzúa, J.; Ivars, D.M. Sensitivity analysis of the micro-parameters used in a PFC analysis towards the mechanical properties of rocks. Procedia Eng. 2017, 191, 488–495. [Google Scholar] [CrossRef]
  27. Manso, J.; Marcelino, J.; Caldeira, L. Effect of the clump size for bonded particle model on the uniaxial and tensile strength ratio of rock. Int. J. Rock Mech. Min. Sci. 2019, 114, 131–140. [Google Scholar] [CrossRef]
  28. Abi, E.D.; Zheng, Y.R.; Feng, X.T.; Cong, Y. Relationship between particle micro and macro mechanical parameters of parallel-bond model. Rock Soil Mech. 2018, 39, 1289–1301. [Google Scholar] [CrossRef]
  29. Cong, Y.; Wang, Z.Q.; Zheng, Y.R.; Feng, X.T. Experimental study on microscopic parameters of brittle materials based on particle flow theory. Chin. J. Geotech. Eng. 2015, 37, 1031–1040. [Google Scholar] [CrossRef]
  30. Zhao, G.Y.; Dai, B.; Ma, C. Study of effects of microparameters on macroproperties for parallel bonded model. Chin. J. Rock Mech. Eng. 2012, 31, 1491–1498. [Google Scholar] [CrossRef]
  31. Su, H.; Yang, J.Q.; Hu, B.W.; Gao, X.; Ma, H. Study of particle size effect of rock model based on particle discrete element method. Rock Soil Mech. 2018, 39, 4642–4650. [Google Scholar] [CrossRef]
  32. Yoon, J. Application of experimental design and optimization to PFC model calibration in uniaxial compression simulation. Int. J. Rock Mech. Min. Sci. 2007, 44, 871–889. [Google Scholar] [CrossRef]
  33. Yang, B.D.; Jiao, Y.; Lei, S.T. A study on the effects of microparameters on macroproperties for specimens created by bonded particles. Eng. Comput. 2006, 23, 607–631. [Google Scholar] [CrossRef]
  34. Xu, J.M.; Xie, Z.L.; Jia, H.T. Simulation of mesomechanical properties of limestone using particle flow code. Rock Soil Mech. 2011, 30, 2084–2089. [Google Scholar] [CrossRef]
  35. Deng, S.X.; Zheng, Y.L.; Feng, L.P.; Zhu, P.Y.; Ni, Y. Application of design of experiments in microscopic parameter calibration for hard rocks of PFC3d model. Chin. J. Geotech. Eng. 2019, 41, 655–664. [Google Scholar] [CrossRef]
  36. Saadat, M.; Taheri, A. A numerical approach to investigate the effects of rock texture on the damage and crack propagation of a pre-cracked granite. Comput. Geotech. 2019, 111, 89–111. [Google Scholar] [CrossRef]
  37. Filgueira, U.C.; Alejano, L.R.; Ivars, D.M. Particle flow code simulation of intact and fissured granitic rock samples. J. Rock Mech. Geotech. Eng. 2020, 12, 960–974. [Google Scholar] [CrossRef]
  38. Lie, K.; Pathegama, G.R.; Bing, Q.L. Fluid-driven micro-cracking behaviour of crystalline rock using a coupled hydro-grain-based discrete element method. Int. J. Rock Mech. Min. Sci. 2021, 144, 104766. [Google Scholar] [CrossRef]
Figure 1. The relationship between the equivalence bond strength and peak strength.
Minerals 12 00055 g001
Figure 2. Effects of bond strength on peak strength: (a) tensile bond strength; (b) shear bond strength.
Minerals 12 00055 g002
Figure 3. Effects of bond strength on the difference in quantity between tensile cracks and shear cracks: (a) tensile bond strength; (b) shear bond strength.
Minerals 12 00055 g003
Figure 4. Effects of tensile-hear bond strength ratio on peak strength.
Minerals 12 00055 g004
Figure 5. Effects of tensile-shear bond strength ratio on the difference in quantity between tensile and shear cracks.
Minerals 12 00055 g005
Figure 6. Effects of the bond strength ratio on peak strength: (a) tensile-shear bond strength ratio; (b) shear-tensile bond strength ratio.
Minerals 12 00055 g006
Figure 7. The relationship between bond strength σ ¯ c and the maximum value of the peak strength: (a) tensile bond strength; (b) shear bond strength.
Minerals 12 00055 g007
Figure 8. Effects of tensile-shear bond strength ratio on the difference in quantity between tensile and shear cracks.
Minerals 12 00055 g008
Figure 9. Failure mode of rock with different tensile-shear bond strength ratios.
Minerals 12 00055 g009
Figure 10. Stress-strain curve and crack evolution of coarse-grained sandstone: (a) coarse-grained sandstone sample 1; (b) coarse-grained sandstone sample 2; (c) coarse-grained sandstone sample 3.
Minerals 12 00055 g010
Table 1. Main micro-parameters of the model.
ParameterValueParameterValueParameterValue
Particle density/kg/m32195Particle stiffness ratio2.6PBM stiffness ratio2.6
Porosity0.16PBM elastic modulus/Pa4 × 109 PBM radius factor1.0
Particle size ratio1.66Local damping coefficient0.7Particle friction coefficient0.6
Table 2. Basic mechanical parameters of coarse-grained sandstone.
ParameterSpecimen 1Specimen 2Specimen 3Specimen 4Specimen 5Specimen 6
Compressive strength/MPa12.2126.055.726.3423.0430.86
Tensile strength/MPa0.661.140.330.390.900.23
Cohesion/MPa1.213.750.740.582.770.66
Internal friction angle/°36.8036.3035.538.5036.648.6
Publisher’s Note: MDPI stays neutral with regard to jurisdictional claims in published maps and institutional affiliations.

