Article

Chemical Dissolution of Chalcopyrite Concentrate in Choline Chloride Ethylene Glycol Deep Eutectic Solvent

1
Escuela de Ingeniería Química, Facultad de Ingeniería, Pontificia Universidad Católica de Valparaíso, Avenida Brasil 2162, Valparaíso 2362854, Chile
2
School of Chemistry, University of Leicester, Leicester LE1 7RH, UK
3
Centre for Sustainable Resource Extraction, School of Geography, Geology and the Environment, University of Leicester, Leicester LE1 7RH, UK
*
Author to whom correspondence should be addressed.
Minerals 2022, 12(1), 65; https://doi.org/10.3390/min12010065
Submission received: 12 November 2021 / Revised: 23 December 2021 / Accepted: 29 December 2021 / Published: 5 January 2022
(This article belongs to the Special Issue Application of Ionic Liquids in Hydrometallurgy)

Abstract

:
Currently, the high demand for copper is in direct contrast with the decrease in the mineral grade and, more significantly, the concerns regarding the environmental impact that arise as a result of processing such low-grade materials. Consequently, new mineral processing concepts are needed. This work explores the chemical dissolution of chalcopyrite concentrate at ambient pressure and moderate temperatures in a deep eutectic solvent. Copper and iron are dissolved without changing their oxidation state, without solvent pH change, and stabilized as a chloride complex with no evidence of passivation. Chemical equilibria of the metallic chloride complexes limit the dissolution, and the step that is rate-controlling of the kinetics is the interdiffusion of species in the solvent. The chemical mechanism may involve initial chloride adsorption at positive sites of the solid surface, pointing out the importance of surfaces states on chalcopyrite particles. A model based on a shrinking particle coupled with pseudo-second-order increase in the liquid concentration of copper describes the dissolution kinetics and demonstrates the importance of the liquid to solid ratio. Iron and copper can be recovered separately from the solvent, which highlights that this concept is an interesting alternative to both redox-hydrometallurgy and pyrometallurgy to obtain copper by the processing of chalcopyrite concentrate.

1. Introduction

The large-scale extraction and metallurgical processing of copper from ores in recent decades, has transitioned from targeting Cu rich (>1.5 wt% Cu) oxidized copper minerals and secondary sulfides to low-grade (<0.8 wt% Cu) sulfidic copper (mainly chalcopyrite) ores. This change results from the exhaustion of near-surface secondary enrichment zones resulting in the mining of deeper primary ores. While the oxide zone and secondary sulfide zone minerals are easily leachable, chalcopyrite is challenging to leach and is not generally able to be leached economically with current processes and therefore has led to the predominance of pyrometallurgy processing over hydrometallurgy; in terms of participation in refined (A-grade London Metal Exchange) copper production.
Pyrometallurgy, although energy-intense in the comminution stage and water-intensive in froth flotation operation, is less time-consuming than hydrometallurgy and benefits from exothermicity of the smelting stage. However, environmental concerns are severe, especially regarding air pollution (SO2 emissions) and the social impact of large mine tailings facilities [1]. The recent demand for copper has been pushed mainly by growth in China, which is currently being exacerbated by decarbonization technology [2].
Process innovation is needed to intensify and remediate copper extraction. The leaching of copper from chalcopyrite has been demonstrated using a variety of redox, where the oxidation state of the component of the minerals are changed in the leaching process and also non-redox processes. When leaching chalcopyrite concentrates, the redox process is controlled by an electrochemical mechanism providing the particle diameter is small enough (usually between 30 to 50 µm), avoiding the mass transport limitation [3]. In these processes, poorly soluble products can form through interaction between water, dissolved oxidants and reducing species and the products of the mineral dissolution which can physically hinder the leaching progress. Among these passivating species are metal hydroxides, metal chlorides, sulfates (mainly jarosites), secondary metal sulfides and elemental sulfur [4,5,6,7]. Water can be either directly or indirectly involved in the generation of these secondary and detrimental compounds.
The intrinsic mechanism of non-redox dissolution of minerals in the absence of mass transport limitations has been discussed in a series of papers [8,9]. The theory accounts for the breaking of bonds between the constituents of a solid and the removal of surface species to form anions and cations in parallel partial reactions followed by the transfer of these charged species across the potential difference that exists at the surface until a partial equilibrium is reached in solution.
Different non-aqueous or low water content treatments of chalcopyrite concentrate have been proposed in the literature, and these are summarized in a recent review on solvometallurgy [10]. These non-aqueous solvents can be molecular organic solvents, ionic liquids and deep eutectic solvents, but also inorganic solvents such as liquefied ammonia, concentrated sulfuric acid, or supercritical carbon dioxide. Among the potential benefits of solvometallurgy are the tunable selectivity towards one metal, the possibility to avoid the dissolution of undesired toxic species, process intensification by combined leaching and solvent extraction process and the reduction of wastewater generation. A particular case is when the non-aqueous processing involves an ionic media and is classified as ionometallurgy [11], which includes the use of ionic liquid and deep eutectic solvents.
Deep Eutectic Solvents (DESs) are formed from a mixture of acids and bases (Lewis or Brønsted), containing a variety of large, non-symmetrical anionic and/or cationic species having relatively low lattice energy and hence presenting low melting temperature. The most common synthesis of DES is the complexation of a quaternary ammonium salt with a metal salt or hydrogen bond donor (HBD). The charge delocalization occurring through hydrogen bonding between, for example, a halide ion and the hydrogen-donor moiety decreasing the melting point of the mixture relative to the melting points of the forming components [12].
The investigation of the use of DESs in metallurgy comes after promising results obtained with imidazolium ionic liquids [13,14,15], but recognizing issues associated with cost, availability and environmental impact associated to these solvents that hinder their applicability. DESs instead, meet all the criteria for a reagent to be used in large-scale metallurgical processing [16], and along with efficient process design to recover and recycle the solvent, could present several advantages in terms of process safety and water footprint. Recently promising results have been published using DES mixtures as a solvent in electrochemical-assisted leaching of different copper sulfides, including chalcopyrite [17].
This study aims to evaluate the possibility of operating a chemical, non-redox dissolution of chalcopyrite concentrates and the recovery of copper in a deep eutectic solvent, identifying the main factors affecting the dissolution kinetics and solubility limits

2. Materials and Methods

2.1. Mineral Characterization

The chalcopyrite concentrate was received from Codelco (the national copper corporation of Chile) at Division Andina concentrator plant. The granulometry of the concentrate was 100% under 400# Tyler mesh (<37 µm) and was used without further milling. The material was washed with distilled water and dried in air at 80 °C until the mass of the material was constant. High-definition mineralogy determination was accomplished using a scanning electron microscope (SEM) equipped with energy-dispersive X-ray spectroscopy (EDX) (JSM 6380LV–JEOL microscope, JEOL, Tokyo, Japan) and automated using QEMSCAN. The analysis shows a near 89% weight of metal sulfides. The distribution of sulfides is presented in Table 1 and shows a total of 26.46% copper with no copper oxide. Table 1 also shows the total of metal oxides was less than 1% and Table 2 shows the gangue material was 10.5% which was mostly quartz, clays, sulfates and phosphates.

2.2. Solvent Preparation and Characterization

The synthesis of the DES was performed by mixing choline chloride 99% (Sigma-Aldrich, Darmstadt, Germany) with the hydrogen bond donor (ethylene glycol) in a molar ratio of 1 to 2. The mixture was heated and stirred at 50 °C until an entirely homogeneous and transparent liquid was formed.
Although the original reagents were received in anhydrous form, choline chloride salt is particularly hygroscopic and quickly absorbs moisture from the ambient; after mixing with ethylene glycol and after the eutectic solvent is completely synthesized the water content was measured. All of this process was carried out without avoiding contact between the eutectic liquid surface and laboratory air (average dry bulb laboratory temperature of 19.5 °C and 35% relative humidity).
It is well known that water content influences the physicochemical properties of DES. For example, Hammond [18] has studied the solvation of water by DES, using neutron diffraction studies, concluding that low-level water, such as that absorbed during preparation and handling, does not significantly perturb the DES structure but alters the intermolecular interaction strength. On the other hand, Xie et al. [19] identified that water was able to change electrochemical response, improving ionic conductivity dramatically. However, a broad electrochemical window could be still achieved when the water content was below ~6 wt%. This same level of water content was determined by Chen et al., [20] to be the maximum obtainable from moisture absorption form air, in an equilibrium condition, working in a typical ambient operative condition of 22 °C and 32% relative humidity.
Water content changes the transport properties of the solvent, particularly the viscosity, which in the case of the 1:2 choline chloride: ethylene glycol, is reduced by a factor of three when the water content is raised from 600 ppm to 10 wt% [21]. The solvent used in this present study had a water content of 2 wt%, a viscosity of 38 mPa s, and a density of 1.11 g mL−1 measured at 19.5 °C. The pH of the almost pure DES has been calculated previously by both electrochemical pH sensor and standard pH indicator solutes and was determined to be in the range of 6.0 to 6.9 [22,23].

2.3. Dissolution Conditions

The natural chalcopyrite concentrate samples were dried at 80 °C under air until non-variation in weight was observed, cooled to room temperature and added to a 20 mL glass tube containing the DES preheated up to the required temperature. The solid–liquid mixture was kept stirred at constant temperature in a temperature programmable heating-stirring plate. The stirring rate was set to allow particles distribution among the liquid phase and avoid agglomerations and the settlement of the solid.

2.4. Analytical Methods

Dissolved metals concentration was determined by inductively coupled plasma optical emission spectroscopy (JY Ultima 2 ICP-OES, HORIBA Jobin Yvon, Edison, NJ, USA), UV-Visible spectra were made by Mettler Toledo (UV5Bio) spectrophotometer using 1 × 1 cm quartz cells. Water content was obtained using a Mettler Toledo volumetric Karl–Fisher titrator (V10S).

3. Results

A series of dissolution runs were made varying temperature and solid to liquid ratio. The behavior of chalcopyrite dissolution was studied by following the concentration of copper in solution by ICP-OES. The data were analyzed in terms of the converted fraction (α), i.e., the amount of dissolved copper divided by the amount of copper in the solid (26.46% weight basis). The dissolution of chalcopyrite started immediately upon solid–liquid contact and was evidenced by a change in color of the solvent, from transparent to dark green. The copper dissolution behavior is shown in Figure 1 for different temperatures, at molar liquid to solid ratio of 9.88 (mol of DES to mol of copper contained in the original chalcopyrite sample) that corresponds to 10 mL of DES to 1 g of mineral sample. Taking the data at 50 °C the solubility of copper from chalcopyrite after 4 h equates to approximately 2900 ppm. This is considerably higher than that for CuO (4.6 ppm), Cu2O (394 ppm) and Fe2O3 (0.3 ppm) measured in the same liquid at the same conditions [24] showing that the mixed metal sulfide is relatively soluble.
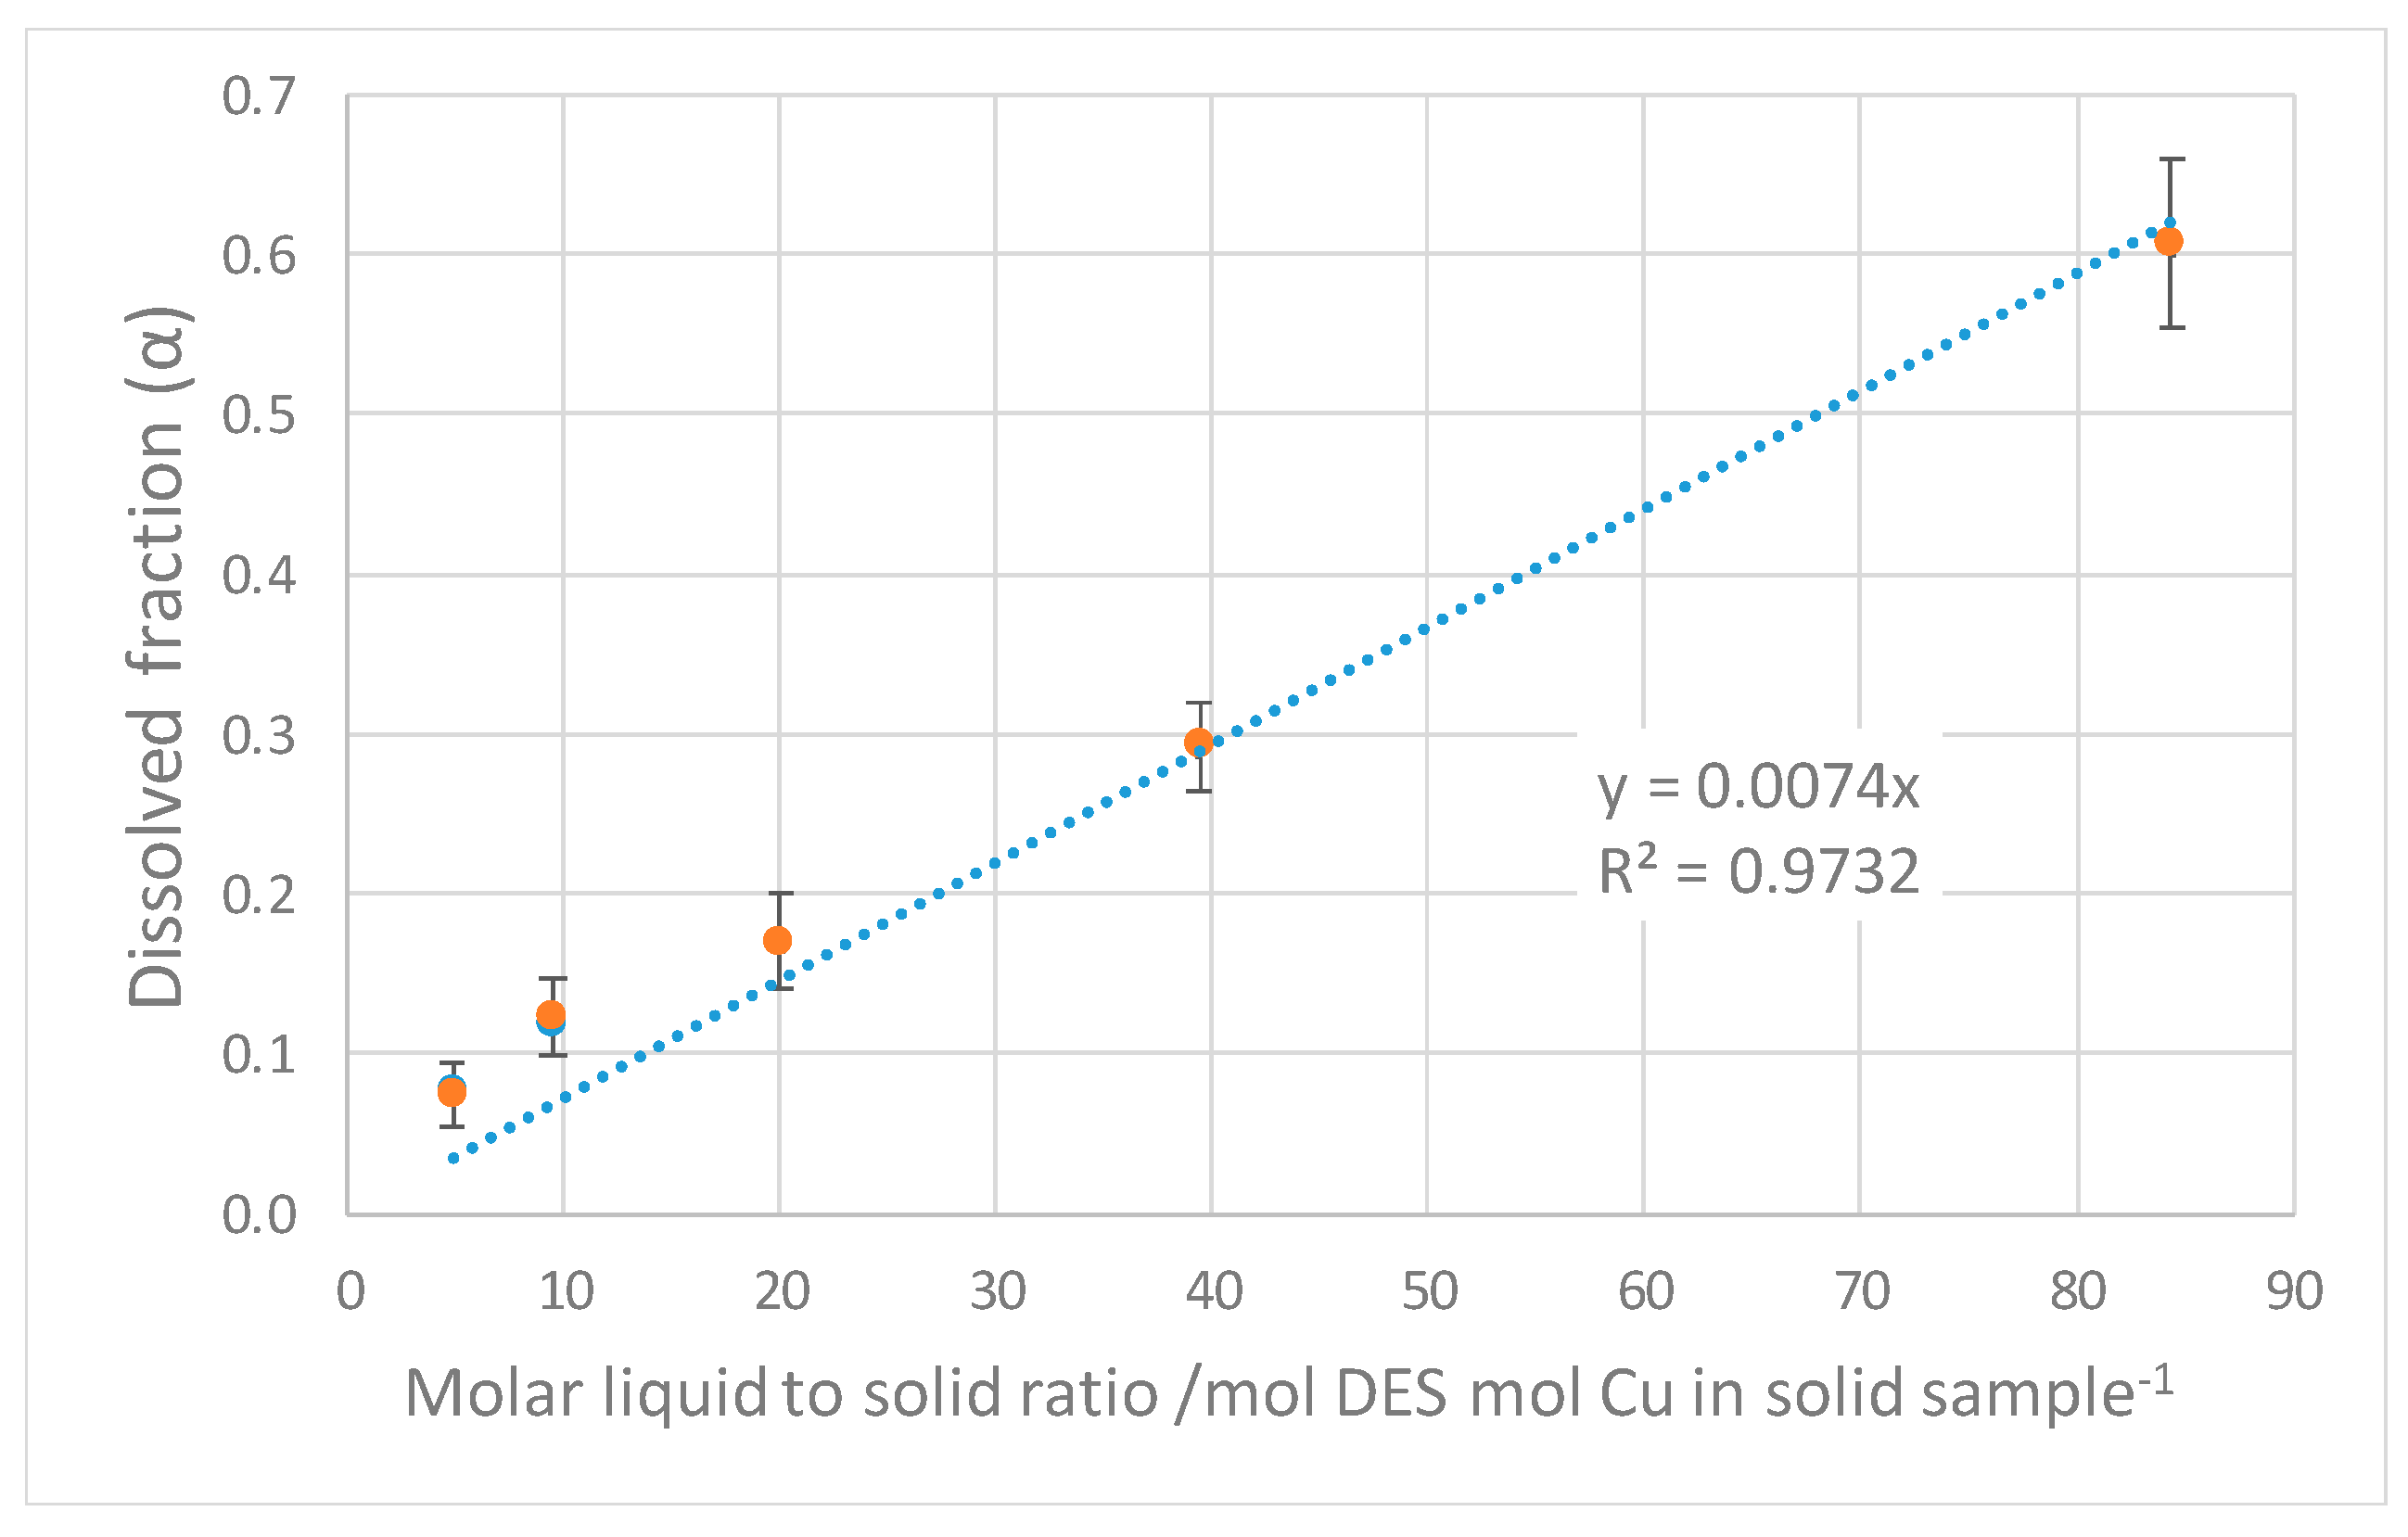
As can be observed from Figure 1, dissolution of copper from chalcopyrite is initially a fast process and approaches equilibrium after about 2 h at all temperatures. The same behavior has been found for different liquid to solid ratios. Figure 2 depicts the correlation between the liquid to solid ratio (on a molar basis) and final dissolution fraction at a constant temperature of 50 °C.
As observed from Figure 2, there is a direct correlation between liquid to solid ratio (L/S) and the final dissolved fraction attainable by the process. The proportionality constant calculated was 7.4 × 10⁻³. This direct influence of the L/S ratio suggests that the role of the DES is not only as a solvent, but rather one or more of its ionic and molecular components plays a role in the whole dissolution kinetics.
Figure 3 show the UV-Visible spectra measured for the resultant solution after the extraction procedure for the different liquid to solid molar ratios. The observed results depicted in Figure 3 support the statement of the occurring of a bimolecular reaction associated to the formation of copper (and iron) chloride complexes, which corresponds to the previously mentioned step in the dissolution mechanism, which in turns depend on the relative quantity of complexing agent, in this case, the DES itself.
A complex of copper (I) species (mainly CuCl2) is identified by the UV characteristic peak near 270 nm. This result is consistent with the data obtained by Greenz et al. [25] in the anodic dissolution of pure copper in the same choline chloride–ethylene glycol DES and by Tang et al. [26] in the anodic dissolution of copper in choline chloride-urea DES. In the first cited work, the authors pointed out a chemical corrosion process occurring in parallel with anodic dissolution. Both studies concluded that the rate of the dissolution is controlled by the mass transport of the copper chloride complex.
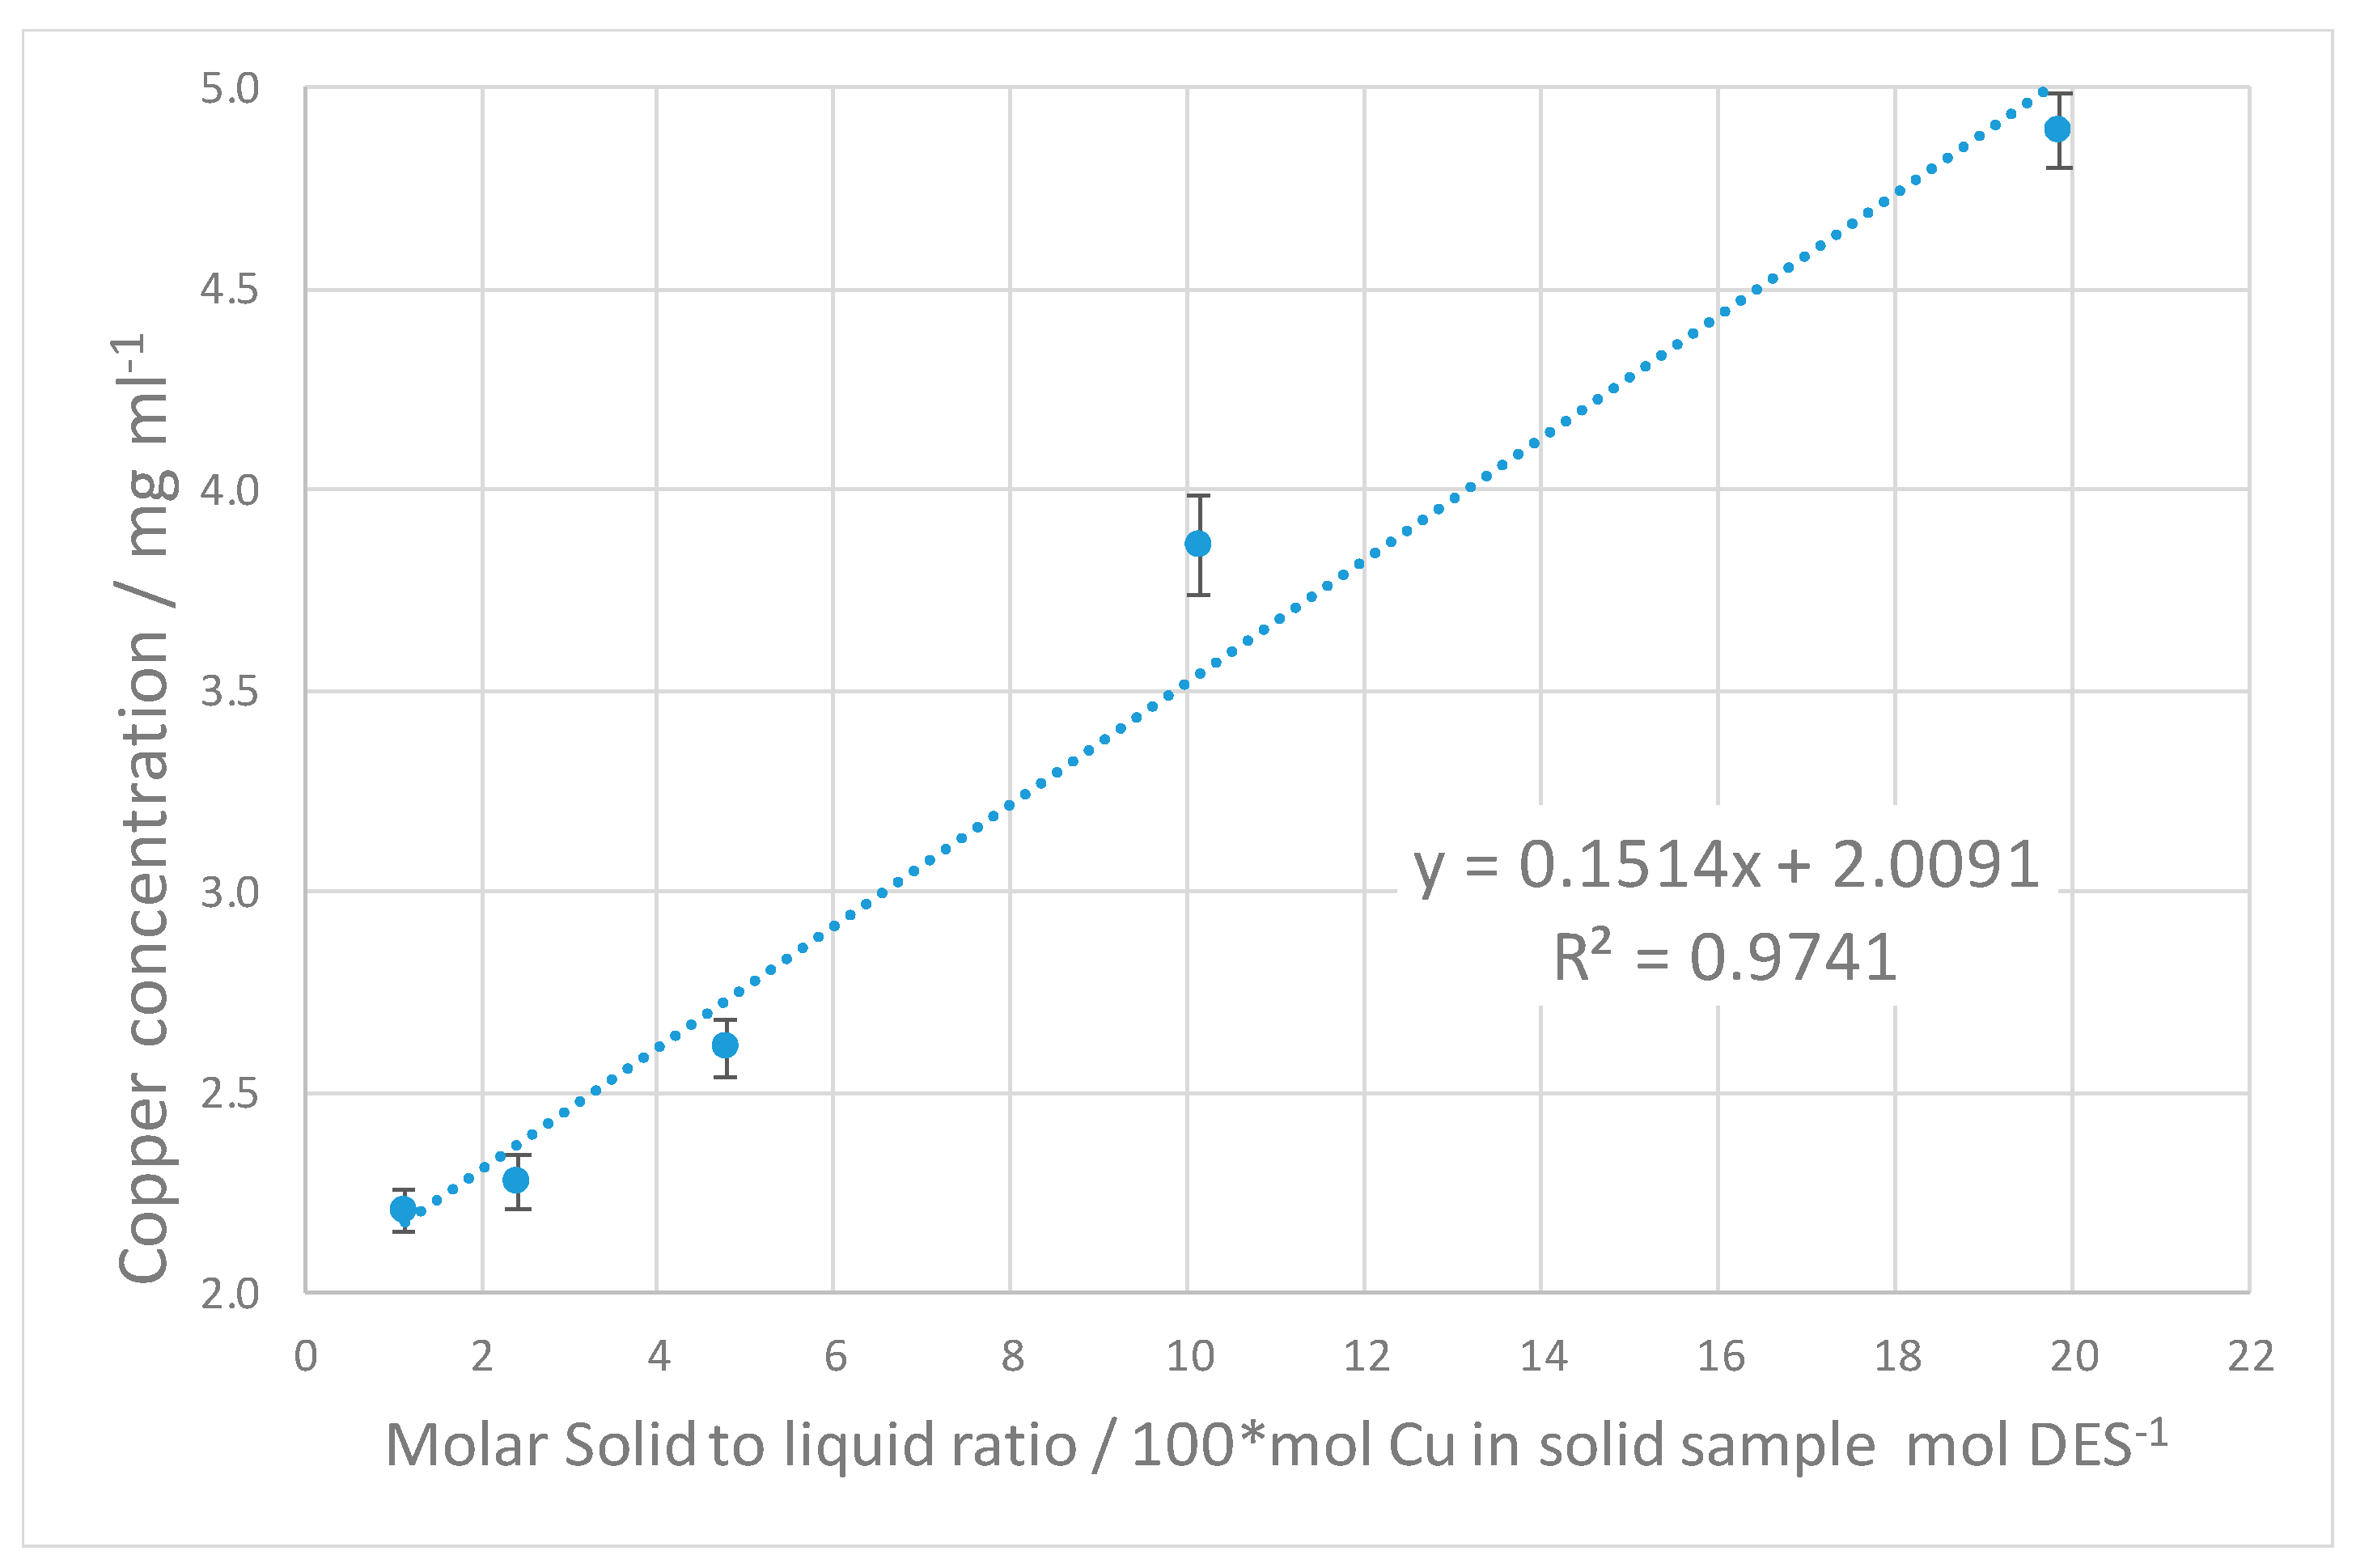
Another study by Doche et al. [27] demonstrated effective dissolution of copper from e-waste in choline chloride ethylene glycol DES was accomplished under ultrasonic irradiation. Copper speciation, in this case, was a Cu(I) complex as well, but it was claimed to be CuCl3−2. The authors explained that the solvent allows the Cu(I) species to be stabilize, contrary to the effect observed in aqueous solutions. In addition, De Vreese et al. [28] have studied the speciation of copper (II) complexes in choline chloride aqueous solutions finding a choline cation coordinating action onto the transition-metal ions by hydrogen bonding, pointed out the electrostatic stabilization capacity of the DES tested. As expected from the results in Figure 2 and Figure 3, there is a direct correlation between the solid-to-liquid ratio and the final solution copper concentration as presented in Figure 4.
In the case of copper chloride complex formation, the L/S ratio must influence the ability of chloride to coordinate to the dissolving metal ion. The dissolution kinetic data in Figure 1 do not fit commonly used models describing mineral leaching processes. These models are: power law models, zero to third order chemical-controlled kinetics, 1 to 3 D diffusion-controlled kinetics, contracting area or volume models, Avrami–Erofeyev or Prout–Tompkins nucleation models, etc. [29]. Only models which consider a logarithmic function of time, as presented in Equation (1) [30], are shown to be suitable to fit the experimental data.
( 1 ( 1 α ) 1 / 3 ) 2 = k L n ( t )
where α is the converted fraction.
As explained by the authors [30], the logarithmic function of time arises upon considering an inverse relation of a variable diffusion coefficient with time. This could be explained in terms of solute concentration effect on the solution viscosity, particularly in unstirred systems. Still, there is not a clear and direct physical explanation for this logarithmic behavior. Accordingly, a model was developed, coupling the concept of a spherical particle shrinking with a pseudo-second-order increase on the liquid concentration of copper chloride complex limited by solubility [31]. The derivation of the model leads to Equation (2) which can be linearized in the form of Equation (4). All the assumptions and the complete derivation of the model, including the meaning of the constant k are described in the Appendix A section.
1 ( α s α ) 1 α s = k t
where αS is the maximum converted fraction attainable at saturation.
By reordering Equations (2)–(4) are obtained,
α = α s [ 1 1 1 + k t ]
1 α = 1 α s + [ 1 k α s ] 1 t
Equation (4) is used to correlate the experimental data in Figure 1 and this is shown in Figure 5. From this figure the apparent kinetic constants and the theoretical maximum dissolution fraction can be calculated and these are presented in Table 3.
From Table 3 is possible to identify a maximum dissolution fraction near 16% (molar basis) at 90 °C and molar liquid to solid ratio: 9.88 (mol DES: mol initial Cu in chalcopyrite), which corresponds to a liquid concentration of about 5 g L−1 of copper (ca. 8 × 10⁻² M). The same calculation for molar L/S ratio of 88 showed a dissolved fraction of over 60% at the same temperature; however, the correspondent liquid copper concentration is reduced by half due to the effect of the higher dilution factor. Then, under process consideration, there is an optimum molar L/S to operate this non-redox dissolution of chalcopyrite that does not necessarily correspond to the maximum extent of dissolution.
There is a compromise between the extent of dissolution and maximum copper concentration in the liquid phase. From a process point of view, this compromise implies that a process based on this kind of dissolution must be operated under a multistage leaching scheme, maximizing in-liquid copper concentration with limited extraction in each stage.
From the apparent kinetic constants determined at different temperatures, the apparent activation energy for the dissolution process was calculated from the Arrhenius plot shown in Figure 6. The obtained value was 3.52 kJ mol−1. This low value of activation energy suggests that the chemical regime is not the rate limiting step, but instead, mass transport controls dissolution.
The confirmation of diffusion-limited kinetics agrees with the consideration made in the development of the kinetic model, regarding the occurrence of a bimolecular reaction (pseudo-second-order), where a bimolecular ionic diffusion was expected to have a predominant effect. The obtained activation energy value is small compared to the values reported in the literature for chalcopyrite dissolution in aqueous solutions of acidic ionic liquids (i.e., 18.4 kJ mol−1) [32]. This fact could be interpreted by considering that less energy is needed in the metal-ligand coordination in non-aqueous systems than the energy needed for solvation of the leached metallic species by water present in the aqueous system containing ionic liquids.

4. Discussion

The feasibility of the implementation of a process based on DESs for metal recovery from ores or concentrates depends on the ability to operate a straightforward recovery procedure to reclaim the dissolved metals of value and recycle the solvent as well. The resulting iron and copper containing DES solution from the dissolution of chalcopyrite concentrate contain equal amounts of iron and copper.
The addition of distilled water to the final DES solution (1 to 1 volume ratio) produces an immediate orange-to-red precipitate, corresponding to ferric hydroxide as reported previously [33]. This precipitate can be, removed by filtration, leaving a crystalline yellow-to-green colored solution.
The precipitate obtained was redissolved in 2% nitric acid solution and analyzed by atomic absorption, determining an iron-to-copper ratio higher than 1200, indicating that copper, probably in cupric chloride, is present in the solid only by a drag effect of ferric hydroxide precipitation.
If the added water is adjusted to pH 9 with NaOH, the generation of ferric hydroxide is further accelerated. After removing iron by the precipitation, copper could be either removed from the remaining clarified DES solution by electrodeposition as proved elsewhere [34] or reduced and separated by cementation.
Preliminary runs of cementation of copper, after water removal, by using aluminum sheet have shown rapid elemental copper recovery, which is enhanced by an increase in temperature up to 45 °C. On the other hand, exploratory runs with different organic solvents demonstrated the difficulty in extracting copper chloride by solvent extraction methods, due, mainly, to the high stability of copper chloride in the DES phase. Water removal from DES can be performed by evaporation assisted by vacuum, exploiting the large difference in vapor pressure. Further research is needed to explore all the process possibilities for the recovery of both the copper and the solvent, which are paramount aspects for the economy and the environmental compatibility of the process.

5. Conclusions

The present work has demonstrated that natural chalcopyrite concentrate can be dissolved in a non-redox process in a DES. Copper and iron are dissolved in their original oxidation state, without solvent pH change, forming a chloride complex. Copper is stabilized as a cuprous complex (CuI) in the solvent and the solubility of both metallic species is significantly higher than the corresponding oxides. There is no evidence of mineral passivation and limited water content avoids oxide or jarosite-like species forming. Meanwhile, sulfide is stabilized in ionic form without in situ formation of solid elemental sulfur or gaseous sulfidric acid.
Chemical equilibria of the metallic chloride complex limit the dissolution, and the step that is controlling the rate of the kinetics is the interdiffusion of species in the solvent. A model based on a shrinking particle coupled with pseudo-second-order increase in the liquid concentration of copper describes the dissolution kinetics and highlights the importance of the liquid to solid ratio.
The obtained results extend the field of application of DESs under a concept of non-redox sulfide mineral processing. This concept avoids many of the limitations of the aqueous system. However, more research is required on the metal complex chemistry, in order to determine the exact nature of the formed metal complex (copper and iron) and the sulfur species in the DES, and to evaluate the importance of the adsorption of chloride at the positive sites of the chalcopyrite particles.
While separate streams of copper and iron can be easily recovered further optimization of these processes are required.
Possible environmental advantages of the process are the possibility of offering an alternative to pyrometallurgy processing of concentrates in cases of restriction of gas treatment or limitation of the sulfur related emission and the utilization of leaching and electrowinning-refining installations available in a metallurgical plant, especially treating concentrates with relatively high content of volatiles toxic metals.

Author Contributions

All the authors contribute in the conceptualization of the project and the discussion of the results. Additionally, C.C., perform the experimental procedures and original draft preparation, R.C.H., the project administration, A.P.A., supervision, review and editing; and G.R.T.J., data analysis, methodology review, manuscript review and editing. All authors have read and agreed to the published version of the manuscript.

Funding

This research was funded by ANID (Chile) by the post-doctorate BECAS CHILE program call 2018.

Data Availability Statement

The data presented in this study are available on request from the corresponding author.

Conflicts of Interest

The authors declare no conflict of interest.

Appendix A

Dissolution model derivation.
When modelling the kinetics of the dissolution, the following consideration was taken (Figure A1).
Figure A1. Scheme of an ideal mineral particle in the dissolution process.
Minerals 12 00065 g0a1
The mineral is considered as a group of particles of starting radii r0 that are leached reducing their radii uniformly within time (r = radii as a function of time):
r = r 0 x
Considering the volume of a sphere and α as the fraction of reacted particle (molar basis)
The fraction unreacted is ( 1 α ) = ( r 0 x ) 3 r 0 3 :
( 1 α ) 1 3 = 1 x r 0
x = r 0 ( 1 ( 1 α ) 1 3 )
d x d α = 1 3 r 0 ( 1 α ) 2 3
This radius contraction corresponds to the dissolution of the particle releasing a mass (m) of copper, which in turn is associated with the increase on the metal concentration in the liquid phase over the time (t).
d m M d t = d c d t × L
where (M) is the molecular weight of copper, (c) is the copper molar concentration in the liquid phase and (L) corresponds to the liquid phase volume (constant).
The molar metal loss from the solid is represented by:
d m M d t = ρ d V s M d t = 4 π ρ d r 3 3 M d t
where (ρ) is the chalcopyrite density and (Vs) corresponds to the volume of the spherical particles.
To obtain the above expression in terms of dx/dt the chain rule of the derivative was applied:
d r 3 d t = d r 3 d x × d x d t
Using Equation (A1) and replacing the value of r:
d r 3 d x = d ( r 0 x ) 3 d x = 3 ( r 0 x ) 2
Additionally, replacing this result in Equation (A4):
d m M d t = 4 π ρ ( r 0 x ) 2 d x M d t
This molar flux of copper goes to the liquid phase and, considering the liquid phase concentration following a pseudo-second-order behavior, we can write:
d c d t = k D × ( c s c ) 2
where (kD) is a second order kinetics constant, and (Cs) stand for the liquid concentration of copper at saturation condition.
The converted fraction (α) is related to liquid phase concentration in the form of:
c × L × a S = α
c s × L × a S = α s
where (S) correspond to the total mole of copper present in the solid (in chalcopyrite) and (a) is a constant which correlates the liquid to solid ratio and converted fraction (determined experimentally).
Replacing in Equation (A7):
d c d t = k D × ( S L × a ) 2 ( α s α ) 2
Additionally, replacing Equations (A6) and (A8) in Equation (A4) we obtain:
4 π ρ ( r 0 x ) 2 d x M d t = k D × ( S a ) 2 1 L ( α s α ) 2
Additionally, thus
d x d t = k * × ( α s α ) 2 ( r 0 x ) 2
where
k * = k D S 2 M 4 ρ π a 2 L
In addition, replacing x by using Equation (A2) in Equation (A9):
d x d t = k * × ( α s α ) 2 ( r 0 r 0 ( 1 ( 1 α ) 1 3 ) ) 2 = k * × ( α s α ) 2 ( r 0 ( 1 α ) 1 3 ) 2
Finally, using again the chain rule of the derivative, and using Equations (A3) and (A10), is possible to obtain the expression of the converted fraction in function of the time:
d α d t = d x d t d x d α = 3 k * × ( α s α ) 2 ( r 0 ( 1 α ) 1 3 ) 2 ( r 0 ( 1 α ) 2 3 ) = 3 k * r 0 3 ( α s α ) 2
d α ( α s α ) 2 = 3 k * r 0 3 d t = k d t
Considering a new overall constant k and integrating:
k = 3 k * r 0 3 0 α d α ( α s α ) 2 = 0 t k d t
An expression is encountered, which after being rearranged, allows correlation of the experimental data (α, t) and determines the overall constant k and the theoretical limiting dissolution fraction αs, that depends on the particles original radius, temperature, fluid dynamic conditions (stirring) and liquid to solid initial ratio (solvent to mineral).
1 ( α s α ) 1 α s = k t
α = α s [ 1 1 1 + k t ]
1 α = 1 α s + [ 1 k α s ] 1 t
Summary of the main assumptions of the dissolution model:
  • The models are applicable for mono-sized particles or particles on a narrow size range. In this particular case of study, the particles come from a froth flotation process fulfilling this requirement
  • The model does not consider the operative variables as stirring conditions, temperature, and chemical changes in the solvent in a straightforward way. All these factors affect the constant kD.
  • The model does not allow to evaluate directly the ligand effect of the solvent, which must be relevant in this case

References

  1. Chen, J.; Wang, Z.; Wu, Y.; Li, L.; Li, B.; Pan, D.; Zuo, T. Environmental benefits of secondary copper from primary copper based on life cycle assessment in China. Resour. Conserv. Recycl. 2019, 146, 35–44. [Google Scholar] [CrossRef]
  2. Schipper, B.W.; Lin, H.C.; Meloni, M.A.; Wansleeben, K.; Heijungs, R.; van der Voet, E. Estimating global copper demand until 2100 with regression and stock dynamics. Resour. Conserv. Recycl. 2018, 132, 28–36. [Google Scholar] [CrossRef]
  3. Crundwell, F.K. The dissolution and leaching of minerals: Mechanisms, myths and misunderstandings. Hydrometallurgy 2013, 139, 132–148. [Google Scholar] [CrossRef]
  4. Córdoba, E.M.; Muñoz, J.A.; Blázquez, M.L.; González, F.; Ballester, A. Leaching of chalcopyrite with ferric ion. Part II: Effect of redox potential. Hydrometallurgy 2008, 93, 88–96. [Google Scholar] [CrossRef]
  5. Holmes, P.R.; Crundwell, F.K. Polysulfides do not cause passivation: Results from the dissolution of pyrite and implications for other sulfide minerals. Hydrometallurgy 2013, 139, 101–110. [Google Scholar] [CrossRef]
  6. Jorjani, E.; Ghahreman, A. Challenges with elemental sulfur removal during the leaching of copper and zinc sulfides, and from the residues: A review. Hydrometallurgy 2017, 171, 333–343. [Google Scholar] [CrossRef]
  7. Shin, D.; Ahn, J.; Lee, J. Kinetic study of copper leaching from chalcopyrite concentrate in alkaline glycine solution. Hydrometallurgy 2019, 183, 71–78. [Google Scholar] [CrossRef]
  8. Crundwell, F.K. The mechanism of dissolution of minerals in acidic and alkaline solutions: Part IV—Equilibrium and near-equilibrium behaviour. Hydrometallurgy 2015, 153, 46–57. [Google Scholar] [CrossRef]
  9. Crundwell, F.K. The mechanism of dissolution of minerals in acidic and alkaline solutions: Part I—A new theory of non-oxidation dissolution. Hydrometallurgy 2014, 149, 252–264. [Google Scholar] [CrossRef]
  10. Binnemans, K.; Jones, P.T. Solvometallurgy: An emerging branch of extractive metallurgy. J. Sustain. Metall. 2017, 3, 570–600. [Google Scholar] [CrossRef] [Green Version]
  11. Abbott, A.P.; Frisch, G.; Gurman, S.J.; Hillman, A.R.; Hartley, J.; Holyoak, F.; Ryder, K.S. Ionometallurgy: Designer redox properties for metal processing. Chem. Commun. 2011, 47, 10031–10033. [Google Scholar] [CrossRef] [PubMed]
  12. Smith, E.L.; Abbott, A.P.; Ryder, K.S. Deep Eutectic Solvents (DESs) and their applications. Chem. Rev. 2014, 114, 11060–11082. [Google Scholar] [CrossRef] [PubMed] [Green Version]
  13. Carlesi, C.; Cortes, E.; Dibernardi, G.; Morales, J.; Muñoz, E. Ionic liquids as additives for acid leaching of copper from sulfidic ores. Hydrometallurgy 2016, 161, 29–33. [Google Scholar] [CrossRef]
  14. Dong, T.; Hua, Y.; Zhang, Q.; Zhou, D. Leaching of chalcopyrite with Brønsted acidic ionic liquid. Hydrometallurgy 2009, 99, 33–38. [Google Scholar] [CrossRef]
  15. Whitehead, J.A.; Zhang, J.; Pereira, N.; McCluskey, A.; Lawrance, G.A. Application of 1-alkyl-3-methyl-imidazolium ionic liquids in the oxidative leaching of sulphidic copper, gold and silver ores. Hydrometallurgy 2007, 88, 109–120. [Google Scholar] [CrossRef]
  16. Jenkin, G.R.T.; Al-Bassam, A.Z.M.; Harris, R.C.; Abbott, A.P.; Smith, D.J.; Holwell, D.A.; Chapman, R.J.; Stanley, C.J. The application of deep eutectic solvent ionic liquids for environmentally-friendly dissolution and recovery of precious metals. Miner. Eng. 2016, 87, 18–24. [Google Scholar] [CrossRef] [Green Version]
  17. Anggara, S.; Bevan, F.; Harris, R.C.; Hartley, J.M.; Frisch, G.; Jenkin, G.R.T.; Abbott, A.P. Direct extraction of copper from copper sulfide minerals using deep eutectic solvents. Green Chem. 2019, 21, 6502–6512. [Google Scholar] [CrossRef]
  18. Hammond, O. Deep Eutectic Solvent: Sructure, Solvation and Synhesis. Ph.D. Thesis, University of Bath, Bath, UK, 2019. [Google Scholar]
  19. Xie, Y.; Dong, H.; Zhang, S.; Lu, X.; Ji, X. Effect of water on the density, viscosity, and CO2 solubility in choline chloride/urea. J. Chem. Eng. Data 2014, 59, 3344–3352. [Google Scholar] [CrossRef]
  20. Chen, Y.; Yu, D.; Chen, W.; Fu, L.; Mu, T. Water absorption by deep eutectic solvents. Phys. Chem. Chem. Phys. 2019, 21, 2601–2610. [Google Scholar] [CrossRef]
  21. Carlesi, C.; Guajardo, N.; Schrebler, R.; Vasquez-Sandoval, D. Greener gas capture in deep eutectic solvents aqueous solutions: Performance in a dynamic condition. J. Clean. Prod. 2019, 240, 118240. [Google Scholar] [CrossRef]
  22. Abbott, A.P.; Alabdullah, S.S.M.; Al-Murshedi, A.Y.M.; Ryder, K.S. Brønsted acidity in deep eutectic solvents and ionic liquids. Faraday Discuss. 2018, 206, 365–377. [Google Scholar] [CrossRef]
  23. Skulcova, A.; Russ, A.; Jablonsky, M.; Sima, J. The pH behavior of seventeen deep eutectic solvents. BioResources 2019, 13, 5042–5051. [Google Scholar] [CrossRef]
  24. Abbott, A.P.; Capper, G.; Davies, D.L.; McKenzie, K.J.; Obi, S.U. Solubility of metal oxides in deep eutectic solvents based on choline chloride. J. Chem. Eng. Data 2006, 51, 1280–1282. [Google Scholar] [CrossRef]
  25. Greenz, T.A.; Valverde, P.; Roy, S. Anodic reactions and the corrosion of copper in deep eutectic solvents. J. Electrochem. Soc. 2018, 165, D313–D320. [Google Scholar] [CrossRef]
  26. Tang, J.; Xu, C.; Zhu, X.; Liu, H.; Wang, X.; Huang, M.; Hua, Y.; Zhang, Q.; Li, Y. Anodic dissolution of copper in choline chloride-urea deep eutectic solvent. J. Electrochem. Soc. 2018, 165, E406–E411. [Google Scholar] [CrossRef]
  27. Doche, M.L.; Mandroyan, A.; Mourad-Mahmoud, M.; Moutarlier, V.; Hihn, J.Y. An ultrasonic-assisted process for copper recovery in a DES solvent: Leaching and re-depositation. Chem. Eng. Process. Process Intensif. 2017, 121, 90–96. [Google Scholar] [CrossRef]
  28. De Vreese, P.; Brooks, N.R.; van Hecke, K.; van Meervelt, L.; Matthijs, E.; Binnemans, K.; van Deun, R. Speciation of copper(II) complexes in an ionic liquid based on choline chloride and in choline chloride/water mixtures. Inorg. Chem. 2012, 51, 4972–4981. [Google Scholar] [CrossRef]
  29. Khawam, A.; Flanagan, D.R. Solid-state kinetic models: Basics and mathematical fundamentals. J. Phys. Chem. B 2006, 110, 17315–17328. [Google Scholar] [CrossRef]
  30. Cao, Y.; Harjanto, S.; Shibayama, A.; Naitoh, I.; Nanami, T.; Kasahara, K.; Okumura, Y.; Fujita, T. Kinetic study on the leaching of Pt, Pd and Rh from automotive catalyst residue by using chloride solutions. Mat. Transact. 2015, 47, 2015–2024. [Google Scholar] [CrossRef] [Green Version]
  31. Kumar, K.V.; Khaddour, I.A.; Gupta, V.K. A pseudo second-order kinetic expression for dissolution kinetic profiles of solids in solutions. Ind. Eng. Chem. Res. 2010, 49, 7257–7262. [Google Scholar] [CrossRef]
  32. Kuzmina, O.; Symianakis, E.; Godfrey, D.; Albrecht, T.; Welton, T. Ionic liquids for metal extraction from chalcopyrite: Solid, liquid and gas phase studies. Phys. Chem. Chem. Phys. 2017, 19, 21556–21564. [Google Scholar] [CrossRef] [PubMed]
  33. Havlik, T. Microwave leaching of chalcopyrite—Possible improvement in hydrometallurgy. Metall 2010, 64, 236–239. [Google Scholar]
  34. Abbott, A.P.; El Ttaib, K.; Frisch, G.; Mckenzie, K.J.; Ryder, K.S. Electrodeposition of copper composites from deep eutectic solvents based on choline chloride. Phys. Chem. Chem. Phys. 2009, 11, 4269–4277. [Google Scholar] [CrossRef] [PubMed]
Figure 1. Kinetics of chalcopyrite dissolution in terms of dissolved fraction at different temperatures: 19.5 °C (circles), 50 °C (squares), 80 °C (diamond), 90 °C (triangles). Molar liquid to solid ratio: 9.88.
Minerals 12 00065 g001
Figure 2. Final dissolved fraction as a function of the ratio between deep eutectic solvent molar content to molar copper content in chalcopyrite solid. Dissolution time: 240 min; Temperature: 50 °C.
Minerals 12 00065 g002
Figure 3. UV-Vis spectra of liquid samples corresponding to different initial molar ratio between the deep eutectic solvent to copper contained in the chalcopyrite sample (mol mol−1): (A) 88.36; (B) 41.22; (C) 20.94; (D) 9.88; (E) 5.03. Dilution factor for the UV measurements: 100; Dissolution time: 240 min; Temperature: 50 °C. Inset graph: correlation between maximum absorbance at 268.8 nm and in solution copper mass concentration (mg mL−1).
Minerals 12 00065 g003
Figure 4. Correlation between the ratio of the initial molar copper content in chalcopyrite and the deep eutectic solvent molar content with the copper solution concentration after 240 min of dissolution at temperature of 50 °C.
Minerals 12 00065 g004
Figure 5. Graphical determination of kinetics constant based on proposed kinetic model at different temperatures: 19.5 °C (circles), 50 °C (squares), 80 °C (diamond), 90° (triangles). Molar liquid to solid ratio: 9.88 (mol DES/mol initial Cu in chalcopyrite).
Minerals 12 00065 g005
Figure 6. Arrhenius plot for the data in Table 3. Molar liquid to solid ratio: 9.88 (mol DES/mol initial Cu in chalcopyrite).
Minerals 12 00065 g006
Table 1. Weight percentages of metal sulfides and oxides of the mineral concentrate.
SulfidesOxides
ComponentChemical Formulaewt (%)ComponentChemical Formulaewt (%)
ChalcopyriteCuFeS272.182Magnetite/Hematite/GoethiteFe3O4/Fe2O3/FeO(OH)0.137
BorniteCu5FeS40.574Alumo-goethite/HarrisoniteFe(Al)O(OH)/CaFe6(SiO4)2(PO4)20.020
CovelliteCuS0.143RutileTiO20.479
ChalcociteCu2S/Cu5S20.131IlmeniteFeTiO30.024
EnargiteCu3AsS40.251Total Oxides 0.660
TennantiteCu11FeAs4S133.509
PyriteFeS29.994
SphaleriteZn0.9Fe0.05S0.369
ArsenopyriteFeAsS0.004
MolybdeniteMoS21.568
Other Sulfides 0.154
Total Sulfides 88.879
Table 2. Weight percentages of gangue components of the mineral concentrate.
ComponentWeight Percentage (%)
Quartz2.243
K-Feldspar1.805
Albite0.711
Zoisite0.002
Tourmaline0.420
Amphiboles0.025
Muscovite3.637
Biotite0.432
Kaolinite0.226
Montmorillonite0.057
Other clays0.011
Chlorites0.214
Zircon0.057
Titanite0.001
Calcite0.036
Dolomite0.065
Mn-siderite0.393
Anhydrite0.018
Jarosite0.002
Other sulfates0.005
Apatite0.091
Other phosphates0.007
Others minor components0.004
Total gangue10.462
Table 3. Data resulting from fitting Equation (4) to the data in Figure 1. Molar liquid to solid ratio: 9.88 (mol DES/mol initial Cu in chalcopyrite).
Temperature (°C)19.5508090
Slope of linear regression0.8750.5630.4050.377
Intercept of linear regression10.937.956.406.28
Maximum dissolution fraction [αs]0.09150.1260.1560.159
Apparent kinetic constant [k] (s−1) 0.2080.2350.2630.277
Coefficient of correlation [R2]0.9290.9940.9760.979
Publisher’s Note: MDPI stays neutral with regard to jurisdictional claims in published maps and institutional affiliations.