
Mapping Main Structures and Related Mineralization of the Arabian Shield (Saudi Arabia) Using Sharp Edge Detector of Transformed Gravity Data

 ,
,  , ,
, ,
Abstract
:1. Introduction
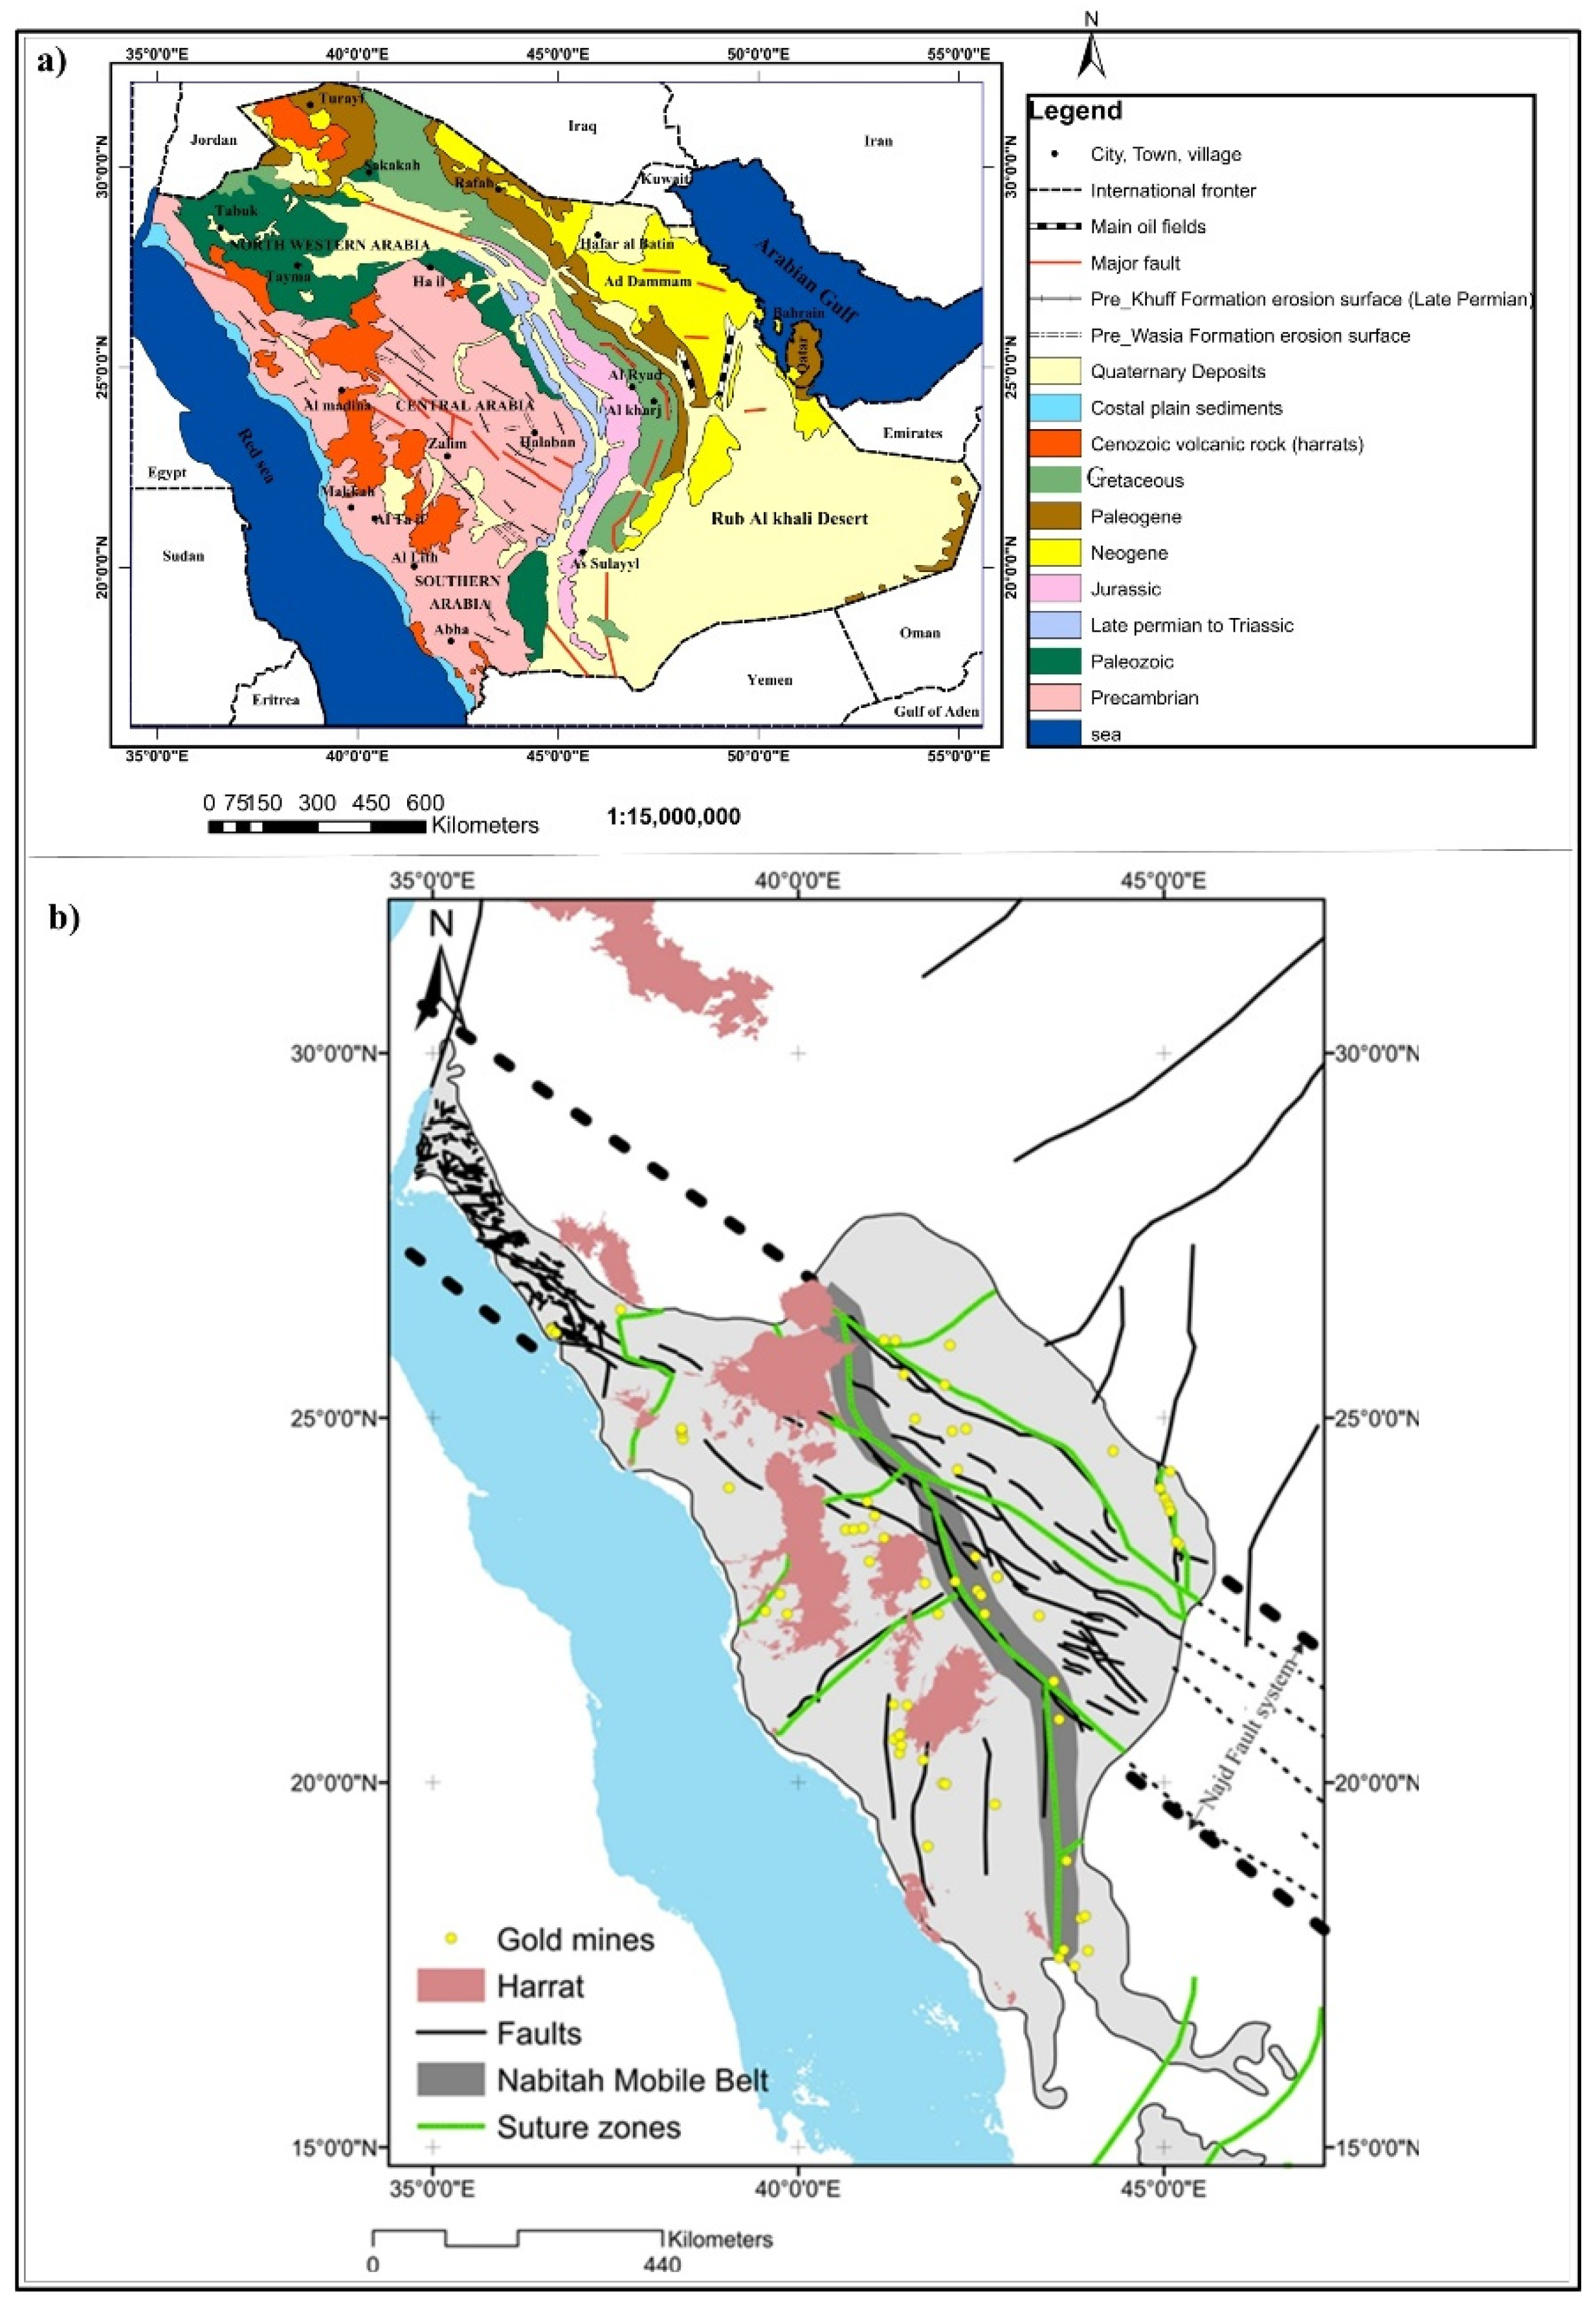
2. Geology
Ore Deposits on the Arabian Shield
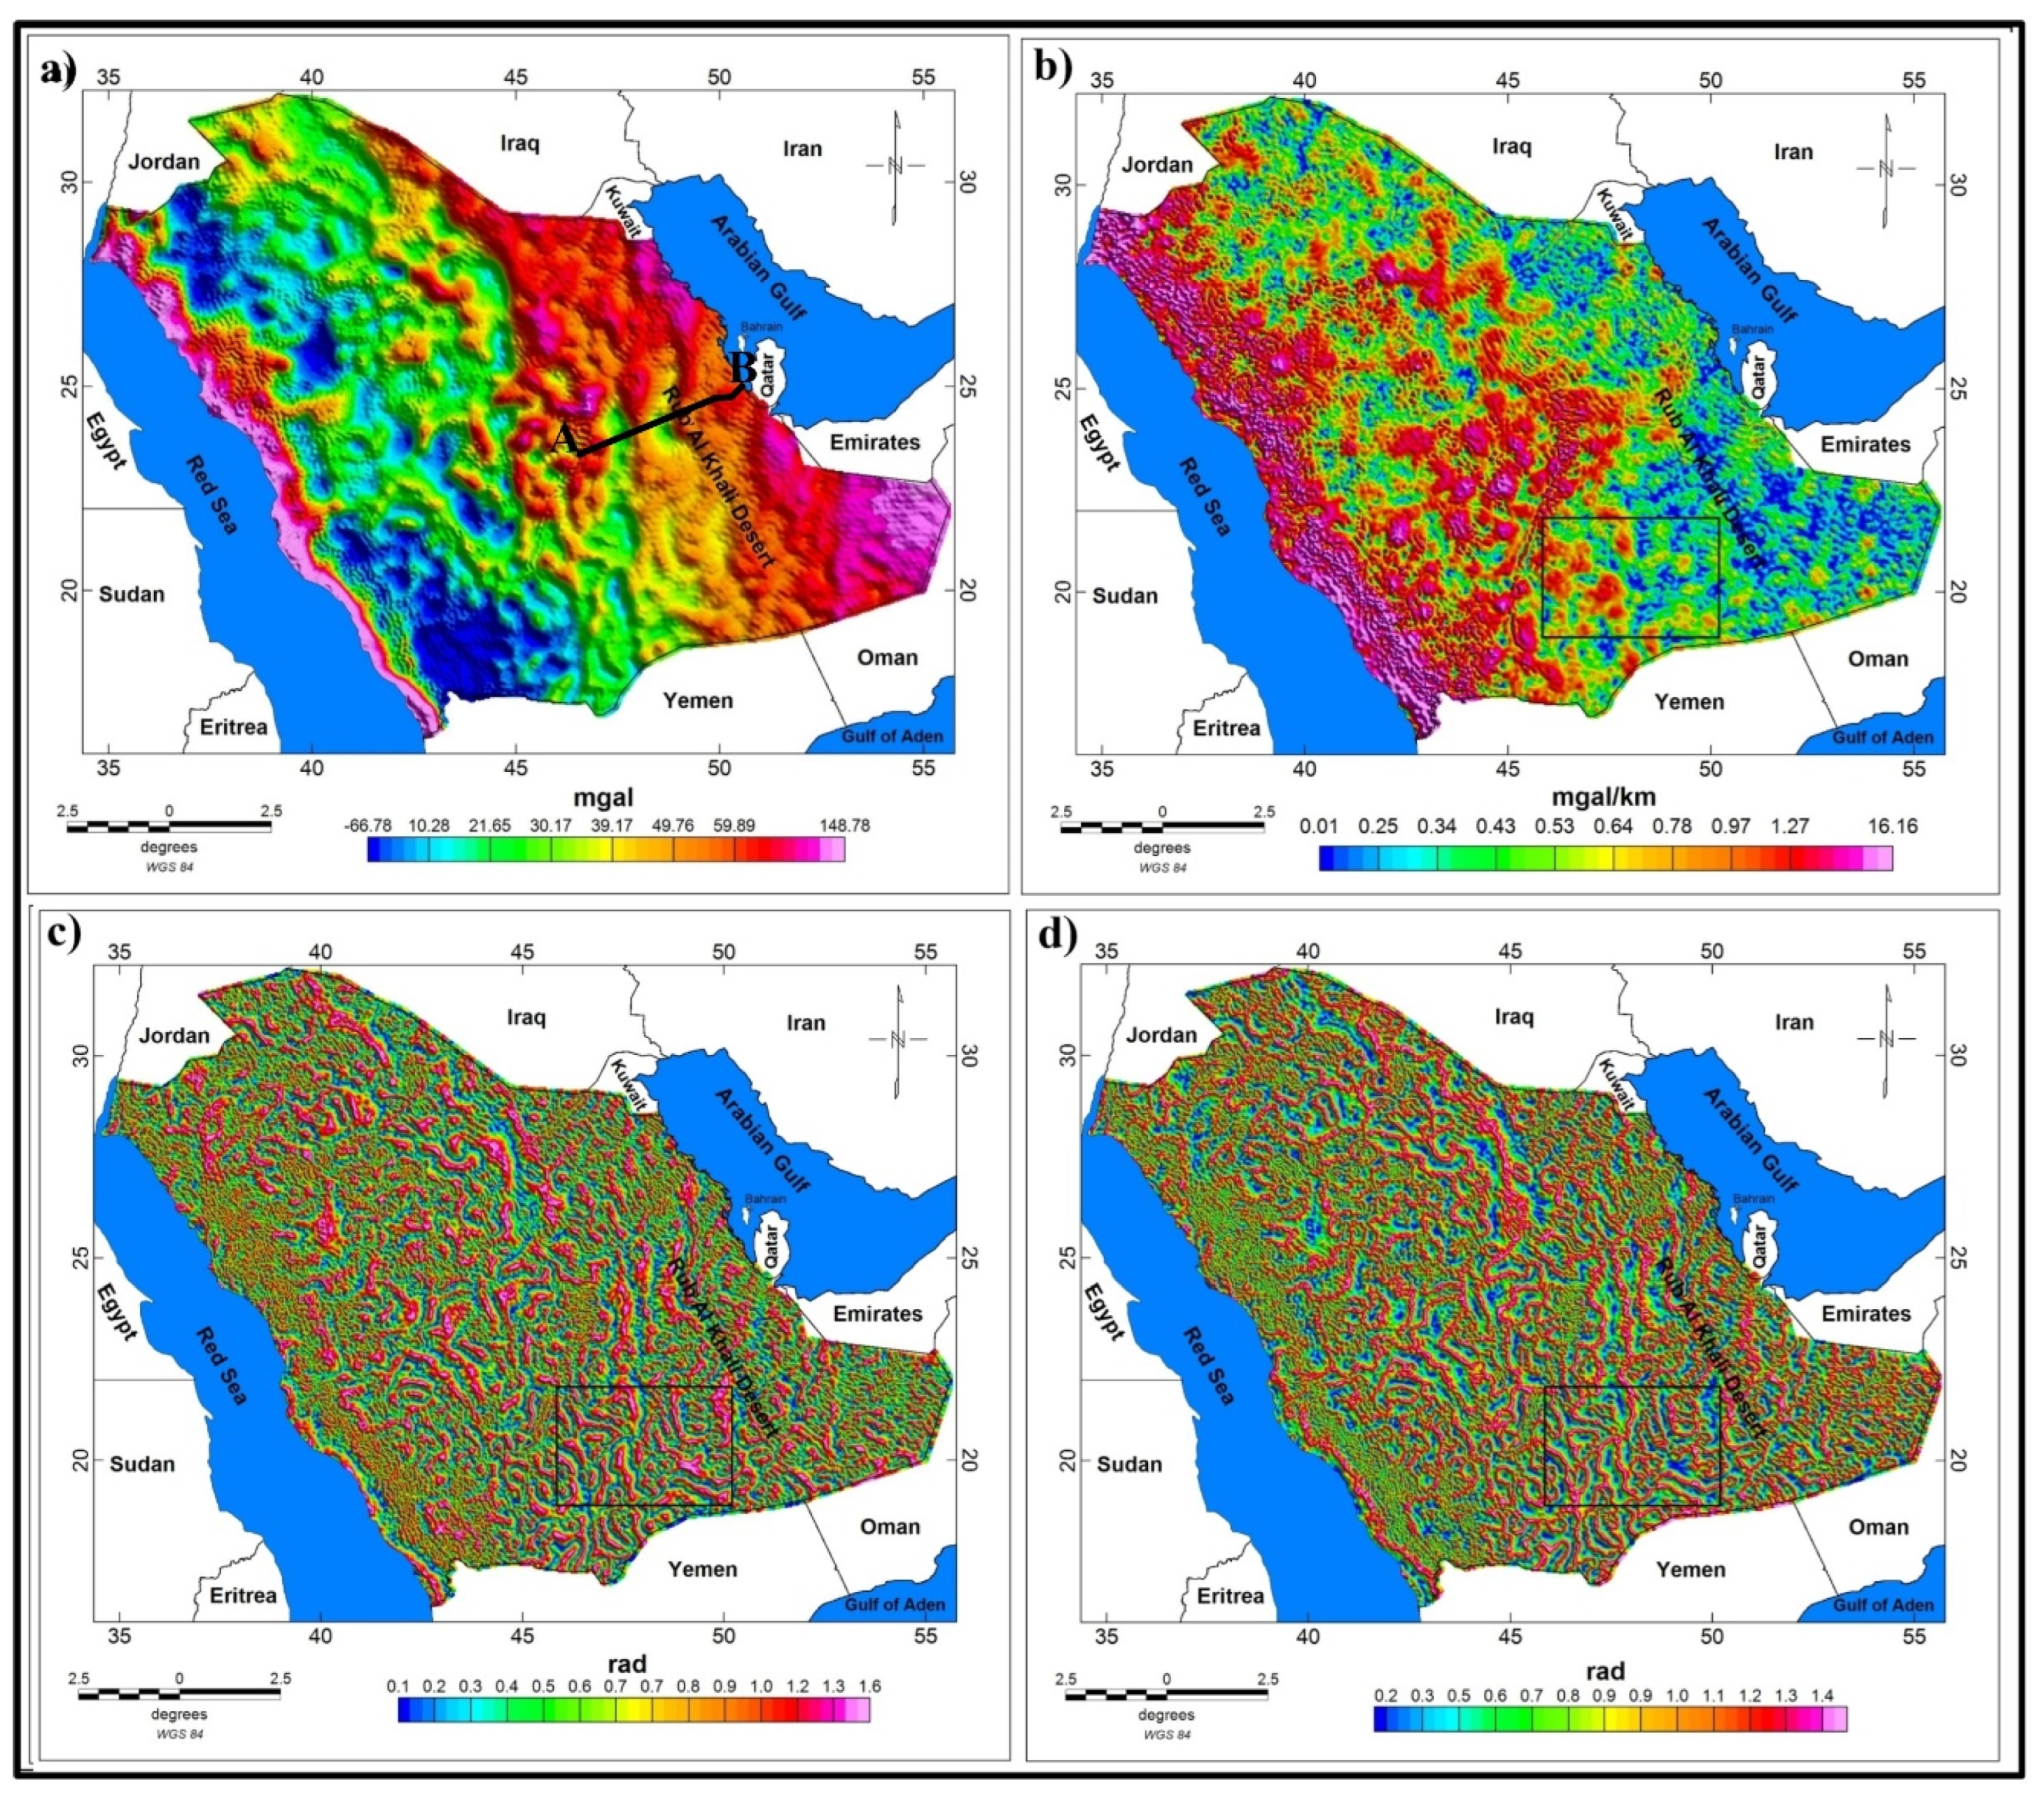
3. Gravity Data Analysis Methodology
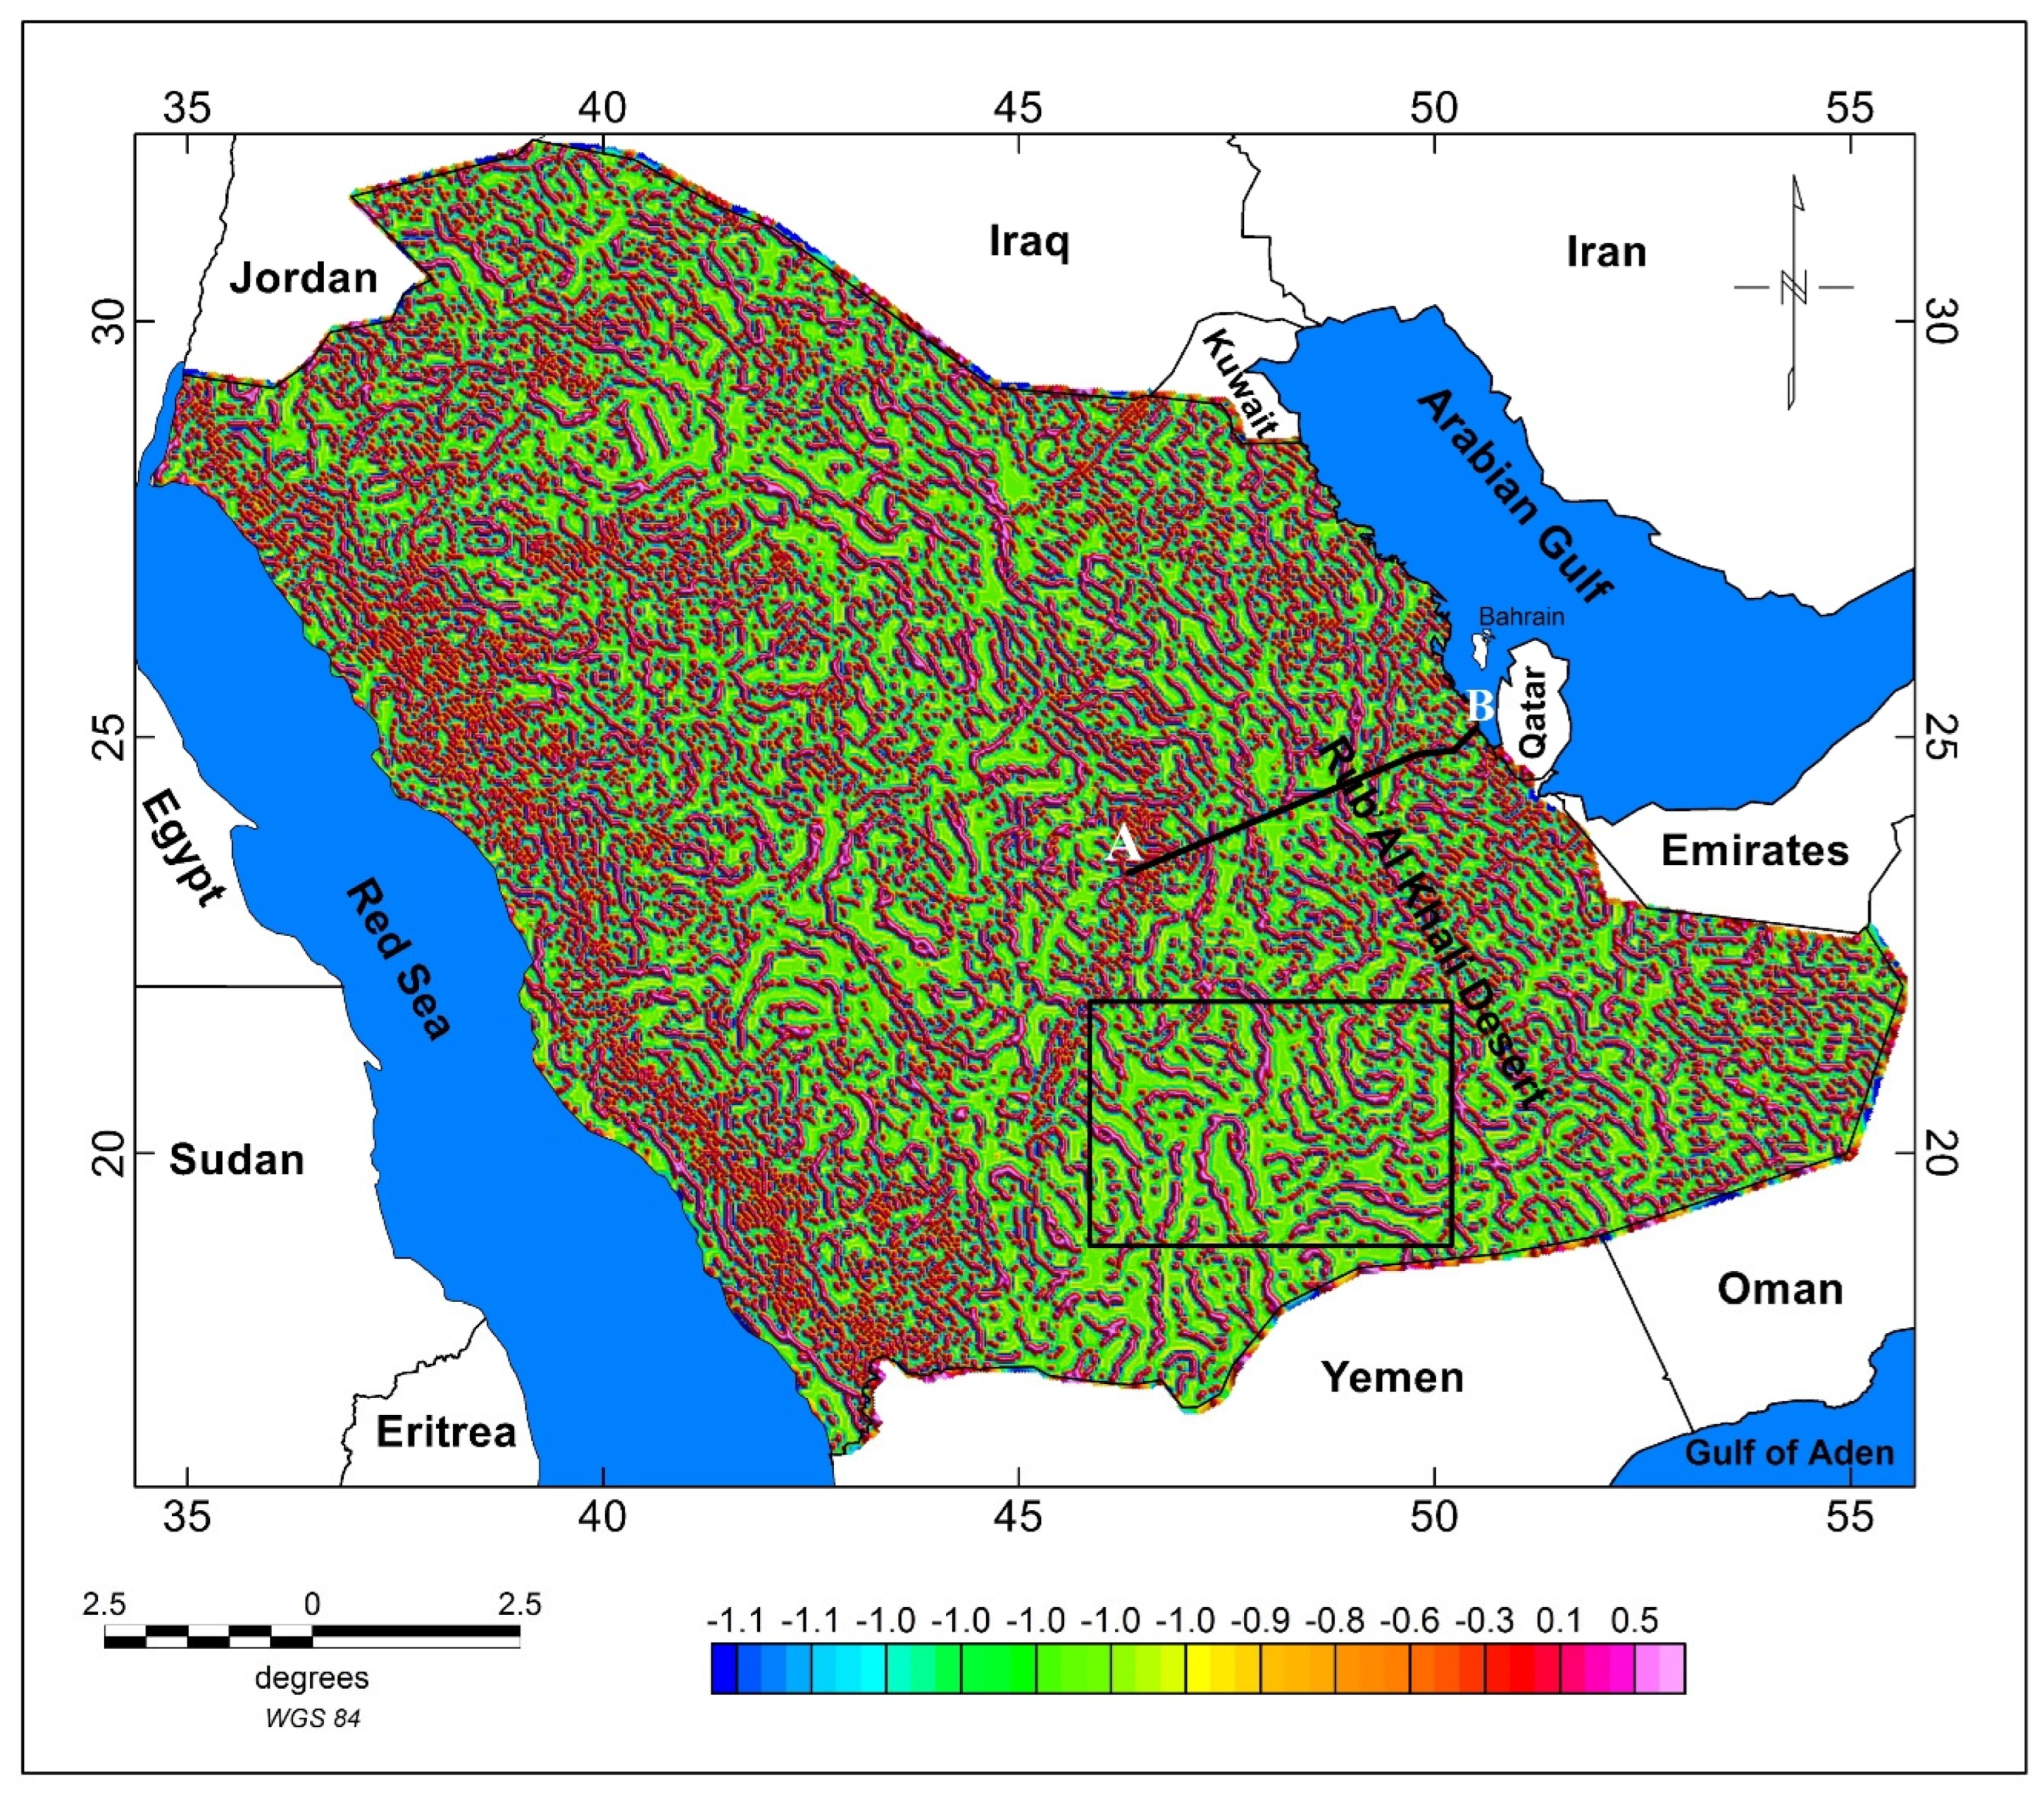
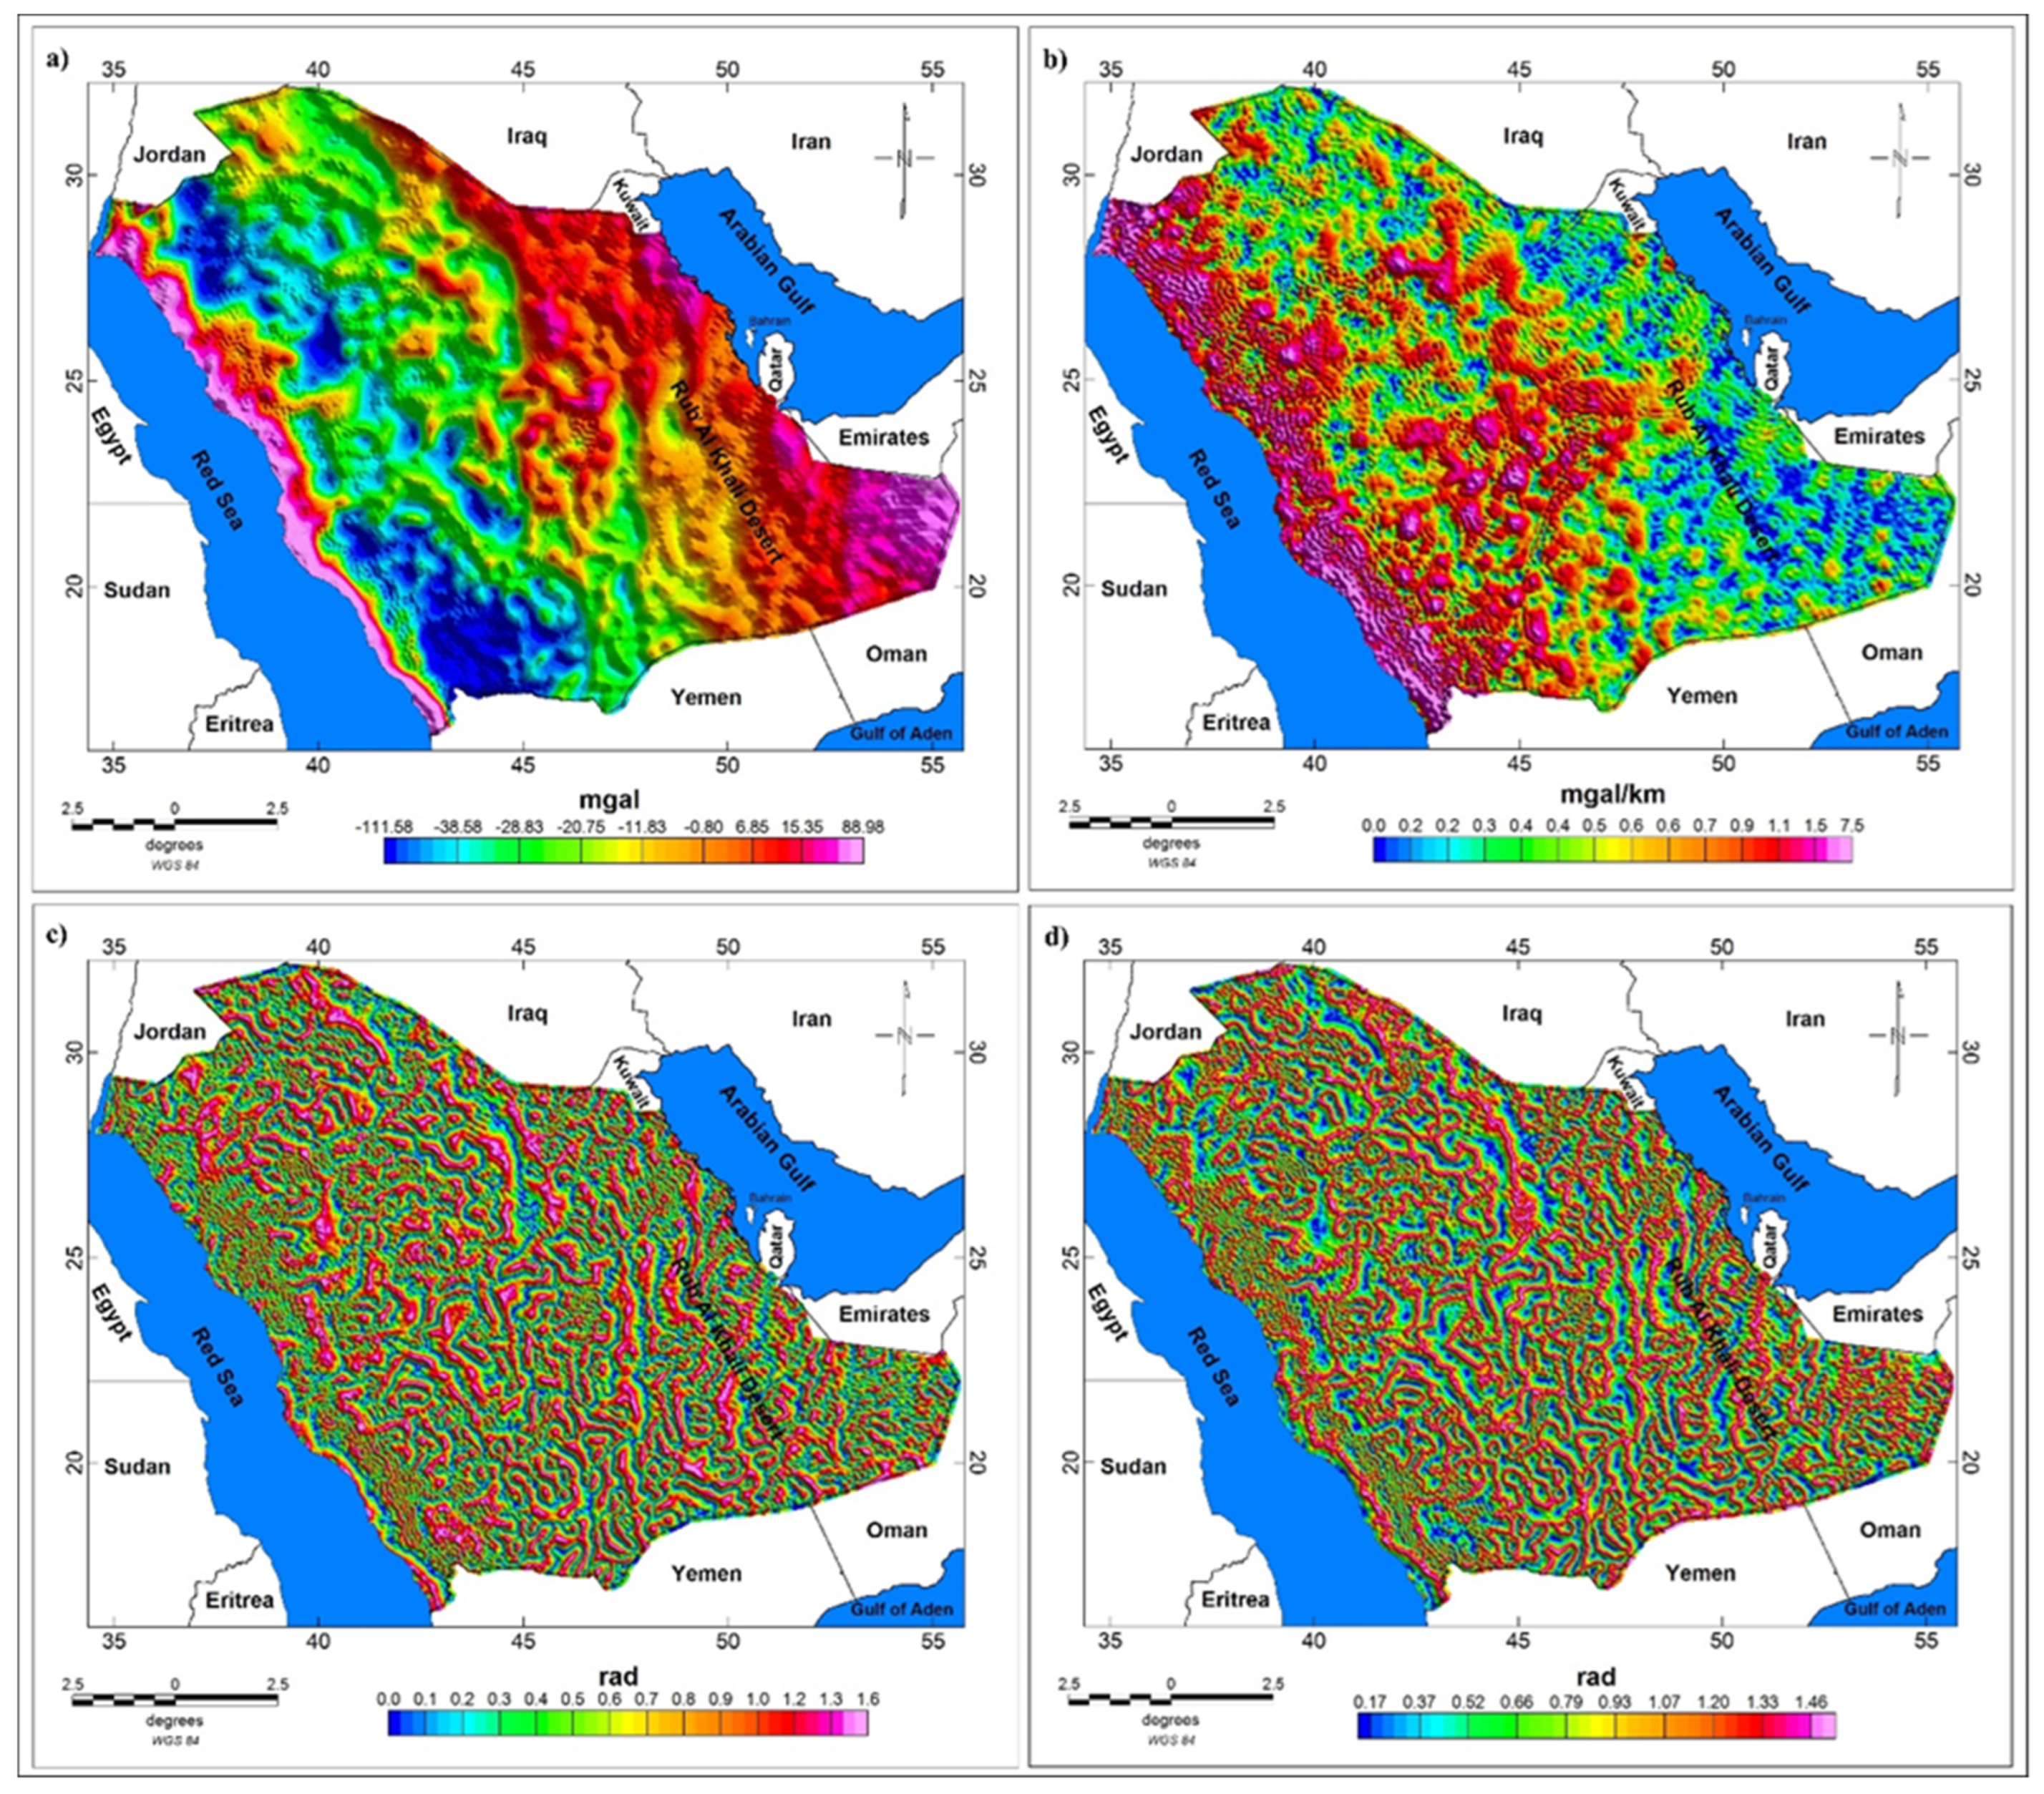
4. Results
5. Discussion
5.1. The Traced Lineament Inspection by Application of the Various Detectors
5.2. The Relationship between the Main Structures and Au Mineralization
6. Conclusions
Author Contributions
Funding
Data Availability Statement
Acknowledgments
Conflicts of Interest
References
- Darwish, M.; Butt, N. Mineral Resource Potential and Its Development in Saudi Arabia. J. King Abdulaziz Univ. Sci. 1996, 8, 107–120. [Google Scholar] [CrossRef]
- Ministry of Planning KSA, 1985–1990; Fourth Development Plan: Riyadh, Saudi Arabia, 1985; pp. 167–184.
- Kafadar, O. CURVGRAV-GUI: A graphical user interface to interpret gravity data using curvature technique. Earth Sci. Inform. 2017, 10, 525–537. [Google Scholar] [CrossRef]
- Eldosouky, A.M.; Saada, S.A. Source edge detection (SED) of aeromagnetic data: Synthetic examples and a case study from Haimur area, south Eastern Desert, Egypt. Arab. J. Geosci. 2020, 13, 1–12. [Google Scholar] [CrossRef]
- Pham, L.T.; Oksum, E.; Vu, M.D.; Vo, Q.T.; Le-Viet, K.D.; Eldosouky, A.M. An improved approach for detecting ridge locations to interpret the potential feld data for more accurate structural mapping: A case study from Vredefort dome area (South Africa). J. Afr. Earth Sci. 2021, 175, 104099. [Google Scholar] [CrossRef]
- Pham, L.T.; Kafadar, O.; Oksum, E.; Eldosouky, A.M. An improved approach for detecting the locations of the maxima in interpreting potential feld data. Arab. J. Geosci. 2021, 14, 43. [Google Scholar] [CrossRef]
- Eldosouky, A.M.; Mohamed, H. Edge detection of aeromagnetic data as effective tools for structural imaging at Shilman area, South Eastern Desert, Egypt. Arab. J. Geosci. 2021, 14, 1–10. [Google Scholar] [CrossRef]
- Eldosouky, A.M.; Abdelkareem, M.; Elkhateeb, S.O. Integration of remote sensing and aeromagnetic data for mapping structural features and hydrothermal alteration zones in Wadi Allaqi area, South Eastern Desert of Egypt. J. Afr. Earth Sci. 2017, 130, 28–37. [Google Scholar] [CrossRef]
- Eldosouky, A.; Sehsah, H.; Elkhateeb, S.O.; Pour, A.B. Integrating aeromagnetic data and Landsat-8 imagery for detection of post-accretionary shear zones controlling hydrothermal alterations: The Allaqi-Heiani Suture zone, South Eastern Desert, Egypt. Adv. Space Res. 2020, 65, 1008–1024. [Google Scholar] [CrossRef]
- Eldosouky, A.M.; El-Qassas, R.A.; Pour, A.B.; Mohamed, H.; Sekandari, M. Integration of ASTER satellite imagery and 3D inversion of aeromagnetic data for deep mineral exploration. Adv. Space Res. 2021, 68, 3641–3662. [Google Scholar] [CrossRef]
- Oksum, E.; Le, D.V.; Vu, M.D.; Nguyen, T.H.T.; Pham, L.T. A novel approach based on the fast sigmoid function for interpretation of potential field data. Boll. Geofis. Teor. Appl. 2021, 10, 543–556. [Google Scholar] [CrossRef]
- Elkhateeb, S.O.; Eldosouky, A.M.; Khalifa, M.O.; Aboalhassan, M. Probability of mineral occurrence in the Southeast of Aswan area, Egypt, from the analysis of aeromagnetic data. Arab. J. Geosci. 2021, 14, 1–12. [Google Scholar] [CrossRef]
- Pham, L.T. A comparative study on different filters for enhancing potential field source boundaries: Synthetic examples and a case study from the Song Hong Trough (Vietnam). Arab. J. Geosci. 2020, 13, 1–10. [Google Scholar] [CrossRef]
- Pham, L.T. A high resolution edge detector for interpreting potential field data: A case study from the Witwatersrand basin, South Africa. J. Afr. Earth Sci. 2021, 178, 104190. [Google Scholar] [CrossRef]
- Evjen, H.M. The place of the vertical gradient in gravitational interpretations. Geophysics 1936, 1, 127–136. [Google Scholar] [CrossRef]
- Cordell, L.; Grauch, V.J.S. Mapping Basement Magnetization Zones from Aeromagnetic Data in the San Juan Basin, New Mexico, in The Utility of Regional Gravity and Magnetic Maps, 1st ed.; Hinze, W.J., Ed.; Society of Exploration Geophysicists: Tulsa, OK, USA, 1985; pp. 181–197. [Google Scholar]
- Roest, W.; Verhoef, J.; Pilkington, M. Magnetic interpretation using the 3-D analytic signal. Geophysics 1992, 57, 116–125. [Google Scholar] [CrossRef]
- Beiki, M. Analytic signals of gravity gradient tensor and their application to estimate source location. Geophysics 2010, 75, I59–I74. [Google Scholar] [CrossRef]
- Pham, L.T.; Eldosouky, A.M.; Oksum, E.; Saada, S.A. A new high resolution filter for source edge detection of potential field data. Geocarto Int. 2020, 1–18. [Google Scholar] [CrossRef]
- Pham, L.T.; Van Vu, T.; Le Thi, S.; Trinh, P.T. Enhancement of Potential Field Source Boundaries Using an Improved Logistic Filter. Pure Appl. Geophys. 2020, 177, 5237–5249. [Google Scholar] [CrossRef]
- Miller, H.G.; Singh, V. Potential field tilt—A new concept for location of potential field sources. J. Appl. Geophys. 1994, 32, 213–217. [Google Scholar] [CrossRef]
- Wijns, C.; Perez, C.; Kowalczyk, P. Theta map: Edge detection in magnetic data. Geophysics 2005, 70, L39–L43. [Google Scholar] [CrossRef]
- Cooper, G.; Cowan, D. Enhancing potential field data using filters based on the local phase. Comput. Geosci. 2006, 32, 1585–1591. [Google Scholar] [CrossRef]
- Pham, L.T.; Oksum, E.; Do, T.D.; Nguyen, D.V.; Eldosouky, A.M. On the performance of phase-based filters for enhancing lateral boundaries of magnetic and gravity sources: A case study of the Seattle uplift. Arab. J. Geosci. 2021, 14, 1–11. [Google Scholar] [CrossRef]
- Pham, L.T.; Vu, M.D.; Le, S.T. Performance Evaluation of Amplitude- and Phase-Based Methods for Estimating Edges of Potential Field Sources. Iran. J. Sci. Technol. Trans. A Sci. 2021, 45, 1327–1339. [Google Scholar] [CrossRef]
- Ferreira, F.J.F.; de Souza, J.; de Bongiolo, A.B.e.S.; de Castro, L.G. Enhancement of the total horizontal gradient of magnetic anomalies using the tilt angle. Geophysics 2013, 78, J33–J41. [Google Scholar] [CrossRef]
- Pham, L.T.; Nguyen, D.A.; Eldosouky, A.M.; Abdelrahman, K.; Van Vu, T.; Al-Otaibi, N.; Ibrahim, E.; Kharbish, S. Subsurface structural mapping from high-resolution gravity data using advanced processing methods. J. King Saud Univ. Sci. 2021, 33, 101488. [Google Scholar] [CrossRef]
- Melouah, O.; Pham, L.T. An improved ILTHG method for edge enhancement of geological structures: Application to gravity data from the Oued Righ valley. J. Afr. Earth Sci. 2021, 177, 104162. [Google Scholar] [CrossRef]
- Pham, L.T.; Oksum, E.; Van Le, D.; Ferreira, F.J.F.; Le, S.T. Edge detection of potential field sources using the softsign function. Geocarto Int. 2021, 1–14. [Google Scholar] [CrossRef]
- Al-Refeai, T.; Al-Ghamdy, D. Geological and geotechnical aspects of Saudi Arabia. Geotech. Geol. Eng. 1994, 12, 253–276. [Google Scholar] [CrossRef]
- Johnson, P.R. Proterozoic Geology of Western Saudi Arabia—Southern Sheet, Saudi Geological Survey, Open-File Report USGS-OF-99-7. 2000. [Google Scholar]
- Stern, R.J.; Johnson, P. Continental lithosphere of the Arabian Plate: A geologic, petrologic, and geophysical synthesis. Earth-Sci. Rev. 2010, 101, 29–67. [Google Scholar] [CrossRef]
- Fritz, H.; Abdelsalam, M.; Ali, K.; Bingen, B.; Collins, A.; Fowler, A.; Ghebreab, W.; Hauzenberger, C.; Johnson, P.; Kusky, T.; et al. Orogen styles in the East African Orogen: A review of the Neoproterozoic to Cambrian tectonic evolution. J. Afr. Earth Sci. 2013, 86, 65–106. [Google Scholar] [CrossRef]
- Laboun, A.A. The Paleozoic Geology of Saudi Arabia: History, Tectono-Stratigraphy, Glaciations, and Natural Resources. In The Structural Geology Contribution to the Africa-Eurasia Geology: Basement and Reservoir Structure, Ore Mineralisation and Tectonic Modellin; Springer: Berlin/Heidelberg, Germany, 2019; pp. 99–103. [Google Scholar]
- Powers, R.W. Lexique Stratigraphic International-Saudi Arabia. 2010. Available online: http://paleopolis.rediris.es/LEXICON/KSA/Plate_01.htm (accessed on 27 March 2014).
- Sahin, A. Mineral resources for in-situ carbonation of CO2 in the Arabian Shield. Int. J. Glob. Warm. 2016, 9, 275. [Google Scholar] [CrossRef]
- Johnson, P.; Andresen, A.; Collins, A.; Fowler, A.; Fritz, H.; Ghebreab, W.; Kusky, T.; Stern, R. Late Cryogenian–Ediacaran history of the Arabian–Nubian Shield: A review of depositional, plutonic, structural, and tectonic events in the closing stages of the northern East African Orogen. J. Afr. Earth Sci. 2011, 61, 167–232. [Google Scholar] [CrossRef]
- Robinson, F.A.; Bonin, B.; Pease, V.; Anderson, J.L. A discussion on the tectonic implications of Ediacaran late-to post-orogenic A-type granite in the northeastern Arabian Shield, Saudi Arabia. Tectonics 2017, 36, 582–600. [Google Scholar] [CrossRef]
- Stern, R.J. The Najd Fault System, Saudi Arabia and Egypt: A Late Precambrian rift-related transform system? Tectonics 1985, 4, 497–511. [Google Scholar] [CrossRef]
- Meyer, S.E.; Passchier, C.; Abu-Alam, T.; Stüwe, K. A strike-slip core complex from the Najd fault system, Arabian shield. Terra Nova 2014, 26, 387–394. [Google Scholar] [CrossRef]
- Brown, G.F. Eastern margin of the Red Sea and the coastal structures in Saudi Arabia. Philos. Trans. R. Soc. Lond. A 1970, 267, 75–87. [Google Scholar]
- Stewart, S.A. Structural geology of the Rub’ Al-Khali Basin, Saudi Arabia. Tectonics 2016, 35, 2417–2438. [Google Scholar] [CrossRef]
- Rodgers, A.J.; Walter, W.R.; Mellors, R.J.; Al-Amri, A.M.S.; Zhang, Y.-S. Lithospheric structure of the Arabian Shield and Platform from complete regional waveform modelling and surface wave group velocities. Geophys. J. Int. 1999, 138, 871–878. [Google Scholar] [CrossRef] [Green Version]
- Al-Damegh, K.; Sandvol, E.; Barazangi, M. Crustal structure of the Arabian plate: New constraints from the analysis of teleseismic receiver functions. Earth Planet. Sci. Lett. 2005, 231, 177–196. [Google Scholar] [CrossRef] [Green Version]
- Abdelsalam, M.G.; Abdeen, M.M.; Dowaidar, H.M.; Stern, R.J.; Abdelghaffar, A.A. Structural evolution of the Neoproterozoic Western Allaqi–Heiani suture, southeastern Egypt. Precambrian Res. 2003, 124, 87–104. [Google Scholar] [CrossRef]
- Ali, K.; Azer, M.; Gahlan, H.; Wilde, S.; Samuel, M.; Stern, R. Age constraints on the formation and emplacement of Neoproterozoic ophiolites along the Allaqi–Heiani Suture, South Eastern Desert of Egypt. Gondwana Res. 2010, 18, 583–595. [Google Scholar] [CrossRef]
- Abdelsalam, M.G. Quantifying 3D post-accretionary tectonic strain in the Arabian–Nubian Shield: Superimposition of the Oko Shear Zone on the Nakasib Suture, Red Sea Hills, Sudan. J. Afr. Earth Sci. 2010, 56, 167–178. [Google Scholar] [CrossRef]
- Abdelsalam, M.G.; Stern, R.J. Structure of the late Proterozoic Nakasib suture, Sudan. J. Geol. Soc. 1993, 150, 1065–1074. [Google Scholar] [CrossRef] [Green Version]
- Abdelsalam, M.G.; Stern, R.J. Mapping Precambrian structures in the Sahara Desert with SIR-C/X-SAR radar: The Neoproterozoic Keraf Suture, NE Sudan. J. Geophys. Res. Space Phys. 1996, 101, 23063–23076. [Google Scholar] [CrossRef]
- Bailo, T.; Schandelmeier, H.; Franz, G.; Sun, C.-H.; Stern, R. Plutonic and metamorphic rocks from the Keraf Suture (NE Sudan): A glimpse of Neoproterozoic tectonic evolution on the NE margin of W. Gondwana. Precambrian Res. 2003, 123, 67–80. [Google Scholar] [CrossRef]
- Surour, A.A.; Harbi, H.M.; Ahmed, A.H. The Bi’r Tawilah deposit, central western Saudi Arabia: Supergene enrichment of a Pan-African epithermal gold mineralization. J. Afr. Earth Sci. 2014, 89, 149–163. [Google Scholar] [CrossRef]
- Johnson, P.; Zoheir, B.; Ghebreab, W.; Stern, R.; Barrie, C.; Hamer, R. Gold-bearing volcanogenic massive sulfides and orogenic-gold deposits in the Nubian Shield. S. Afr. J. Geol. 2017, 120, 63–76. [Google Scholar] [CrossRef] [Green Version]
- Al-Shanti, A.M.S. Geology of the Arabian Shield; Center for Scientific Publishing, King Abdlaziz University: Jeddah, Saudi Arabia, 1993. [Google Scholar]
- Doebrich, J.L.; Zahony, S.G.; Leavitt, J.D.; Portacio, J.S., Jr.; Siddiqui, A.A.; Wooden, J.L.; Fleck, R.J.; Stein, H.J. Ad Duwayhi, Saudi Arabia: Geology and geochronology of a Neoproterozoic intrusion-related gold system in the Arabian Shield. Econ. Geol. 2004, 99, 713–741. [Google Scholar] [CrossRef]
- Harbi, H.A.; Eldougdoug, A.A.; Al Jahdali, N.S. Evolution of the Arabian shield and associated mineralization. In Proceedings of the 9th Arab Conference of Mineral Resources, Jeddah, Saudi Arabia, 30 October–1 November 2006; pp. 1–11. [Google Scholar]
- Goldfarb, R.; Groves, D.; Gardoll, S. Orogenic gold and geologic time: A global synthesis. Ore Geol. Rev. 2001, 18, 1–75. [Google Scholar] [CrossRef]
- Alessio, B.L.; Blades, M.L.; Murray, G.; Thorpe, B.; Collins, A.S.; Kelsey, D.E.; Foden, J.; Payne, J.; Al-Khirbash, S.; Jourdan, F. Origin and tectonic evolution of the NE basement of Oman: A window into the Neoproterozoic accretionary growth of India? Geol. Mag. 2017, 155, 1150–1174. [Google Scholar] [CrossRef]
- Johnson, P.; Abdelsalam, M.; Stern, R. The Bi’r Umq-Nakasib Suture Zone in the Arabian-Nubian Shield: A Key to Understanding Crustal Growth in the East African Orogen. Gondwana Res. 2003, 6, 523–530. [Google Scholar] [CrossRef]
- Stern, R.J.; Abdelsalam, M.G. Formation of juvenile continental crust in the Arabian–Nubian shield: Evidence from granitic rocks of the Nakasib suture, NE Sudan. Acta Diabetol. 1998, 87, 150–160. [Google Scholar] [CrossRef]
- Stern, R.J.; Kröner, A. Late Precambrian Crustal Evolution in NE Sudan: Isotopic and Geochronologic Constraints. J. Geol. 1993, 101, 555–574. [Google Scholar] [CrossRef]
- Abdelsalam, M.G.; Stern, R.J.; Copeland, P.; Elfaki, E.M.; Elhur, B.; Ibrahim, F.M. The Neoproterozoic Keraf Suture in Ne Sudan: Sinistral Transpression Along the Eastern Margin of West Gondwana. J. Geol. 1998, 106, 133–148. [Google Scholar] [CrossRef]
- Hamimi, Z.; Fowler, A.-R. Najd Shear System in the Arabian-Nubian Shield. In The Geology of the Arabian-Nubian Shield; Springer Science and Business Media LLC: Berlin/Heidelberg, Germany, 2021; pp. 359–392. [Google Scholar]
- Bonavia, F.F.; Chorowicz, J. Neoproterozoic structures in the Mozambique orogenic belt of south Ethiopia. Precambrian Res. 1993, 62, 307–322. [Google Scholar] [CrossRef]
- Moore, J.M.c.M. Tectonics of the Najd transcurrent fault system, Saudi Arabia. J. Geol. Soc. 1979, 136, 441–453. [Google Scholar] [CrossRef]
- Zoheir, B.A.; Johnson, P.R.; Goldfarb, R.J.; Klemm, D.D. Orogenic gold in the Egyptian Eastern Desert: Widespread gold mineralization in the late stages of Neoproterozoic orogeny. Gondwana Res. 2019, 75, 184–217. [Google Scholar] [CrossRef]
- Eldosouky, A.M.; Pham, L.T.; Mohmed, H.; Pradhan, B. A comparative study of THG, AS, TA, Theta, TDX and LTHG techniques for improving source boundaries detection of magnetic data using synthetic models: A case study from G. Um Monqul, North Eastern Desert, Egypt. J. Afr. Earth Sci. 2020, 170, 103940. [Google Scholar] [CrossRef]
- Sultan, M.; Wagdy, A.; Manocha, N.; Sauck, W.; Gelil, K.A.; Youssef, A.; Becker, R.; Milewski, A.; El Alfy, Z.; Jones, C. An integrated approach for identifying aquifers in transcurrent fault systems: The Najd shear system of the Arabian Nubian shield. J. Hydrol. 2008, 349, 475–488. [Google Scholar] [CrossRef]
- Almadani, S.; Ibrahim, E.; Al-Amri, A.; Fnais, M.; Abdelrahman, K. Delineation of a fractured granite aquifer in the Alwadeen area, Southwest Saudi Arabia using a geoelectrical resistivity survey. Arab. J. Geosci. 2019, 12, 1–13. [Google Scholar] [CrossRef]
- Pham, L.T.; Oksum, E.; Do, T.D. Edge enhancement of potential field data using the logistic function and the total horizontal gradient. Acta Geod. Geophys. 2019, 54, 143–155. [Google Scholar] [CrossRef]
- Yao, Y.; Huang, D.; Yu, X.; Chai, B. Edge interpretation of potential field data with the normalized enhanced analytic signal. Acta Geod. Geophys. 2015, 51, 125–136. [Google Scholar] [CrossRef] [Green Version]
- Förste, C.; Bruinsma, S.; Abrikosov, O.; Lemoine, J.-M.; Marty, J.C.; Flechtner, F.; Balmino, G.; Barthelmes, F.; Biancale, R. EIGEN-6C4 The latest combined global gravity field model including GOCE data up to degree and order 2190 of GFZ Potsdam and GRGS Toulouse. GFZ Data Serv. 2014. [Google Scholar] [CrossRef]
- Pal, S.K.; Narayan, S.; Majumdar, T.J.; Kumar, U. Structural mapping over the 85 °E Ridge and surroundings using EIGEN6C4 high-resolution global combined gravity field model: An integrated approach. Mar. Geophys. Res. 2016, 37, 159–184. [Google Scholar] [CrossRef]
- Melouah, O.; Eldosouky, A.M.; Ebong, W.D. Crustal architecture, heat transfer modes and geothermal energy potentials of the Algerian Triassic provinces. Geothermics 2021, 96, 102211. [Google Scholar] [CrossRef]
- Dean, W.C. Frequency analysis for gravity and magnetic interpretation. Geophysics 1958, 23, 97–127. [Google Scholar] [CrossRef]
- Ravat, D.; Whaler, K.A.; Pilkington, M.; Sabaka, T.; Purucker, M. Compatibility of high-altitude aeromagnetic and satellite-altitude magnetic anomalies over Canada. Geophysics 2002, 67, 546–554. [Google Scholar] [CrossRef] [Green Version]
- Eldosouky, A.M.; Elkhateeb, S.O. Texture analysis of aeromagnetic data for enhancing geologic features using co-occurrence matrices in Elallaqi area, South Eastern Desert of Egypt. NRIAG J. Astron. Geophys. 2018, 7, 155–161. [Google Scholar] [CrossRef]
- Sehsah, H.; Eldosouky, A.M.; El Afandy, A.H. Unpaired ophiolite belts in the Neoproterozoic Allaqi-Heiani Suture, the Arabian-Nubian Shield: Evidences from magnetic data. J. Afr. Earth Sci. 2019, 156, 26–34. [Google Scholar] [CrossRef]
- Eldosouky, A.M. Aeromagnetic data for mapping geologic contacts at Samr El-Qaa area, North Eastern Desert, Egypt. Arab. J. Geosci. 2019, 12, 1–13. [Google Scholar] [CrossRef]
- Jacobsen, B.H. A Case for Upward Continuation as a Standard Separation Filter for Potential-Field Maps. Geophysics 1987, 52, 390–398. [Google Scholar] [CrossRef]
- Alsharhan, A.S.; Nairn, A.E.M. Sedimentary Basins and Petroleum Geology of the Middle East; Elsevier: Amsterdam, The Netherlands, 1997; p. 942. [Google Scholar]
- Konert, G.; Afifi, A.M.; Al-Hajri, S.A.; Droste, H.J. Paleozoic stratigraphy and hydrocarbon habitat of the Arabian Plate. GeoArabia 2001, 6, 407–442. [Google Scholar]
- Pollastro, R.M. Total Petroleum Systems of the Paleozoic and Jurassic, Greater Ghawar Uplift and Adjoining Provinces of Central Saudi Arabia and Northern Arabian-Persian Gulf, No. 2202-H of Geological Survey Bulletin; U.S. Geological Survey: Reston, VA, USA, 2003. [Google Scholar]
- Eldosouky, A.M.; Pham, L.T.; El-Qassas, R.A.Y.; Hamimi, Z.; Oksum, E. Lithospheric Structure of the Arabian–Nubian Shield Using Satellite Potential Field Data. In The Geology of the Arabian-Nubian Shield; Springer: Berlin/Heidelberg, Germany, 2021; pp. 139–151. [Google Scholar] [CrossRef]
- Robertson, A. Development of concepts concerning the genesis and emplacement of Tethyan ophiolites in the Eastern Mediterranean and Oman regions. Earth-Sci. Rev. 2004, 66, 331–387. [Google Scholar] [CrossRef]
- Berhe, S.M. Ophiolites in Northeast and East Africa: Implications for Proterozoic crustal growth. J. Geol. Soc. 1990, 147, 41–57. [Google Scholar] [CrossRef]
- Roberts, R.G. Archean lode gold deposits. Geosci. Can. 1987, 1, 1–19. [Google Scholar]
- Bonnemaison, M.; Marcoux, E. Auriferous mineralization in some shear-zones: A three-stage model of metallogenesis. Miner. Depos. 1990, 25, 96–104. [Google Scholar] [CrossRef]
- Peters, S.G. Syn-deformational features of Carlin-type Au deposits. J. Struct. Geol. 2004, 26, 1007–1023. [Google Scholar] [CrossRef]
- Botros, N. The role of the granite emplacement and structural setting on the genesis of gold mineralization in Egypt. Ore Geol. Rev. 2015, 70, 173–187. [Google Scholar] [CrossRef]

Publisher’s Note: MDPI stays neutral with regard to jurisdictional claims in published maps and institutional affiliations. |
© 2022 by the authors. Licensee MDPI, Basel, Switzerland. This article is an open access article distributed under the terms and conditions of the Creative Commons Attribution (CC BY) license (https://creativecommons.org/licenses/by/4.0/).
Share and Cite
Eldosouky, A.M.; El-Qassas, R.A.Y.; Pham, L.T.; Abdelrahman, K.; Alhumimidi, M.S.; El Bahrawy, A.; Mickus, K.; Sehsah, H. Mapping Main Structures and Related Mineralization of the Arabian Shield (Saudi Arabia) Using Sharp Edge Detector of Transformed Gravity Data. Minerals 2022, 12, 71. https://doi.org/10.3390/min12010071
Eldosouky AM, El-Qassas RAY, Pham LT, Abdelrahman K, Alhumimidi MS, El Bahrawy A, Mickus K, Sehsah H. Mapping Main Structures and Related Mineralization of the Arabian Shield (Saudi Arabia) Using Sharp Edge Detector of Transformed Gravity Data. Minerals. 2022; 12(1):71. https://doi.org/10.3390/min12010071
Chicago/Turabian StyleEldosouky, Ahmed M., Reda A. Y. El-Qassas, Luan Thanh Pham, Kamal Abdelrahman, Mansour S. Alhumimidi, Ahmed El Bahrawy, Kevin Mickus, and Haytham Sehsah. 2022. "Mapping Main Structures and Related Mineralization of the Arabian Shield (Saudi Arabia) Using Sharp Edge Detector of Transformed Gravity Data" Minerals 12, no. 1: 71. https://doi.org/10.3390/min12010071