Article

Whitlockite-Type Structure as a Matrix for Optical Materials: Synthesis and Characterization of Novel TM-SM Co-Doped Phosphate Ca9Gd(PO4)7, a Single-Phase White Light Phosphors

by
Ivan V. Nikiforov
1,
Dina V. Deyneko
1,2,
Dmitry A. Spassky
3,4,
Bogdan I. Lazoryak
1 and
Sergey M. Aksenov
2,5,*
1
Department of Chemistry, Lomonosov Moscow State University, 119991 Moscow, Russia
2
Laboratory of Arctic Mineralogy and Material Sciences, Kola Science Centre, Russian Academy of Sciences, 184209 Apatity, Russia
3
Skobeltsyn Institute of Nuclear Physics, Lomonosov Moscow State University, 119991 Moscow, Russia
4
Institute of Physics, University of Tartu, 50411 Tartu, Estonia
5
Kola Science Centre, Geological Institute, Russian Academy of Sciences, 184209 Apatity, Russia
*
Author to whom correspondence should be addressed.
Minerals 2022, 12(1), 76; https://doi.org/10.3390/min12010076
Submission received: 19 December 2021 / Revised: 3 January 2022 / Accepted: 6 January 2022 / Published: 9 January 2022
(This article belongs to the Special Issue Minerals as Advanced Materials)

Abstract

:
A series of novel phosphates with the general formulas Ca9Gd0.9−xTm0.1Smx(PO4)7 and Ca9Gd0.9−yTmySm0.1(PO4)7 were synthesized by solid-state method. As-obtained phosphates were characterized by powder X-ray diffraction and second harmonic generation analyses, dielectric measurements, luminescence spectroscopy. All samples were single phase and characterized by the whitlockite-type structure with space group R3c. An influence of admixture concentration of REE3+ ions in the initial host on dielectric properties was studied in details. Synthesized phosphates are characterized by intensive luminescence. The emission in the orange region of the visible spectrum is observed for Ca9Gd0.9Sm0.1(PO4)7 with a maximum intensity band at 602 nm. The line in blue region at 455 nm, which corresponds to 1D23F4 Tm3+ transition, is registered for Ca9Gd0.9Tm0.1(PO4)7. Emission in the white region of CIE coordinates was registered for Tm-Sm co-doped compounds.

1. Introduction

Inorganic oxysalts with the whitlockite-type structure [in particular, beta-tricalcium phosphate, β-Ca3(PO4)2] attract interest due to different physical properties [1]. In the crystal structure of pure β-Ca3(PO4)2 (space group R3c, Z = 21) Ca2+ ions occupy five non-equivalent M1–M5 sites [2,3]. The different types of Ca2+ substitutions by mono-, di- or trivalent cations make a significant influence on the physical properties (especially optical) [4,5] due to the local distortion of coordination environment of the central cations. Moreover, the variable occupancy of the M4 site (it can be either fully vacant or partially occupied up to half occupancy) makes it possible to change the symmetry of the crystal structure with the breaking of the symmetry center, which is important for the non-linear optical properties. The impact of cationic and anionic substitutions on luminescence properties has been studied previously in details [4,6]. It was shown that homo- and heterovalent substitutions occur without the change of β-Ca3(PO4)2-type structure. However, in some compounds with β-Ca3(PO4)2-type structure which contain cations of different oxidation states, the co-doping of admixture quantity ions is necessary to charge balance of the structure. Such doping may change physical properties and crystal structure [7].
During the last years, a number of studies were focused on heterovalent substitutions with the doping of the initial host by rare-earth elements (REE). REE ions are characterized by emission in the visible region, arising due to 4f–4f or 5d–4f electron transitions. The main goal of such modifications is the crystal chemical design of novel inorganic phosphors for LED applications. The materials developed using the initial β-Ca3(PO4)2 host doped with Tm3+ ions can be considered as potential blue phosphors excited by UV radiation [8,9], while the Sm3+-doped phosphates show orange-red emission [10]. Moreover, the luminescent properties can be significantly improved by co-doping with other REE, such as Gd3+ [11] due to the energy transfer processes. Previously it was shown that co-doping by Gd3+ ions results in energy pump processes [11], high quantum yield [6], color tuning [12], and improving luminescence characteristics [6].
Among vanadates with the β-Ca3(PO4)2-type structure, Ca9Gd(VO4)7 is a good candidate as a host [13], and the influence of the co-doping by a Tm3+–Sm3+ pair has been recently reported [14]. However, a similar study for the phosphate analog has not been published so far, and the role of Tm3+–Sm3+ co-doping admixture on the crystal structure and phase transitions of Ca9Gd(PO4)7 remains unknown. Despite the isostructurality of Ca3(PO4)2 and Ca3(VO4)2 phosphates are characterized by better chemical and thermal stability and environmental friendliness compared to vanadates. So, phosphates are more promising compounds for phosphors than other host-matrix, as vanadate [15].
The current study represents a complex analysis of phosphates with the formulas Ca9Gd0.9−xTm0.1Smx(PO4)7 and Ca9Gd0.9−yTmySm0.1(PO4)7 based on the means X-ray powder diffraction, the second harmonic generation as well as dielectric and luminescence spectroscopy.

2. Materials and Methods

Series of phosphates Ca9Gd0.9−xTm0.1Smx(PO4)7 (Gd0.9−xTm0.1Smx, x = 0; 0.1; 0.2; 0.3) and Ca9Gd0.9−yTmySm0.1(PO4)7 (Gd0.9−yTmySm0.1, y = 0; 0.1; 0.2; 0.3) were synthesized by a solid-state method in air from stoichiometric mixtures of CaHPO4·2H2O (99.9%), CaCO3 (99.9%), REE2O3 (REE–Gd3+, Tm3+, Sm3+) (99.99%) at 1150 °C for 100 h with several intermediate grindings. The precursors were controlled by the powder X-ray diffraction (PXRD) patterns, and no impurities were detected.
The PXRD patterns were collected on a Thermo ARL X’TRA powder diffractometer (Bragg–Brentano geometry, Scintillator detector, CuKα radiation, λ = 1.5418 Å, Thermo Fisher Scientific, Waltham MA, USA). The PXRD data were collected at room temperature in the 2θ range between 5° and 65° with a step interval of 0.02°. Crystallographic Search-Match and Jana2006 [16] programs were used to determine the unit cell parameters.
Photoluminescence emission (PL) and excitation (PLE) spectra were recorded using laboratory set-up based on a LOT-Oriel MS-257 spectrograph (L.O.T.-Oriel, Irvine, CA, USA) with a 75 kW xenon light source (pulse length τ = 2 μs, pulse frequency ν = 80 Hz, wavelength resolution 0.5 nm; photomultiplier tube (PMT) Hamamatsu R928). All measurements were performed at room temperature.
Dielectric permittivity ε and dielectric loss tangent tan δ in the air were measured by a double-contact method in the frequency range of 1–106 Hz at 300–1270 K (heating rate of 10 K/min), with the assistance of a Solartron 7081 precision voltmeter and a Solartron 1260 frequency response analyzer (Karpov Institute, Moscow, Russia). Ceramic pellets (1.5 mm-thick and 5–6 mm in diameter) were prepared by pressing and sintering at 1473 K for 12 h. Pt paste was applied to the flat surfaces of the pellets, and then, they were heated at 1023 K for 4 h to produce platinum electrodes.
The second harmonic generation (SHG) signal was measured with a Q-switched YAG: Nd laser at λω =1064 nm in the reflection mode (Karpov Institute, Moscow, Russia) [17].
Scanning electron microscopy (SEM) (Tescan Analytics, Fuveau, France) observations were performed using a Tescan VEGA3 scanning electron microscope. SEM images were acquired using a secondary electron (SE) imaging and backscattered electron (BSE) imaging technique.

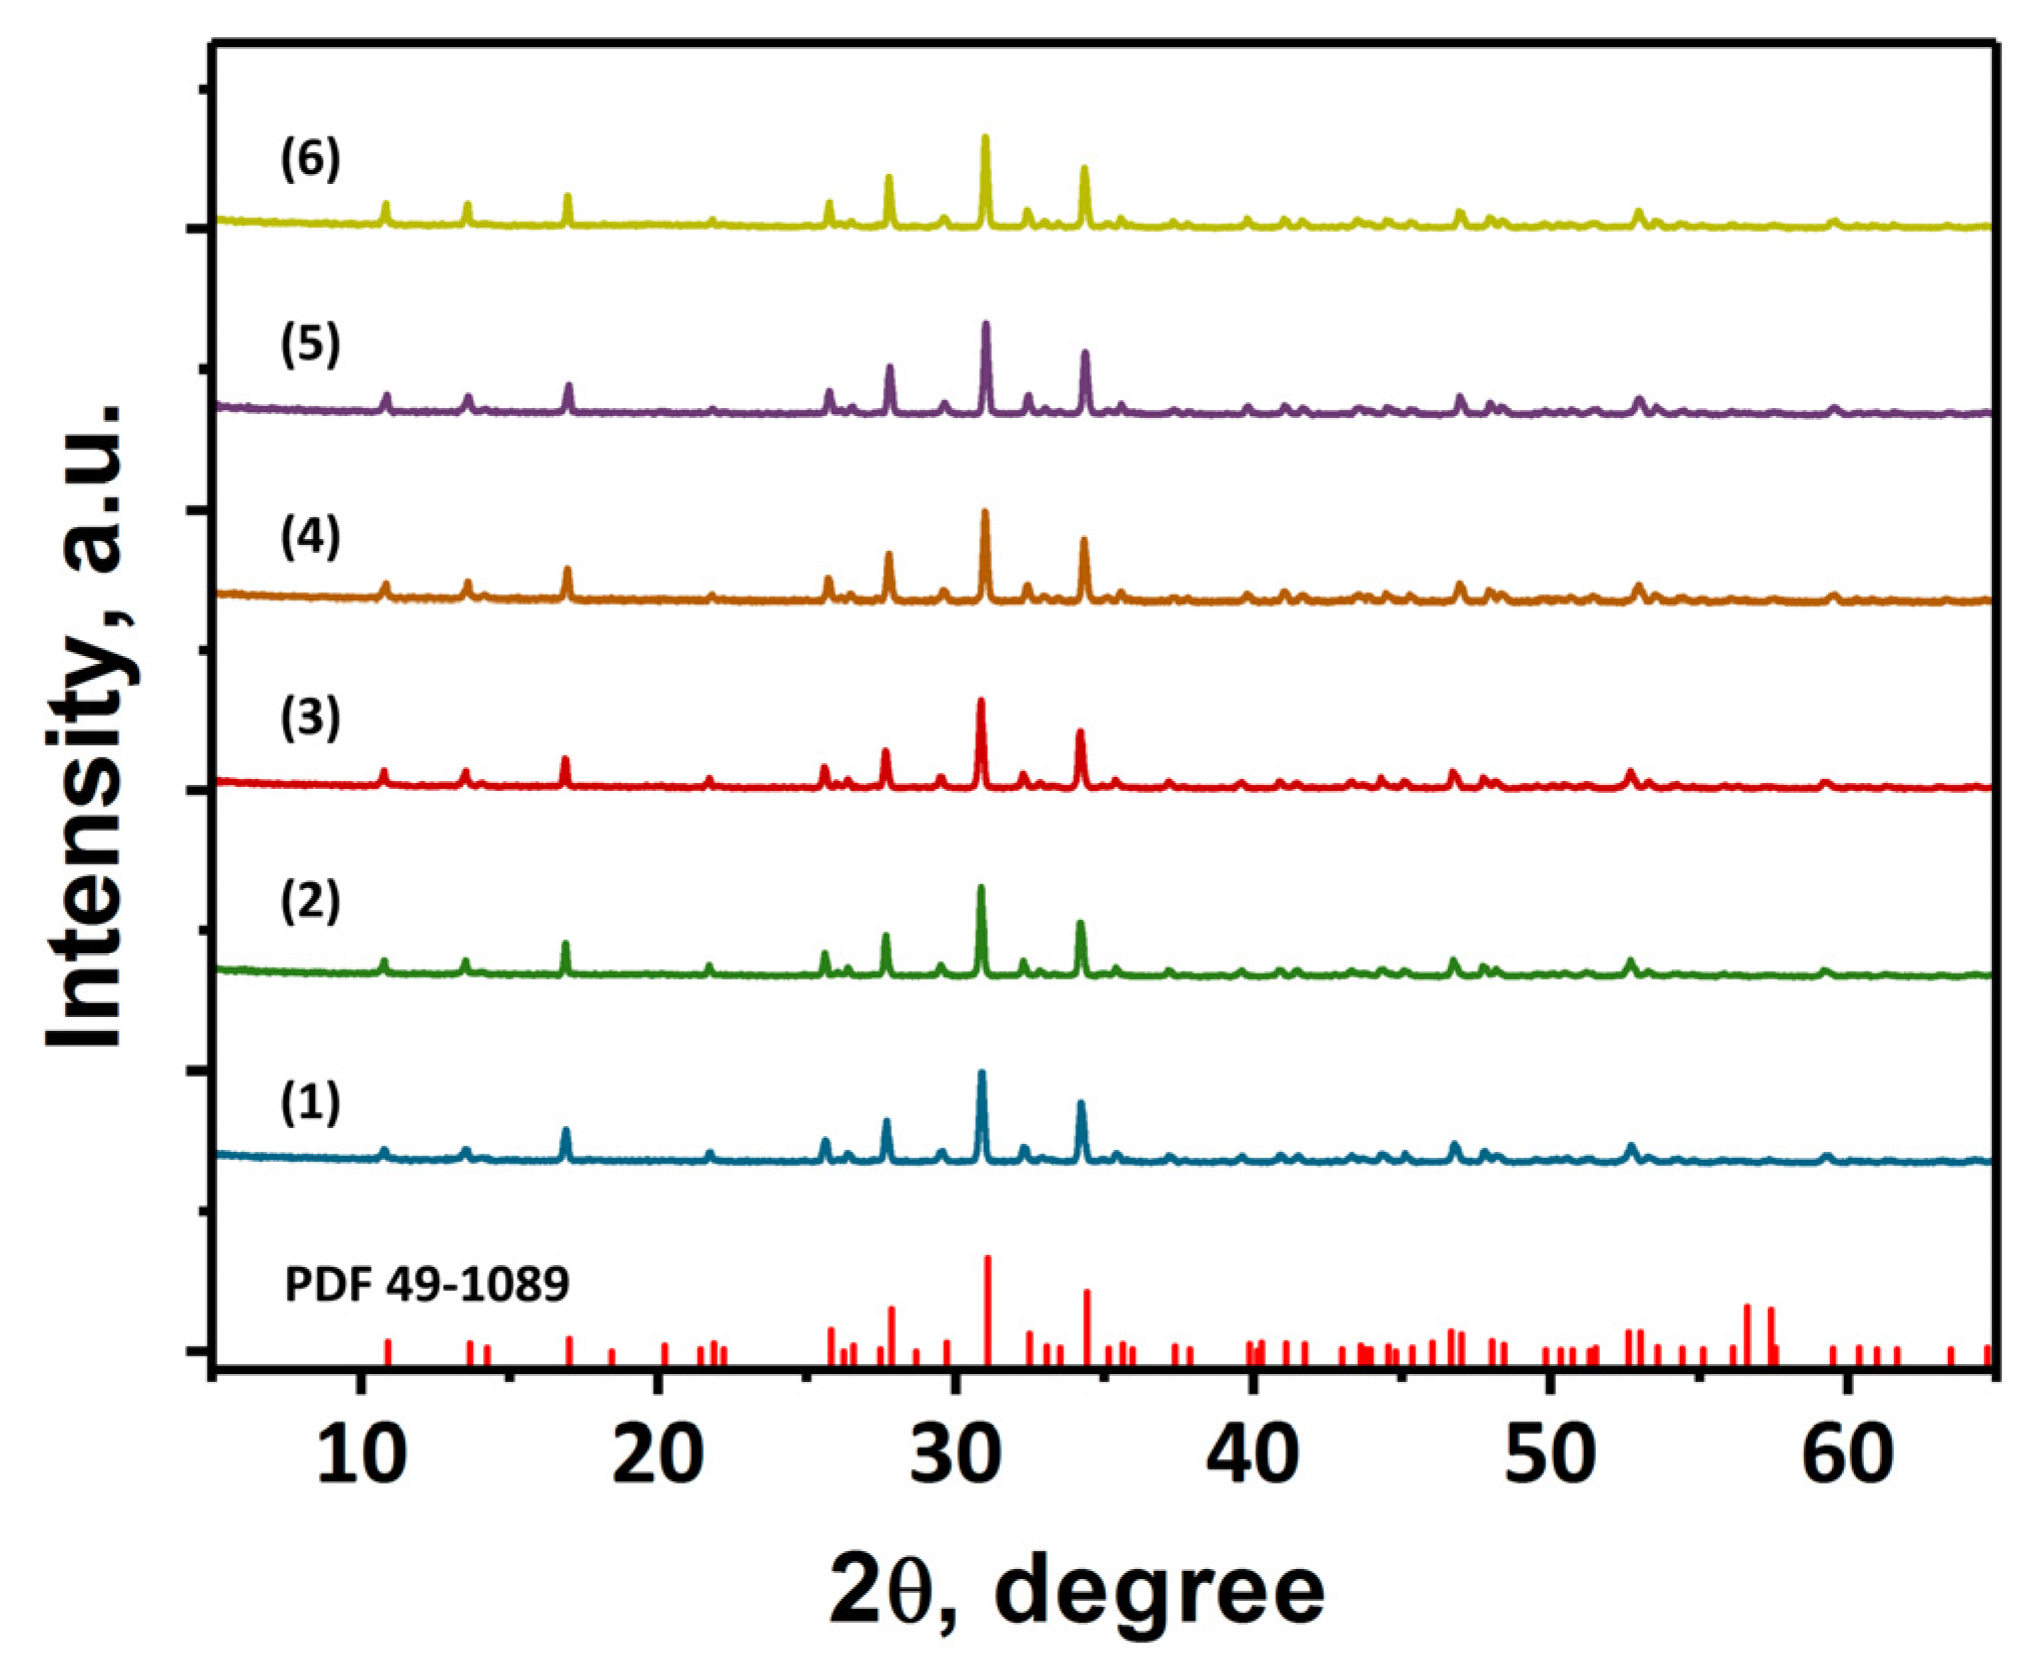
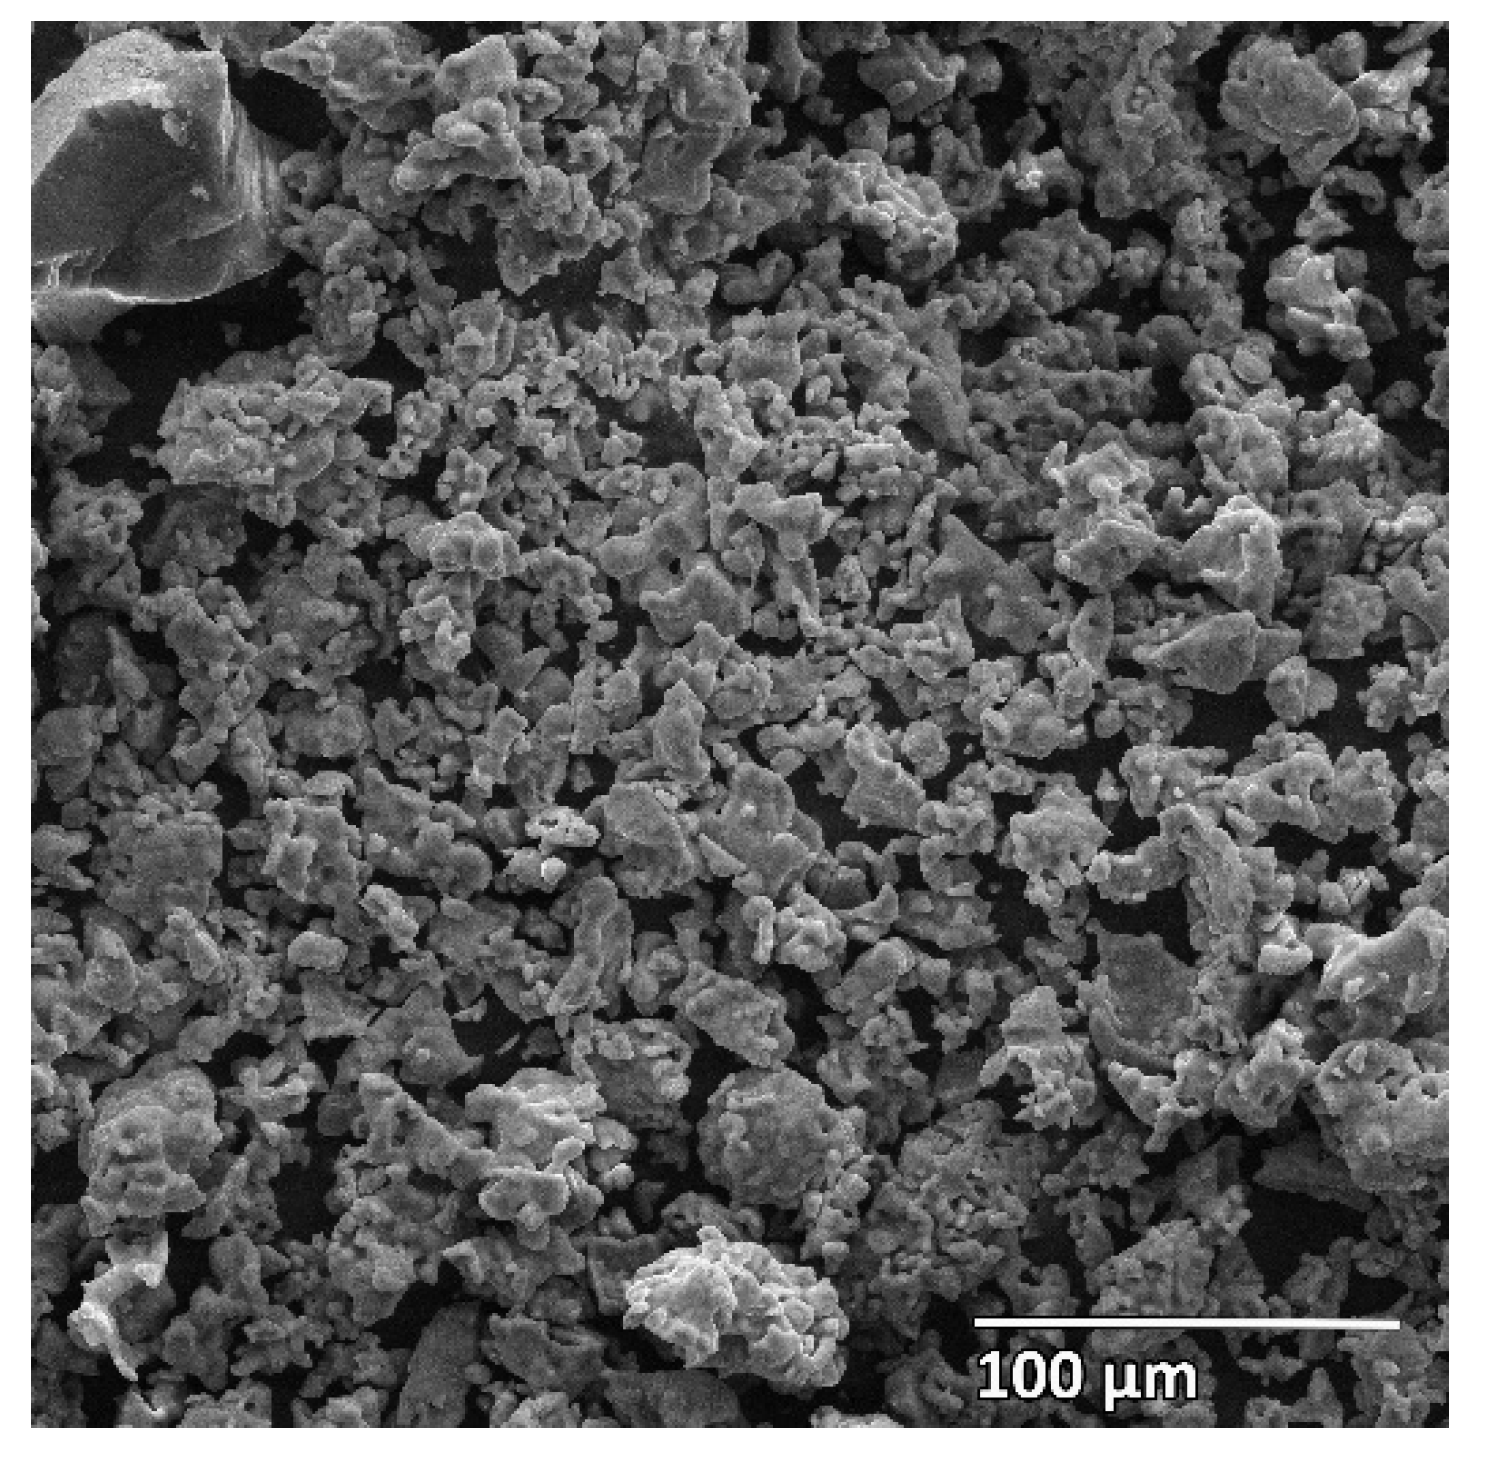
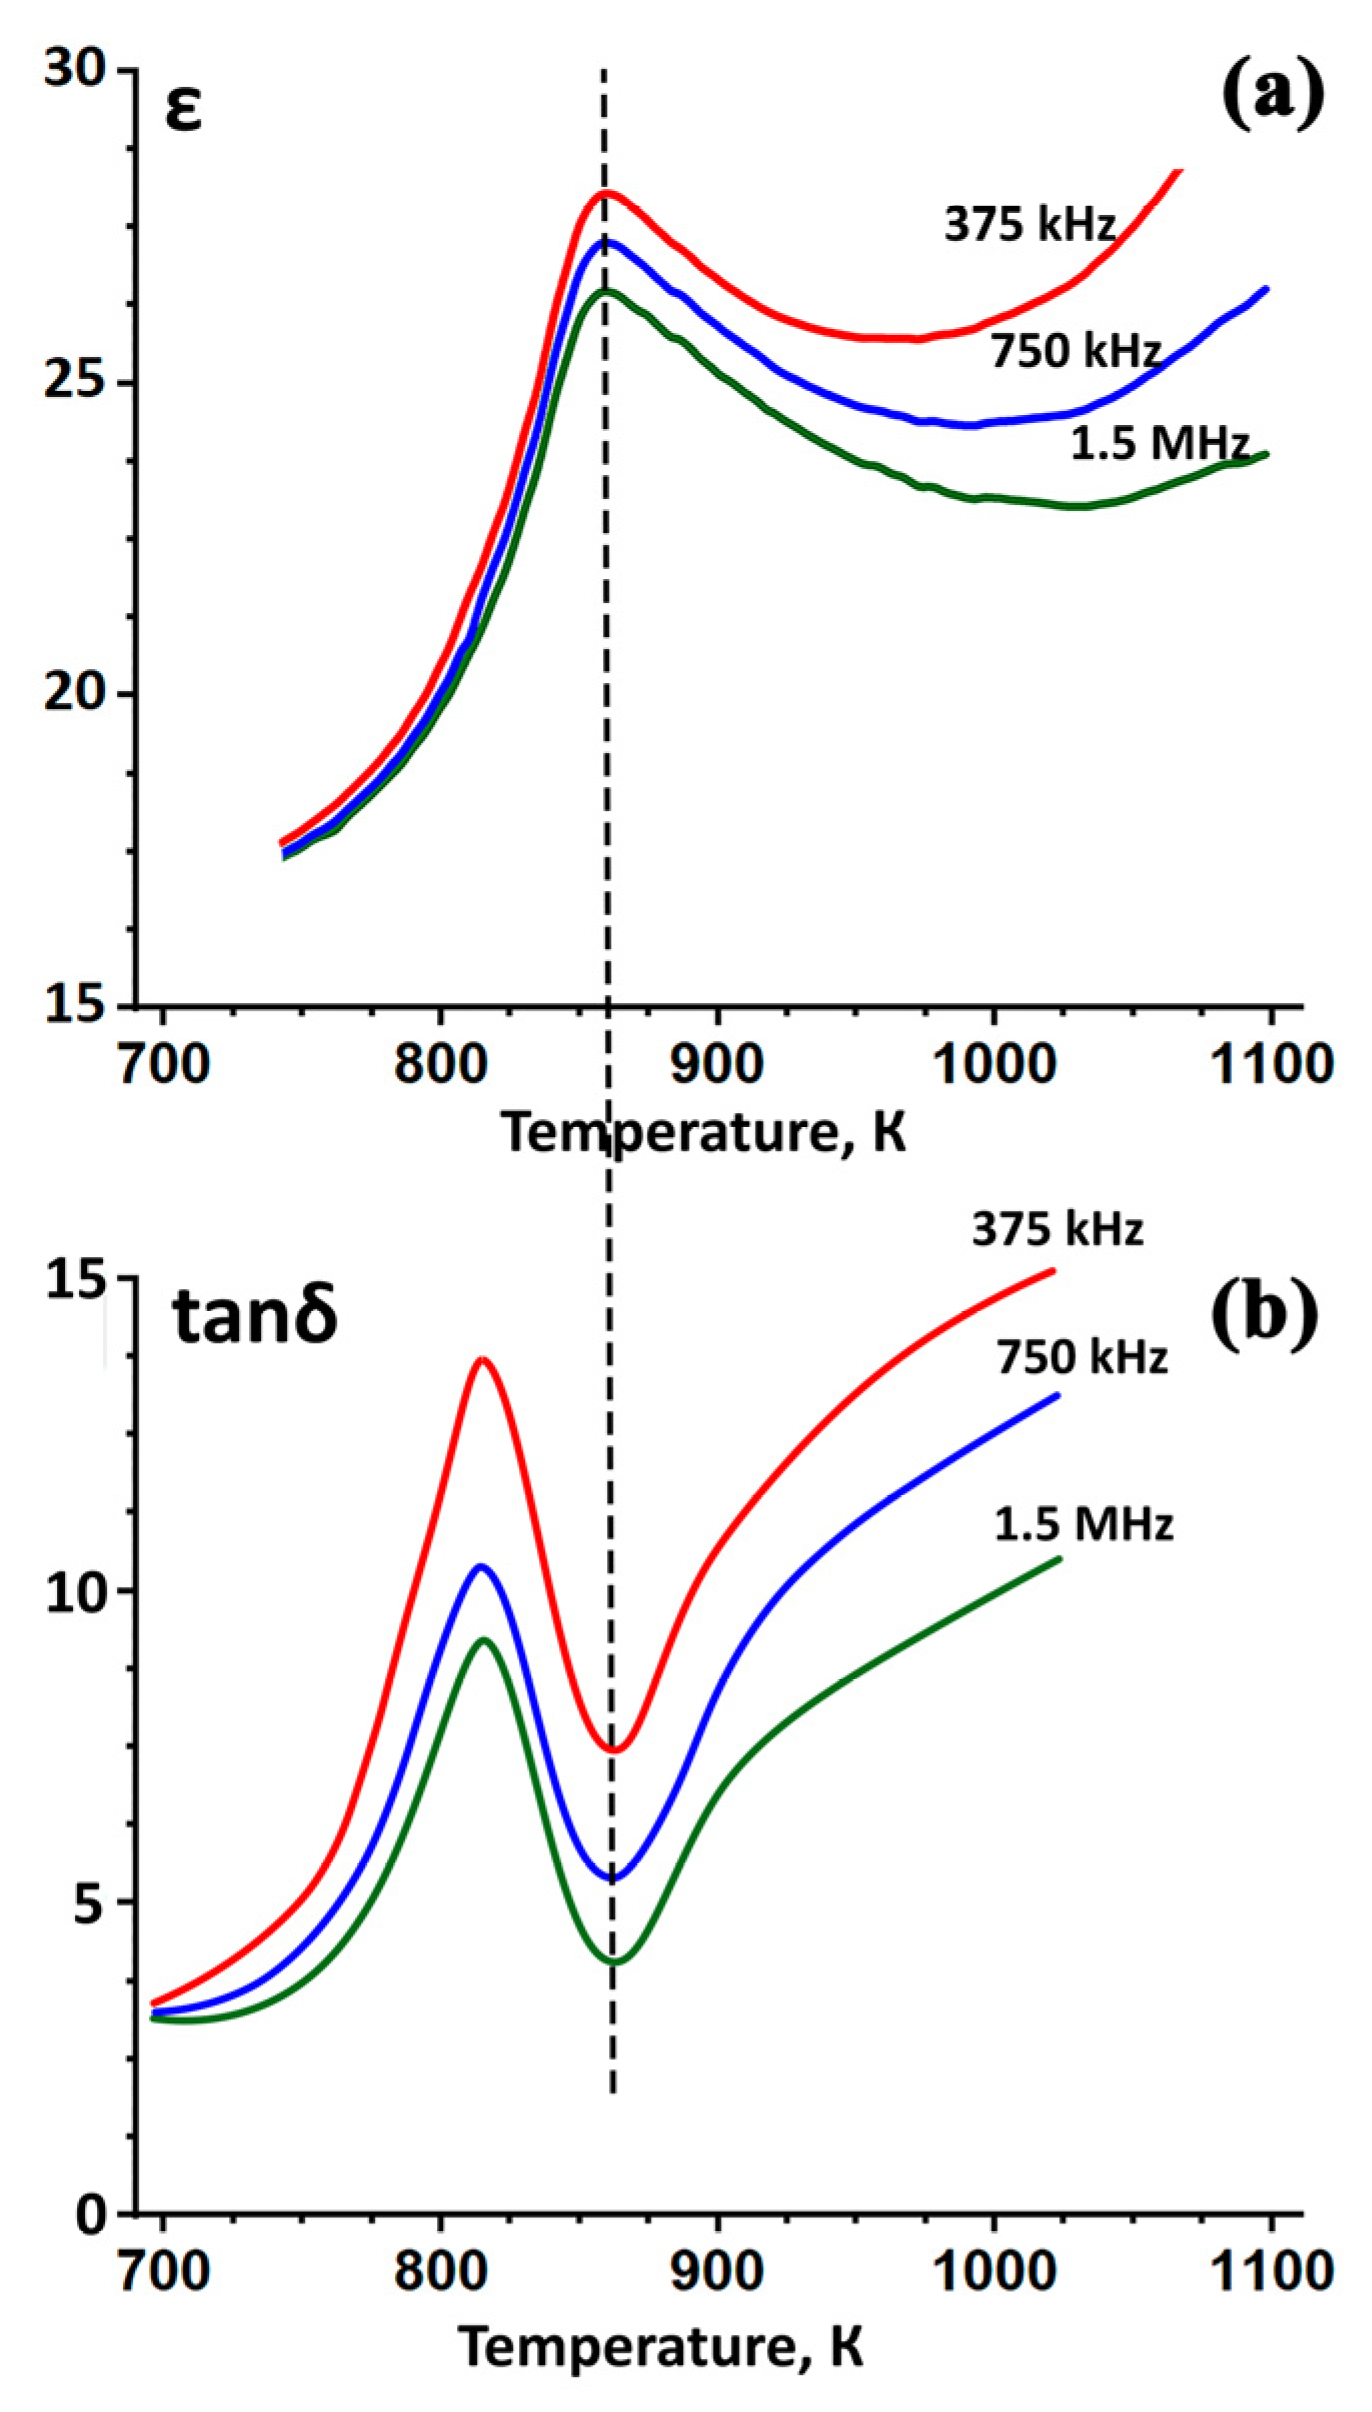
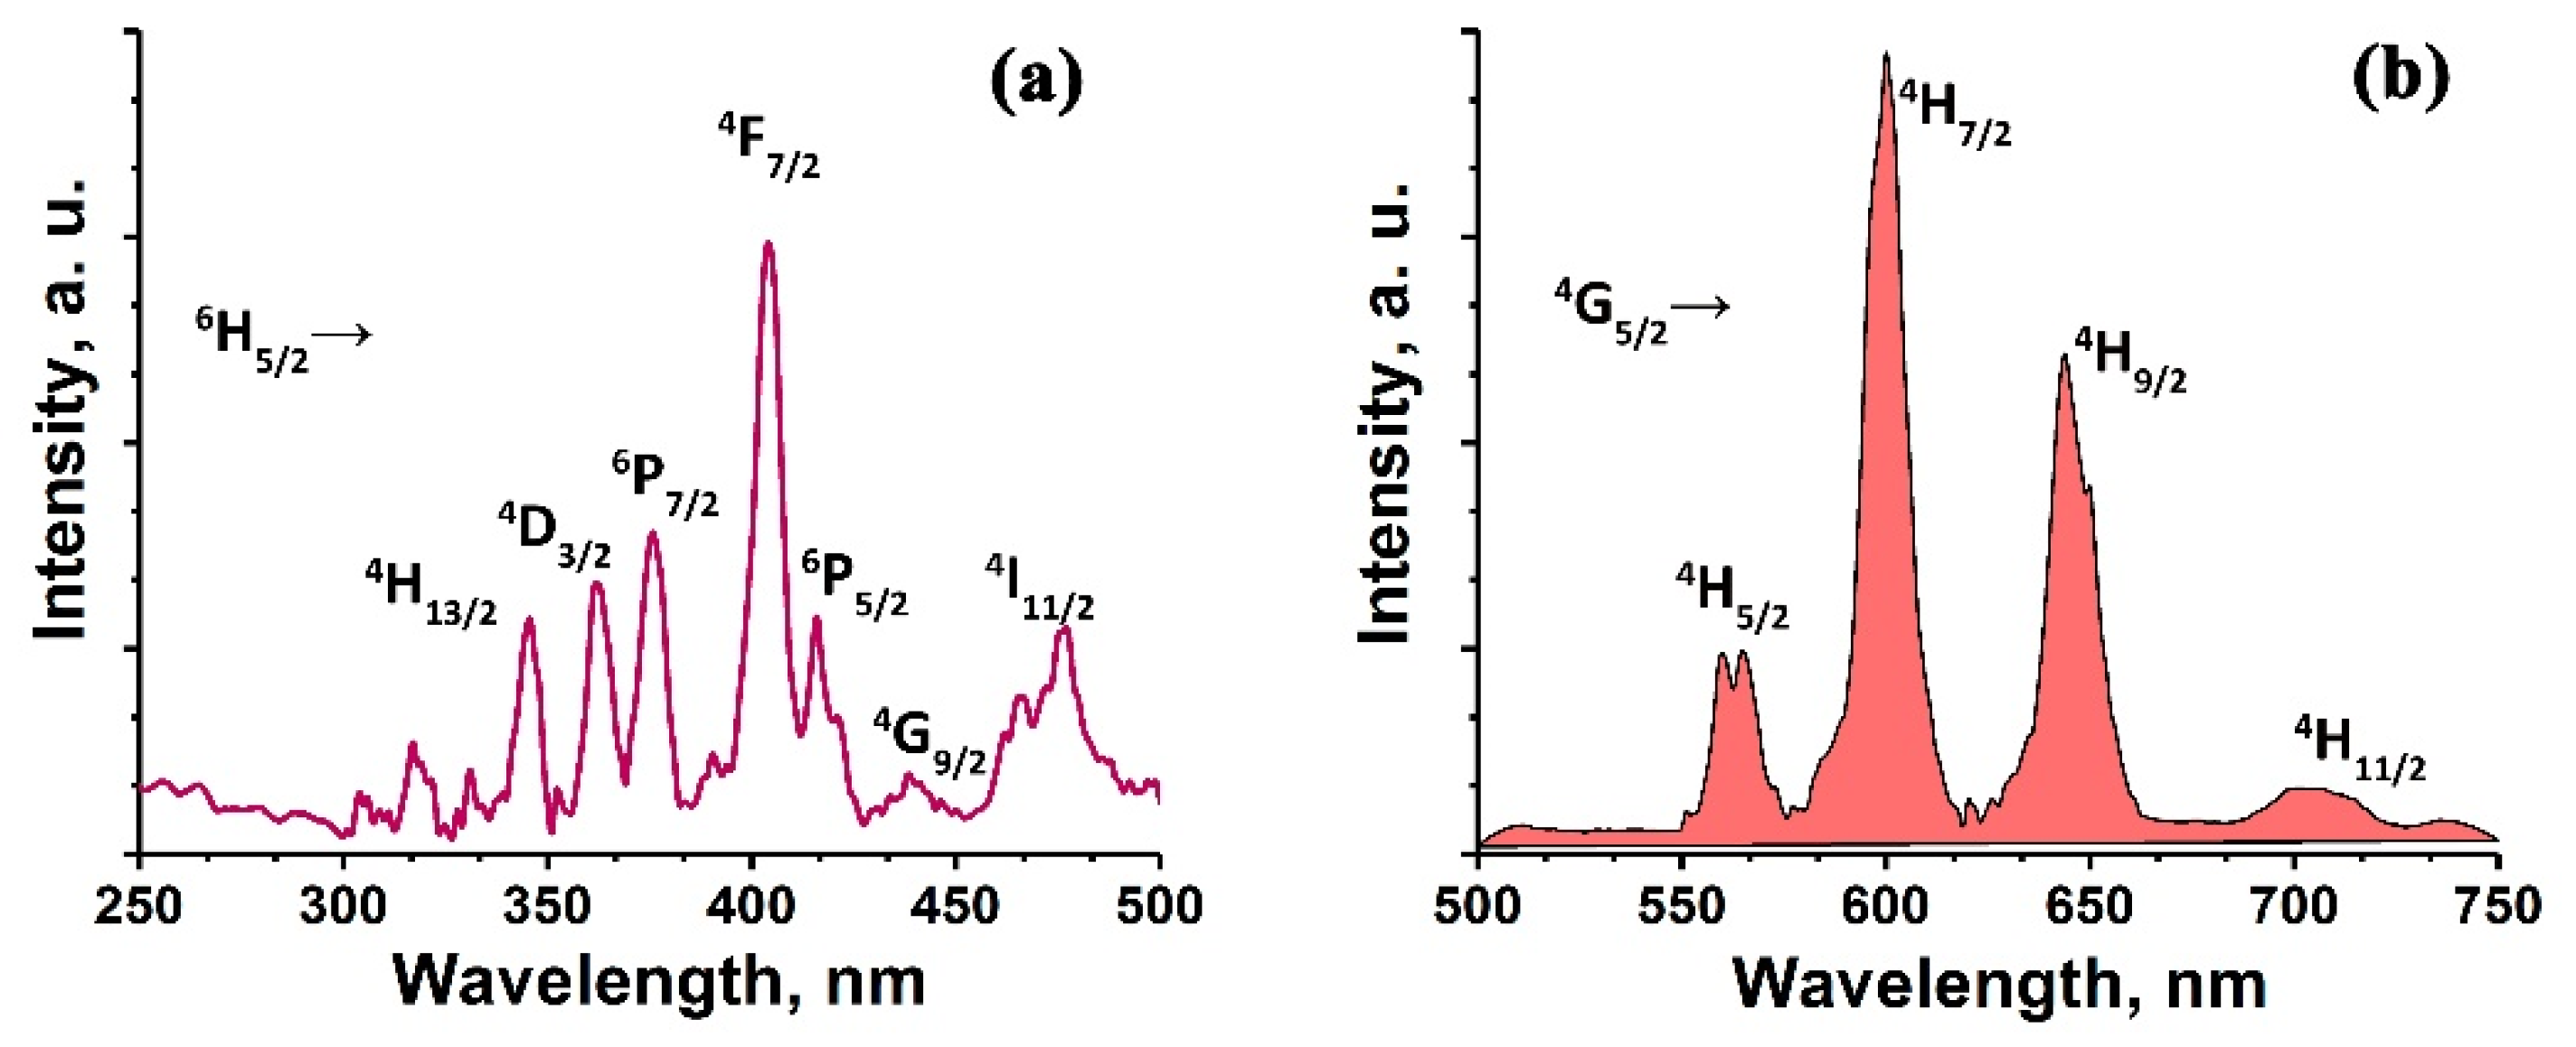
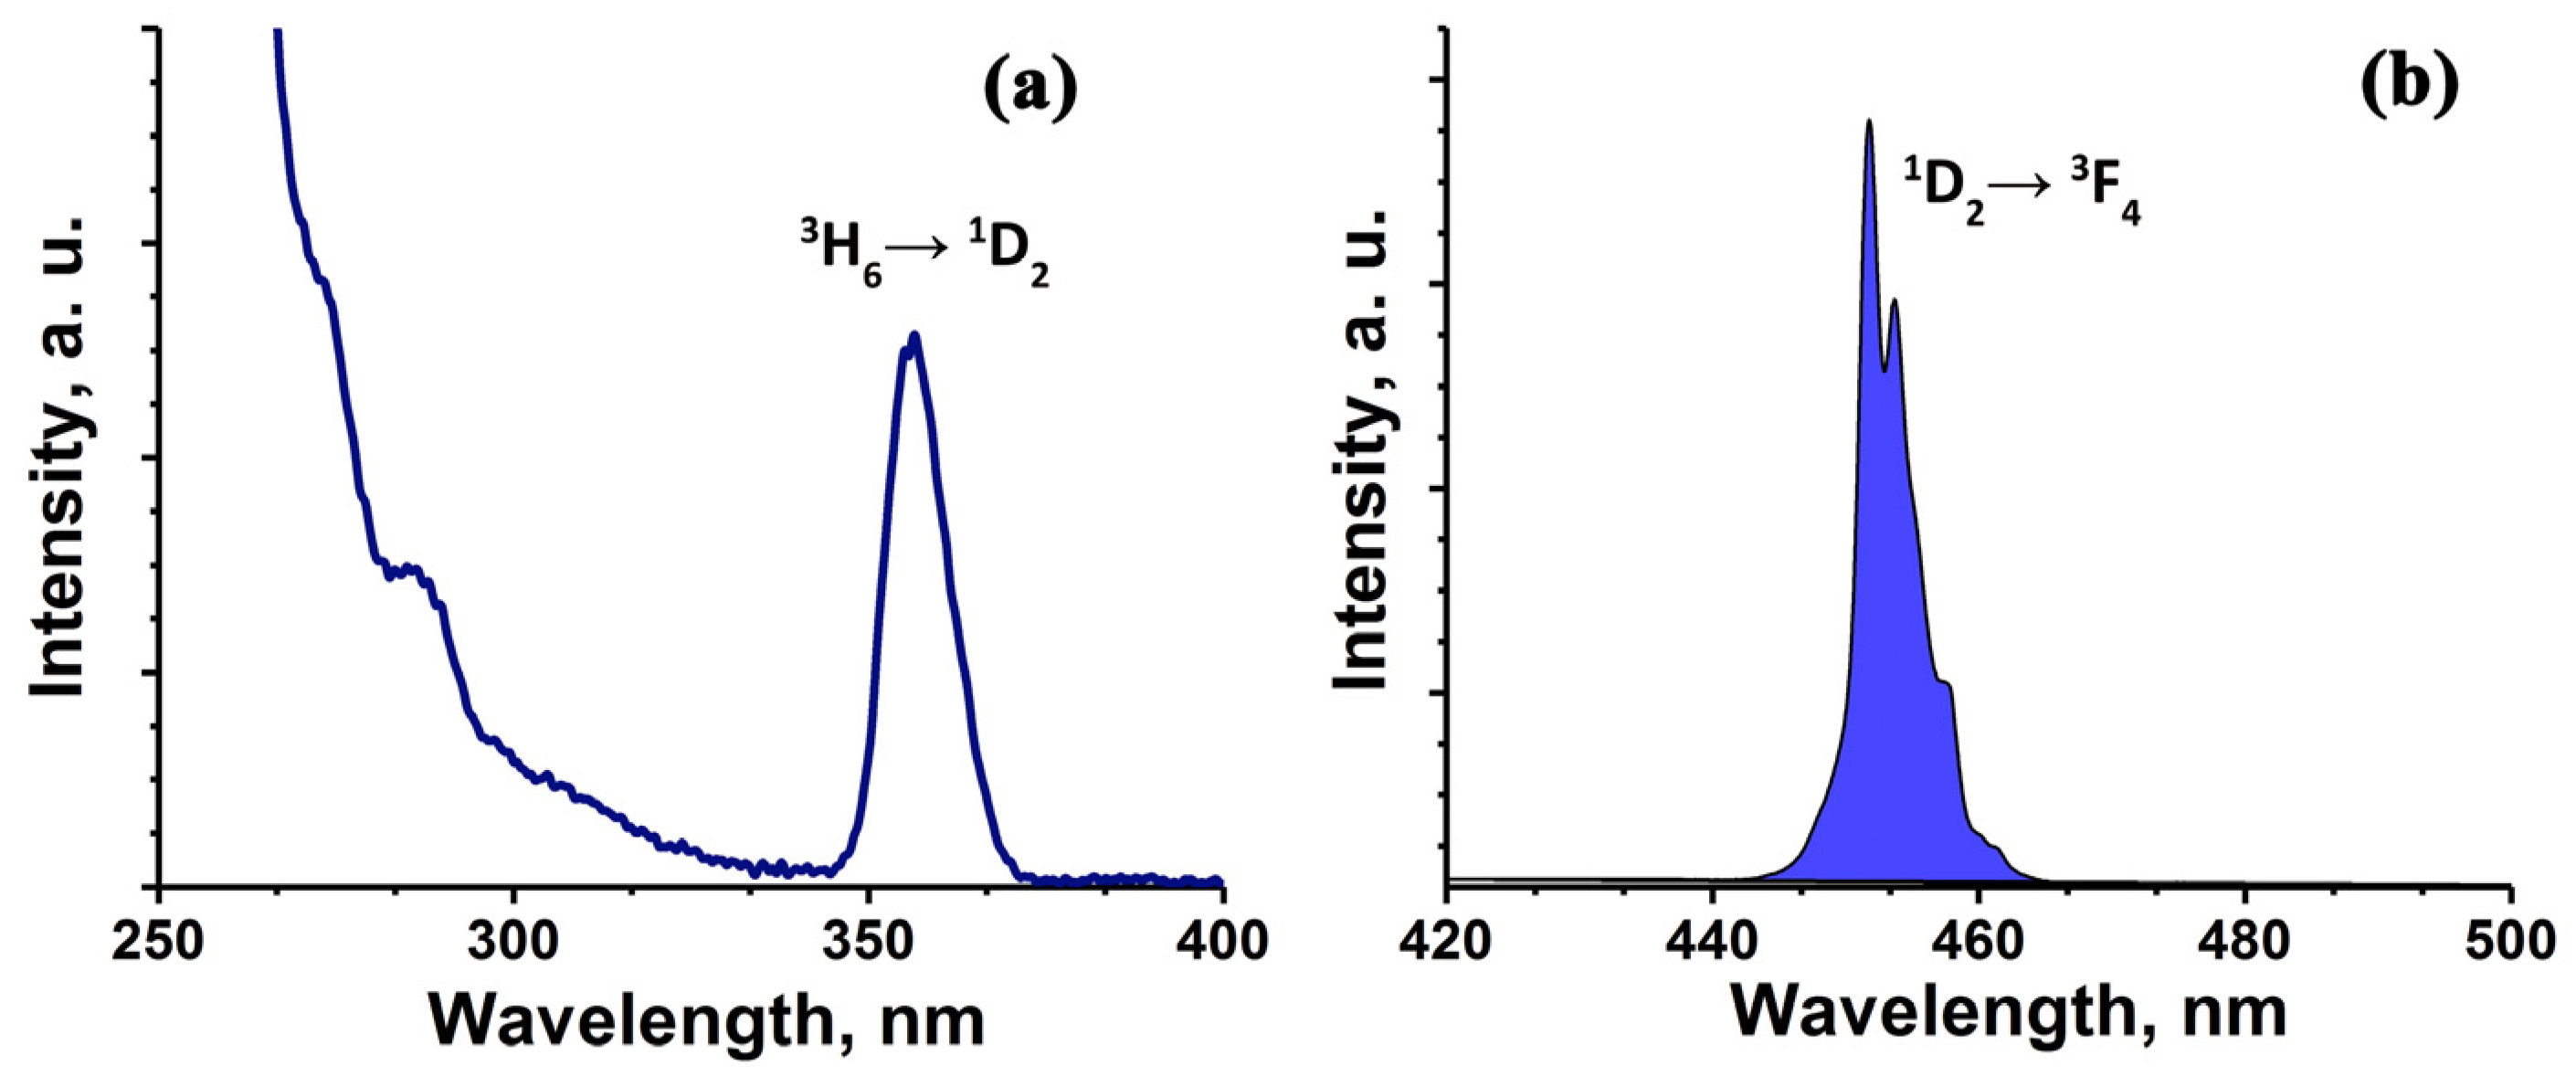
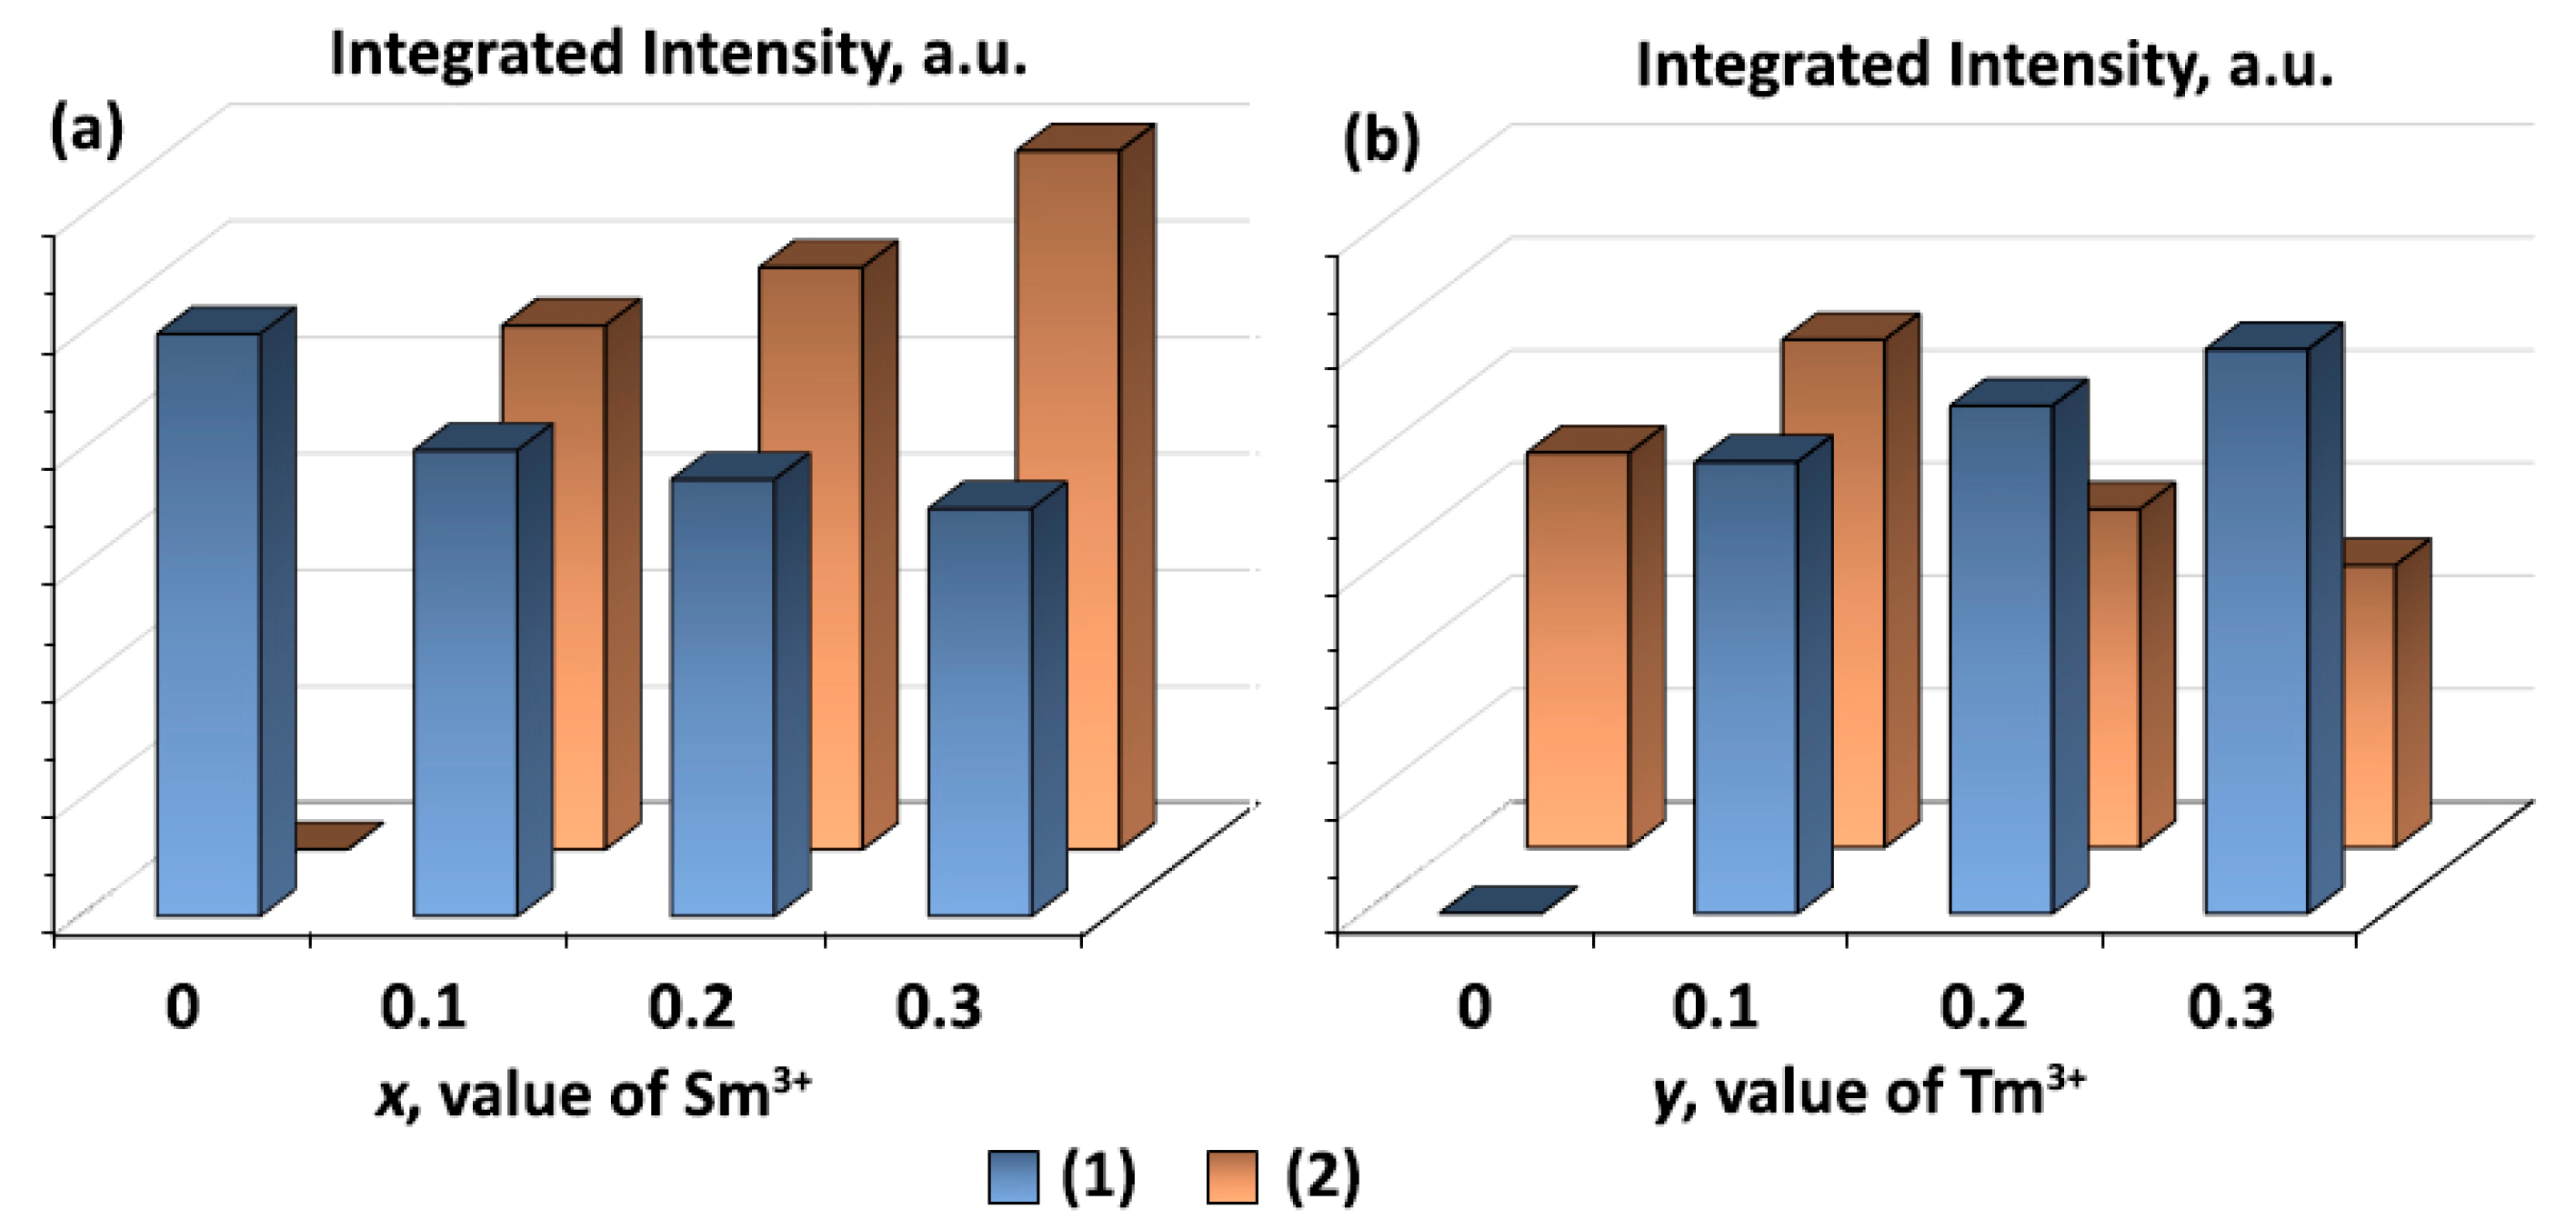
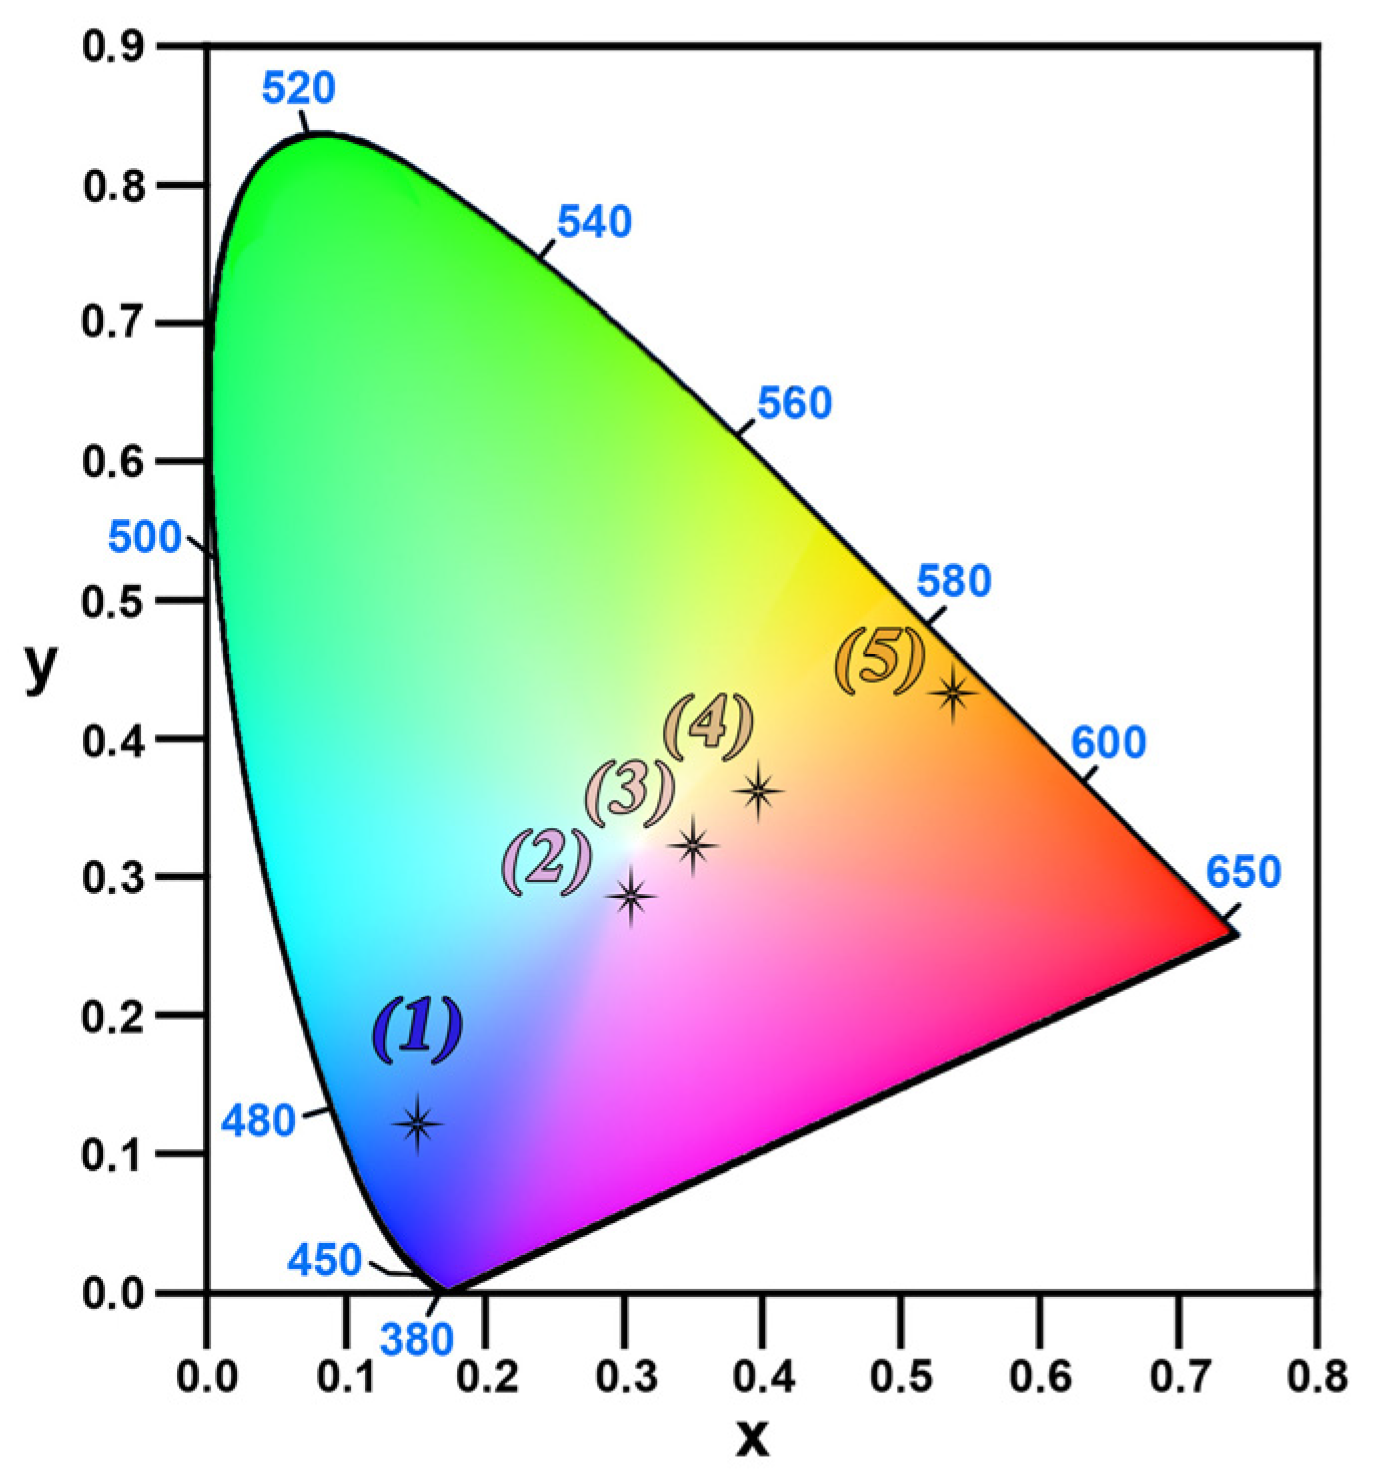
3. Results and Discussion

PXRD patterns of Gd0.9−xTm0.1Smx and Gd0.9−yTmySm0.1 are shown in Figure 1. The number and positions of peaks correspond to Ca9Dy(PO4)7 (PDF Card No 49-1086) for all as-synthesized solid solutions. Thus, the samples were single-phase and characterized by the whitlockite-type structure with polar space group (SG) R3c (depending on the structural feature of compounds with β-Ca3(PO4)2-type structure may also crystallize in non-polar SG R 3 ¯ c [18]). PXRD patterns for both SGs are almost identical, and it is rather difficult to identify them based on the powder diffraction data only [19]. However, the noncentrosymmetric structure (described by the polar SG R3c) can be confirmed by SHG measurements. The presence of a weak SHG signal response (≈1–1.5 by quartz standard) for Gd0.9−xTm0.1Smx and Gd0.9−yTmySm0.1 confirms that these samples are characterized by polar SG R3c (in case of the absence of SHG response the SG should be R 3 ¯ c [2]).
The calculated values of the unit cell volumes for Gd0.9−xTm0.1Smx and Gd0.9−yTmySm0.1 are given in Figure 2. In comparison with pure Ca9Gd(PO4)7 [20] the linear decrease of the unit cell volume with Tm3+ doping is observed for Gd0.9−yTmySm0.1, while the increase of the unit cell volumes corresponds to Sm3+ doping of Gd0.9−xTm0.1Smx. Such changes of the unit cell volumes can be explained by the substitution of Gd3+ ion (rVI = 0.94 Å) by Tm3+ (rVI = 0.88 Å) and Sm3+ (rVI = 0.96 Å) with smaller and bigger ionic radius, respectively [21].
The relative ionic radius difference (Dr) characterizes an effective substitution in the crystal structure of the initial host. The Dr must be less than 30%. The value of relative ionic radius difference can be calculated by the following equation [3]:
D r = | r s r d r s | × 100 % ,
where rs and rd are ionic radii for substituted and dopant ion, respectively, with the same coordination number (CN). The obtained Dr values are given in Table 1 and do not exceed 30%. Thus, Tm3+ and Sm3+ can substitute Gd3+ and Ca2+ in the initial crystal structure. These data are in good agreement with the occupations of the crystallographic sites. In particular, the octahedral M5 site is occupied by Tm3+ jointly with Ca2+, and the largest M1-M3 sites are statistically occupied by Gd3+, Tm3+, Sm3+, and Ca2+ [20]. The cationic distribution in Gd0.9−xTm0.1Smx and Gd0.9−yTmySm0.1 is based on Dr calculations. Despite the fact that the Dr value of Ca2+/Sm3+ in the octahedral M5 site is less due to larger similarity of the ionic radii, Tm3+ ions are preferably occupied it. The reason is the smaller difference in pair Ca2+/Sm3+ (Dr = 3.7) in comparison with Ca2+/Tm3+ (Dr = 13.1) in larger eight-coordinates sites M1-M3. So, the smallest size of Tm3+ ion is the argument to prefer occupation among other REE ions Gd3+ and Sm3+ in the synthesized compounds.
Figure 3 shows the SEM image for Gd0.8Tm0.1Sm0.1. Observed phosphate, as well as all as-prepared samples, is characterized by narrow size distribution in the interval from 10 to 100 μm with a large number of large particles.
The temperature dependences of dielectric permittivity (ε) and dielectric loss tangent (tan δ) for pure Ca9Gd(PO4)7 are shown in Figure 4. The maxima at the ε(T) curves may indicate the phase transition (PT). The presence of anomalies in the tan δ curves demonstrates the type of PT, which can be determined as ferroelectric type. So, the PT is observed with SG R3c → R 3 ¯ c changing for Ca9Gd(PO4)7. The temperature of PT, determined by maxima and minima in ε(T) and tan δ(T) curves, respectively, takes value of 850 K. The similar behaviors have been also found for Gd0.9−xTm0.1Smxand Gd0.9−yTmySm0.1 samples. The temperatures of PT vary between 850 K to 865 K for as-synthesized phosphates. The obtained data might be considered as equal due to instrumental error (20 K). The significant changes in PT were not detected with doping by admixture concentration of Tm3+ and Sm3+.
The PLE spectrum of Gd0.9Sm0.1, recorded at λem = 602 nm, is given in Figure 5a. The series of sharp lines in the region of 300–500 nm correspond to f–f transitions within Sm3+ ions. The bands at 346, 363, 375, 404, 416, 439, and 475 nm correspond to Sm3+ transitions from the 6H5/2 ground level to the excited levels 4H13/2, 4D3/2, 6P7/2, 4F7/2, 6P5/2, 4G9/2, and 4I11/2, respectively [22,23]. The most intensive 6H5/24F7/2 transition is located at 404 nm.
At PL spectrum of Gd0.9Sm0.1, registered at λex = 404 nm, a standard set of emission lines, which arise due to transitions within Sm3+ ions is observed (Figure 5b). The emission bands in the visible orange-red spectral region peaking at 563, 602, 644 and 704 nm correspond to 4G5/24HJ/2 (J = 5, 7, 9, 11) transitions within Sm3+ ions [22,23]. The dominant line was found at 602 nm (4G5/24H7/2). The 4f-4f transitions of REE3+ are almost insensitive to the changing of the crystal field strength, and the profile and relative intensities of the Sm3+ related emission bands were similar for all studied series. The main difference between the samples was in the integral emission intensity, which is ascribed to the energy transfer processes.
The PLE spectrum of Gd0.9Tm0.1, monitored at λem = 477 nm, is presented in Figure 6a. The spectrum demonstrates an expressed band at 356 nm, corresponding to 3H61D2 transition within Tm3+. The onset observed below 300 nm might be attributed to the defect-related absorption. The characteristic emission line, corresponding to 4f–4f transition within Tm3+ is observed at PL spectrum (Figure 6b). This band is located at 455 nm and is due to 1D23F4 transition [14,24,25].
The emission bands of Tm3+ and Sm3+ ions, are registered in PL spectrum of Gd0.8Tm0.1Sm0.1 at λex = 356 nm, which corresponds to intracenter excitation of Tm3+ ions (Figure 7). Thus, energy transfer from Tm3+ to Sm3+ occurs. In contrast, energy transfer from Sm3+ to Tm3+ is not registered, which is confirmed by the absence of Tm3+ emission lines under excitation at λex = 404 nm (Sm3+ intracenter excitation).
The data on the intensity dependence of Tm3+ and Sm3+ emission on the REE concentrations are presented in Figure 8. The intensity of Sm3+ emission for Gd0.9−xTm0.1Smx samples increases with x. At the same time, the intensity of Tm3+ emission decreases while its concentration doesn’t change (Figure 8a). Such behavior indicates the possibility of energy transfer from Tm3+ to Sm3+ under at 356 nm, which correspond to Tm3+ intraceneter excitation. It is worth noting that the intensity of Sm3+ emission is nonzero (Figure 8b) at λex =356 nm even for Gd0.9Sm0.1, (i.e. without Tm3+ ions in the sample) that is due to the presence of a Sm3+ excitation band at 356 nm. The increase of the Sm3+ emission is observed with the incorporation of Tm3+ into studied phosphates for the sample Gd0.8Tm0.1Sm0.1. The observed intensity increase also indicates the existence of an energy transfer process from Tm3+ to Sm3+. However, the intensity of Sm3+ emission decreases with a further increase of the Tm3+ concentration in the host.
CIE coordinates (x, y, z) show the color of emission for phosphors, according to international standards. They were calculated using the following equation [26]:
x = X X + Y + Z ; y = Y X + Y + Z ; z = Z X + Y + Z ;
where
X = λ i n f λ s u p S ( λ ) x ¯ ( λ ) d ( λ ) ;   Y = λ i n f λ s u p S ( λ ) y ¯ ( λ ) d ( λ ) ;   Z = λ i n f λ s u p S ( λ ) z ¯ ( λ ) d ( λ )
where S(λ) is the intensity at wavelength λ; x ¯ ,   y ¯ ,   z ¯ are color 1931CIE coordinates (CIE coordinates) at wavelength λ; d is integration stp.
The calculated color coordinates (x, y) are presented in Figure 9. The CIE value for Gd0.9Tm0.1 is (0.17; 0.07) and corresponds to the blue region of the color space, while (0.53; 0.37) for Gd0.9Sm0.1 — to the orange region. The adjusting of Sm3+ concentration shifts the color coordinates from a blue region, through a near white one, to an orange one for Gd0.9−xTm0.1Smx. This behavior can be explained by the redistribution of Sm3+ and Tm3+ emission bands intensity under λex = 356 nm.

4. Conclusions

Novel Ca9Gd0.9−xTm0.1Smx(PO4)7 (x = 0; 0.1; 0.2; 0.3) and Ca9Gd0.9−yTmySm0.1(PO4)7 (y = 0; 0.1; 0.2; 0.3) phosphates with β-Ca3(PO4)2-type structure were synthesized by a solid-state technique. It was found that the admixture concentration of REE ions in the initial host does not influence on the formation of the whitlockite-type structure and dielectric properties. The temperature of phase transitions is 850–865 K for as-prepared samples. The REE emitting-ions can be exctied by ultraviolet radiation being in admixture quantity in the whitlockite-type host. The typical emissions in the orange (the most intensive band at 602 nm) and the blue (the most intensive band at 455 nm) spectral regions were observed for Ca9Gd0.9Sm0.1(PO4)7 and Ca9Gd0.9Tm0.1(PO4)7, respectively. The energy transfer from Tm3+ to Sm3+ was detected for Ca9Gd0.9−yTmySm0.1(PO4)7 solid solution. It is shown that the resulting emission in the near-white area of CIE coordinates can be achieved by tuning of Sm3+ concentration in the Ca9Gd0.9−xTm0.1Smx(PO4)7 solid solutions.

Author Contributions

Conceptualization, I.V.N., D.A.S. and D.V.D.; methodology, D.V.D. and S.M.A.; synthesis, I.V.N.; formal analysis, I.V.N., D.V.D. and D.A.S.; writing—original draft preparation, I.V.N. and D.V.D.; writing—review and editing, B.I.L., D.A.S. and S.M.A.; supervision, D.V.D. All authors have read and agreed to the published version of the manuscript.

Funding

This research was supported by the Russian Science Foundation (Grant 19-77-10013). D.A.S. is grateful for financial support of the Estonian Research Council, project PUT PRG111. This research was performed according to the Development Program of the Interdisciplinary Scientific and Educational School of Lomonosov Moscow State University’s “The future of the planet and global environmental change” and the state assignment of the Chemistry Department of Moscow State University (Agreement No. AAAA-A21-121011590086-0).

Conflicts of Interest

The authors declare no conflict of interest.

References

  1. Teterskii, A.V.; Stefanovich, S.Y.; Lazoryak, B.I.; Rusakov, D.A. Whitlockite solid solutions Ca9−xMxR(PO4)7 (x = 1, 1.5; M = Mg, Zn, Cd; R = Ln, Y) with antiferroelectric properties. Russ. J. Inorg. Chem. 2007, 52, 308–314. [Google Scholar] [CrossRef]
  2. Deyneko, D.V.; Aksenov, S.M.; Nikiforov, I.V.; Stefanovich, S.Y.; Lazoryak, B.I. Symmetry inhomogeneity of Ca9–xZnxEu(PO4)7 phosphor determined by second-harmonic generation and dielectric and photoluminescence spectroscopy. Cryst. Growth Des. 2020, 20, 6461–6468. [Google Scholar] [CrossRef]
  3. Nikiforov, I.V.; Deyneko, D.V.; Duskaev, I.F.; Lazoryak, B.I. Green luminophors in the family of phosphates with whitlockite structure. J. Struct. Chem. 2021, 62, 1621–1630. [Google Scholar] [CrossRef]
  4. Lazoryak, B.I.; Zhukovskaya, E.S.; Baryshnikova, O.V.; Belik, A.A.; Leonidova, O.N.; Deyneko, D.V.; Savon, A.E.; Dorbakov, N.G.; Morozov, V.A. Luminescence, structure and antiferroelectric-type phase transition in Ca8ZnEu(PO4)7. Mater. Res. Bull. 2018, 104, 20–26. [Google Scholar] [CrossRef]
  5. Deyneko, D.V.; Morozov, V.A.; Hadermann, J.; Savon, A.E.; Spassky, D.A.; Stefanovich, S.Y.; Belik, A.A.; Lazoryak, B.I. A novel red Ca8.5Pb0.5Eu(PO4)7 phosphor for light emitting diodes application. J. Alloy. Compd. 2015, 647, 965–972. [Google Scholar] [CrossRef]
  6. Deyneko, D.V.; Nikiforov, I.; Lazoryak, B.I.; Spassky, D.A.; Leonidov, I.I.; Stefanovich, S.Y.; Petrova, D.A.; Aksenov, S.M.; Burns, P.C. Ca8MgSm1−x(PO4)7: xEu3+, promising red phosphors for WLED application. J. Alloy. Compd. 2019, 776, 897–903. [Google Scholar] [CrossRef]
  7. Deyneko, D.V.; Spassky, D.A.; Morozov, V.A.; Aksenov, S.M.; Kubrin, S.P.; Molokeev, M.S.; Lazoryak, B.I. Role of the Eu3+ distribution on the properties of β-Ca3(PO4)2 phosphors: Structural, luminescent, and 151Eu Mössbauer spectroscopy study of Ca9.5−1.5xMgEux(PO4)7. Inorg. Chem. 2021, 60, 3961–3971. [Google Scholar] [CrossRef]
  8. Xie, F.; Xu, D.; Wu, Z.; Molokeev, M.S.; Milićević, B.; Li, H.; Shi, J. Improving thermal stability of novel single-component white-light emitting phosphor Ca8MgLu(PO4)7:Tm3+, Dy3+ by back-energy-transfer. J. Lumin. 2020, 227, 117516. [Google Scholar] [CrossRef]
  9. Zhang, J.; Wang, Y.; Guo, L.; Zhang, F.; Wen, Y.; Liu, B.; Huang, Y. Vacuum ultraviolet and near-infrared excited luminescence properties of Ca3(PO4)2:RE3+, Na+ (RE = Tb, Yb, Er, Tm, and Ho). J. Solid State Chem. 2011, 184, 2178–2183. [Google Scholar] [CrossRef]
  10. Zhang, Z.-W.; Wu, Y.-N.; Shen, X.-H.; Ren, Y.-J.; Zhang, W.-G.; Wang, D.-J. Enhanced novel orange red emission in Ca3(PO4)2: Sm3+ by charge compensation. Opt. Laser Technol. 2014, 62, 63–68. [Google Scholar] [CrossRef]
  11. Xie, M.; Liang, H.; Huang, Y.; Gao, Z.; Tao, Y. Host absorption sensitizing and energy transfer to Eu3+ by Gd3+ in Ba6Gd2−xNa2Eux(PO4)6F2. J. Solid State Chem. 2013, 201, 18–23. [Google Scholar] [CrossRef]
  12. Guo, N.; Liang, Q.; Li, S.; Ouyang, R.; Lü, W. Triple energy transfer and color tuning in Tb3+ and Eu3+-coactivated apatite-type gadolinium-containing phosphors. Opt. Mater. 2017, 73, 570–576. [Google Scholar] [CrossRef]
  13. Paszkowicz, W.; Shekhovtsov, A.; Kosmyna, M.; Loiko, P.; Vilejshikova, E.; Minikayev, R.; Romanowski, P.; Wierzchowski, W.; Wieteska, K.; Paulmann, C.; et al. Structure and thermal expansion of Ca9Gd(VO4)7: A combined powder-diffraction and dilatometric study of a Czochralski-grown crystal. Nucl. Instrum. Methods Phys. Res. Sect. B Beam Interact. Mater. At. 2017, 411, 100–111. [Google Scholar] [CrossRef]
  14. Liu, X.; Li, L.; Noh, H.M.; Jeong, J.H.; Jang, K.; Shin, D.S. Chemical bond parameters, charge transfer band, tunable white light of Tm3+ and Sm3+ coactivated Ca9Gd(VO4)7. J. Alloy. Compd. 2015, 618, 649–655. [Google Scholar] [CrossRef]
  15. Zhang, Z.Z.; Zhang, F.; Li, G.Q.; Zhang, J.; Zhang, W.F. Red-emitting phosphor series: Ca9Y(PO4)7(1−x)(VO4)7x: Eu3+ (x = 0−1) with improved luminescence thermal stability by anionic polyhedron substitution. J. Mater. Sci. Mater. Electron. 2019, 30, 8838–8846. [Google Scholar] [CrossRef]
  16. Petříček, V.; Dušek, M.; Palatinus, L. Crystallographic computing system JANA2006: General features. Z. Krist. Cryst. Mater. 2014, 229, 345–352. [Google Scholar] [CrossRef]
  17. Deyneko, D.V.; Nikiforov, I.V.; Spassky, D.A.; Berdonosov, P.S.; Dzhevakov, P.B.; Lazoryak, B.I. Sr8MSm1-xEux(PO4)7 phosphors derived by different synthesis routes: Solid state, sol-gel and hydrothermal, the comparison of properties. J. Alloy. Compd. 2021, 887, 161340. [Google Scholar] [CrossRef]
  18. Dikhtyar, Y.Y.; Deyneko, D.V.; Boldyrev, K.N.; Borovikova, E.Y.; Lipatiev, A.S.; Stefanovich, S.Y.; Lazoryak, B.I. Luminescent properties of Er3+ in centrosymmetric and acentric phosphates Ca8MEr(PO4)7 (M = Ca, Mg, Zn) and Ca9−xZnxLa(PO4)7:Er3+. Mater. Res. Bull. 2021, 138, 111244. [Google Scholar] [CrossRef]
  19. Deyneko, D.V.; Nikiforov, I.; Spassky, D.; Dikhtyar, Y.Y.; Aksenov, S.M.; Stefanovich, S.Y.; Lazoryak, B.I. Luminescence of Eu3+ as a probe for the determination of the local site symmetry in β-Ca3(PO4)2-related structures. CrystEngComm 2019, 21, 5235–5242. [Google Scholar] [CrossRef]
  20. Bessière, A.; Benhamou, R.A.; Wallez, G.; Lecointre, A.; Viana, B. Site occupancy and mechanisms of thermally stimulated luminescence in Ca9Ln(PO4)7 (Ln=lanthanide). Acta Mater. 2012, 60, 6641–6649. [Google Scholar] [CrossRef]
  21. Shannon, R. Revised effective ionic radii and systematic study of inter atomic distances in halides and chalcogenides. Acta Crystallogr. Sect. A Found. Crystallogr. 1976, 32, 751–767. [Google Scholar]
  22. Zhang, Z.-J.; Yang, W. Luminescence characteristic of RE (RE = Pr, Sm, Eu, Tb, Dy) and energy levels of lanthanide ions in Gd5Si3O12N. Solid State Sci. 2017, 72, 64–70. [Google Scholar] [CrossRef]
  23. Zhang, J.; Wang, Y.; Wen, Y.; Zhang, F.; Liu, B. Luminescence properties of Ca10K(PO4)7:RE3+ (RE=Ce, Tb, Dy, Tm and Sm) under vacuum ultraviolet excitation. J. Alloy. Compd. 2011, 509, 4649–4652. [Google Scholar] [CrossRef]
  24. Gruber, J.B.; Conway, J.G. Electronic energy levels and crystal quantum states of Tm (IV). J. Chem. Phys. 1960, 32, 1178. [Google Scholar] [CrossRef]
  25. Baklanova, Y.V.; Lipina, O.A.; Surat, L.L.; Chufarov, A.Y.; Tyutyunnik, A.P.; Zubkov, V.G. Luminescence Properties of Sr2La8−xTmx(GeO4)6O2 Apatites (x = 0.1–1.0) in the Visible and Short-Wave IR Spectral Ranges. Phys. Solid State 2020, 62, 1407–1414. [Google Scholar] [CrossRef]
  26. Ferhi, M.; Horchani-Naifer, K.; Férid, M. Spectroscopic properties of Eu3+-doped KLa(PO3)4 and LiLa(PO3)4 powders. Opt. Mater. 2011, 34, 12–18. [Google Scholar] [CrossRef]
Figure 1. PXRD patterns for Ca9Gd0.9−xTm0.1Smx(PO4)7 (x = 0 (1); 0.2 (2); 0.3 (3)) and Ca9Gd0.9−yTmySm0.1(PO4)7 (y = 0 (4); 0.1 (5); 0.2 (6)) with Bragg reflections for Ca9Dy(PO4)7 (PDF Card No 49-1086).
Minerals 12 00076 g001
Figure 2. Dependence of the unit cell volumes of Ca9Gd0.9−xTm0.1Smx(PO4)7 (1) and Ca9Gd0.9−yTmySm0.1(PO4)7 (2) on the concentration of REE, and the unit cell volume of pure Ca9Gd(PO4)7 (3).
Minerals 12 00076 g002
Figure 3. The SEM image for Ca9Gd0.8Tm0.1Sm0.1(PO4)7.
Minerals 12 00076 g003
Figure 4. Temperature dependence of the dielectric permittivity ε (a) and dielectric loss tangent tan δ (b) for Ca9Gd(PO4)7.
Minerals 12 00076 g004
Figure 5. (a) PLE (λem = 602 nm) and (b) PL (λex = 404 nm) spectra for Ca9Gd0.9Sm0.1(PO4)7.
Minerals 12 00076 g005
Figure 6. (a) PLE (λem = 477 nm) and (b) PL (λex = 356 nm) spectra for Ca9Gd0.9Tm0.1(PO4)7.
Minerals 12 00076 g006
Figure 7. PL spectrum of Ca9Gd0.8Tm0.1Sm0.1(PO4)7, λex = 356 nm.
Minerals 12 00076 g007
Figure 8. Integrated intensity of Tm3+ (1) and Sm3+ (2) emissions for Ca9Gd0.9−xTm0.1Smx(PO4)7 (a) and Ca9Gd0.9−yTmySm0.1(PO4)7 (b) at λex = 356 nm.
Minerals 12 00076 g008
Figure 9. Color coordinates for Ca9Gd0.9−xTm0.1Smx(PO4)7 x = 0 (1), x = 0.1 (2), x = 0.2 (3), x = 0.3 (4) and Ca9Gd0.9Sm0.1(PO4)7 (5).
Minerals 12 00076 g009
Table 1. The ionic radii difference Dr between substituted and dopant ions.
DopantionRadius, Å/CNDr, %
Gd3+Ca2+
1.05 Å/80.94 Å/61.12 Å/81.00 Å/6
Tm3+0.88/66.813.6
0.99/86.113.1
Sm3+0.96/61.15.3
1.08/82.73.7
Publisher’s Note: MDPI stays neutral with regard to jurisdictional claims in published maps and institutional affiliations.

