Abstract
An in-depth understanding of the gravity flow behaviour of broken ore is beneficial to improving the ore recovery in sublevel caving mines. In this study, granular dolomites were used as an analogue to experimentally explore the effect of the physical properties of fragments on the gravity flow behaviour of broken ore. Five groups of granular dolomites were prepared first. Then, the particle size, particle size distribution, and particle morphology (e.g., sphericity, circularity, and fractal dimension) in each group were measured following the standard particle morphology test. After that, the angle of repose and the isolated extraction zone (IEZ) of each group were determined by performing funnel and isolated draw experiments, respectively. The experimental results highlighted the insubstantial effect of particle size and the significant effect of particle morphology on the angle of repose and isolated extraction zone of granular dolomite. It was found that a wider particle size distribution yielded an isolated extraction zone with a nonuniform shape and a smaller mass drawn because of the percolation of finer particles and the jamming of larger particles. Further, a linear negative correlation was revealed between the repose angle and the IEZ mass. Establishing the relationship between the repose angle and the IEZ shape would be of great significance. In this regard, the findings of this study can aid a preliminary analysis.
1. Introduction
Granular materials, which are generated not only by nature but also by various industries such as sand, broken ore, food crops, coal, and medicine, are globally prevalent [1]. The production, transportation, processing, and storage of industrial granular materials consume approximately 10% of the energy on Earth every year [2]. An in-depth understanding of granular materials is commercially important in engineering applications (e.g., pharmaceuticals, pigments, and energy production) and in the control of natural disasters (e.g., debris flow, avalanches, and landslides) [3]. A granular material is a complex system formed by interactions among numerous discrete particles [4]. The movement of a single particle accords with the property of a solid. When many particles gather in a granular system and flow as a whole, they behave like a fluid [5]. Notably, the particles mentioned herein are those with a single particle size distribution in the range of 10−6–10 m because tiny particles with a size smaller than 1 μm are affected by thermal motion [6]. The flow behaviour of granular materials has garnered increasing attention from scientists and engineers due to its importance in the production, processing, and transportation of granular products [7,8].
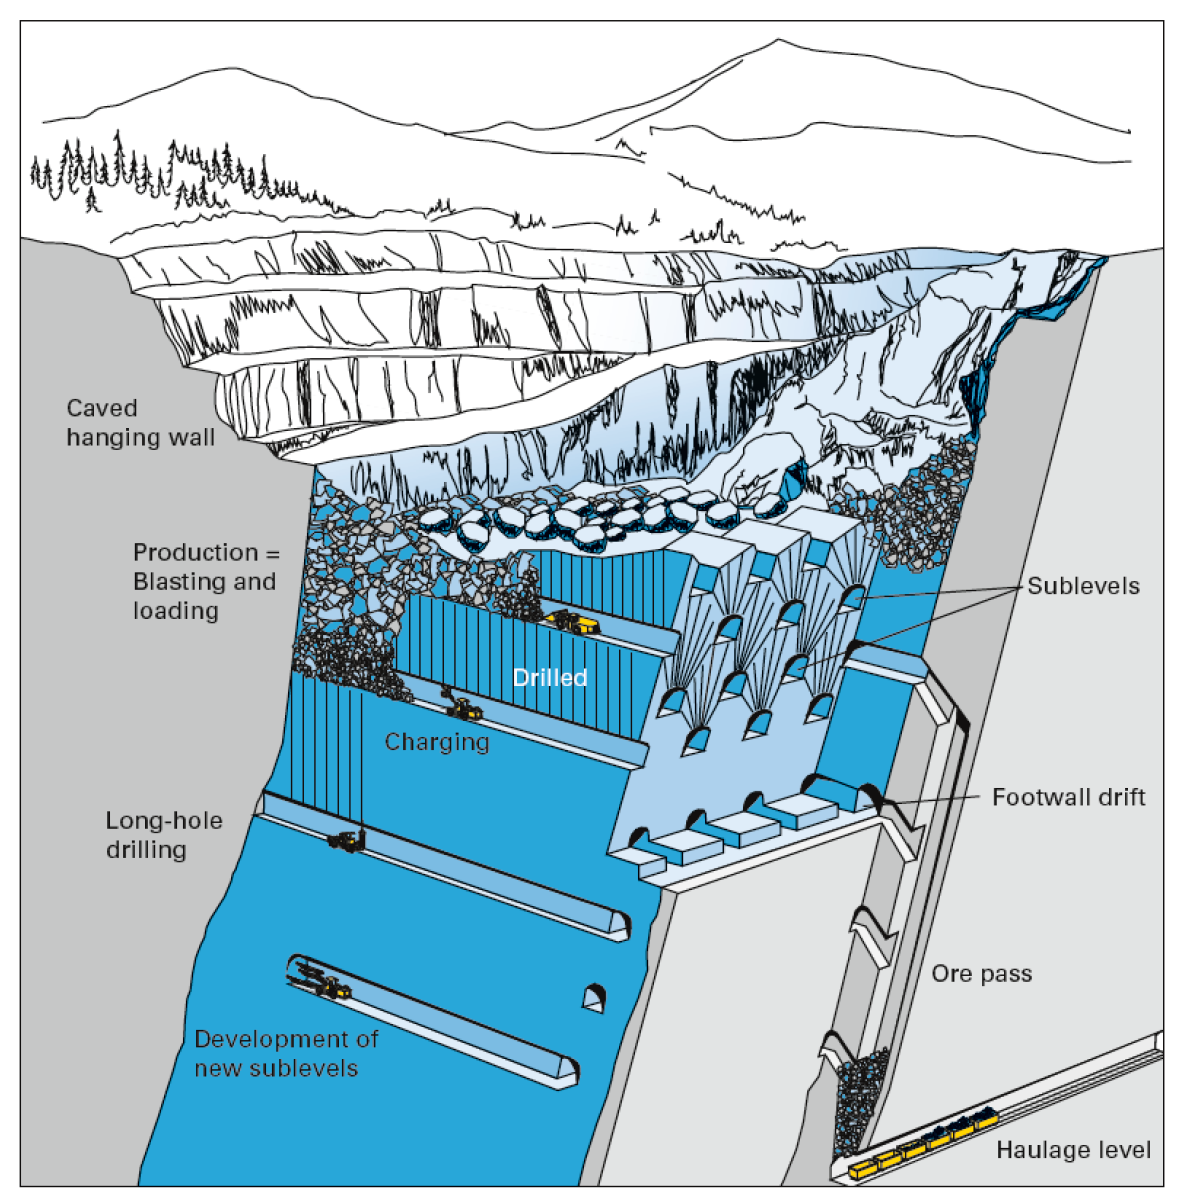
In mining engineering, broken ore fragments can be regarded as particles, and their drawing process in the sublevel caving method involves a typical gravity flow of granular materials. After cave mining, the caved rock fragments fill the goaf to control the ground pressure and form an overburden layer to cover the broken ore. As shown in Figure 1, the broken ore fragments fall to the crosscuts below via the pre-constructed drawpoints [9]. If their spatial distribution is unreasonable or the ore draw process is not managed properly, the caved rock will mix with the broken ore and move downward from the drawpoints together, leading to ore dilution. If the drawpoint is closed too early, the broken ore will not be fully recovered, resulting in ore loss [10]. A reasonable and efficient draw scheme to improve ore recovery requires an in-depth understanding of the gravity flow mechanism of ore fragments. For example, one must consider how the fragments’ physical properties influence the repose angle, mass drawn, and shape of the isolated extraction zone (IEZ) of the broken ore in the draw process.
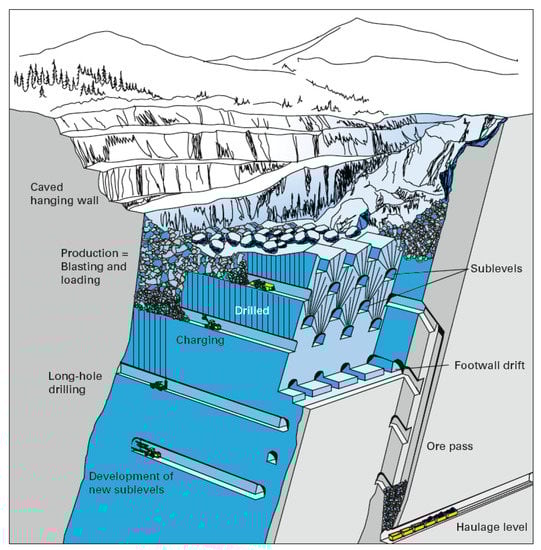
Figure 1.
Sublevel caving method layout (courtesy of Atlas Copco) [9].
Numerous experimental and numerical studies have demonstrated that the flow behaviour of granular materials depends on the physical properties of the particles, especially the shapes and sizes of the particles. For instance, Liu et al. [11] used ellipsoidal particles with different shapes to explore the flow behaviour of granular material in cylindrical hoppers, and they noticed that the particle shape had a significant effect on the flow pattern. Robinson et al. [12] used glass beads, quartz grains, and tuff grains to investigate the effects of particle shape and particle size distribution on avalanches. Their results demonstrated a strong relationship between the slope angles and particle shape, and that the particle size distribution affected the slope angle and avalanching mode apparently when the grains became less spherical. In numerical studies, the discrete element method (DEM) has been widely used to study the flow behaviour of granular material with complex particle shapes because it could simulate particles with different shapes conveniently by overlapping rigidly connected spheres [13,14,15]. For example, the flow behaviours of granular products in agriculture, e.g., beans [16], corn [17], rice [18], soybeans [19], and wheat [20], have been thoroughly discussed via the DEM. Cleary [21] and Höhner et al. [22] also employed the DEM to evaluate the influence of particle shape on the hopper discharge at different angles.
Thus far, there have been relatively few reports on the impact of the physical properties of particles on the gravity flow behaviour in the ore draw process, and most of the existing studies have focused only on the impact of particle size. For instance, Castro et al. [23] observed that the particle size had no significant impact on the IEZ in an ore draw experiment. Based on a DEM simulation, Jin et al. [24] also reported that the particle size had no significant impact on the IEZ. On the contrary, three-dimensional numerical simulations conducted by Power [25] showed that the height of the draw and the particle size had a considerable impact on the IEZ geometry. In addition to this, Castro [23] stated that the particle size distribution did not affect the IEZ; however, the three-dimensional physical experiment and DEM modelling performed by Wang et al. [26] highlighted the effect of the particle size distribution on the shape and volume of the IEZ. Through 3D experiments [27] and cellular automata simulations [28], it has been confirmed that the migration of fine particles is an important factor that affects ore recovery.
In addition to particle size, secondary fragmentation [29], surface roughness, and shape affect ore recovery considerably. Sun et al. [30] used peanut-shaped particles to simulate the secondary fragmentation in gravity flow; the results showed that the secondary fragmentation of weak rocks resulted in wider movement and extraction zones than those observed with strong rocks. Lapčević et al. [31] analysed the impact of friction and fragmentation change in a caved rock mass on ore dilution and recovery by using the DEM. The results showed that a decrease in both friction and fragmentation resulted in a higher dilution mainly because of the relatively low kinematic resistance in the caved mass. Moreover, Song et al. [32] explored the impact of particle shape on the IEZ using the DEM, and they noticed that the quality of the IEZ improved with the clump sphericity. However, a complex particle shape significantly reduces computational efficiency, and thus, some researchers proposed the application of rolling resistance to spherical particles to simulate the impact of particle shape on particle motion [33]. Based on this method, the rolling resistance model in the Particle Flow Code was used to simulate the effect of the actual shape of different materials flowing towards a drawpoint under the near-field condition by Sun et al. [34]. The results were consistent with those of the corresponding physical experiments.
The mechanism of caving ore drawing can be elucidated by studying the influences of particle size and particle shape on flow performance, repose angle, and IEZ. The influences on the repose angle have been comprehensively studied via physical experiments and numerical simulation methods [6]. The influence of particle size on the IEZ has also been studied via physical experiments and DEM simulation. However, few studies have focused on how particle shape affects the gravity flow behaviour of ore fragments.
Contradictory conclusions exist on the effects of particle size and particle size distribution on ore behaviour. Experimental investigation on the effect of particle shape has also been limited. These drawbacks hinder the elucidation of the flow behaviour of ore fragments in cave mining and the development of practical guidelines to design efficient draw schemes. In addition, there has been no study on the relationship between the repose angle and the IEZ shape. The repose angle of ore and rock is easier to measure than the shape of the IEZ. The use of the repose angle to characterize the fluidity of ore and rock and predict the shape of the IEZ would significantly aid the design of structural parameters of the caving stope.
In this study, the effects of particle shape, particle size, and particle size distribution on the gravity flow behaviour of broken ore in cave mining were investigated experimentally. Five groups of granular dolomites with different physical properties were prepared. The particle size, particle shape (e.g., sphericity, circularity, and roughness), and particle size distribution in each group were measured by using the Occhio Zephyr ESR2 instrument following the international standard particle morphology test. The funnel and isolated draw experiments were then carried out on each group. Finally, based on the experimental results, graphic and statistical approaches were employed to explore the effect of the physical properties of particles on the angle of repose and the IEZ (e.g., shape, volume, and mass) of granular dolomite. The experimental results obtained from this study can help field operators increase productivity in sublevel caving mines. For example, it is suggested that when conducting blasting operations in cave mining, the mining engineer can choose appropriate and advanced blasting techniques to break the orebody into fragments with a narrow/concentrated size distribution, e.g., using the vertical borehole shock-reflection blasting and water medium energy exchange blasting techniques. Thus, the overall flowability of broken ore fragments can be improved, maximising the ore recovery rate.
2. Experimental Materials and Methods
This study includes three experiments: the first involved measuring the shapes and sizes of five groups of materials, the second involved measuring the repose angles of different particle materials, and the third involved the isolated extraction of different particle materials.
2.1. Particle Shape Measurement
Dolomite was used as the experimental material because of the following:
- It is cheap and easily available. A total of 2.5 tons of dolomite material used in the experiment was purchased from a nearby mine, thereby saving high transportation costs.
- Dolomite is a non-cohesive gravel material with physical and mechanical properties similar to ore. Sand and gravel have been widely used to study the shape of isolated extraction zones; however, Castro et al. [23] showed that gravel is more effective than sand.
- Dolomite is easier to polish and dye to mark it compared to other materials. In the isolated draw experiment, some dolomite particles needed to be marked with numbers to deduce the IEZ shape; white particles are easier to be marked and identified.
First, the dolomite was broken into small irregular particles, with particle size diameters of 4–16 mm. Then the materials were divided into five groups by screening, and finally, two groups of particles were polished for smoothness. The details of the materials are listed in Table 1.

Table 1.
Experimental materials.
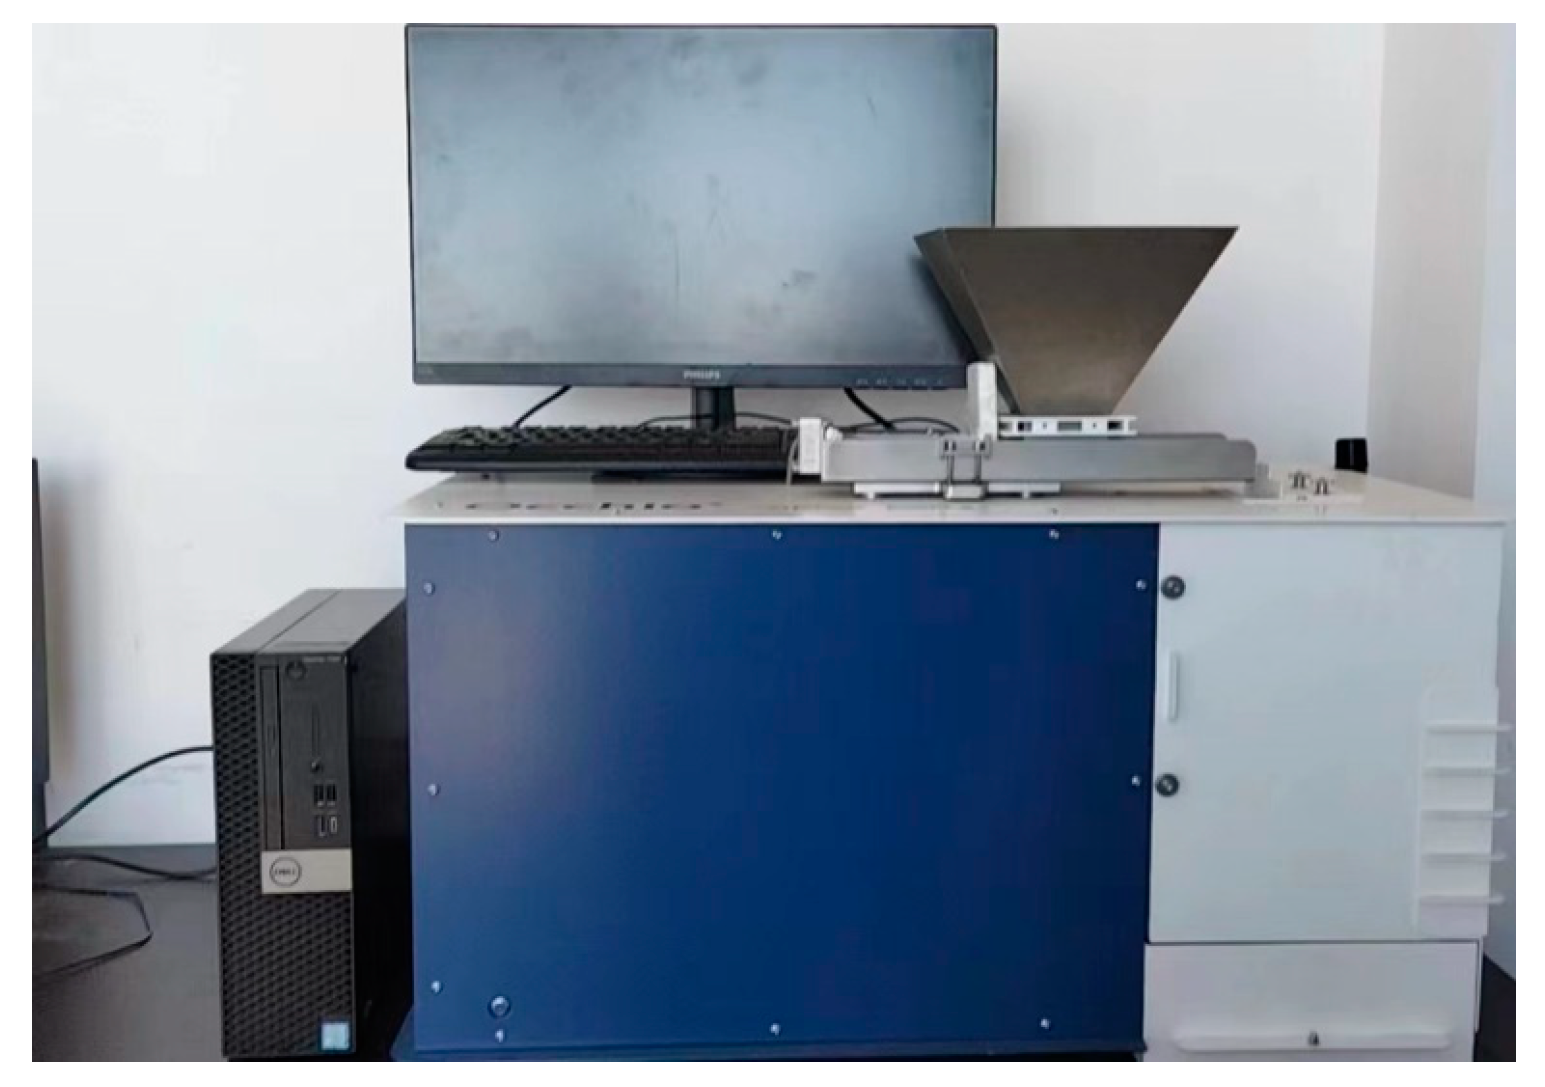
It was necessary to quantitatively describe the shape of particles to further study the effect of particle shape on particle flow. Accordingly, the particle size and shape of each sample group were measured using a particle size analyser (Occhio Zephyr ESR2). The instrument and the test materials are shown in Figure 2 and Figure 3, respectively. The obtained information about particle morphology includes the length, width, volume, area, ferret diameter, and equivalent circle diameter. Table 2 provides a summary of the parameters.
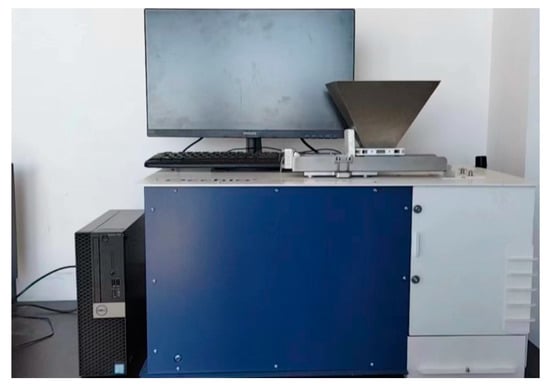
Figure 2.
Experimental instrument Occhio Zephyr ESR2.
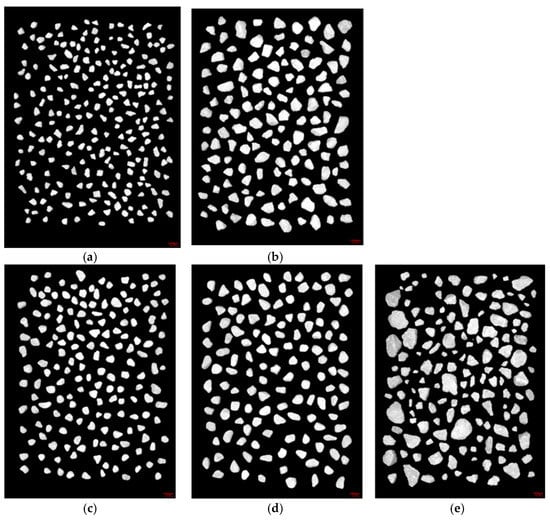
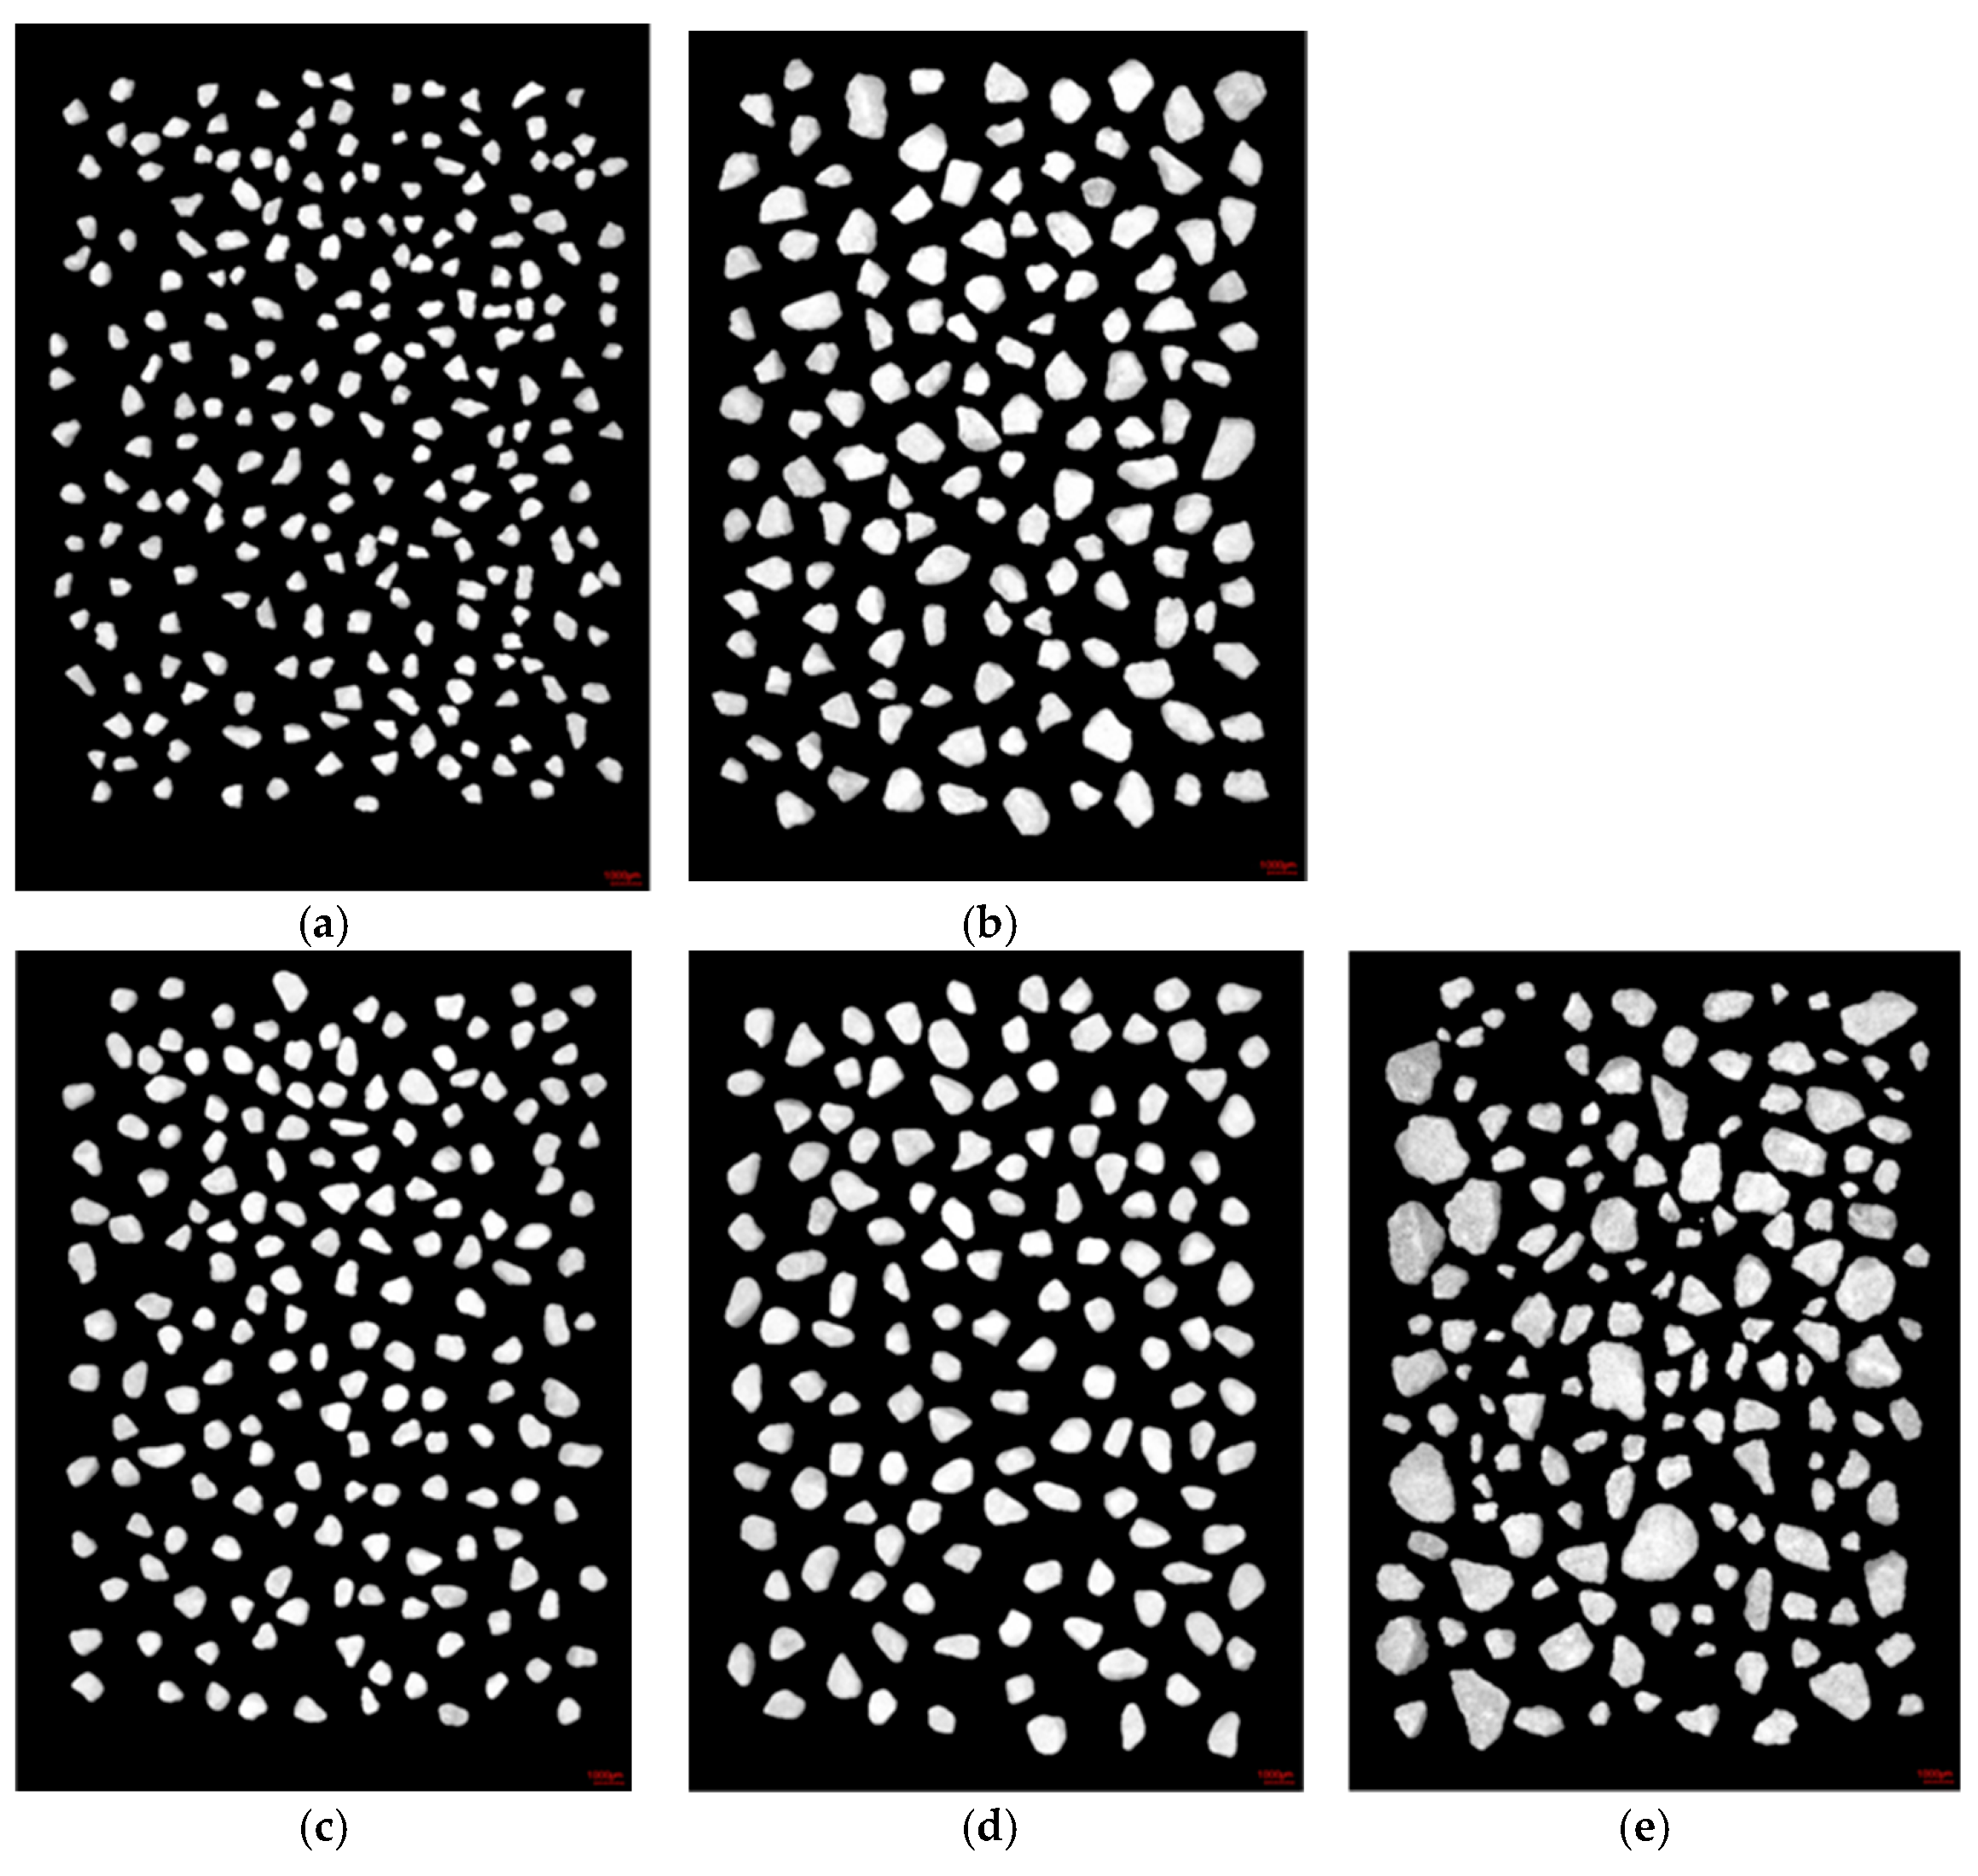
Figure 3.
Experimental materials. (a) Material group 1. (b) Material group 2. (c) Material group 3. (d) Material group 4. (e) Material group 5.
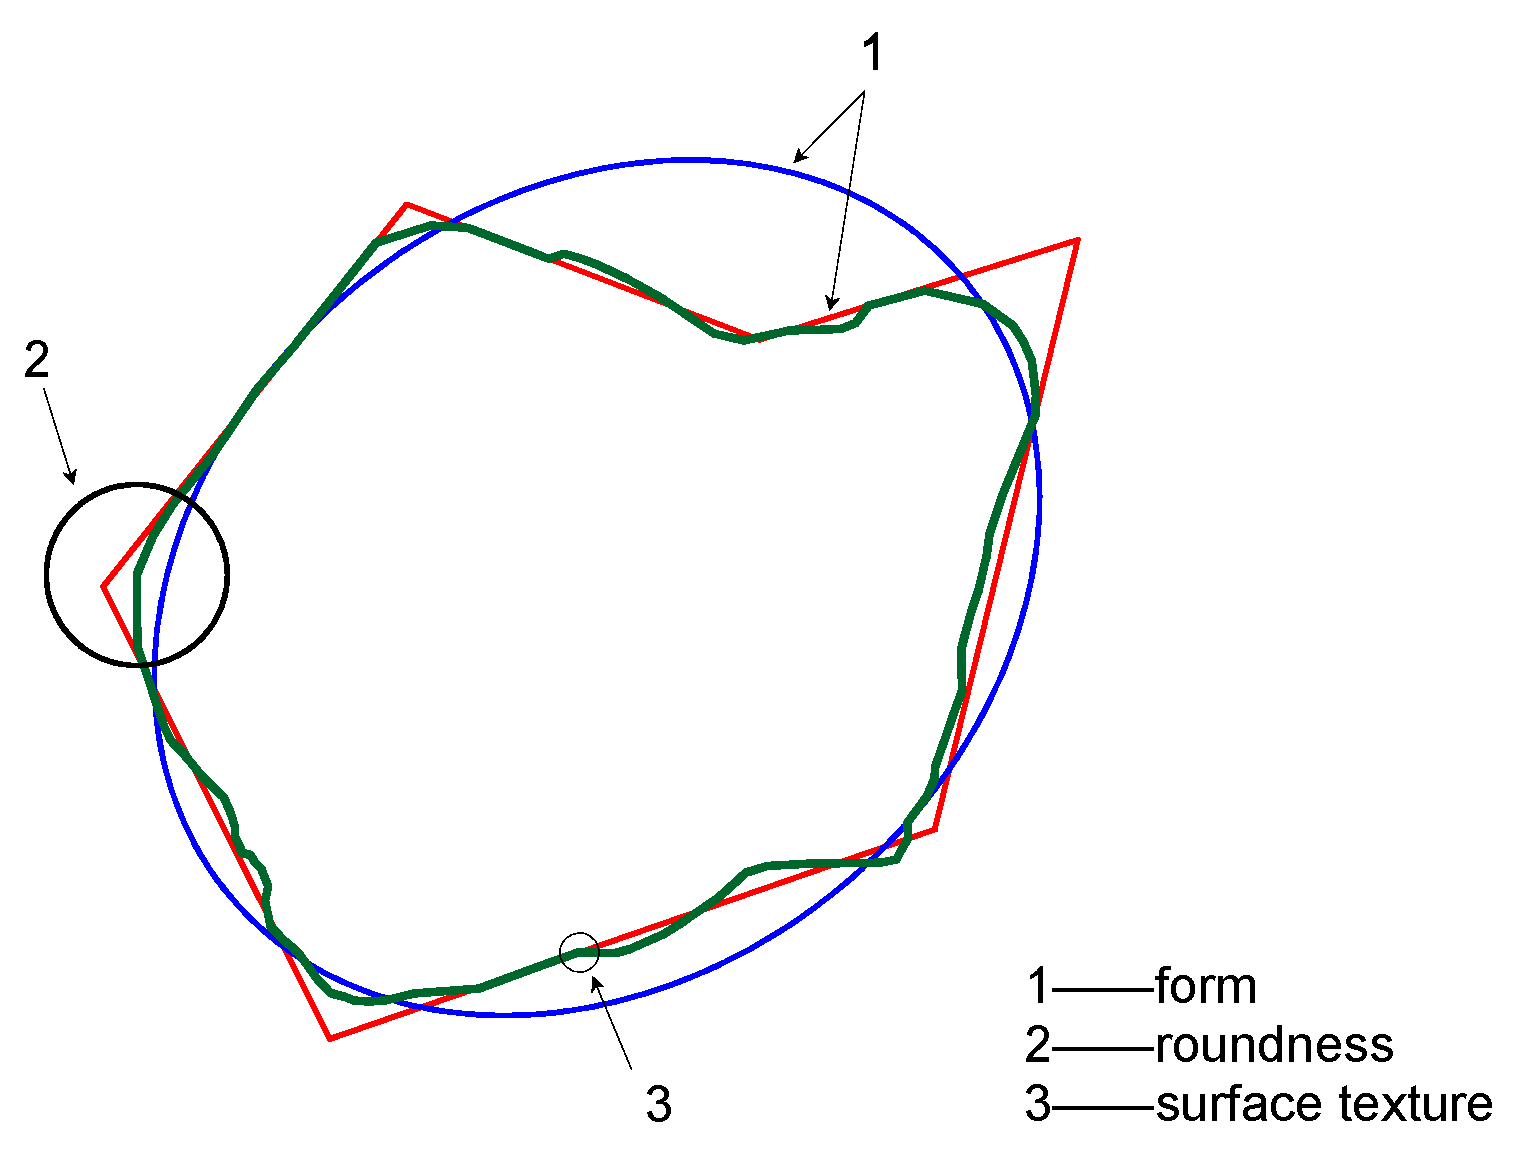
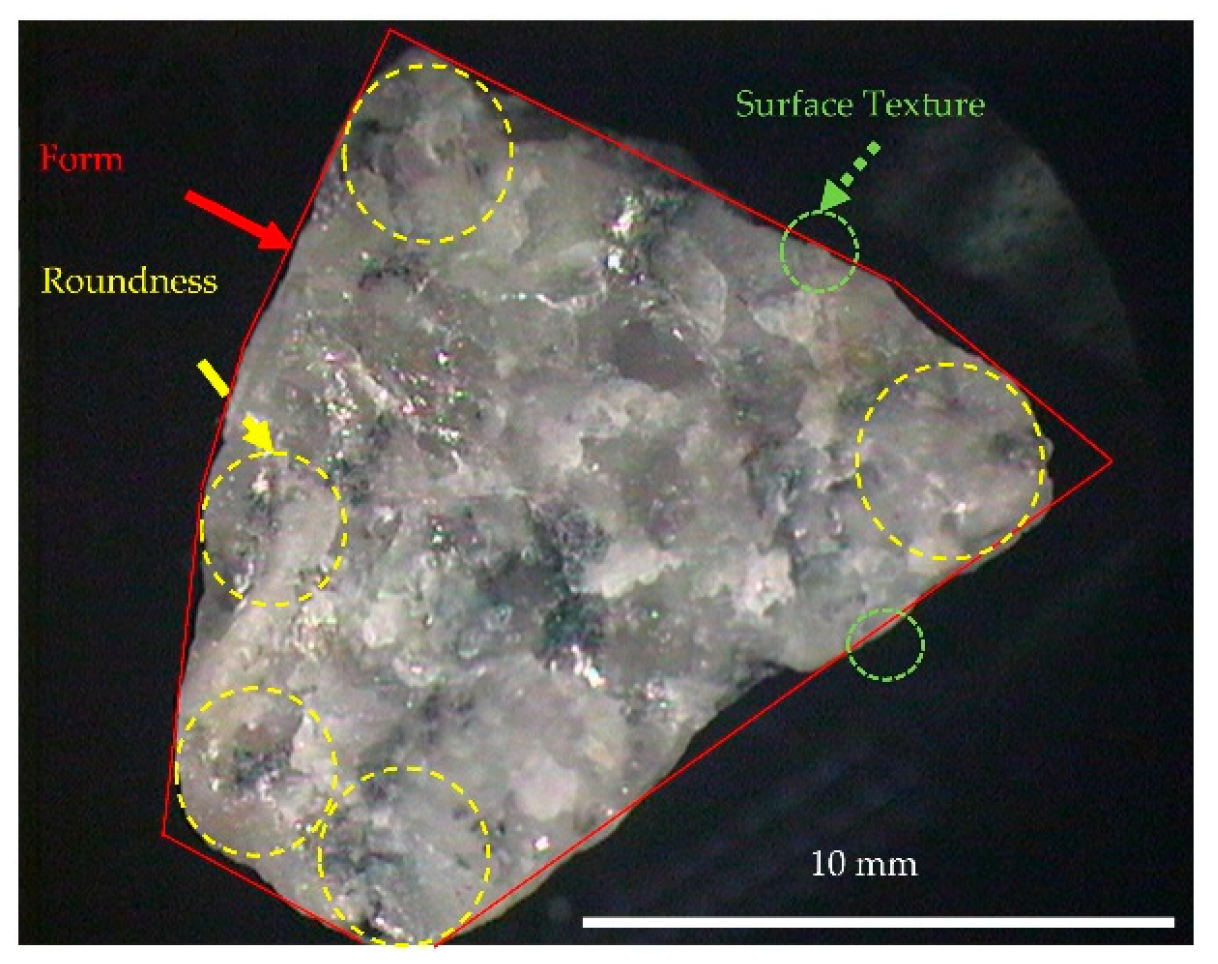
As shown in Figure 4 and Figure 5, the particle shape can be generally described in the following three aspects: (1) form, which reflects the geometrical proportions of a particle, such as long strips or circles; (2) roundness, which expresses the radius of curvature at the particle corners; and (3) surface texture, which is taken as defining the local roughness features at corners and edges between corners only.
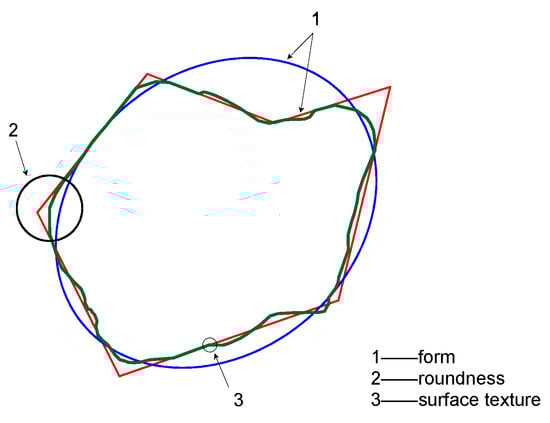
Figure 4.
Properties of particle shape [35].
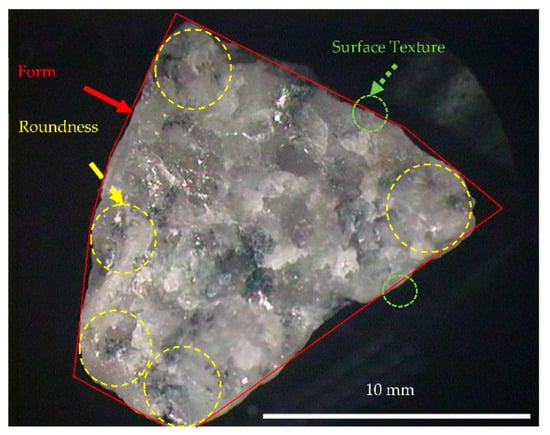
Figure 5.
Coarse quartz particle with different morphological features [36].
Scientists have proposed different methods to describe particle shapes in actual research. Cho et al. [37] considered that sphericity can be quantified as the diameter of the largest inscribed sphere relative to the diameter of the smallest circumscribed sphere. In contrast, Altuhafi et al. [38] indicated that sphericity is calculated as the ratio of the perimeter of the equivalent circle with the same area as the particle to the actual perimeter. To avoid deviations caused by different shape descriptions, the particle shape description in this study refers to the international standard ISO 9276-6.
Table 2.
Description of particle morphology and distribution parameters [39].
Table 2.
Description of particle morphology and distribution parameters [39].
| Parameter | Symbol | Description | Equation |
|---|---|---|---|
| Volume | V | The volume of the particle volume model. | |
| Volume-equivalent diameter | xV | The diameter of a sphere with the same volume as the particle. | |
| Projection area | A | The projection area of the particle. | |
| Area-equivalent diameter | xA | The diameter of a sphere with the same projection area as the particle. | |
| Surface area | S | The external surface area of the particle volume model. | |
| Surface-equivalent diameter | xs | The diameter of a sphere with the same surface area as the particle. | |
| Perimeter | P | The length of the particle perimeter. | |
| Perimeter-equivalent diameter | xP | The diameter of a circle with the same perimeter as the projection area of the particle. | |
| Legendre ellipse maximum/minimum | xLMax/ xLMin | The major/minor axis of an ellipse with its centre at the particle’s centroid. | |
| Feret diameter maximum/minimum | xFmax/ xFMin | The maximum/ minimum distance between parallel tangents to the projection area of the particle. | |
| Feret conjugate | xLF | The Feret diameter perpendicular to the Feret diameter minimum. | |
| Maximum inscribed circle diameter | dimax | The biggest circle inscribed in the projection area of the particle. | |
| Minimum circumscribed circle diameter | dcmin | The smallest circle containing the projection area of the particle. | |
| Perimeter of the convex hull | PC | The perimeter length of the convex hull (envelope) that bounds the particle. | |
| Area of the convex hull | AC | The area of the convex hull (envelope) that bounds the particle. | |
| Ellipse ratio | RL | The ratio of the Legendre ellipse minimum to the Legendre ellipse maximum. | |
| Aspect ratio | RA | The ratio of the Feret minimum to the Feret maximum. | |
| Irregularity | RI | The ratio of the maximum inscribed circle diameter to the minimum circumscribed circle diameter. | |
| Compactness | RC | The degree to which the projection area of the particle is similar to a circle. The ratio of the area-equivalent diameter to the Feret diameter maximum. | |
| Extent | RE | The ratio of the projection area to the product of the Feret diameter maximum by the Feret diameter minimum. | |
| Box ratio | RB | The ratio of the projection area to the Feret box area, where the Feret box area is the product of the Feret diameter minimum by the Feret diameter conjugate. | |
| Sphericity | Ψ | The square of the ratio of the volume-equivalent diameter to the surface-equivalent diameter. | |
| Circularity | Ci | The degree to which the projection area of the particle is similar to a circle, considering the smoothness of the perimeter. | |
| Solidity | Ca | A measure of the overall concavity of the projection area of the particle. | |
| Convexity | Ce | A measure of the overall convexity of the projection area of the particle. | |
| Fractal dimension | DF | The relationship between the length of the perimeter [P(λ)] and the length of the step; [λ] is considered as linear on a log–log plot. The fractal dimension provides the slope of this linear relationship. | |
| Uniformity index | Cu | p10 is the size corresponding to the 10% passing andp60 is the 60% passing size. |
2.2. Measurement of the Angle of Repose
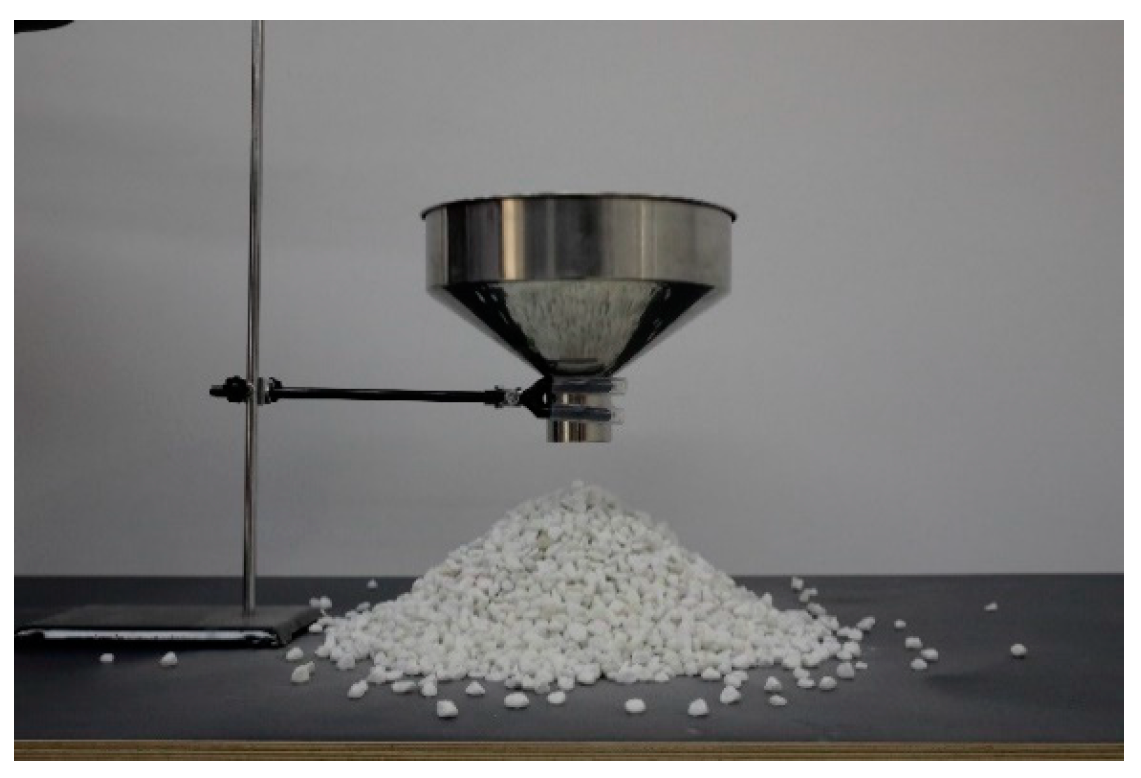
The process of determining the repose angle can be divided into two stages: (1) the study of how a piled cone is formed, and (2) the study of how the acquired repose angle is measured. The most common methods of cone formation include the tilting box, fixed funnel, revolving cylinder/drum, hollow cylinder, and tilting cylinder methods [6]. To measure the repose angle, there are three approaches, namely a manual/visual measurement performed with a protractor held to the slant height of the cone; digital image analysis and the coordinate measuring technique using optical scanners; and the coordinate measuring machine (CMM) with a triangulation probe or photogrammetry [40]. In this study, the fixed funnel method and digital image analysis were used to form the cone and measure the repose angle of the stack, respectively, as done in a previous study [41]. To ensure that the measurement results were under the same experimental conditions, the camera and funnel were fixed, while the experimental materials were varied. The experimental funnel is presented in Figure 6.
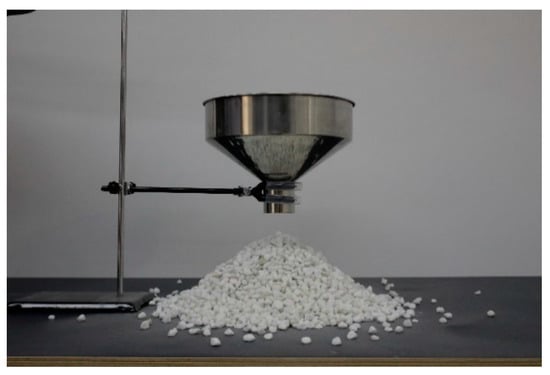
Figure 6.
Experimental device.
The experimental process is as follows:
- The funnel was placed and fixed on a wooden base.
- The switch at the bottom of the funnel was turned off, and the bulk material was poured into the funnel until it was full.
- The switch at the bottom of the funnel was turned on, and the pile gradually formed as the particles flowed out under gravity.
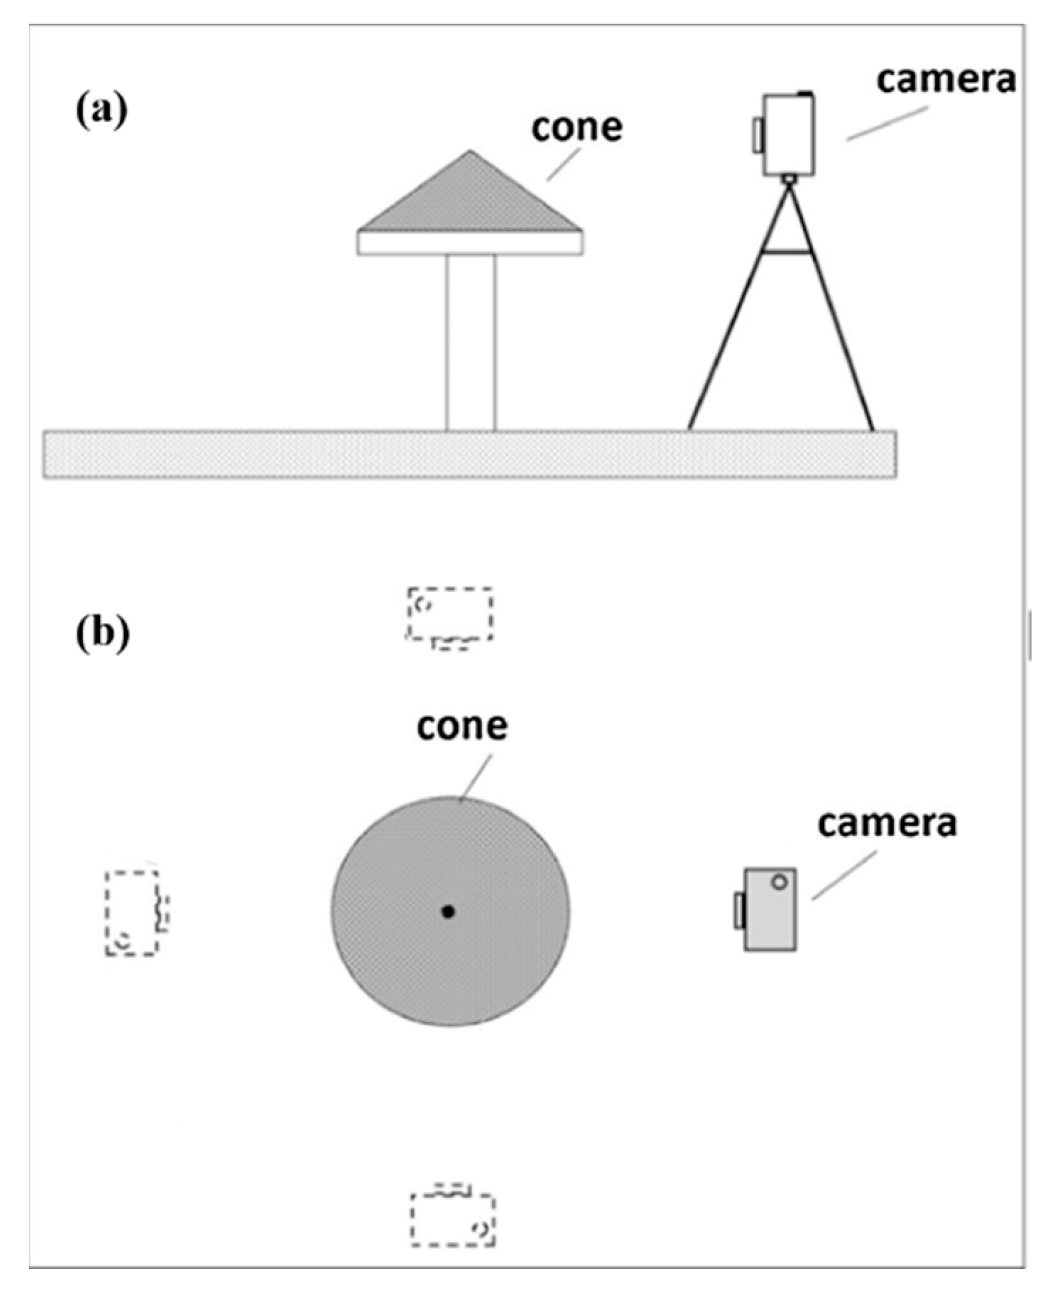
- Photographs of the cone were taken from different perspectives, as shown in Figure 7.
 Figure 7. Acquisition method of cone photos (a) side view, (b) top view [42].
 - MATLAB software was used to grayscale the photos and extract the contours of the heap.
- The repose angle of both sides of the heap was obtained by linear fitting based on the least squares method.
- The mean angle of repose was calculated from different photos as the final result.
- The above experimental steps were repeated to measure the angle of repose of the remaining materials.
2.3. Isolated Physical Ore Drawing Experiment
2.3.1. Physical Model
The ore body and surrounding rock are broken into blocks of different sizes and complex and irregular shapes in cave mining and are discharged from the drawpoint under gravity. It is unrealistic to repeat the field experiments because of the large amount of manpower and resources needed in the ore drawing process. Therefore, a scaled physical model has been widely used in ore-drawing experiments. For instance, Castro et al. [23] constructed a large 3D physical model with a width, length, and height of 3.5, 2.5, and 3.3 m, respectively, to study the ore drawing law and proved that the effect of the geometrical scale on the IEZ shape was insignificant. However, such a large-scale experiment is still very time-consuming and laborious; thus, most scholars use a smaller scale model to study ore drawing. For instance, a smaller scaled physical drawing model was used by Zhang [43] to simulate the extraction of a moderately stable and inclined medium-thick ore body.
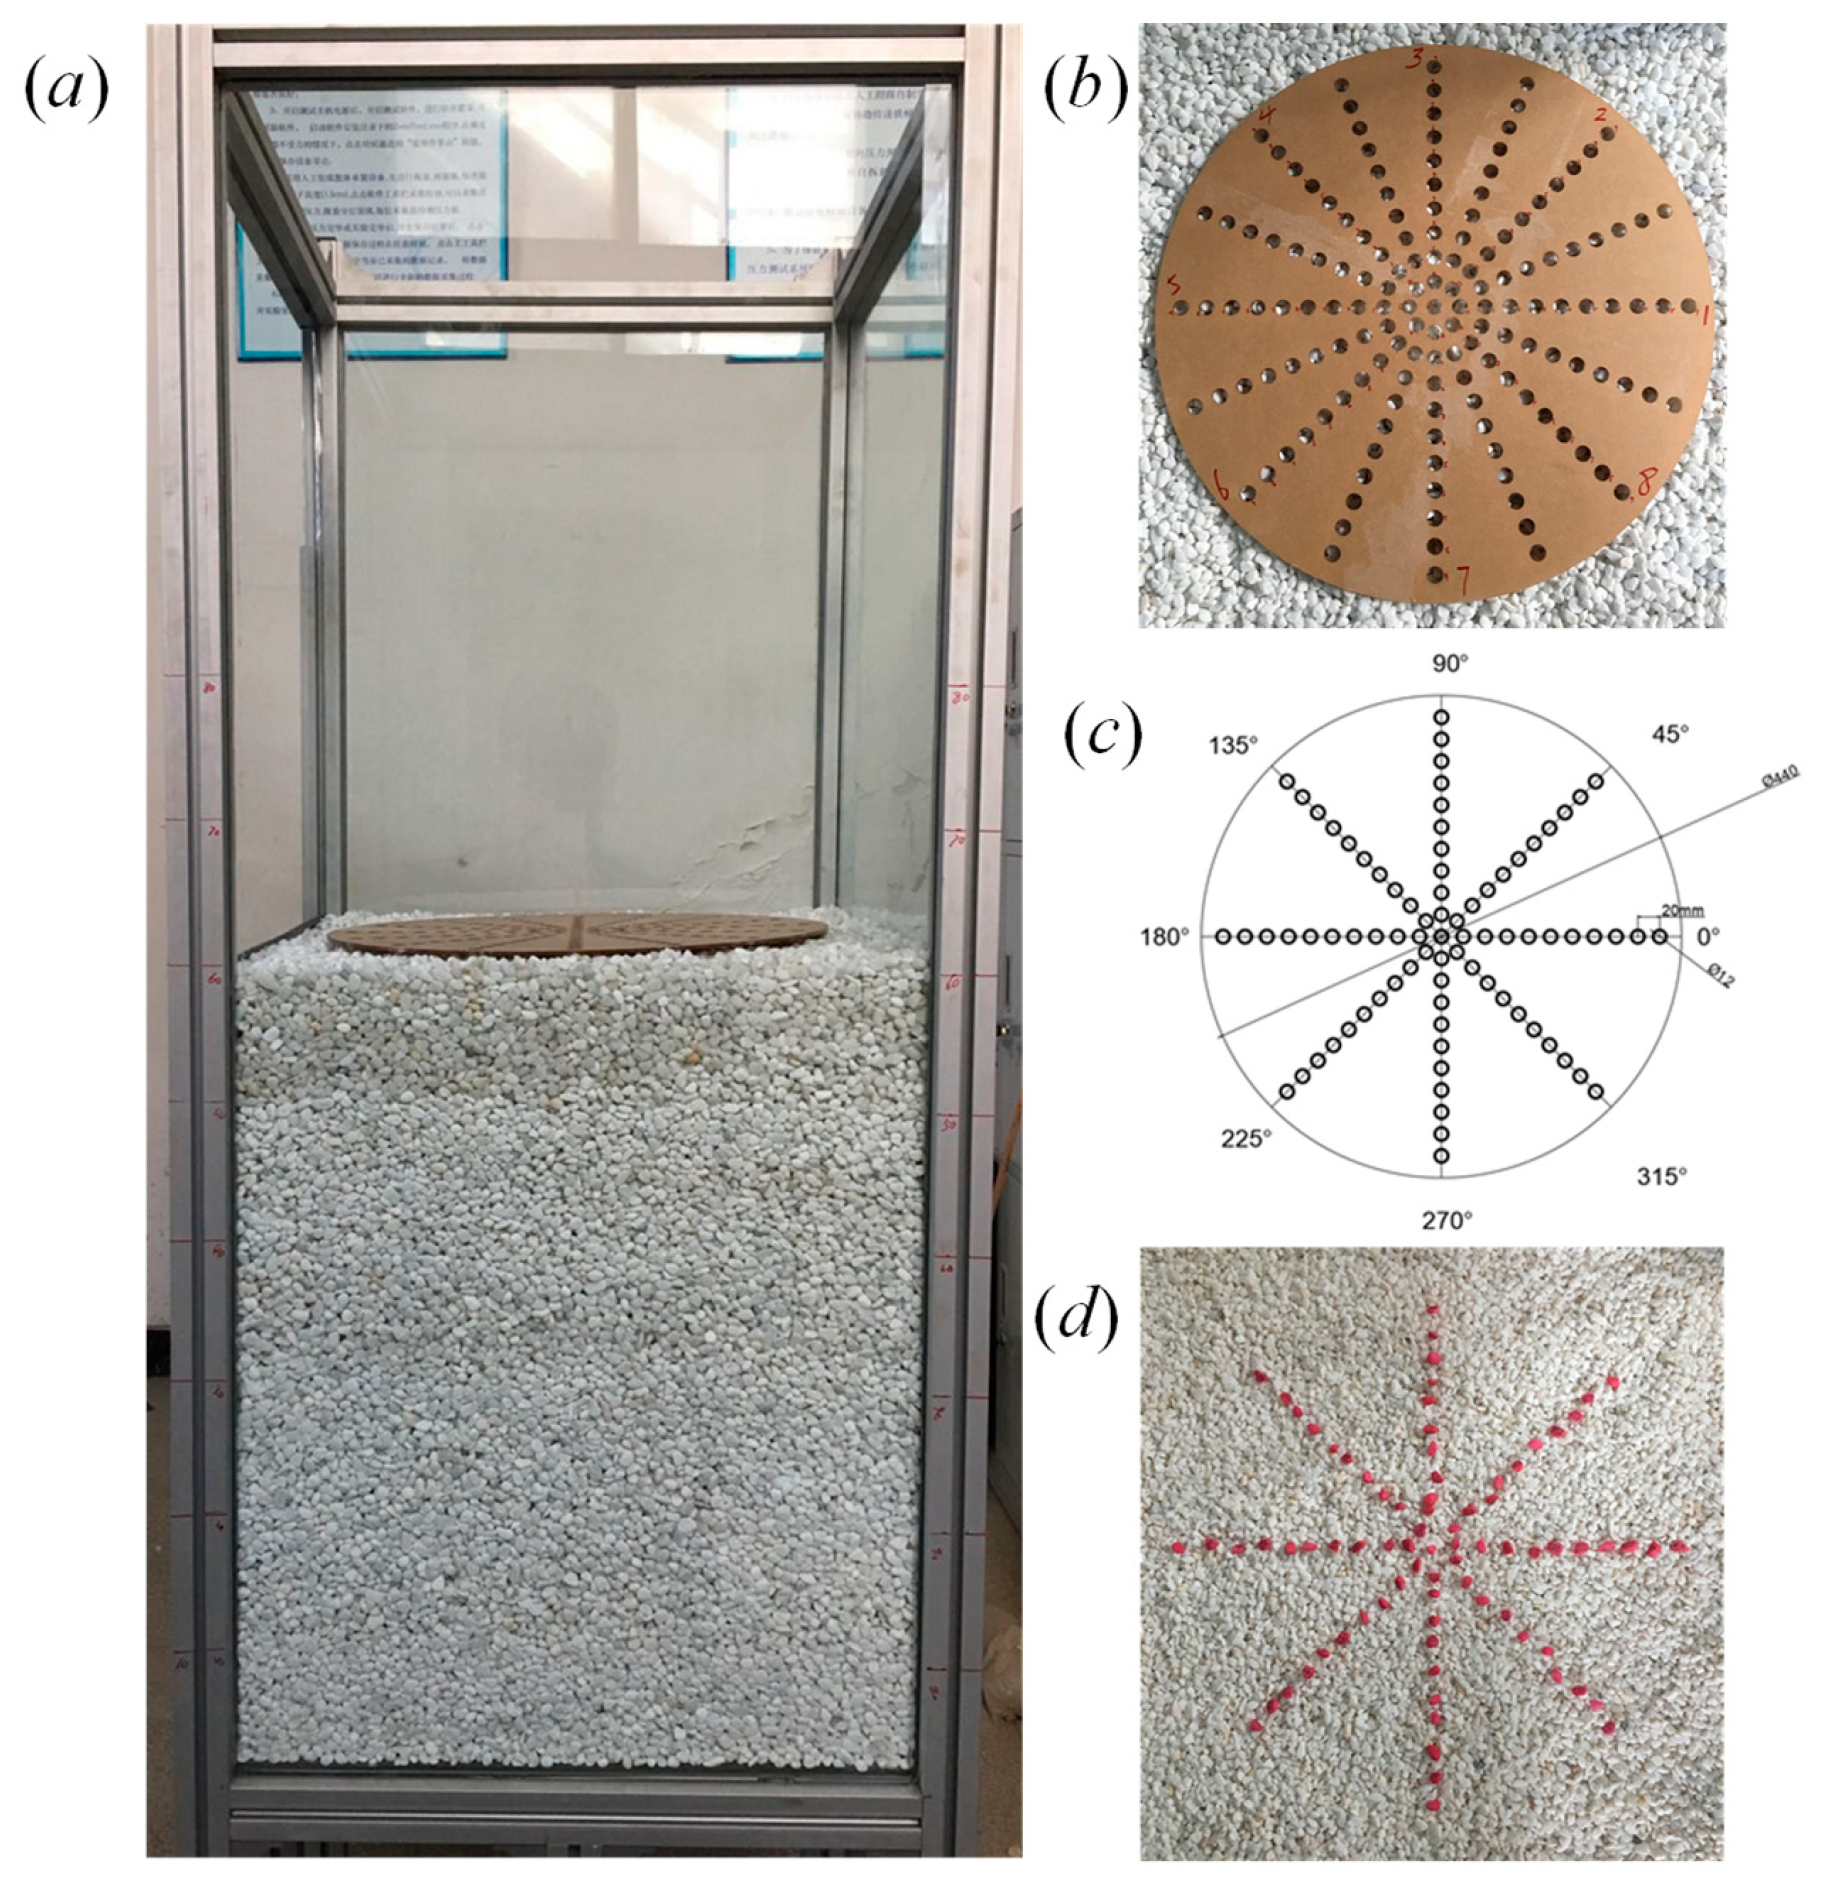
In this study, a self-designed physical experiment model of isolated drawing with a scale of 1:100 was used for this experiment, and the model is shown in Figure 8. The dimensions were determined after conducting a benchmark of current mine-design practice [44]. The size of the model was 500 mm × 500 mm × 1200 mm. The isolated drawpoint with the dimensions of 40 mm × 40 mm (length × width) was located at the bottom centre of the model to avoid the intersection between the flow zone and the sidewalls of the model.

Figure 8.
Physical scaled model for the isolated draw experiment. (a) perspective view; (b) marked particles placing tool; (c) marked particles positioning parameters; (d) actual placement of marked particles (top view).
2.3.2. Experimental Method
In the isolated ore drawing process, the shape formed by the position of the ore flowing out from the drawpoint in the raw ore heap is known as the IEZ. The shape and size of the IEZ are important factors affecting the recovery of ore using the caving method. The general method of obtaining IEZ information is to map the shape directly according to the definition of the IEZ. In particular, marked particles are placed in the granular pile in advance, the space position of the drawn particles in the original granular pile is inferred through the number of released marked particles, and the boundary of the IEZ is drawn. This method is simple and easy to implement but has the disadvantage of large errors.
In another method known as the mass accumulation method, marked particles are placed in the granular pile in advance. The mass of the drawn particles is measured when every marked particle is released, and the curve is drawn with the width of the IEZ as the x-axis and the accumulated released mass as the y-axis. Thereafter, the boundary coordinates of the IEZ are determined by the intersection of the lines parallel to the x-axis and the curves. This method can yield accurate results; therefore, it is widely used in ore drawing research, and it was also adopted to measure the shape of the IEZ in this experiment.
2.3.3. Experimental Process
In this study, the device shown in Figure 8 was applied to study the laws of isolated extraction. Before the start of the experiment, it was essential to level the model to avoid errors caused by angle deviation. Thereafter, gravel particles were added to the device layer by layer at a height of 100 mm per layer, and the model was filled with gravel to a height of 600 mm. To characterise the IEZ shape and record the corresponding mass drawn, labelled markers were placed at the top of each layer of the experimental materials, as shown in Figure 8. The position plate was used to assist in placing the positions of the marker particles. The markers were directly selected from the prepared gravel material, and unique symbols were labelled to represent their position coordinates in the model. Finally, it was necessary to place an extra overlying layer above the uppermost layer of the labelled makers to avoid rolling toward the crater.
After loading the model, the drawpoint at the bottom of the device was intermittently opened to allow particles to be released. The mass drawn and number of labelled particles were recorded sequentially. The drawing process was terminated when the labelled marker in the uppermost layer was released from the draw point.
3. Experimental results
3.1. The Particle Morphology Test
The particle morphology test experiment was repeated twice for each material, and a total of 10 groups of results were obtained, as summarised in Table 3. Some parameters are not listed in Table 3 because they were not used in the result analysis as intermediate variables.
Table 3.
Particle morphology parameters.
3.2. The Angle of Repose
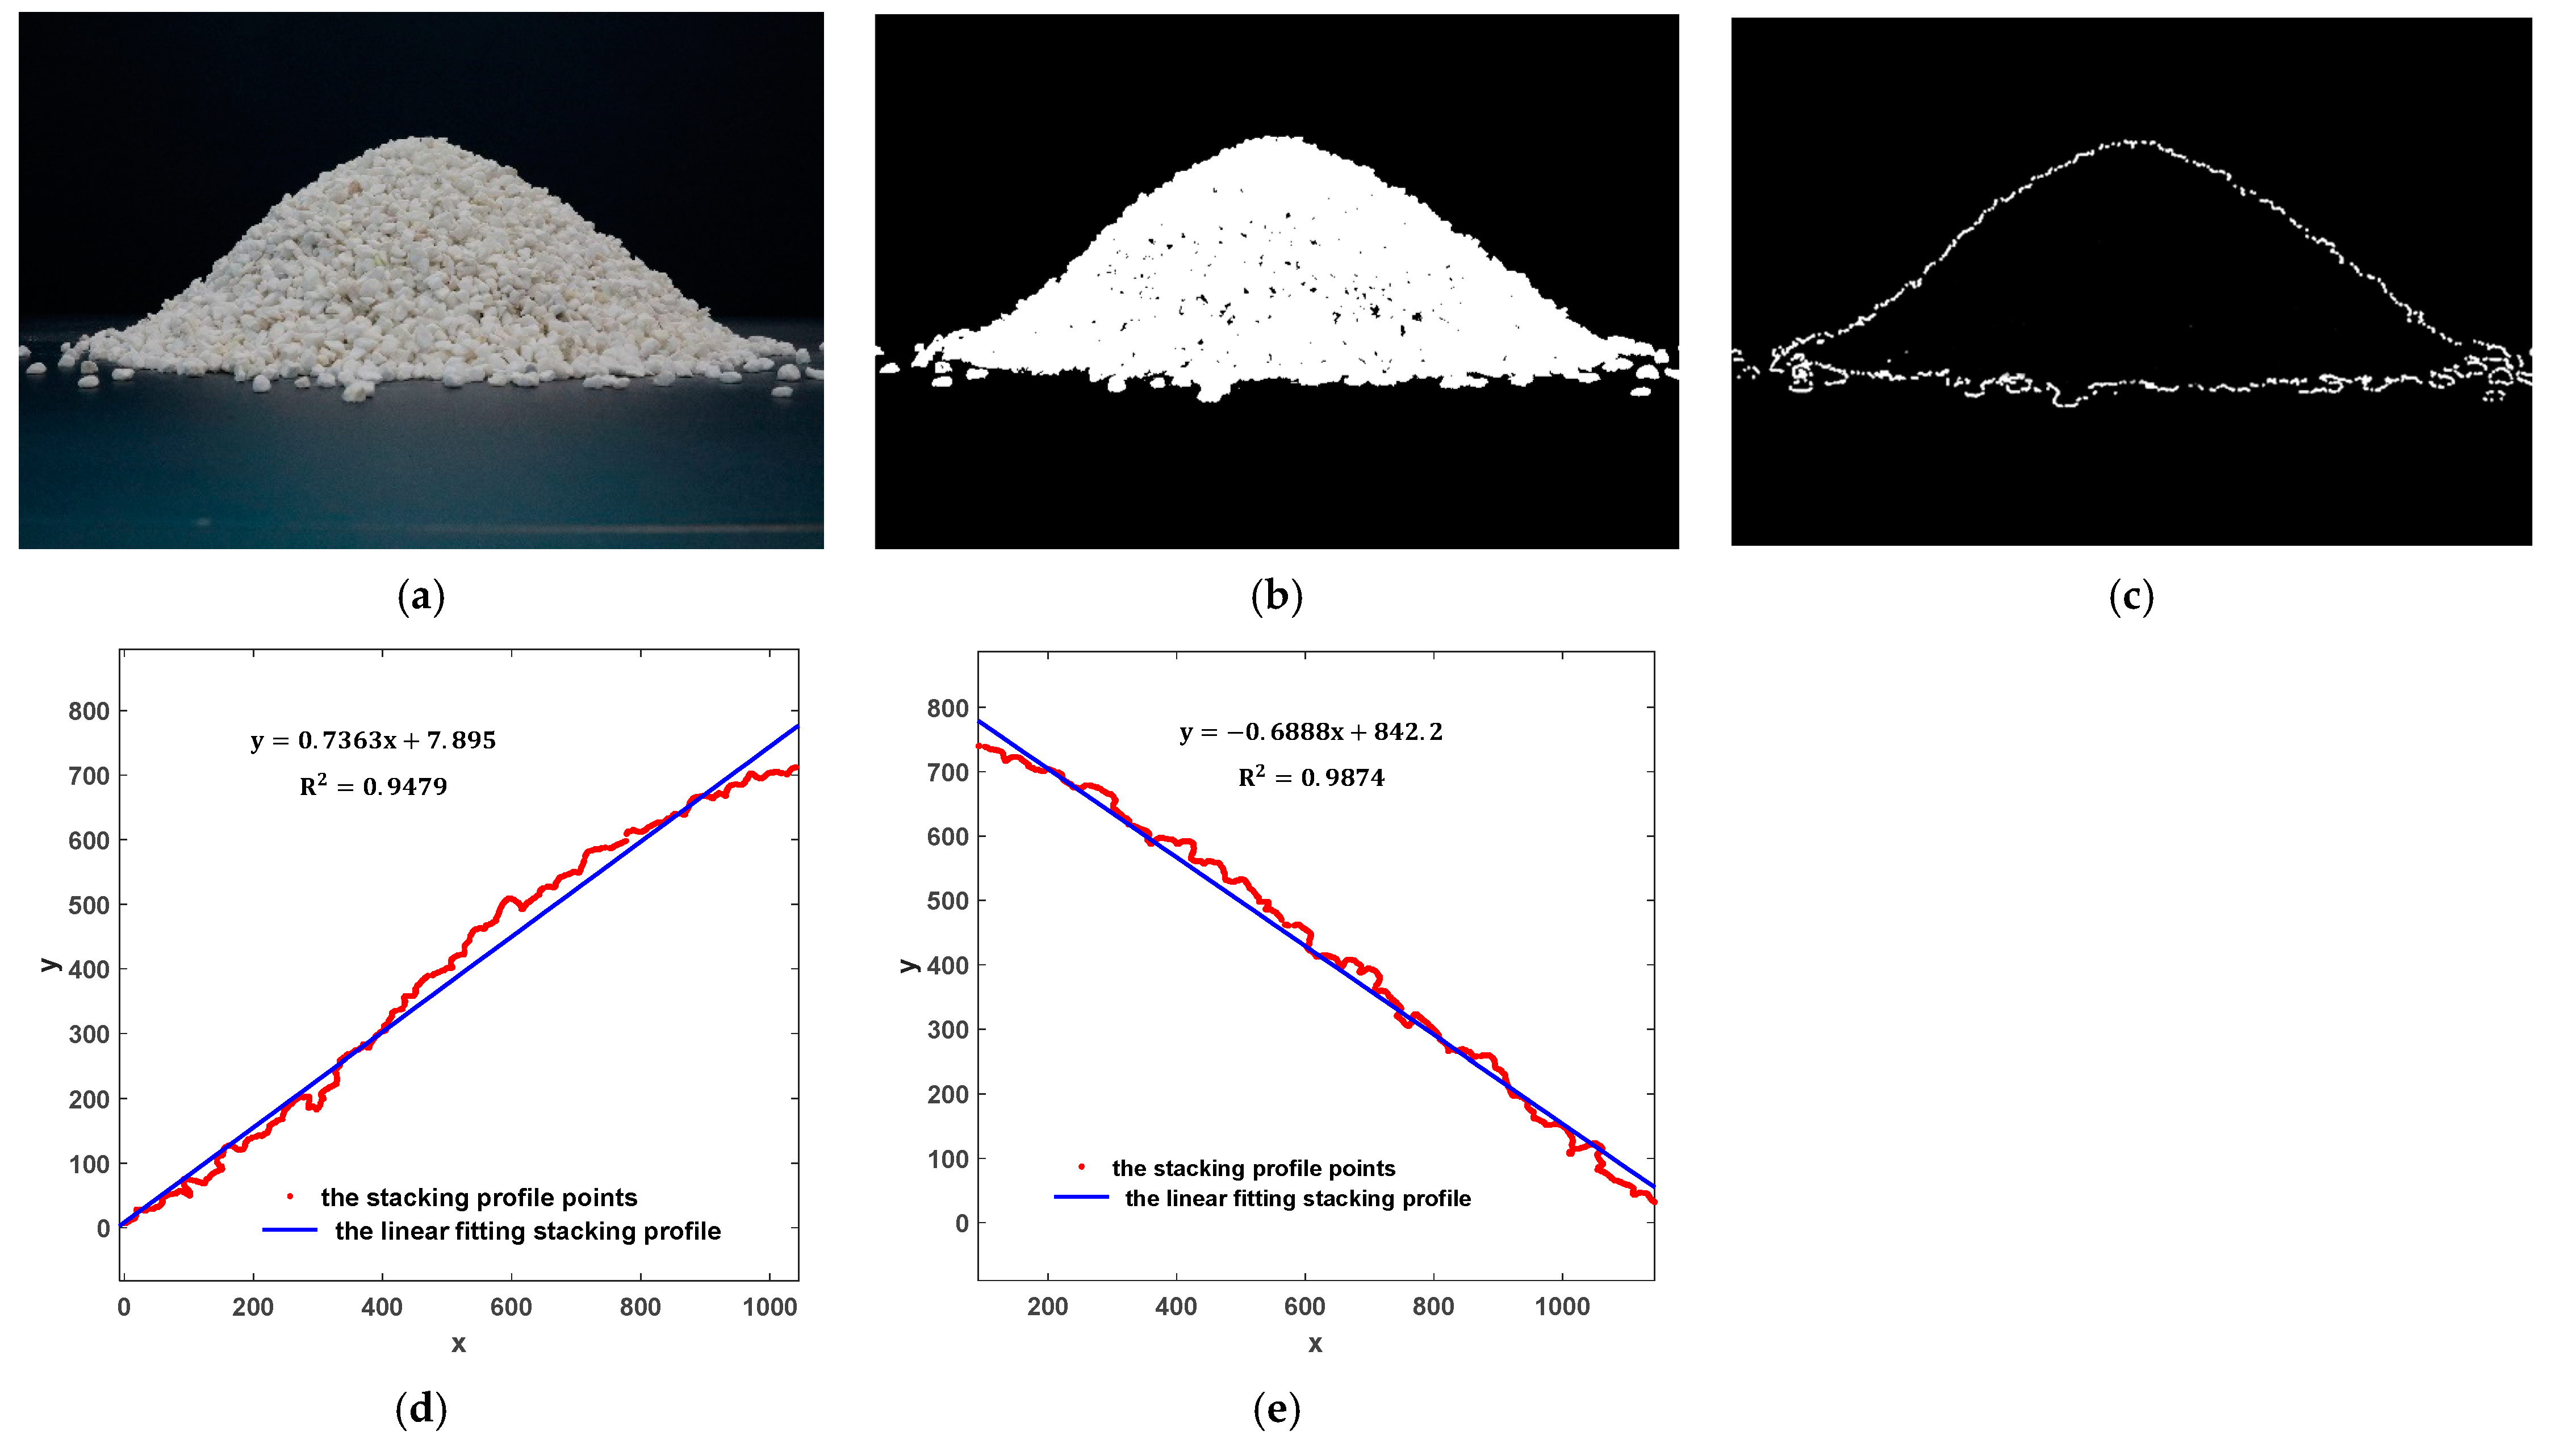
The experimental results of the repose angles of the five groups of materials are shown in Figure 9. The image processing method was used to calculate the angle of repose of the gravel material to reduce the error caused by manual measurement. The process of image data processing is shown in Figure 10. First, the heap image formed by particles leaking from the funnel was processed into grayscale images. Thereafter, the edge contour of the grey image was extracted using MATLAB software. Finally, the repose angles of both sides of the heap were obtained by linear fitting based on the least squares method. The results of the repose angles of the different materials obtained in the experiment are summarised in Table 4.
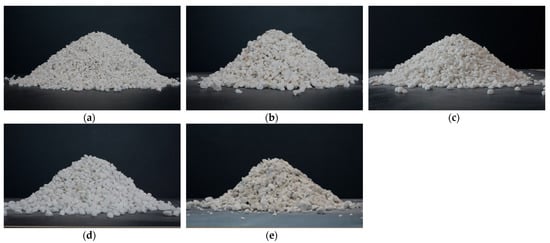
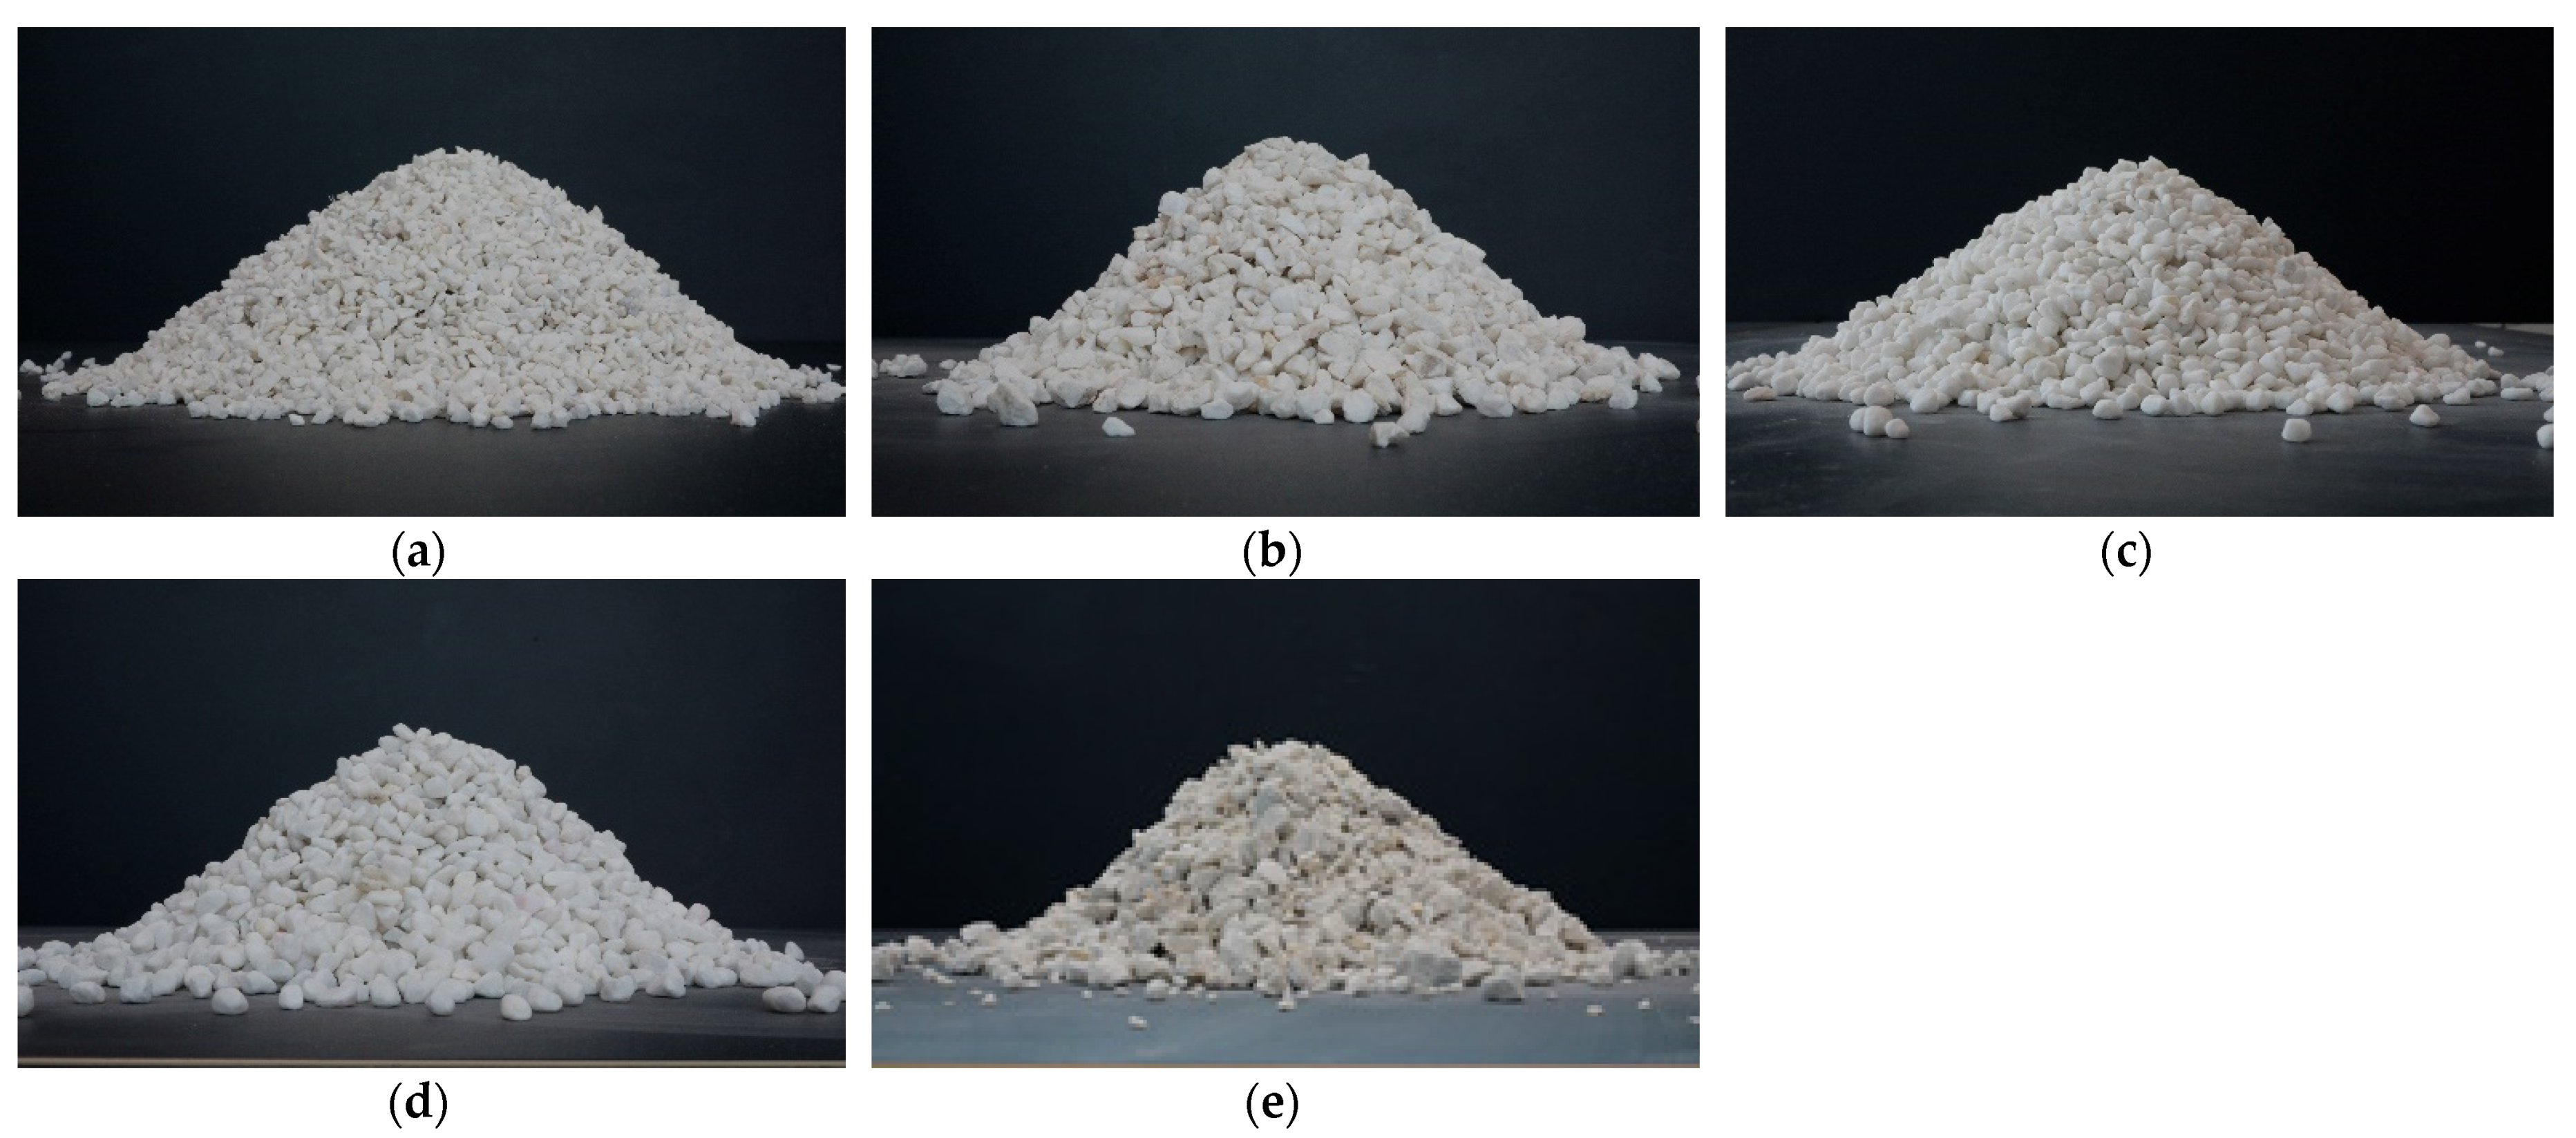
Figure 9.
Experimental results of repose angles of five groups of materials. (a) Material group 1. (b) Material group 2. (c) Material group 3. (d) Material group 4. (e) Material group 5.
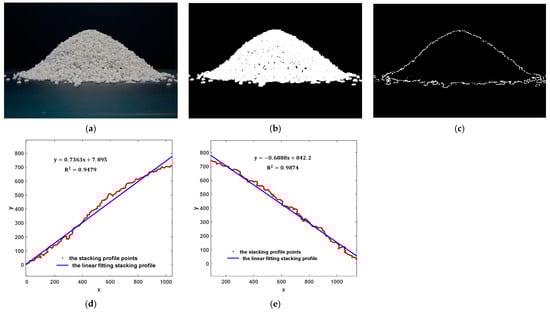
Figure 10.
Image data processing of the repose angle. (a) Original image. (b) Image binary progress. (c) Stacking profile. (d) Linear fitting stacking profile on the left. (e) Linear fitting stacking profile on the right.
Table 4.
Measurement results of repose angle of experimental materials.
3.3. Isolated Draw
As mentioned in Section 2.3.2, we could determine the relation between the coordinate of each marker and its corresponding mass drawn because each labelled marker corresponded to a coordinate in the physical model. Therefore, the IEZ shape was obtained by connecting the points that present the same mass drawn with a smooth curve. The experimental data obtained are summarised in Table 5, and Figure 11 shows the shape of the IEZ.
Table 5.
Results of isolated draw experiment.

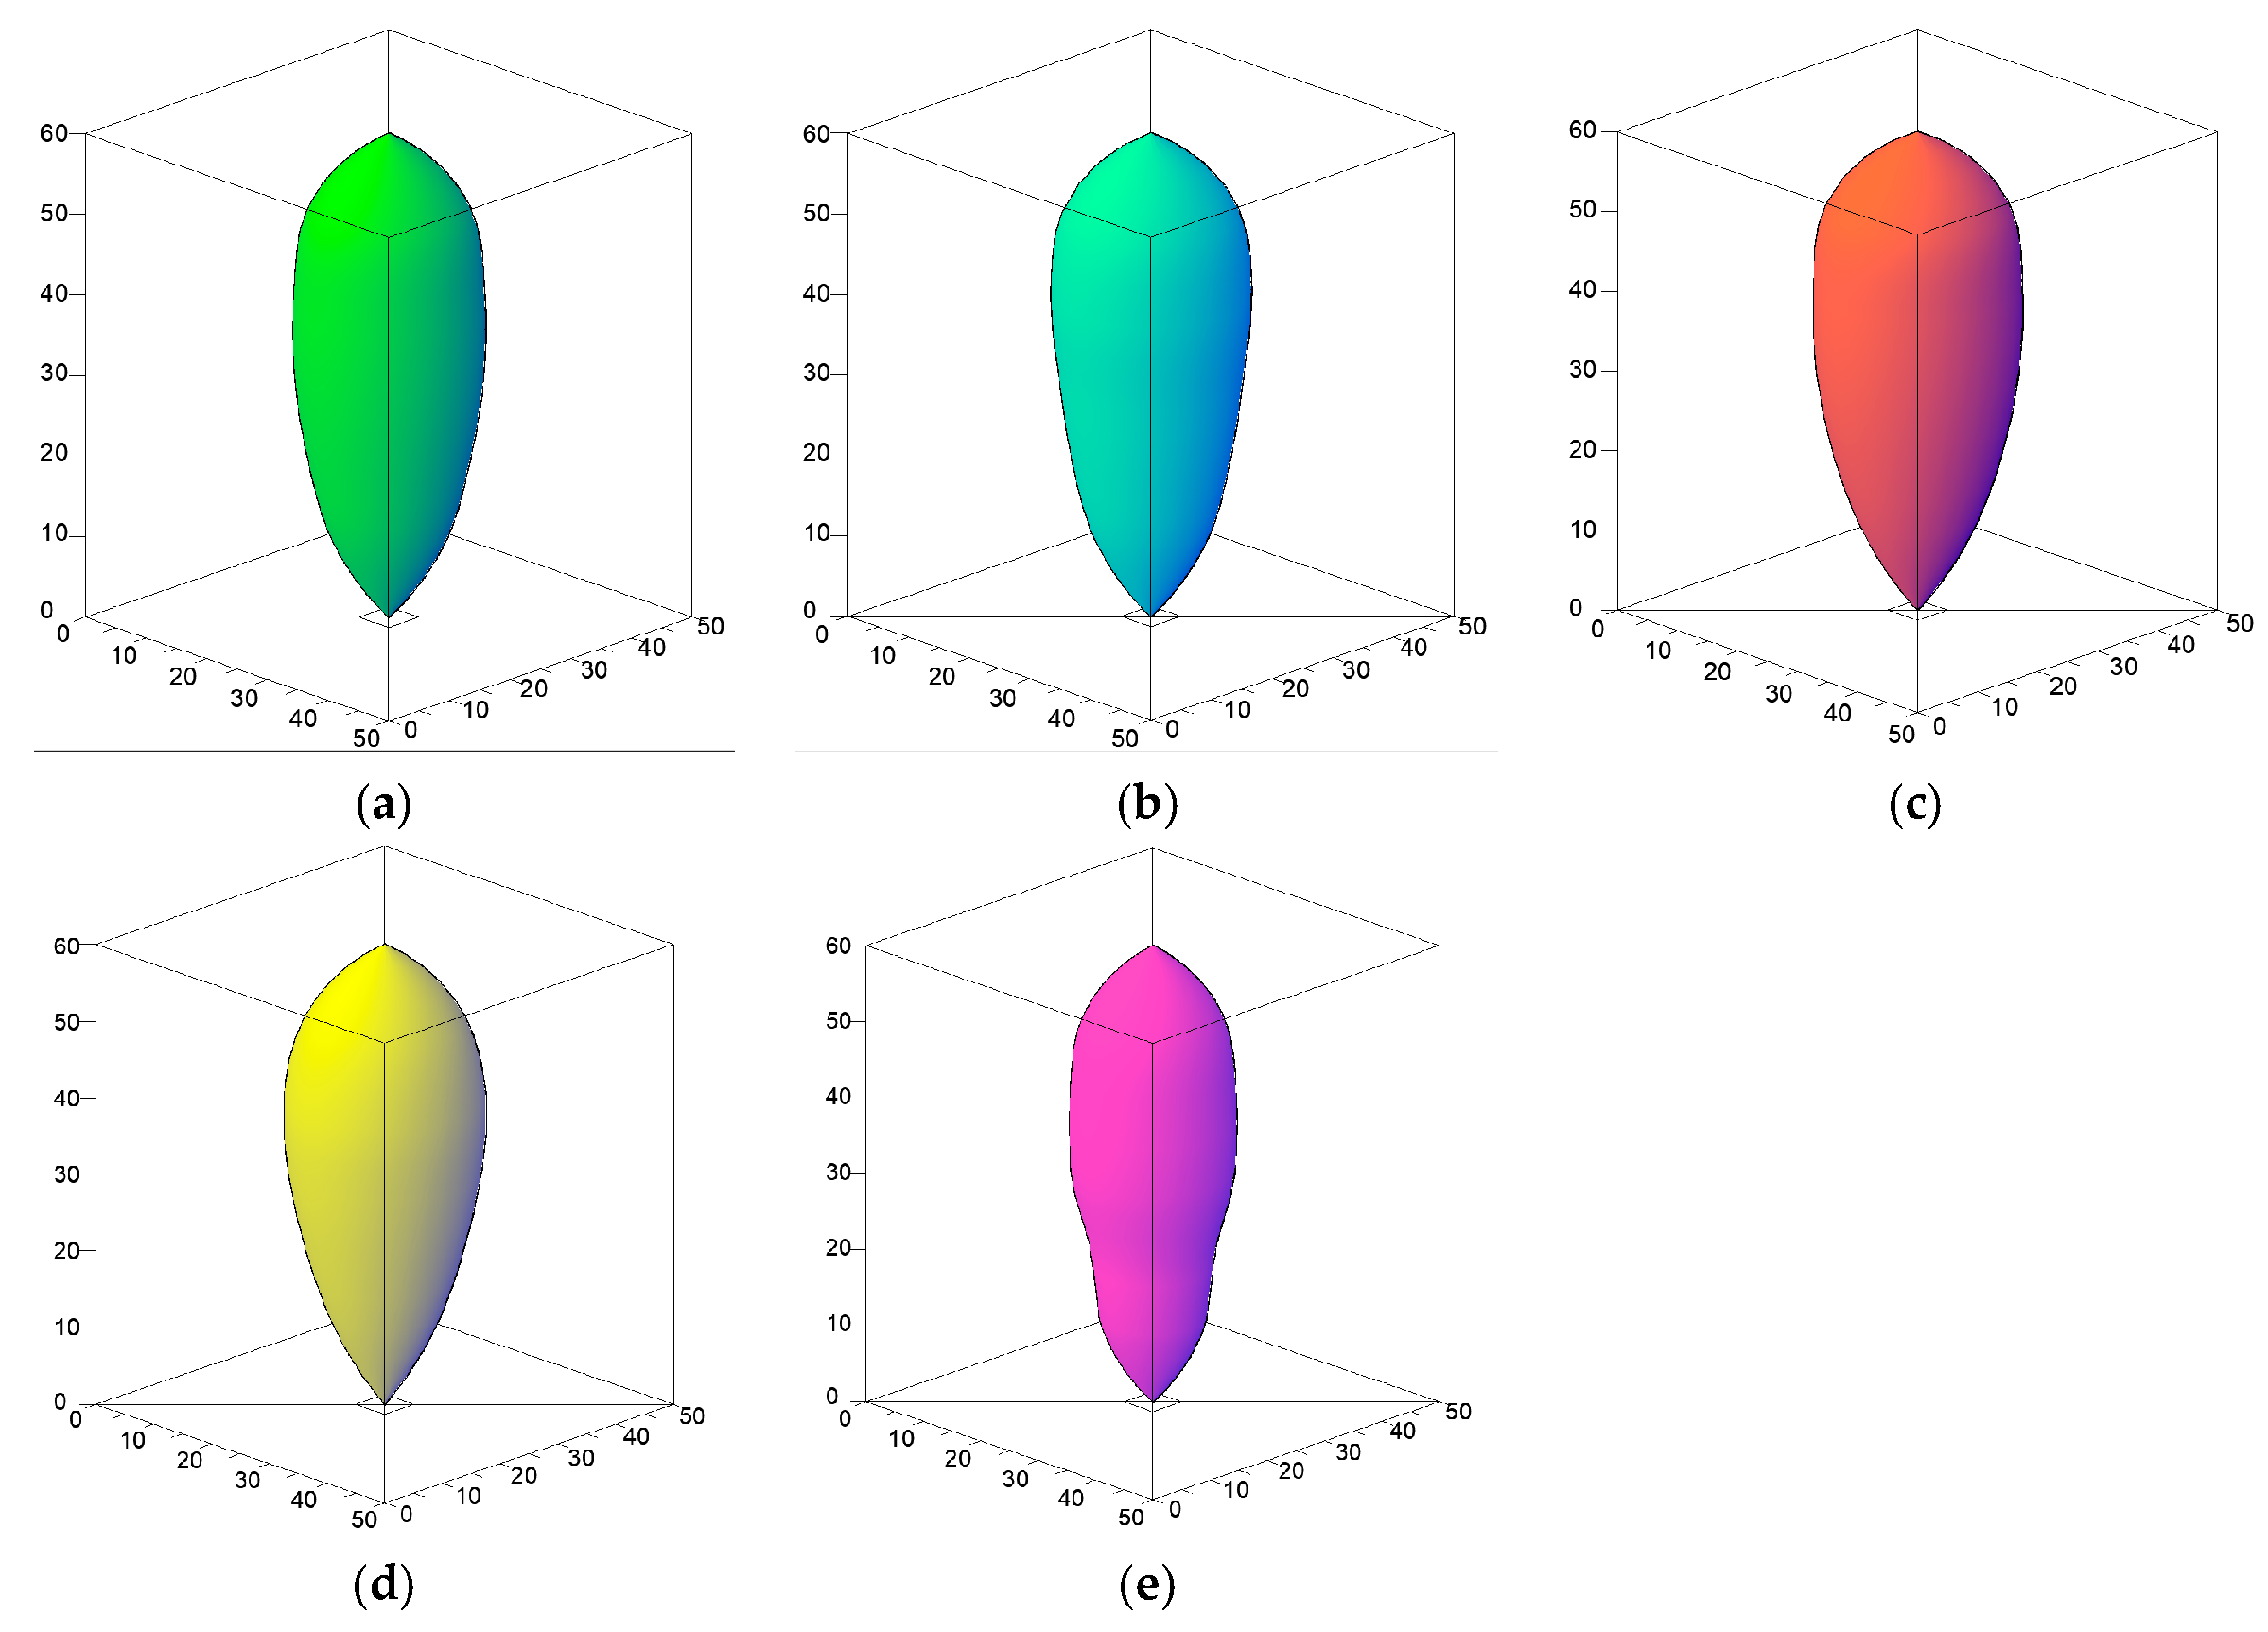
Figure 11.
Shapes of the IEZ using different materials. (a) Material group 1. (b) Material group 2. (c) Material group 3. (d) Material group 4. (e) Material group 5.
3.4. Analysis of Experimental Results
3.4.1. Qualitative Analysis
By comparing Figure 9a,c with Figure 9b,d, it can be observed that the stack formed by unpolished particles had a larger angle of repose, whereas the polished dolomite particles were more likely to slide because of the smoothness of the particle surface, finally forming a smaller angle of repose. By comparing Figure 9a,b with Figure 9c,d, it can be observed that the particle size had a slight effect on the angle of repose. Moreover, the surface undulation of the pile formed by larger particles was greater, whereas the side of the pile formed by smaller particles was smoother.
As shown in Figure 11c,d, the IEZ formed by the polished particles was wide at the top, narrow at the bottom, and presented an inverted water drop shape as a whole. However, the IEZ formed by unpolished particles was ellipsoidal, and the volume of the IEZ formed by the polished particles was larger than that formed by the unpolished particles. By comparing Figure 11a,b with Figure 11c,d, it can be observed that the particle size had a slight effect on the IEZ, and the volume of the IEZ formed by the smaller particles was larger than that formed by the larger particles.
Notably, the fifth group of materials was unpolished and contained larger particles, clearly visible in Figure 3e. Compared to the other groups of experimental results, as can be observed in Figure 9e and Figure 11e, the repose angle formed by the fifth group of materials was larger, the shape of the IEZ presented was irregular ellipsoidal, and the volume of the IEZ was smaller. This shows that the uneven distribution of particles had a negative effect on their flow performance.
3.4.2. Quantitative Analysis
IBM SPSS 28.0 software (SPSS Inc., Chicago, IL, USA) was used for the data analysis. It quantitatively described the influence of several parameters, such as morphology and size, on the flow performance of the particles. These parameters were considered the independent variables, and the repose angle and the IEZ mass were considered the dependent variables. The analysis process mainly included the following three steps: (1) screening out the independent variables impacting the dependent variable from numerous morphology parameters based on correlation analysis; (2) principal component analysis to solve the problem of collinearity between the independent variables and multiple independent variables converted into a few comprehensive indicators; and (3) linear regression to study the effect of composite indicators on the angle of repose and the mass of the IEZ.
First, a correlation analysis of the independent variables with the dependent variables was performed. In the isolated ore drawing experiment, approximately 0.5 tonnes of dolomite was used as the experimental material (in one experiment). This made obtaining a large number of sample data for analysis difficult. In this study, a total of 10 sets of experimental data were obtained. To reduce the error in the correlation analysis based on the limited samples, the bootstrap method was used. This method, proposed by Efron in 1979, was proven to be effective for small sample analyses [45]. The bootstrap method obtains a large number of subsamples by randomly sampling the original sample data with replacements and then calculates statistical estimates based on these subsamples. This process was performed in this study by using SPSS, and the number of subsamples was set to 1000. The correlation analysis results are summarised in Table 6.
Table 6.
Results of variable correlation analysis.
Based on the results in Table 6, it can be observed that the independent variables, such as diameter and ellipse ratio, had no significant correlation with the repose angle and drawn mass, implying that these parameters had no significant influence on the angle of repose and IEZ. This result is consistent with the experimental conclusion of Castro et al. [23]. In addition, the independent variables, such as sphericity, exhibited a statistically significant correlation with the repose angle and drawn mass, indicating that these parameters had significant effects on the angle of repose and IEZ.
The correlation analysis revealed multicollinearity among independent variables, indicating the information overlap between these parameters. To reduce the adverse effects of collinearity of independent variables, it was necessary to reduce the dimension of multiple parameters. According to the description of the three dimensions of particle shape mentioned in Section 2.1 and the definition method of the international standard ISO 9276-6, the aforementioned parameters with significant correlation are described as three comprehensive indicators. The three indicators are sphericity (S), to describe the macro morphology of particles, such as strips or circles; circularity (C), to describe the intensity of local changes of particles, such as sharp or smooth edges; and roughness (R), to describe the roughness of the particle surface. Notably, in the correlation analysis, the fractal dimension had no evident correlation with the repose angle or the IEZ mass. This indicates that the surface texture of the particles had no evident effect on their flow performance. Therefore, principal component analysis was used to obtain the aforementioned two comprehensive parameters. The specific classifications are listed in Table 7, and the comprehensive indicators scores obtained by principal component analysis are listed in Table 8.
Table 7.
Description and classification of particle morphology parameters.
Table 8.
The comprehensive indicators score.
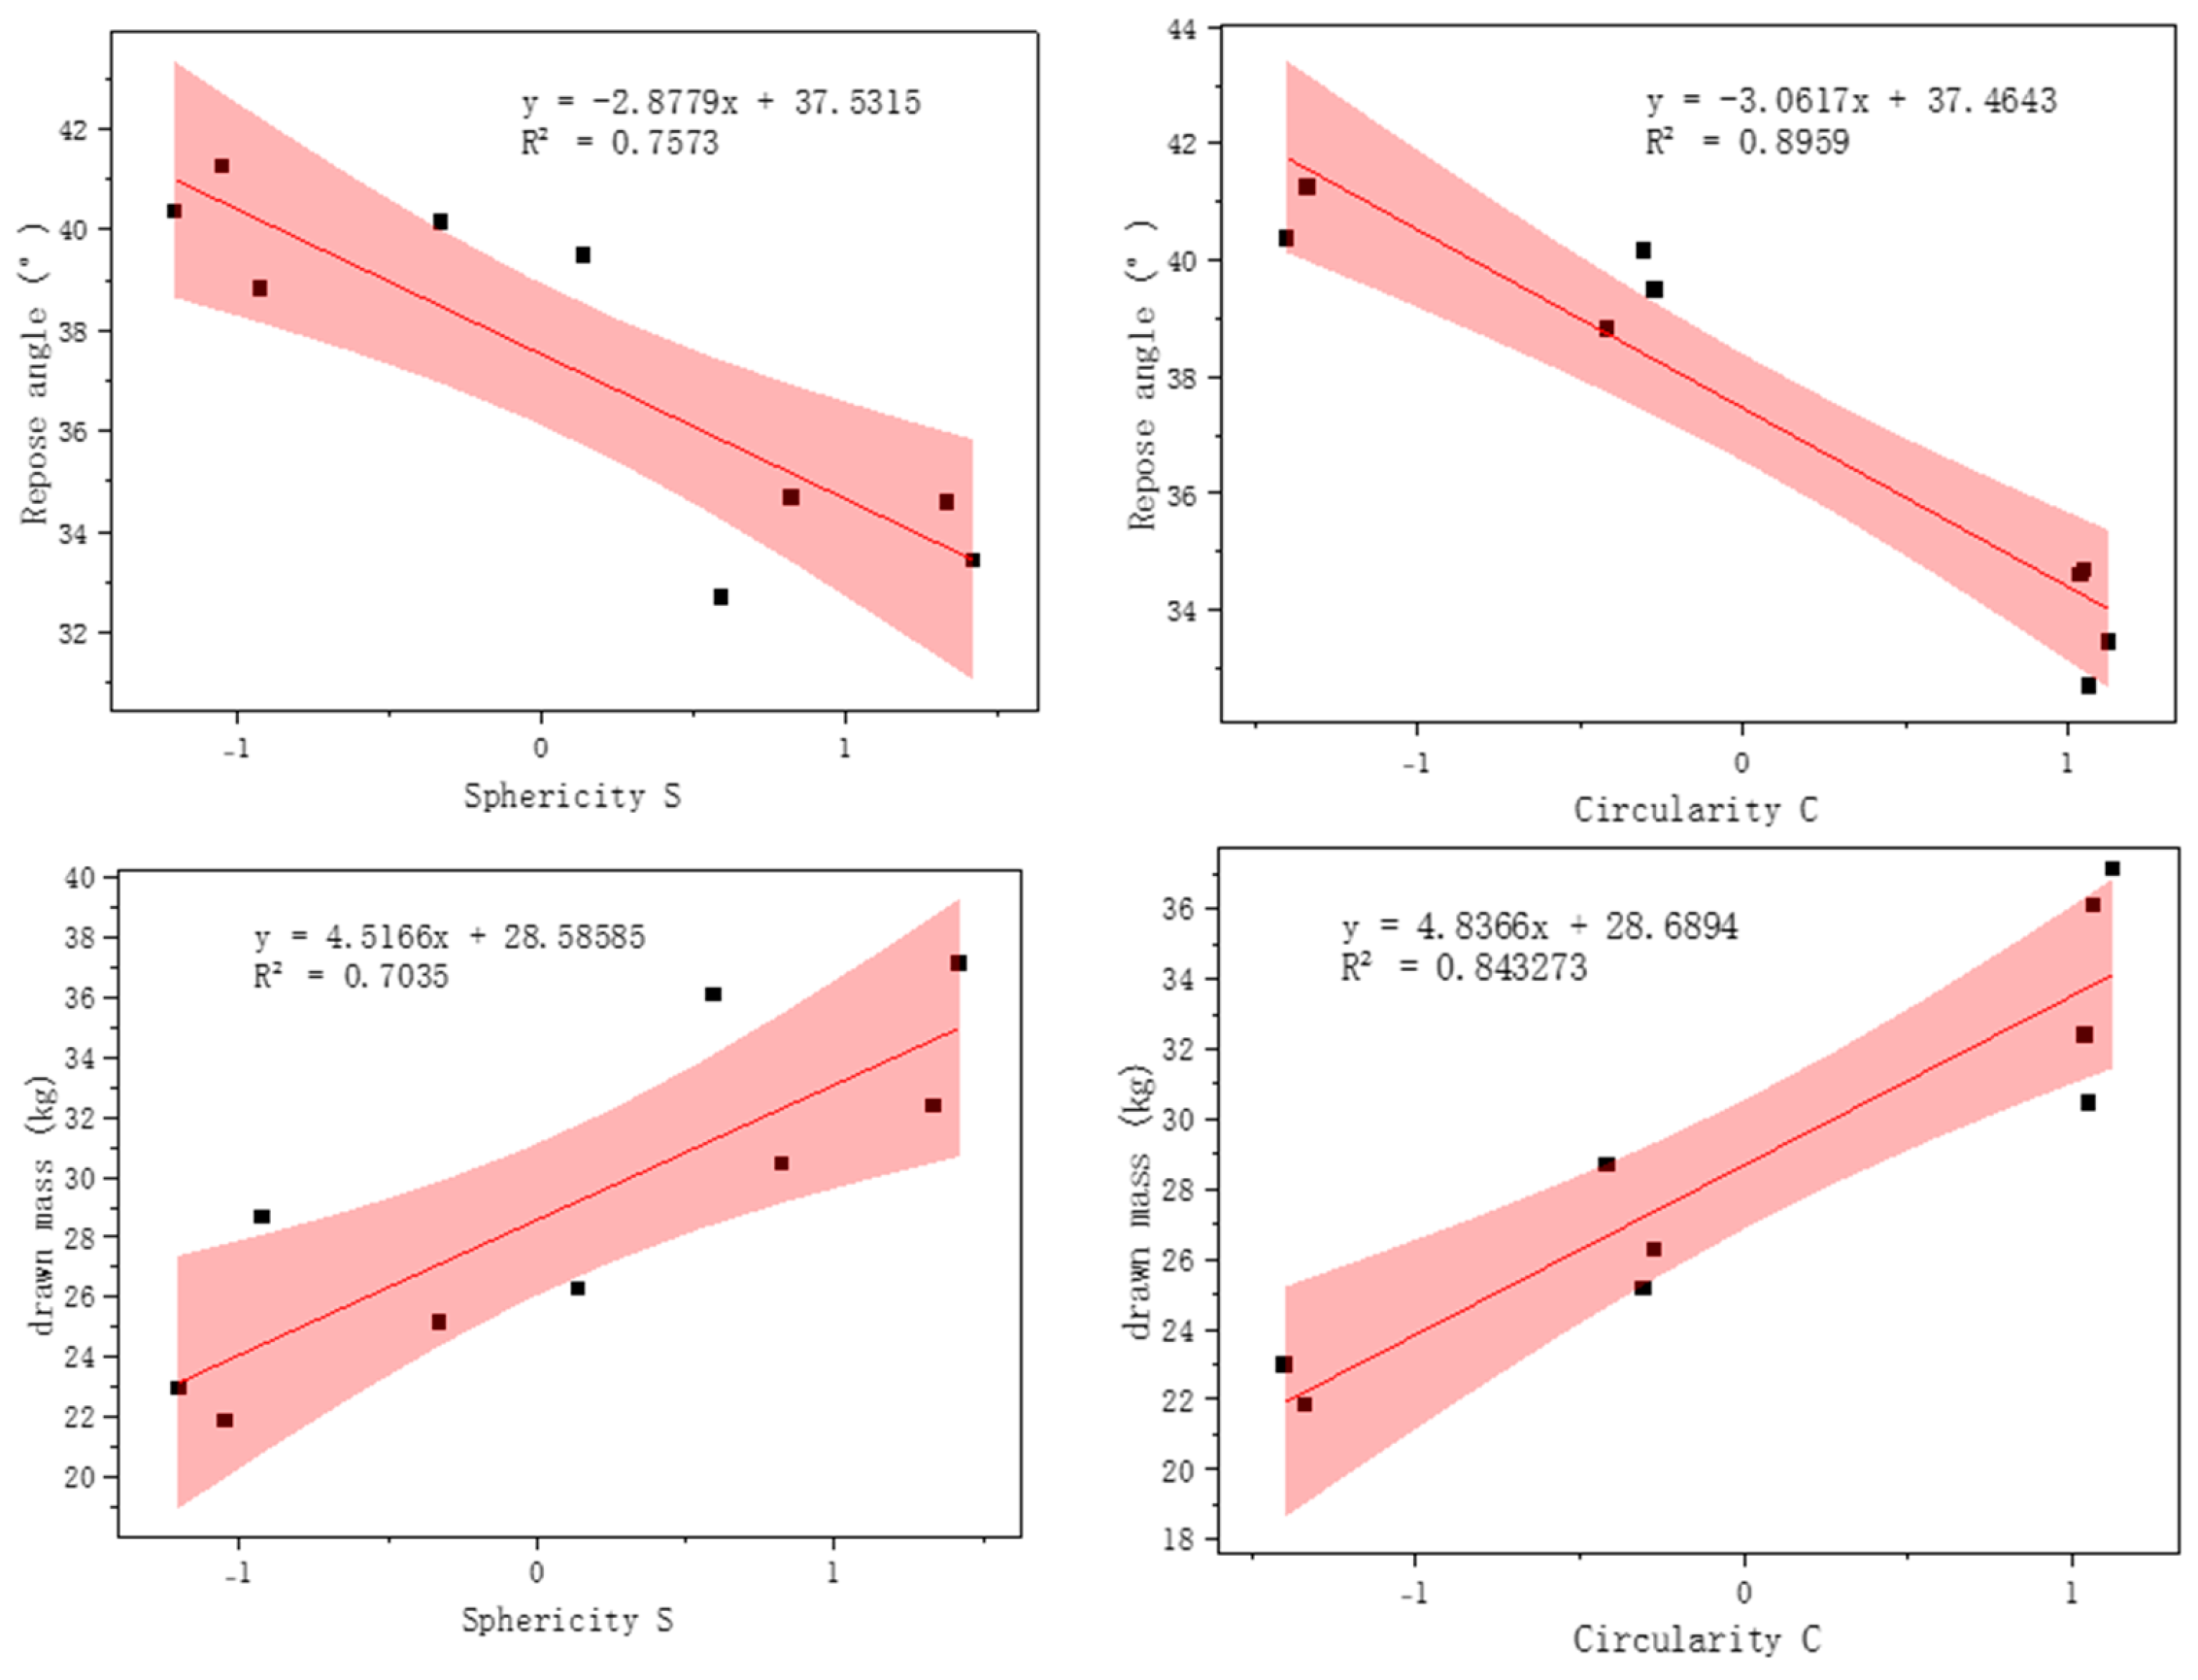
The aforementioned two comprehensive parameters were used to analyse the experimental results, and the scatter diagram is shown in Figure 12. It can be observed from Figure 12 that the relationship between sphericity, circularity and the angle of repose was linear. The angle of repose decreased with an increase in sphericity and circularity. Moreover, the influence of circularity on the angle of repose was greater than that of sphericity. Similarly, there was a linear relationship between the sphericity, circularity, and the mass drawn (IEZ). The mass drawn (IEZ) increased with an increase in sphericity and circularity. Circularity had a greater influence on the mass drawn than sphericity. In a word, circularity had a greater impact on the fluidity of the particles than sphericity, which indicates that the intensity of the local changes of the particles affected the fluidity more than the overall shape of the particles in the process of particle flow.
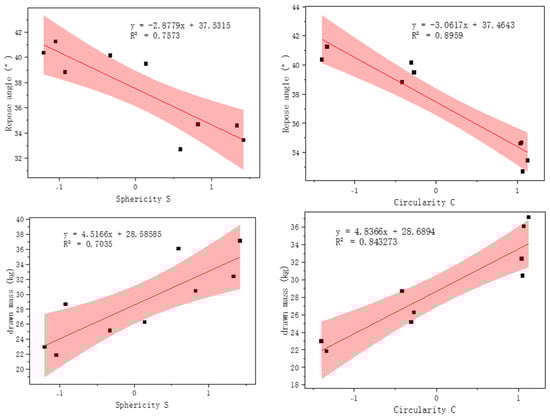
Figure 12.
Influence of the comprehensive parameters of particle shape on the experimental results.
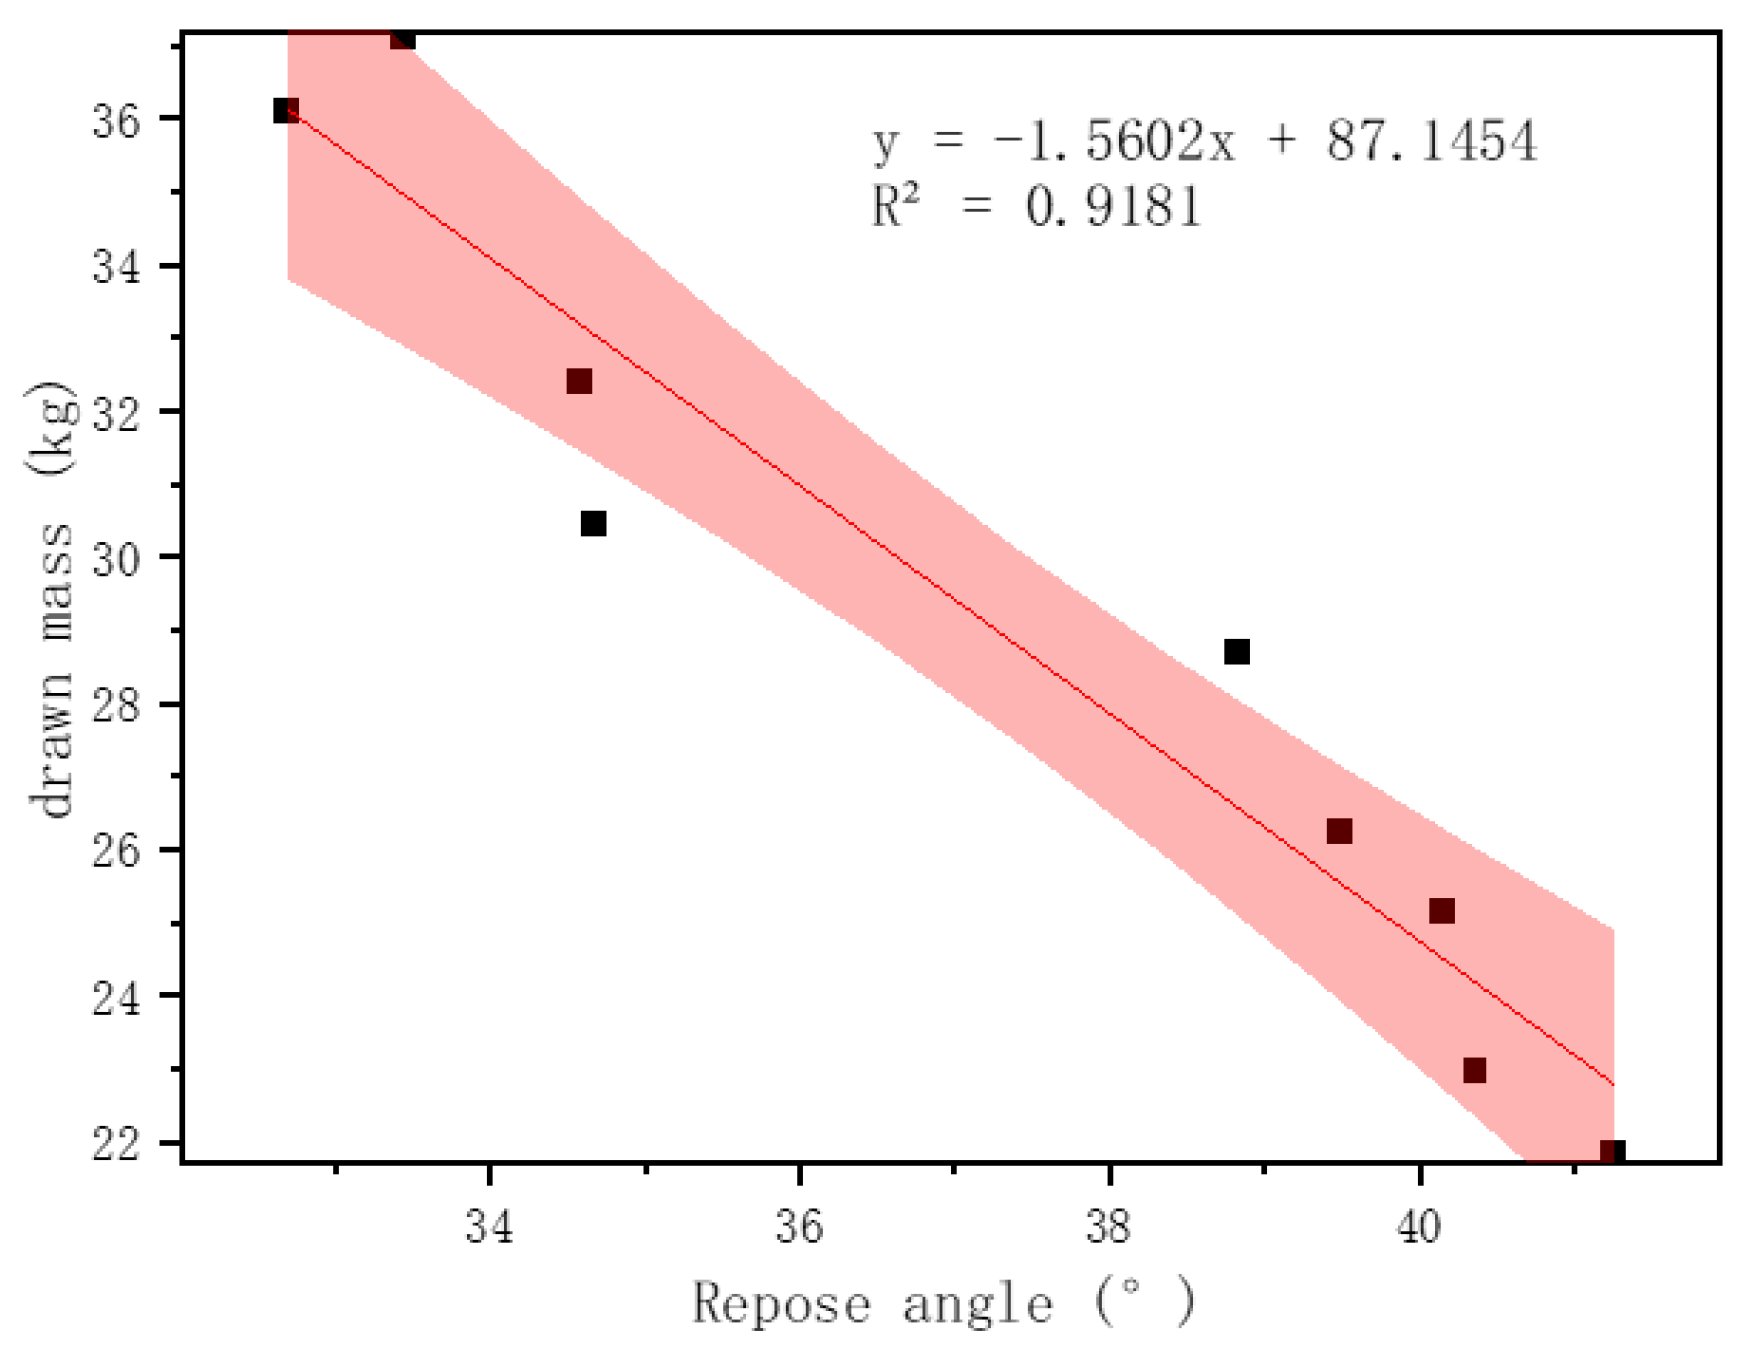
In the correlation analysis, a strong correlation was found between the repose angle and the IEZ mass. Therefore, a regression analysis, in which the angle of repose was used as an independent variable and the mass of the IEZ was used as a dependent variable, was performed. The results are shown in Figure 13. The IEZ mass decreased with an increase in the repose angle. A full-scale ore drawing experiment is an effective method to guide the design of stope structural parameters; however, the experimental process is extremely difficult. In comparison, it is much easier to measure the repose angle of the ore. Elucidating the relationship between the repose angle and the IEZ shape would be of tremendous significance. The results of this experiment can facilitate a preliminary analysis.
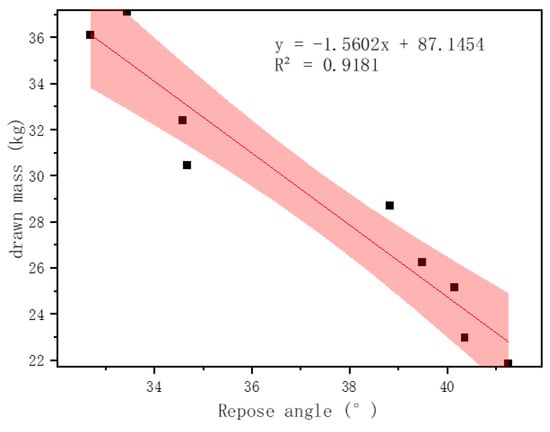
Figure 13.
Relationship between the repose angle and the mass of the IEZ.
4. Discussion
As shown in Figure 3e, presenting material group 5, the shape and size parameters were a mix of the other four groups; however, the nonuniformity coefficient was different. Additionally, it was discovered that the IEZ shape presented an irregular ellipsoidal and a smaller volume. In this section, a detailed analysis of the cause of this result is presented.
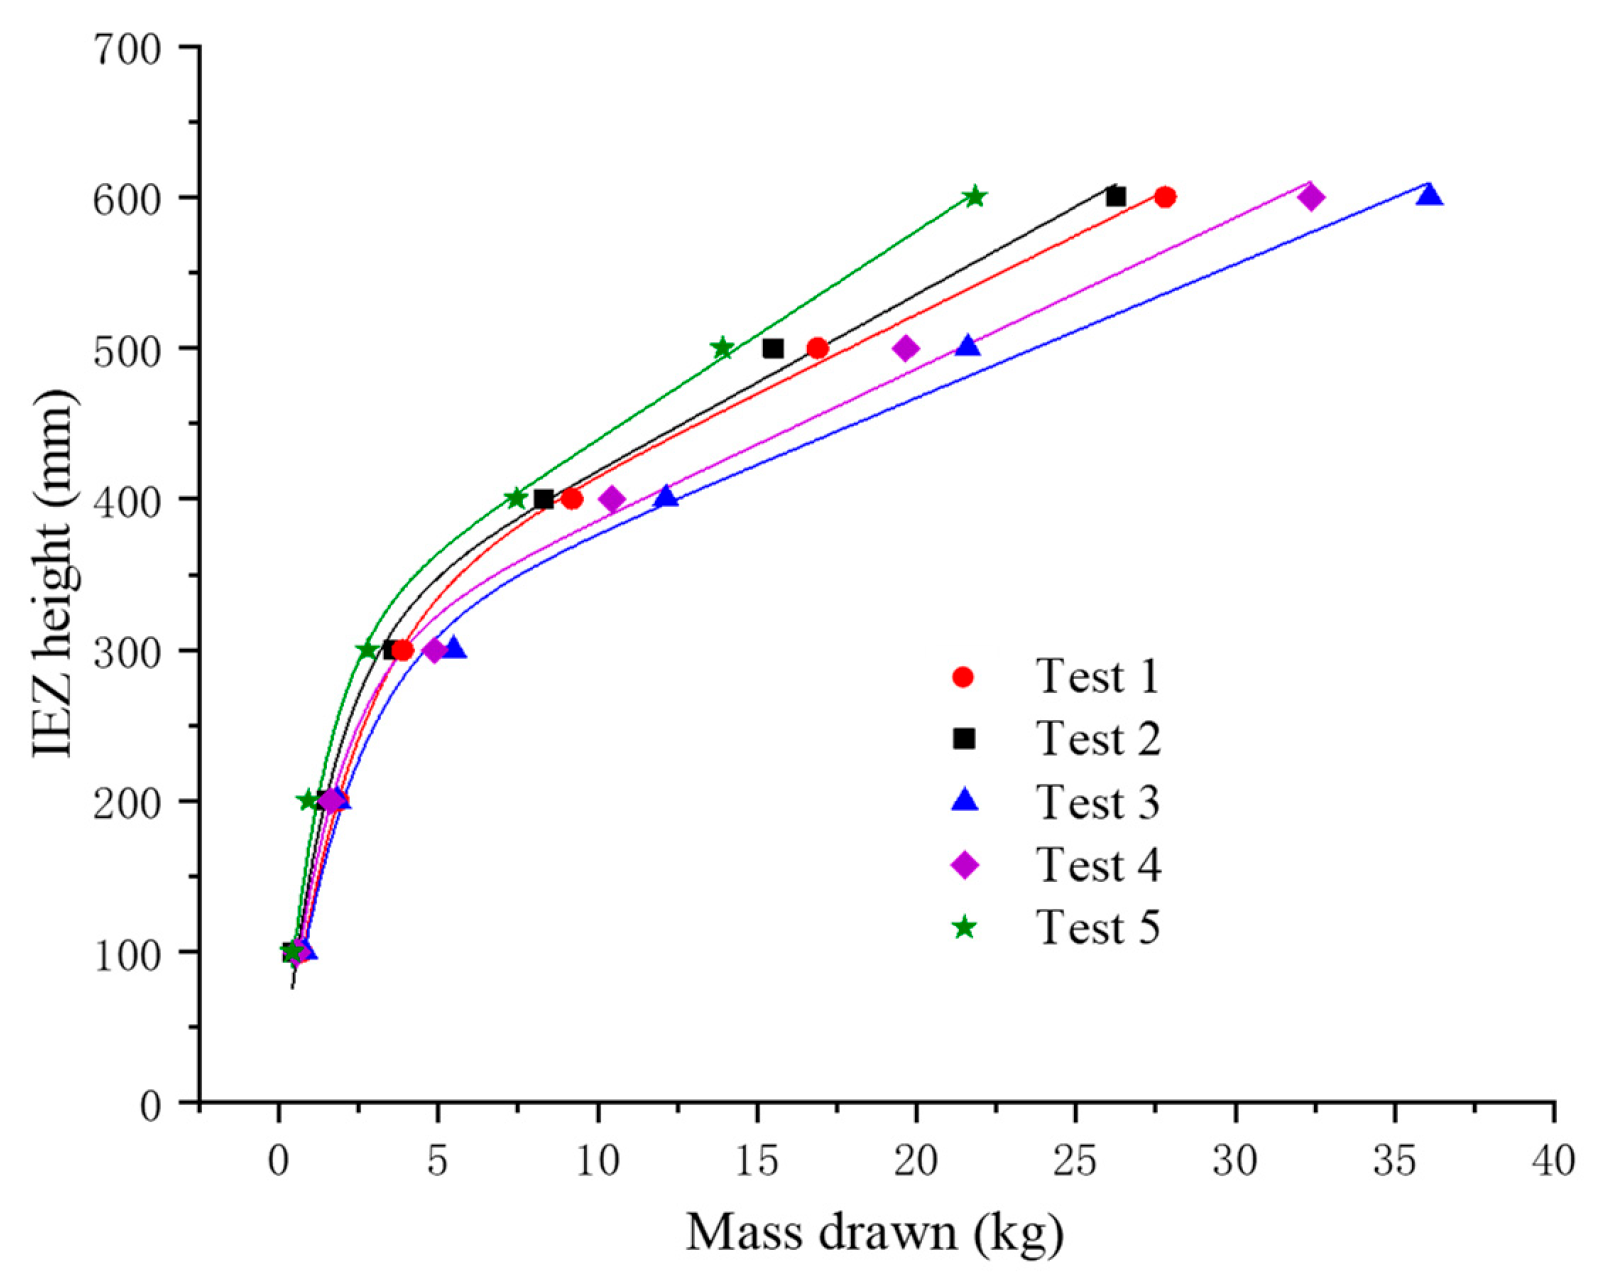
To verify the validity of the experimental results for the fifth group of materials from the isolated ore drawing experiment, the experimental data were introduced into the empirical equation proposed by Castro for verification. Castro [23] proved that the overall geometry of the IEZ is mainly controlled by the mass drawn. He proposed an equation to describe the relationship between the mass drawn and IEZ height as follows:
where and m denote the height and the mass of the IEZ, respectively; and denote the height and the mass drawn, respectively, where the IEZ height grows exponentially with the mass drawn; and represents the final rate of increase when the IEZ height increases linearly with the mass drawn.
By curve-fitting the IEZ height and corresponding mass drawn provided in Table 9 with Equation (1) via the non-linear Levenberg–Marquard algorithm [46], the values of , , and and the correlation coefficient (R2) for the isolated draw physical were determined as listed in Table 10. It can be observed that the correlation coefficients R2 are close to 1, indicating that the isolated extraction test can be characterised by Equation (1) efficiently and accurately.
Table 9.
IEZ height and the corresponding mass drawn.
Table 10.
Equation (1) parameters in isolated draw tests.
As shown in Figure 14, the verification results demonstrate that the five groups of isolated ore drawing experiments are consistent with the empirical Equation (1), thereby validating the experimental data. However, the plugging problem still occurred during the experiment, which is reflected in the shape of the IEZ in Figure 11e. As shown in Figure 11e, the IEZ corresponding to the fifth group of materials was smaller, and its lower transition was not sufficiently smooth. This indicates that the large particles in granular materials can easily cause problems of small particle seepage and blockage, which has a negative effect on the flow performance of granular materials.

Figure 14.
Relationship between the mass drawn and height of the IEZ.
During ore drawing by the caving method, overburden plays a critical role as a material to maintain the stability of the stope ground pressure. However, the loss of ore recovery and ore dilution caused by waste rock in the overburden cannot be ignored. These results demonstrate that the infiltration of small particles increases the dilution rate during ore recovery. Therefore, it is necessary to adjust the blasting parameters in practical engineering. This can ensure the rationality of overburdening the rock fragmentation to improve the ore recovery ratio. For example, the surrounding rock can be blasted to form the overburden with a smaller explosive density and larger blast-hole spacing than in the case of ore body blasting [47].
5. Conclusions
In this study, dolomite particles were used as an analogue to investigate the effect of fragments’ physical properties on the gravity flow behaviour of broken ore in cave mining. The particle shape, particle size, and particle size distribution of granular dolomite were measured, and their effects on the angle of repose and the IEZ of granular dolomite were explored thoroughly with funnel and isolated draw experiments. The following conclusions can be drawn.
- (1)
- The angle of repose decreased linearly with increases in particle sphericity and circularity. On the contrary, the mass of the IEZ increased linearly with increases in particle sphericity and circularity. The surface texture of the particles had no obvious effect on the repose angle and the mass of IEZ.
- (2)
- The particle size had an insubstantial effect on its angle of repose and IEZ, while its IEZ changed from an ellipsoidal shape to an inverted water drop shape and had a larger volume due to the expansion in the width direction with decreases in particle sphericity and circularity. In addition, its IEZ mass was inversely proportional to its angle of repose, as a larger angle of repose decreased the overall flowability and then reduced the number of particles drawn.
- (3)
- Compared to the group with concentratedly particle sizes, the IEZ obtained from the group with a wider particle size distribution (e.g., Group 5) had a non-uniform shape, smaller mass drawn, and average width. This is because the finer particles can percolate the voids among larger particles and arrive at the draw point soon, and the larger particles easily clog during the draw process.
This study demonstrates a linear correlation between the repose angle of the particles and the mass of the IEZ. However, an equation was not fitted because of the limited experimental samples. Moreover, this conclusion was obtained from small-scale physical experiments and must be verified via field experiments. In addition, compared to physical model experiments, it is easier to simulate particle flow by numerical simulation. Thus, DEM can be used to further study this topic.
Author Contributions
Methodology, L.W.; validation, H.J. and J.Y.; investigation, L.W.; resources, X.L.; writing—original draft preparation, L.W.; writing—review and editing, H.J., X.L and J.Y.; supervision, X.L. All authors have read and agreed to the published version of the manuscript.
Funding
This research was funded by the Research Fund of National Natural Science Foundation of China (Grant No.51674063).
Data Availability Statement
The Microsoft Excel Worksheet data used to support the findings ofthis study is available from the corresponding author (liuxiaobo@ustb.edu.cn) upon request.
Conflicts of Interest
The authors declare no conflict of interest.
References
- Jaeger, H.M.; Nagel, S.R.; Behringer, R.P. Granular solids, liquids, and gases. Rev. Mod. Phys. 1996, 68, 1259–1273. [Google Scholar] [CrossRef]
- Lu, K.Q.; Liu, J.X. Static and dynamic properties of granular matter (I). PHYSICS-BEIJING- 2004, 33, 629–635. [Google Scholar]
- Xue, Y.; Liu, J.; Ranjith, P.G.; Gao, F.; Zhang, Z.; Wang, S. Experimental investigation of mechanical properties, impact tendency, and brittleness characteristics of coal mass under different gas adsorption pressures. Geomech. Geophys. Geo-Energy Geo-Resour. 2022, 8, 1–20. [Google Scholar] [CrossRef]
- Duran, J. Sands, Powders, and Grains; Springer: New York, NY, USA, 2000. [Google Scholar]
- Kou, B.; Cao, Y.; Li, J.; Xia, C.; Li, Z.; Dong, H.; Zhang, A.; Zhang, J.; Kob, W.; Wang, Y. Granular materials flow like complex fluids. Nature 2017, 551, 360–363. [Google Scholar] [CrossRef] [PubMed]
- Al-Hashemi, H.M.B.; Al-Amoudi, O.S.B. A review on the angle of repose of granular materials. Powder Technol. 2018, 330, 397–417. [Google Scholar] [CrossRef]
- Lu, X.; Lin, J. Can we develop a general theory of the dynamics of turbulent flows and the motion of granular materials? Chin. Sci. Bull. 2017, 62, 1115–1118. [Google Scholar] [CrossRef]
- Nedderman, R.M. Statics and Kinematics of Granular Materials; Cambridge University Press: Cambridge, UK, 2005. [Google Scholar]
- Hamrin, H.; Hustrulid, W.; Bullock, R. Underground mining methods and applications. In Underground Mining Methods: Engineering Fundamentals and International Case Studies; SME: Markham, ON, Canada, 2001; pp. 3–14. [Google Scholar]
- Jia, Q.; Tao, G.; Liu, Y.; Wang, S. Laboratory study on three-dimensional characteristics of gravity flow during longitudinal sublevel caving. Int. J. Rock Mech. Min. Sci. 2021, 144, 104815. [Google Scholar] [CrossRef]
- Liu, S.D.; Zhou, Z.Y.; Zou, R.P.; Pinson, D.; Yu, A.B. Flow characteristics and discharge rate of ellipsoidal particles in a flat bottom hopper. Powder Technol. 2014, 253, 70–79. [Google Scholar] [CrossRef]
- Robinson, D.A.; Friedman, S.P. Observations of the effects of particle shape and particle size distribution on avalanching of granular media. Phys. A Stat. Mech. Its Appl. 2002, 311, 97–110. [Google Scholar] [CrossRef]
- Kruggel-Emden, H.; Rickelt, S.; Wirtz, S.; Scherer, V. A study on the validity of the multi-sphere Discrete Element Method. Powder Technol. 2008, 188, 153–165. [Google Scholar] [CrossRef]
- Favier, J.F.; Abbaspour-Fard, M.H.; Kremmer, M.; Raji, A.O. Shape representation of axi-symmetrical, non-spherical particles in discrete element simulation using multi-element model particles. Eng. Comput. 1999, 16, 467–480. [Google Scholar] [CrossRef]
- Vu-Quoc, L.; Zhang, X.; Walton, O.R. A 3-D discrete-element method for dry granular flows of ellipsoidal particles. Comput. Methods Appl. Mech. Eng. 2000, 187, 483–528. [Google Scholar] [CrossRef]
- Wiącek, J.; Molenda, M.; Horabik, J.; Ooi, J.Y. Influence of grain shape and intergranular friction on material behavior in uniaxial compression: Experimental and DEM modeling. Powder Technol. 2012, 217, 435–442. [Google Scholar] [CrossRef]
- González-Montellano, C.; Gallego, E.; Ramírez-Gómez, Á.; Ayuga, F. Three dimensional discrete element models for simulating the filling and emptying of silos: Analysis of numerical results. Comput. Chem. Eng. 2012, 40, 22–32. [Google Scholar] [CrossRef]
- Markauskas, D.; Kačianauskas, R. Investigation of rice grain flow by multi-sphere particle model with rolling resistance. Granul. Matter 2011, 13, 143–148. [Google Scholar] [CrossRef]
- Boac, J.M.; Casada, M.E.; Maghirang, R.G.; Harner, J.P. Material and interaction properties of selected grains and oilseeds for modeling discrete particles. Trans. ASABE 2010, 53, 1201–1216. [Google Scholar] [CrossRef]
- Weigler, F.; Mellmann, J. Investigation of grain mass flow in a mixed flow dryer. Particuology 2014, 12, 33–39. [Google Scholar] [CrossRef]
- Cleary, P.W.; Sawley, M.L. DEM modelling of industrial granular flows: 3D case studies and the effect of particle shape on hopper discharge. Appl. Math. Model. 2002, 26, 89–111. [Google Scholar] [CrossRef]
- Höhner, D.; Wirtz, S.; Scherer, V. A study on the influence of particle shape on the mechanical interactions of granular media in a hopper using the Discrete Element Method. Powder Technol. 2015, 278, 286–305. [Google Scholar] [CrossRef]
- Castro, R.; Trueman, R.; Halim, A. A study of isolated draw zones in block caving mines by means of a large 3D physical modell. Int. J. Rock Mech. Min. Sci. 2007, 44, 860–870. [Google Scholar] [CrossRef]
- Jin, A.B.; Sun, H.; Ma, G.W.; Gao, Y.T.; Wu, S.C.; Meng, X.Q. A study on the draw laws of caved ore and rock using the discrete element method. Comput. Geotech. 2016, 80, 59–70. [Google Scholar] [CrossRef]
- Power, G.R. Modelling Granular Flow in Caving Mines: Large Scale Physical Modelling and Full Scale Experiments. Ph.D. Thesis, The University of Queensland, Brisbane, Australia, March 2004. [Google Scholar]
- Wang, J.; Wei, W.; Zhang, J. Effect of the size distribution of granular top coal on the drawing mechanism in LTCC. Granul. Matter 2019, 21, 1–18. [Google Scholar] [CrossRef]
- Castro, R.; Arancibia, L.; Gómez, R. Quantifying fines migration in block caving through 3D experiments. Int. J. Rock Mech. Min. Sci. 2022, 151, 105033. [Google Scholar] [CrossRef]
- Castro, R.; Gómez, R.; Arancibia, L. Fine material migration modelled by cellular automata. Granul. Matter 2022, 24, 1–11. [Google Scholar] [CrossRef]
- Pierce, M.E. A Model for Gravity Flow of Fragmented Rock in Block Caving Mines. Ph.D. Thesis, The University of Queensland, Brisbane, Australia, September 2010. [Google Scholar]
- Sun, H.; Gao, Y.; Elmo, D.; Jin, A.; Wu, S.; Dorador, L. A Study of Gravity Flow Based on the Upside-Down Drop Shape Theory and Considering Rock Shape and Breakage. Rock Mech. Rock Eng. 2019, 52, 881–893. [Google Scholar] [CrossRef]
- Lapčević, V.; Torbica, S. Numerical investigation of caved rock mass friction and fragmentation change influence on gravity flow formation in sublevel caving. Minerals 2017, 7, 56. [Google Scholar] [CrossRef]
- Song, Z.Y.; Wei, W.J.; Zhang, J.W. Numerical investigation of effect of particle shape on isolated extracted zone (IEZ) in block caving. Arab. J. Geosci. 2018, 11, 15. [Google Scholar] [CrossRef]
- Wensrich, C.M.; Katterfeld, A. Rolling friction as a technique for modelling particle shape in DEM. Powder Technol. 2012, 217, 409–417. [Google Scholar] [CrossRef]
- Sun, H.; Jin, A.B.; Elmo, D.; Gao, Y.T.; Wu, S.C. A Numerical Based Approach to Calculate Ore Dilution Rates Using Rolling Resistance Model and Upside-Down Drop Shape Theory. Rock Mech. Rock Eng. 2020, 53, 4639–4652. [Google Scholar] [CrossRef]
- Bowman, E.T.; Soga, K.; Drummond, W. Particle shape characterisation using Fourier descriptor analysis. Geotechnique 2001, 51, 545–554. [Google Scholar] [CrossRef]
- Yang, H.; Xu, Z.; Cheng, Y. Multi-Morphological Characteristics of a Crushed Granitic Rock of Varying Sizes. Minerals 2022, 12, 522. [Google Scholar] [CrossRef]
- Cho, G.C.; Dodds, J.; Santamarina, J.C. Particle shape effects on packing density, stiffness, and strength: Natural and crushed sands. J. Geotech. Geoenviron. Eng. 2006, 132, 591–602. [Google Scholar] [CrossRef]
- Altuhafi, F.N.; Coop, M.R.; Georgiannou, V.N. Effect of Particle Shape on the Mechanical Behavior of Natural Sands. J. Geotech. Geoenviron. Eng. 2016, 142, 15. [Google Scholar] [CrossRef]
- ISO 9276-6:2008; Representation of Results of Particle Size Analysis—Part 6: Descriptive and Quantitative Representation of Particle Shape and Morphology. ISO Copyright Office: Geneva, Switzerland, 2008.
- Wójcik, A.; Klapa, P.; Mitka, B.; Piech, I. The use of TLS and UAV methods for measurement of the repose angle of granular materials in terrain conditions. Measurement 2019, 146, 780–791. [Google Scholar] [CrossRef]
- Xia, R.; Li, B.; Wang, X.; Li, T.; Yang, Z. Measurement and calibration of the discrete element parameters of wet bulk coal. Measurement 2019, 142, 84–95. [Google Scholar] [CrossRef]
- Wójcik, A.; Klapa, P.; Mitka, B.; Sładek, J. The use of the photogrammetric method for measurement of the repose angle of granular materials. Measurement 2018, 115, 19–26. [Google Scholar] [CrossRef]
- Zhang, X.F.; Tao, G.Q.; Zhu, Z.H. Laboratory study of the influence of dip and ore width on gravity flow during longitudinal sublevel caving. Int. J. Rock Mech. Min. Sci. 2018, 103, 179–185. [Google Scholar] [CrossRef]
- Castro, R. Study of the Mechanisms of Granular Flow for Block Caving. Ph.D. Thesis, The University of Queensland, Brisbane, Australia, 2006. [Google Scholar]
- Efron, B.; Tibshirani, R.J. An Introduction to the Bootstrap; CRC press: Boca Raton, FL, USA, 1994. [Google Scholar]
- Gavin, H.P. The Levenberg-Marquardt algorithm for nonlinear least squares curve-fitting problems; Department of Civil and Environmental Engineering, Duke University: Durham, NC, USA, 2019; Volume 19. [Google Scholar]
- Brunton, I. The Impact of Blasting on Sublevel Caving Material Flow Behaviour and Recovery. Ph.D. Thesis, The University of Queensland, Brisbane, Australia, 2009. [Google Scholar]
Publisher’s Note: MDPI stays neutral with regard to jurisdictional claims in published maps and institutional affiliations. |
© 2022 by the authors. Licensee MDPI, Basel, Switzerland. This article is an open access article distributed under the terms and conditions of the Creative Commons Attribution (CC BY) license (https://creativecommons.org/licenses/by/4.0/).