Article

Thermal Decrepitation and Thermally-Induced Cracking of Limestone Used in Quicklime Production

1
Centre for Sustainable Cement and Quicklime Production, Department of Applied Physics and Electronics, Umeå University, SE-901 87 Umeå, Sweden
2
Thermochemical Energy Conversion Laboratory, Department of Applied Physics and Electronics, Umeå University, SE-901 87 Umeå, Sweden
3
Industrial Doctoral School for Research and Innovation, Umeå University, SE-901 87 Umeå, Sweden
4
SMA Mineral Oy, Selleenkatu 281, FI-95459 Tornio, Finland
5
Nordkalk Oy Ab, Skräbbölevägen 18, FI-21600 Pargas, Finland
6
Swedish Mineral Processing Research Association MinFo, c/o Cementa, SE-100 74 Stockholm, Sweden
*
Author to whom correspondence should be addressed.
Minerals 2022, 12(10), 1197; https://doi.org/10.3390/min12101197
Submission received: 16 August 2022 / Revised: 19 September 2022 / Accepted: 20 September 2022 / Published: 23 September 2022

Abstract

:
To produce quicklime, high calcium carbonate rocks, including limestone, are burned in industrial kilns at 1100–1450 °C. As a consequence of the high temperatures, the carbonate rock can break and decrepitate into fine material, causing operational problems and material losses. In the present paper, an industrial case study on thermal decrepitation was performed on Boda Limestone from the Jutjärn quarry in Dalarna, Sweden. We analyzed 80 limestone samples for thermal decrepitation; furthermore, the correlation with chemical composition was statistically analyzed. The experiments were complemented by a detailed analysis of thermally-induced cracking at a range of temperatures (ambient, 500 °C, 800 °C, and 1150 °C) for two limestone samples with similar chemical compositions but with very different decrepitation behaviors. Decrepitation was analyzed by an in-house method, the chemical composition by XRF, and the thermally-induced cracking was investigated by SEM and image analysis. No strong correlation was found between thermal decrepitation and the chemical composition of the limestone. For the sample with low thermal decrepitation, a dense narrow network of fractures was found after full calcination; however, this network was not observed in the sample with high thermal decrepitation. A plausible explanation for the different decrepitation behaviors is that this fracture network releases internal stress and stabilizes the calcined rock. The obtained results can help in predicting limestone thermal decrepitation, enabling increased resource efficiency in quicklime production.

1. Introduction

Limestone is a sedimentary rock widely used as a raw material for quicklime and steel production, and also as a component in desulfurization and as a fluxing agent [1]. Limestone is mainly composed of calcium carbonate with varying amounts of impurities [2]. In an industrial lime kiln, limestone is burned at temperatures of 1100–1450 °C, producing a quicklime product and emitting carbon dioxide according to reaction 1:
C a C O 3   s     C a O   s + C O 2   g     Δ H = + 177.8   kJ / mol
During the above calcination reaction, limestone can be subjected to thermal decrepitation (TD). It is of critical importance that the limestone does not disintegrate into fine particles during calcination, and the determination of TD is often a part of the quality assurance of limestone products intended for quicklime production. If the raw material decrepitates into fine material in the kiln, the small-sized particles can stick to the walls or follow the gas flow and accumulate in the filter. This causes material and energy losses, as well as operational disturbances, and any limestone with very high TD is therefore unsuitable for quicklime production. Another critical issue that causes blockages and production losses in vertical lime kilns is the so-called “sticking tendency”. This is related to lime densification and possible melting at high temperatures. It can generate crusts and occlusions, and a correlation between the sticking tendency and mechanical degradation with fine particle formation has been reported [3].
The TD is of great interest to industrial suppliers of limestone, lime kiln manufacturers, and kiln owners since it is a limiting factor in the efficient production of high-quality quicklime. Presently, 90% of kilns used in Europe are shaft kilns. Shaft kilns consume approximately 50% less energy and have lower NOx emissions than rotary kilns [4], although they are more sensitive to TD. However, in the more robust rotary kiln, from a TD perspective, high TD leads to high material losses.
A survey for methods for analyzing TD was performed among relevant companies and institutions, together with a review of the literature (summarized in Table 1), showing that many methods [5,6,7,8,9,10] involve heating and sieving; however, the different methods for determining and evaluating TD vary considerably in the actual procedures. The heating rate is relevant, although information on that was not available for every method. In this summary, some of the thermal decrepitation test methods are “deterioration” or “degradation” methods; however, they all measure the same property, and for clarity, the term “decrepitation” is used in the rest of the paper. The survey was performed and included in the paper to verify that our selection of method (#3 in Table 1) was relevant and also to highlight differences and thereby show why the results of TD tests may vary between companies/institutions.
Crack formation in limestone under heating has been extensively studied. There are different types of cracks, and in a detailed review [13], cracks were divided into intragranular cracks lying along the grain and intergranular cracks extending from the grain boundary and crossing into one or more grains. An intergranular crack may also be a grain boundary crack along part of its length. Simmons and Richter [14] defined microcracks to be 100 µm or shorter. In the present paper, the terms “crack” and “fracture” will be used synonymously
Similar observations were made in another study, where it was observed that microfractures began to develop at 200–500 °C and fissures and cracks began to develop at 600–800 °C. It has also been noted that at lower temperatures the fractures were intergranular, while at higher temperatures they were both inter-, intra-, and transgranular [15]. In another study [16], the breaking characteristics of limestone were examined over a range of temperatures, and it was reported that microcracks and fractures appeared at 300 °C and 500 °C, respectively. Different types of limestones have been studied by applying a heat treatment up to 600 °C and measuring the effect of temperature on the mechanical properties of the stone [17]. It was shown that the rocks with lower compression strength and lower elastic modulus tended to pulverize above 400 °C. Yavuz et al. [18] carried out a study of thermal damage at 100–500 °C on marbles and limestones, and cracking along the grain boundaries was observed at 500 °C. Thermally induced cracking over a range of temperatures was analyzed [19], and it was found that above 700 °C, thermal decomposition begins with the transformation of calcite into calcium oxide, and microcracks appear at grain-to-grain contacts due to the thermal expansion of crystals. A similar study [20] showed that cracks appeared at 600 °C, and the number of cracks increased at higher temperatures. It was proposed that thermal cracks caused by high temperatures are mainly intercrystallite cracks.
One of the proposed explanations for TD is that it is caused by the cracking of lumps of limestone during heating, with cracking caused by differences in thermal expansion [21]. The calcite mineral in limestone experiences anisotropic thermal expansion. It will expand along the parallel C-axis of the calcite mineral lattice and shrink along the other perpendicular axis. The values of thermal expansion coefficients equal approximately 26 × 10−6 K−1 along the parallel axis and −6 × 10⁻⁶ K−1 along the perpendicular axis to the C-axis of the mineral lattice [22,23]. However, calcite mineral expansion alone cannot explain the different TD behaviors of different limestones, and several earlier studies on TD have focused on the correlation between TD and the particle size of the sample. For limestone, the Pilkington test showed that the decrepitation rate is low for finer particle size fractions and that it increases with fraction size. This differs from dolomite, in which the maximum decrepitation rate was found for the mid-size fractions [11]. A different method, based on thermogravimetric analysis, showed a similar trend for dolomite, while for the limestone the maximum TD was obtained for a finer fraction [11]. For dolomite, it was found [12] that the cause of decrepitation is water trapped within the rock lattice, building up the pressure until it exceeds the mechanical strength of the rock. For limestone, trapped fluid inclusions can expand and cause the rock to fall apart during the calcination process, which could be an explanation for TD in a kiln [24].
Olsson [25] worked on the prediction of limestone TD and found that facies appeared to be the most significant factor influencing the outcome of fines. The fractures were also investigated and could be divided into categories. Even though no strong correlation was found, fracture frequency was concluded to be an important factor in the creation of fines. It was suggested that the width of the fractures is essential because wide fractures are more prone to reopening during calcination [26].
Earlier work that focused on the degradation of calcitic and dolomitic marbles cycled at low temperatures (not exceeding 100 °C) found that combinations of marble mineralogical composition, fabric, grain size and shape, and the type of union between crystals to be the main factors influencing the low-temperature degradation of marbles [27,28,29]. Vola [30] reports that blockages in shaft kilns are considered more critical and frequent in the presence of an excess of fines formed during the calcination process, and suggests that the mechanical degradation at 1050 °C was possibly facilitated by coarse calcite and dolomite crystal-sizes, commonly represented by diagenetic and/or metamorphic microstructures. It was suggested by Johansson [23] that the appearance of fines during limestone calcination is not attributable to a single factor but rather to many connected factors, including the presence of stylolites, fluid inclusions, silicate mineral inclusions, high porosity, and the reactivation of old crack systems and calcite-healed cracks. Johansson suggested that the cracks in the limestone have the greatest significance because an increased number of fractures and cracks tends to increase the production of fines. Additionally, a well-crystallized texture in the limestone and larger grain sizes contribute to the generation of fines [23].
The objective of the present paper was to determine if a correlation can be found between the chemical composition and TD of limestone, and also to determine if and how limestone primary-texture and quicklime-derived microstructure and crack formation is connected to TD. Limestone samples from the Jutjärn quarry, Dalarna, Sweden, were used for the analysis. A total of 80 drill-core samples were extracted from the quarry, chemical composition was determined by X-ray fluorescence (XRF), and TD tests were performed according to the SMA Central Laboratory method [7]. In addition, two samples were chosen for a detailed analysis of fracture formation over a range of temperatures (ambient, 500 °C, 800 °C, and 1150 °C).

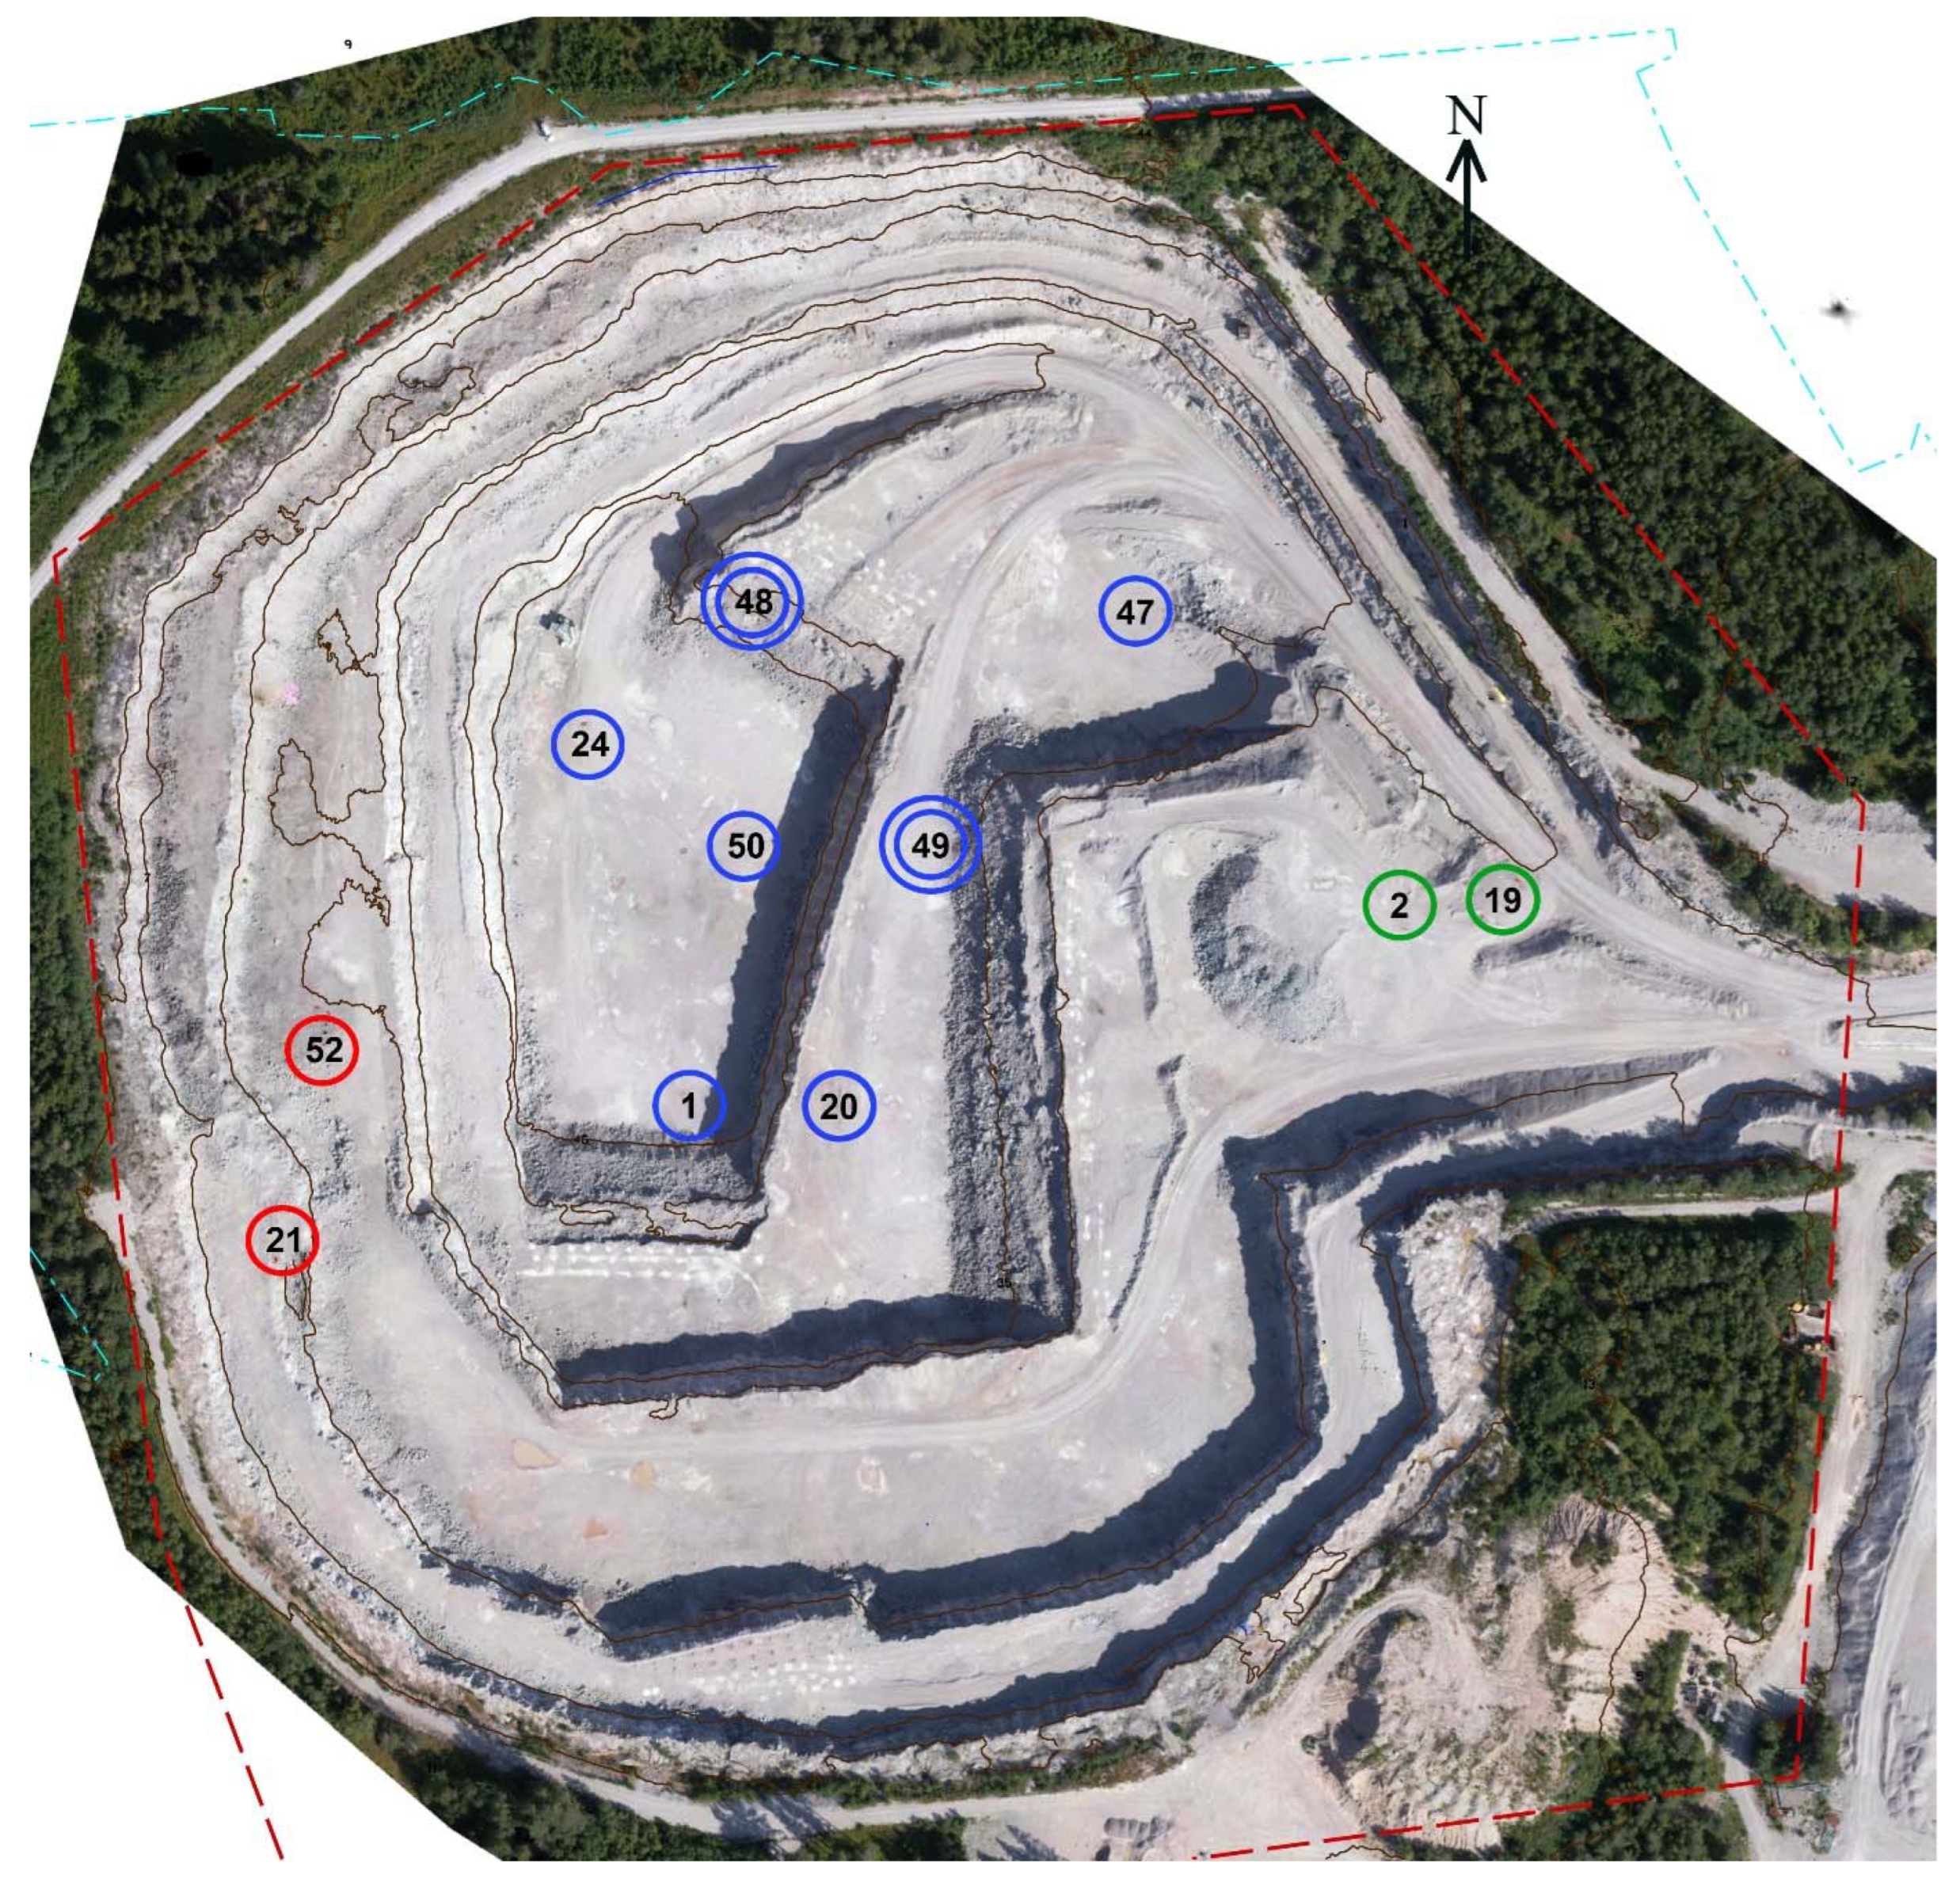
2. Geological Settings

The Jutjärn quarry located in, Dalarna, Sweden, has been owned and operated by SMA Mineral AB since 1986. The Jutjärn quarry belongs to the Boda Limestone (Upper Ordovician in age) that consists of Upper Katian deeper-water carbonate mud-mounds bodies with flank deposits. These bodies overlay lower-to-middle Hirnantian-bedded limestones strata, containing three strikingly different trilobite faunas. In particular, the core of the Boda Limestone consists of massive wackestone, which is rich in void-filling stromatactis with tiny bioclasts, plus irregularly distributed grainstone lenses with calcareous algae and trilobites. Synsedimentary dikes and pockets containing disarticulated and rather large trilobite sclerites cemented by fibrous syndepositional marine calcite (i.e., stromatactis) and blocky calcite, have also been observed. The stratigraphic formations of the regions have been described in detail by Suzuki et al. [31]. Jutjärn limestone is fine- to medium-grained and has a micritic structure. From a chemical perspective, the limestone is of medium to high purity in the center of the quarry; however, the amount of silica grows at the edges from 2 up to 8 wt.-%. Sulfur is locally concentrated at 500–2500 ppm, with peak values of up to 7500 ppm, and is generally found in lower concentrations in the lower levels of the quarry. Aluminum levels are 0.6–0.8 wt.-% [32].

3. Materials

A total number of 80 samples were extracted from 11 drill cores representing the western, center, and eastern parts of the quarry (Figure 1). Sample information including depths, TD and chemical analysis data is available in the supplementary material (Table S1). The geological structure of the deposit varies from a mound in the center to flanks towards the edges- The samples were chosen from different parts in order to have an overview of the quarry, and they were divided into three groups based on location. The western part of the quarry (West group) included red boreholes 21 and 52; the center of the quarry (Centre group) included blue boreholes 1, 20, 24, 47, 48, 49, and 50; and the eastern part of the quarry (East group) included green boreholes 2 and 19. Sample depths are reported in the supplementary material (Table S1).
Drill core samples were first crushed with a jaw crusher, then milled into smaller pieces using a cone mill. A riffle splitter was then used to obtain the appropriate amount of rock for the next step of sample preparation. Fine powder samples were made for the XRF analysis using a vibrational disc mill, and 5–10 mm gravel samples for the TD tests were obtained by sieving the rock samples through 10 mm and 5 mm sieves.
Two samples were chosen for detailed Scanning Electron Microscopy (SEM) investigations. Two samples (71 and 74) with similar chemical composition but with very different TD (75% and 4%) were chosen for detailed SEM analysis. Both samples were taken from the same Centre group of boreholes located next to each other in the quarry (48 and 49, Figure 1).

4. Methods

4.1. Chemical Analysis

We used XRF (Malvern Panalytical Axios Max, WDS) to determine the chemical composition of the limestone samples by measuring the amounts of the main chemical elements, reported as CaO, MgO, Fe2O3, SiO2, Al2O3, MnO, P2O5, TiO2, K2O, and elemental S. We operated the instruments between 25 and 50kV, performed the analysis according to the standard ISO 12677:2011 (chemical analysis of refractory products by X-ray fluorescence (XRF)—fused cast-bead method), and validated measurement quality by weekly tests with a standard sample (Limestone GBW 03108).
We heated the powder fraction samples in a furnace at 980 °C for two hours and then cooled in a desiccator for 45 min. We determined loss on ignition (LOI) by thermogravimetry. We performed chemical analysis on fused beads obtained by mixing 0.9 g of the heated limestone powder sample with 6 g lithium tetraborate (Li2B4O7) in platinum crucibles. We placed the mixtures in platinum casting molds with a 30 mm diameter and melted at 1150 °C in a fusion machine [33]. We minimized sulfur vaporization by keeping the temperature low and, for samples containing sulfides, adding an oxidation step to the heating. Table 2 shows lower detection limits (LDL) for the XRD and loss on ignition (LOI).

4.2. Thermal Decrepitation

We sieved the limestone samples using 10 mm and 5 mm sieves and collected the 5–10 mm fraction. We measured the sample weights and crucible weights separately. We placed the crucibles containing the samples in a furnace, and the calcination atmosphere was air. We heated the furnace to 1150 °C at a heating rate of 5 °C/min, and the holding time at 1150 °C was 60 min. After switching the furnace off, we cooled the sample inside the furnace and then placed it in a desiccator [7]. We measured the weight of the sample and recorded as calcined sample weight (g) (m1). We manually sieved the sample at 5 mm and recorded the weight of the <5 mm fraction (m2). We calculated the TD value according to equation 2 [7]:
m 2 m 1 × 100 = T h e r m a l   d e c r e p i t a t i o n   % ,   w h e r e :          
m1: calcined sample weight (g)
m2: weight of fractions < 5 mm (g)

4.3. Multivariate Analysis

We evaluated the correlations between the specific chemical compounds and the TD values, in addition to any separation between the different groups of samples (Centre, West, East) using the SIMCA 14.0 (Sartorius, Goettingen, Germany) software for multivariate statistical analysis. We analyzed all 80 samples with each chemical compound set as the X-variable and the TD set as the Y-variable. We used the samples groups Centre (n = 42), West (n = 5), and East (n = 33) as un-weighted classification labels in the evaluation. We fitted the data with a partial least squares discriminant analysis (PLS-DA) model, which allowed for uniquely separating the variations of compositional data (X), TD, and classes (groups) [34]. PLS-DA is a powerful tool to analyze datasets with preferably 2-4 already-known groups, such as in our case (3). The algorithm can then determine if the groups are statistically different and what data best describes the differences.

4.4. Scanning Electron Microscopy

We performed scanning electron microscope (SEM, Carl Zeiss Evo LS-15) analysis on the two samples selected for detailed microstructural analysis in order to observe fracture formation in limestone samples for unheated limestone and samples heated to 500 °C, 800 °C, and 1150 °C. We placed a 10 mm fraction of these limestone samples in a muffle furnace with a heating rate of 5 °C/min up to 500 °C, 800 °C, and 1150 °C with a holding time of 45 min. The atmosphere we used during calcination was air with a flow rate of 5 l/s. We cooled the samples inside the furnace and then placed them in a desiccator before sample preparation for further analysis in SEM. We cast the samples in epoxy, then ground and polished with a grinding and polishing machine (Stuers LaboForce 100). We performed grinding using resin-bonded diamond surfaces with #1200 as the final step, followed by polishing with 3 and 1 µm diamond solutions. We used similar grinding and polishing settings for limestone and quicklime; however, we used lower force and speed and a longer griding time for the harder limestone samples. The microscope EHT voltage was 15.00 kV, beam current I probe = 700 pA, and we used an HDBSD detector (high-definition backscattered electron detector).

4.5. Image Analysis

We performed image processing and quantification of limestone fractures with pixel classification and post-processing, including quantification of fractures. To measure and quantify fractures in the SEM images, we first identified fractures as objects in the image (Figure 2) using Ilastik 1.4.0b14 [35]. We manually selected the grain area (drawing of the yellow line) and fracture area (blue line) to teach the software which parts of the image were grain and fracture areas. We trained the program using leveraged machine learning to recognize fractures in the image using user-annotation labels to determine which pixels constitute a fracture and which do not. This is based on the color intensities, edges, and textures of the pixels [35]. We individually processed each image, and the fractures were labeled as fractures, and non-fractures were labeled as grains. Our results produced segmented probability maps—pixels in the image are fractures and grains. We then further analyzed the probability map using ImageJ Fiji. The area we analyzed was the largest rectangle possible within the limestone sample and, therefore, the size of the area varied somewhat between samples (between 1 mm × 3 mm and 3 mm × 7 mm).
We analyzed the probability maps we acquired from Ilastik using ImageJ Fiji Version 2.1.0 and Java 1.8.0_172 [36,37]. Since the exported probability map was in two color channels, one for the pixels classified as fractures and the other for pixels classified as grains, we first split the images into two separate images, one for each color channel. The image analyzed was the image that represented the fracture’s color channel. We converted the images into 8-bit and thresholded, which means that the images were turned into pure white and black images (Figure 3) depending on the brightness value of each individual pixel. We turned pixels with a grayscale value of 131–255 into white pixels, and pixels with a grayscale value of 0–130 were turned into black pixels. The pixel grayscale value correlates with the probability of a pixel being a fracture, while higher values indicate the higher certainty of a pixel being a fracture.
We analyzed the resulting images using ImageJ’s “Analyze” function, and we considered all dark pixels to be fractures. We set the area size limit to 500 square pixels to infinity, which means that we ignored fractures with an area of fewer than 500 square pixels. We determined the area and perimeter of each included fracture, and we set the length of the fracture as the perimeter divided by two. We summarized each fracture area in a separate image and then divided it by the total area of the largest rectangle image. From the probability map, we calculated the total lengths of the fractures (in mm/mm2) and the total area of the fractures (%). The method has been used in biological research [35,37].

5. Results and Discussion

5.1. Chemical Composition

XRF chemical analysis revealed the composition of the Jutjärn limestone samples, and the average chemical composition and LOI based on 80 samples is shown in Table 2. The entire data set is available in the supplementary material (Table S1). The samples showed large variations in CaO contents of 51.51–55.2 wt.-% and LOI values of 41–43.9 wt.-%. The MgO content was low, and a few samples showed impurities, i.e., SiO2 (3.71 wt.-%), Al2O3 (1.42 wt.-%), P2O5 (0.14 wt.-%), and S (0.412 wt.-%).
Two samples numbered 71 and 74 were chosen for detailed SEM analysis after heating to several temperatures. These samples were selected based on their very different TD values, even if they were similar in chemical composition, and both represented high-purity limestone (CaO content of 54.7–54.8 wt.-%)—this data correspond well to the long-term bulk composition from the quarry. The SiO2, Al2O3, and K2O contents were clearly below average. The contents of MgO, MnO, and P2O5 were in line with the average, and the other minor compounds were below the average. XRF and TD values are shown in Table 3.

5.2. Thermal Decrepitation

A total of 76 of the 80 samples had a TD value below 10%, which can be considered to be a low level. Only four samples showed a TD value above 10%. From a kiln operational point of view, the limestone with these TD values is still suitable [38]. Since there are a few samples with higher TD values in the center part of the quarry, mixing of the material is necessary before feeding it to the kiln.
For the limestone with 4% TD (sample 74) heated to 500 °C, there was no mass loss, while after heating to 800 °C, the weight loss was 33.0%, and after heating to 1150 °C it was 43.5%. For the limestone with 75% TD (sample 71) heated to 500 °C, the weight loss was 26.0%, while after heating to 800 °C it was 28.5%, and after heating to 1150 °C it was 43.8%. Thus, full calcination was only reached at 1150 °C.

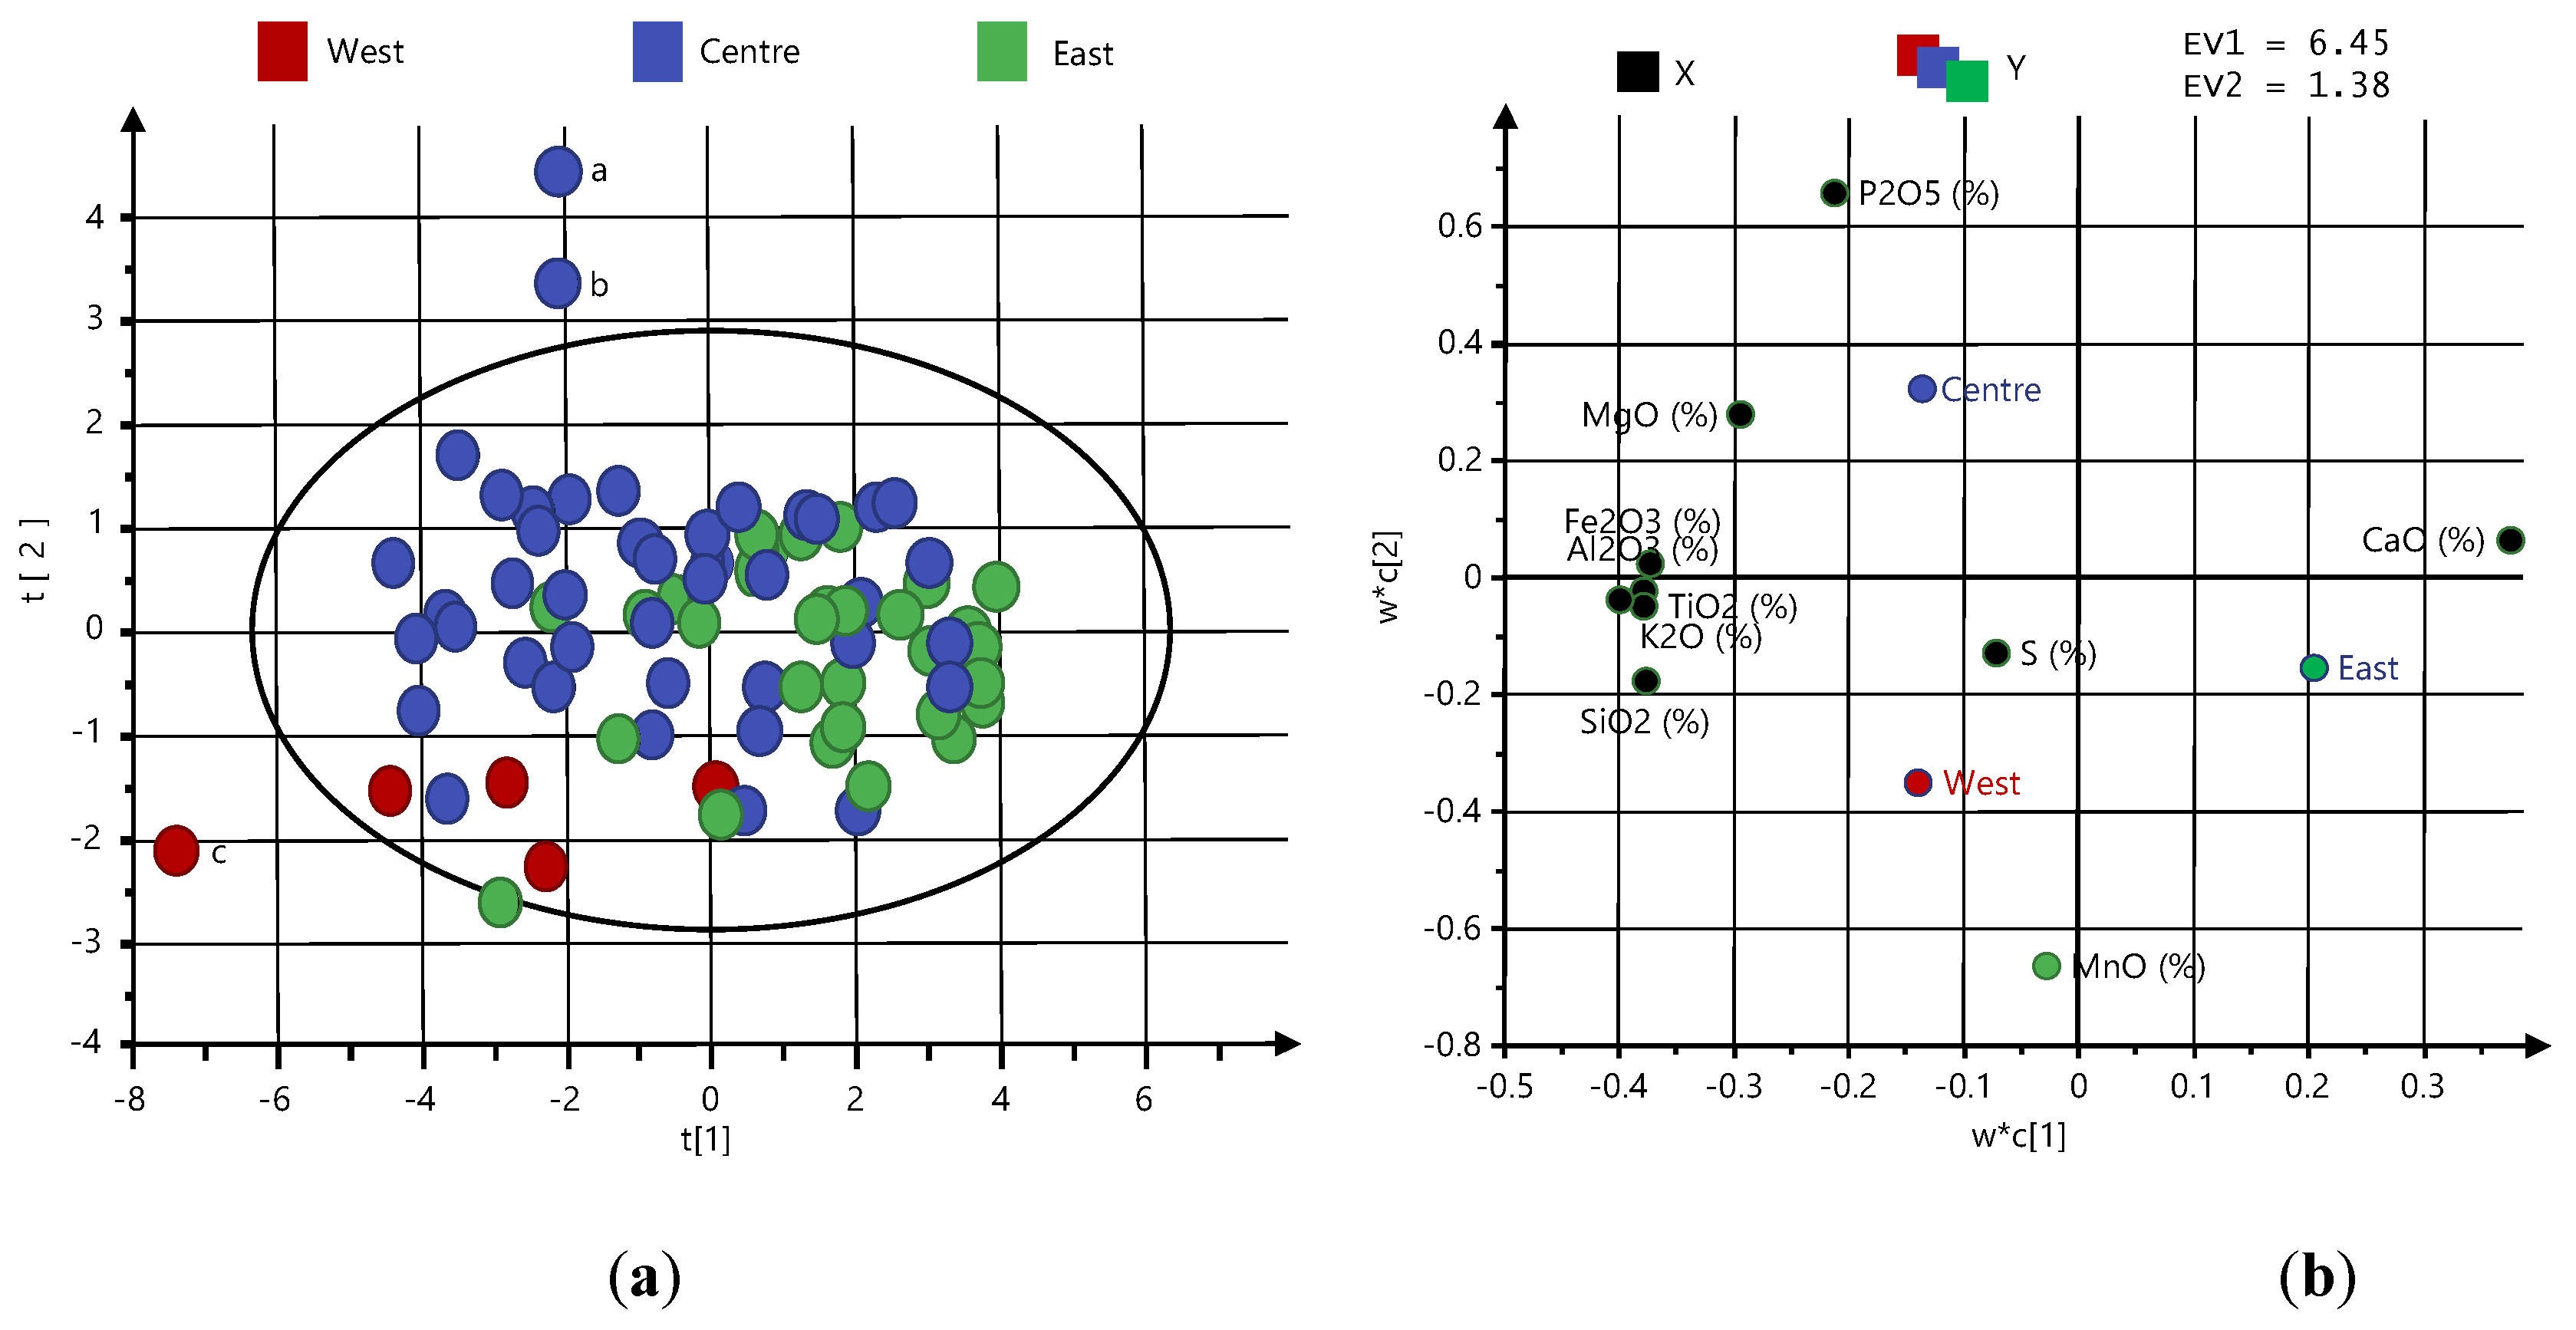
5.3. Multivariate Analysis

The possible correlations between the chemical composition, TD, and location in the quarry were analyzed with multivariate statistics. PLS-DA was applied to all of the samples together, with chemical compositions and the pre-defined classes describing sample locations. The model was fitted with two components. The estimation of how much variation in the responses described by the model was represented by R2. Q2 describes the corresponding variations for predictions. The cumulative values of R2Y and Q2 of the second component were higher than for the first component but still not high enough (Q2 > 0.5 and R2Y close to 1) to identify any strong correlations between the chemical composition and TD of the samples. The cumulative R2 value of 0.28 and Q2 value of 0.22 indicated no or very weak correlations. Adding more components led to an overfitting of the data. A model with two components was used for illustrations (Figure 4), even though the Eigenvalue (EV) of the second component was less than 2.
The analysis resulted in a score plot (Figure 4a) representing the sample’s distribution, with t [1] and t [2] being the X-score vectors for each component. The score plot indicates weak grouping according to location (represented by the different colors); however, as mentioned, this trend was not statistically significant. Samples outside of the plot boundaries in the score plot were statistically classified as outliers. Samples labeled a and b were outliers due to their unusually high P2O5 contents (0.14 and 0.11 wt.-%, respectively), in addition to sample c, due to its high concentration of Al2O3 (1.42 wt.-%). Even though these three samples deviated from the normal compositions in the quarry, their compositions were within ranges that could be explained by natural variations. Therefore, the outliers were probably explained by locally occurring impurities rather than by analytical errors. Detailed microscopy studies of local impurities could be interesting from a TD perspective; however, since these deviations were found in only a few samples, and since it was not statistically correlated to TD, we decided not to include microscopy on these samples in this study.
In the corresponding loading plot (Figure 4b), variable correlations (chemical compounds and TD) are displayed, with w being the loadings for the X-variables. The direction in the scores plot corresponds to the direction in the loading plot, and it can be used for interpreting the causalities of correlations (if there are any) [34].

5.4. SEM Image Analysis

SEM revealed thermally induced fracture development across the range of temperatures (ambient, 500 °C, 800 °C, and 1150 °C) for the 4% (Figure 5) and 75% TD samples (Figure 6). For statistical reasons, three samples were analyzed in each sample group, providing a total of 24 images. Representative images are presented in Figure 5 and Figure 6.
Figure 5a–c show the limestone and derived quicklimes of sample 74 (TD = 4%) heated up to 800 °C. According to the image analysis data in Table 4, the area of heat-induced fractures was low (below 1.9%). In comparison, Figure 6a–c show that the limestone and derived quicklimes of sample 71 (TD = 75%) heated up to 800 °C have major cracking, which could be observed as low as 500 °C with an average fractured area of 7% (Table 5), and a more extensive cracks formation was observed at 800 °C with an average fractured area of 10.5%.
Up to 800 °C, both samples showed increased crack formations. A reverse trend was observed with fully calcined limestone samples, as the average fractured area of samples with 4% TD reached 4.9%, while the samples with 75% TD reached 4.0%. The reduction in the average fractured area could be related to the CaO sintering [39,40].
Sample 71 shown in Figure 6a already had more cracks at ambient temperature, with an average fractured area of 3.8% compared with sample 74, which had an average fractured area of 0.6%. During heating, more cracks evolved in the TD 75% samples than in the TD 4% samples. This observation agrees with Johansson [23], as the increased number of cracks tends to increase the TD value and the production of fines in lime kilns. In addition to cracks, there were also discontinuities and void-filling that could be found in the SEM images. Their occurrence could be related to the primary or depositional textures of the limestone.
The two samples had large differences in thermal behavior. Sample 74 did not seem to be affected until the temperature exceeded 800 °C, while at higher temperatures, an extensive network of narrow cracks formed. In contrast, sample 71 had already developed significant cracking at 500 °C, more at 800 °C, and then the cracking was lower at 1150 °C. Therefore, the very high TD values of sample 71 might be caused by the absence of the network of narrow cracks, which could possibly release internal stress and thereby mechanically stabilize the rock. Some grain shapes in Figure 6 b–c indicate that they may originate from the calcination of rounded bioclasts.
The thermal cracking of rocks was recently examined by Liu et al. [41], who showed that a critical factor is the difference between mineral thermal expansion coefficients. Other studies, see e.g., [22,42,43], have documented the anisotropic thermal expansion of calcite. A possible explanation for crack formation could be different expansion coefficients of calcite coupled with the grain sizes of the stone. This hypothesis, together with our results showing a lack of correlation between chemical composition and TD for samples from the Jutjärn quarry, is a good foundation for future studies. More detailed information on the petro-physical properties of the raw materials should be investigated by more in depth lithological and microscopic analysis, and also a larger dataset of samples should be considered.

6. Conclusions

We analyzed 80 limestone samples for chemical composition and TD in order to determine the suitability of the limestone for shaft kiln operation and whether chemical composition influences the TD of limestone. Detailed SEM and image analysis was also performed to investigate if and how microstructure and crack formation is related to TD.
  • Overall, the analyzed limestone had low TD, 78% of the samples had a TD value below 5%, and 18% of the samples had a medium TD of 5–12%. This means that the limestone studied, from a TD perspective, is suitable for shaft kiln operation. One sample exhibited an extreme TD value of 75%, which suggests that quarry quality control and mixing would be required to ensure that no batch fed to a shaft kiln would contain solely this material;
  • Very weak correlations were found between TD and the chemical composition (CaO, MgO, Fe2O3, SiO2, Al2O3, MnO, P2O5, TiO2, K2O, and S) of the limestone, and based on that, the TD values were concluded to be connected to the physical properties of the limestone and/or quicklime rather than to the chemical composition;
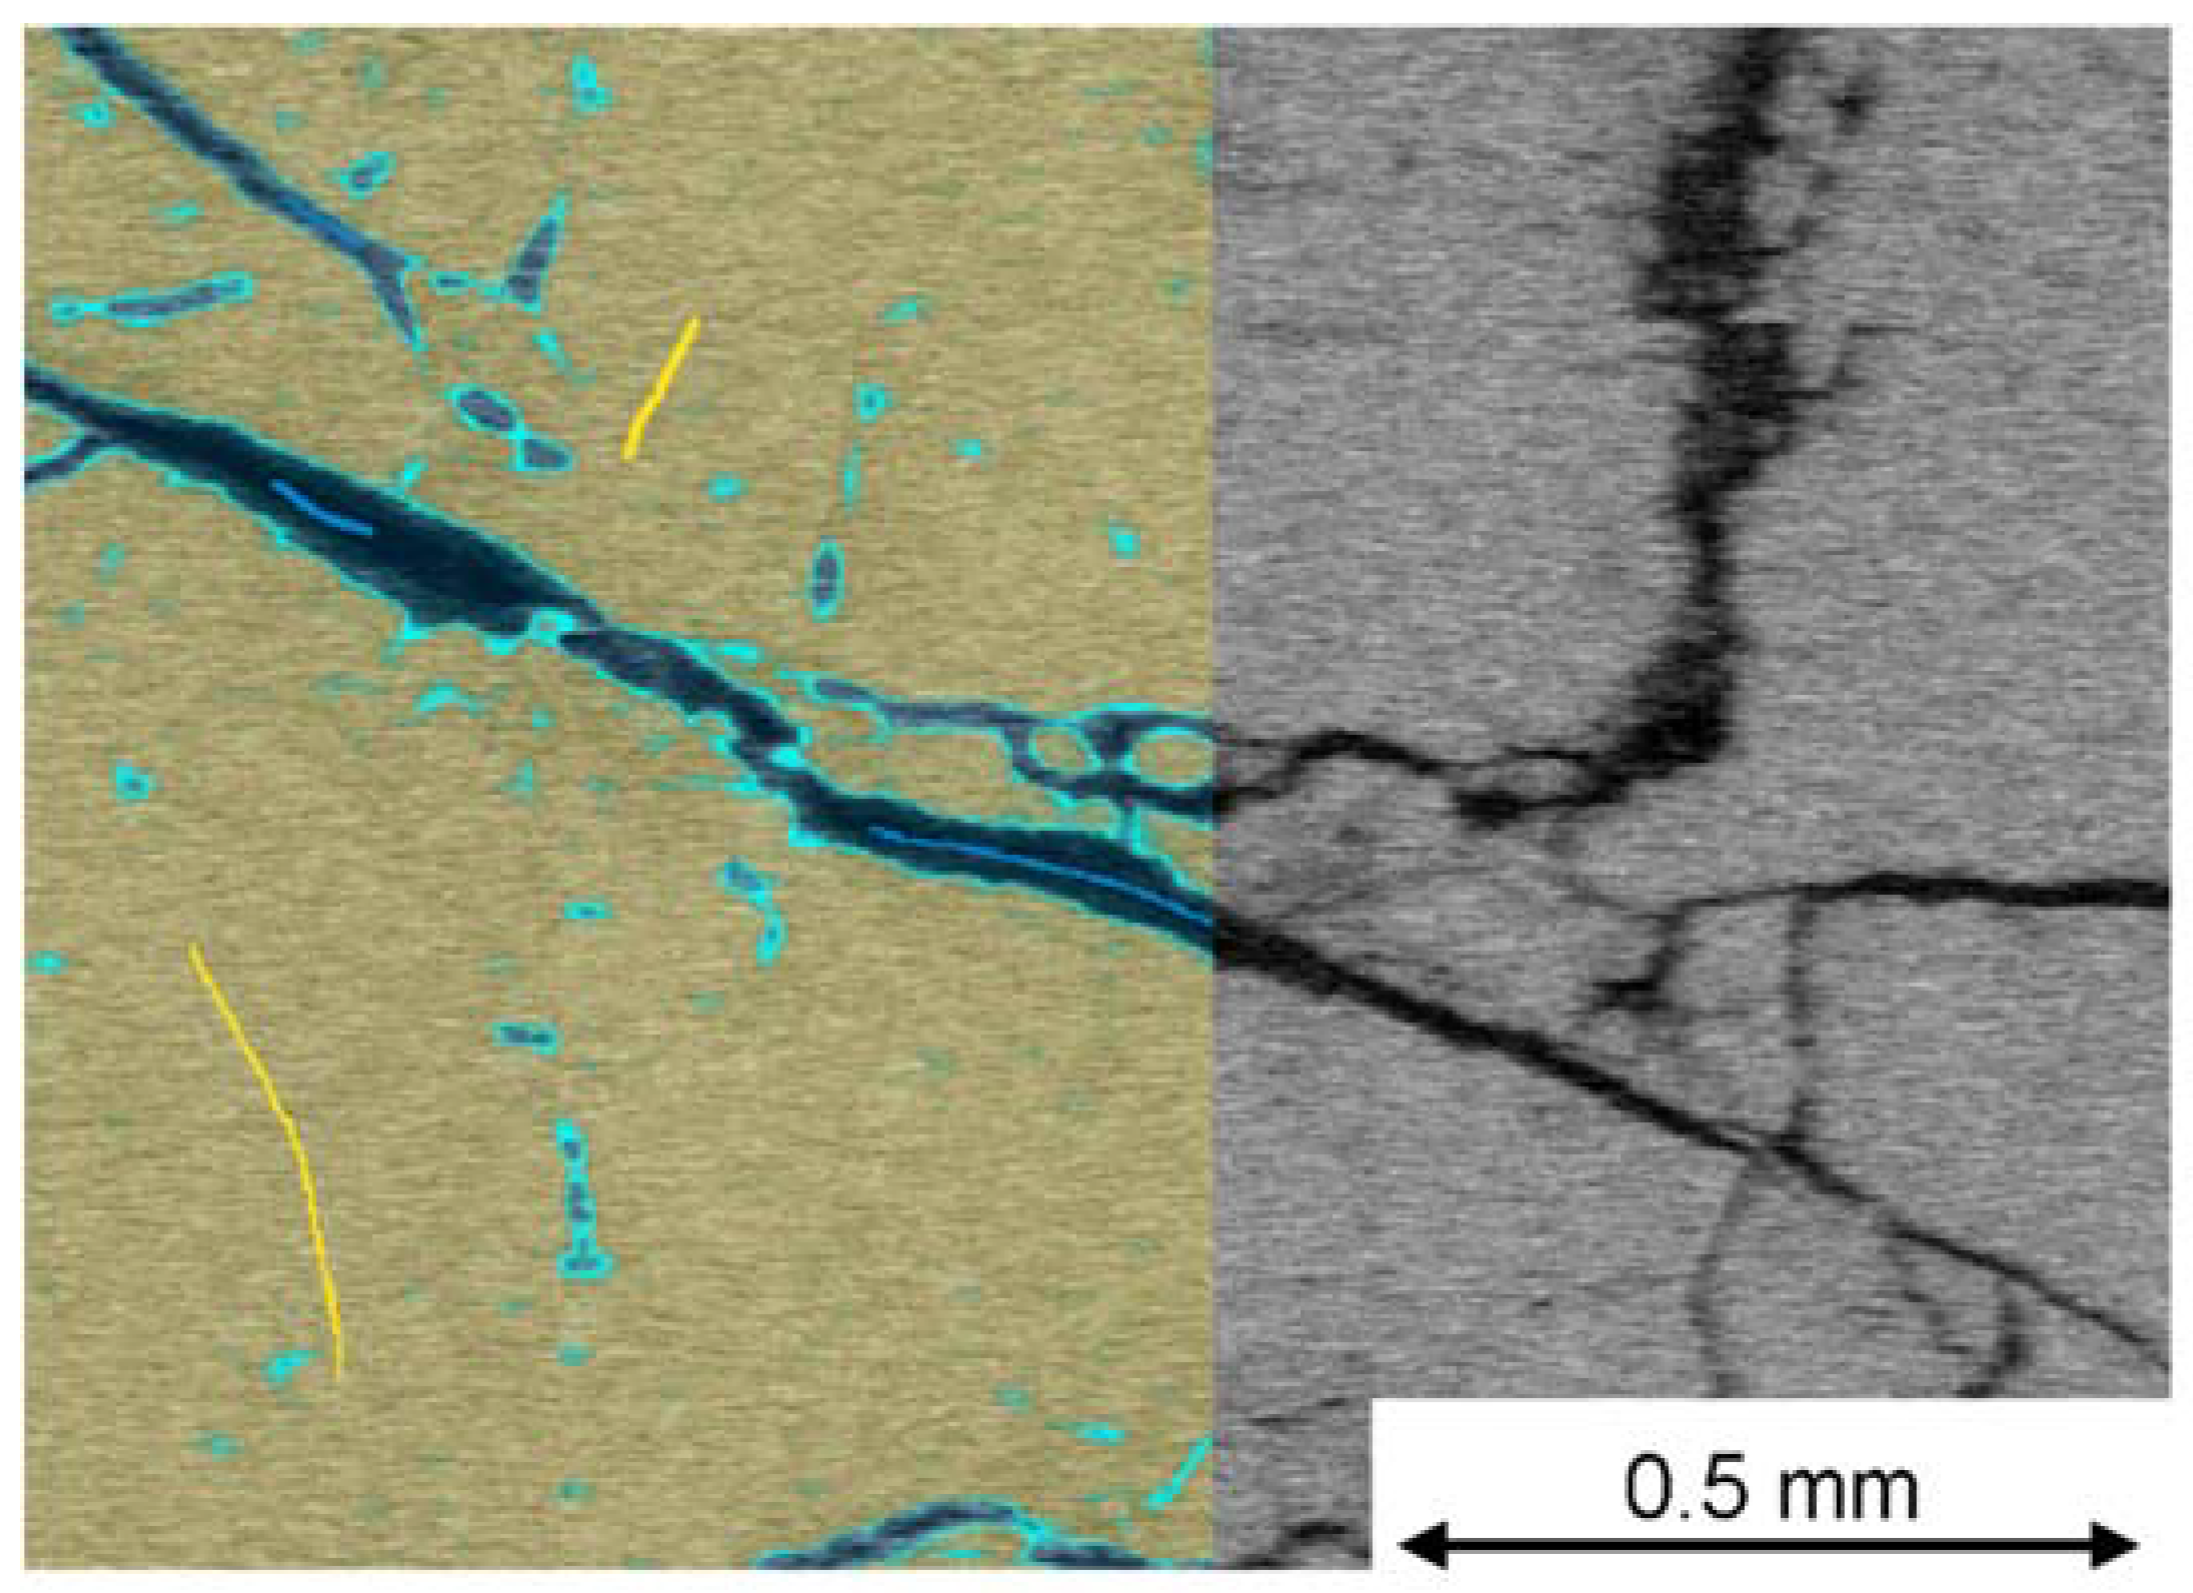
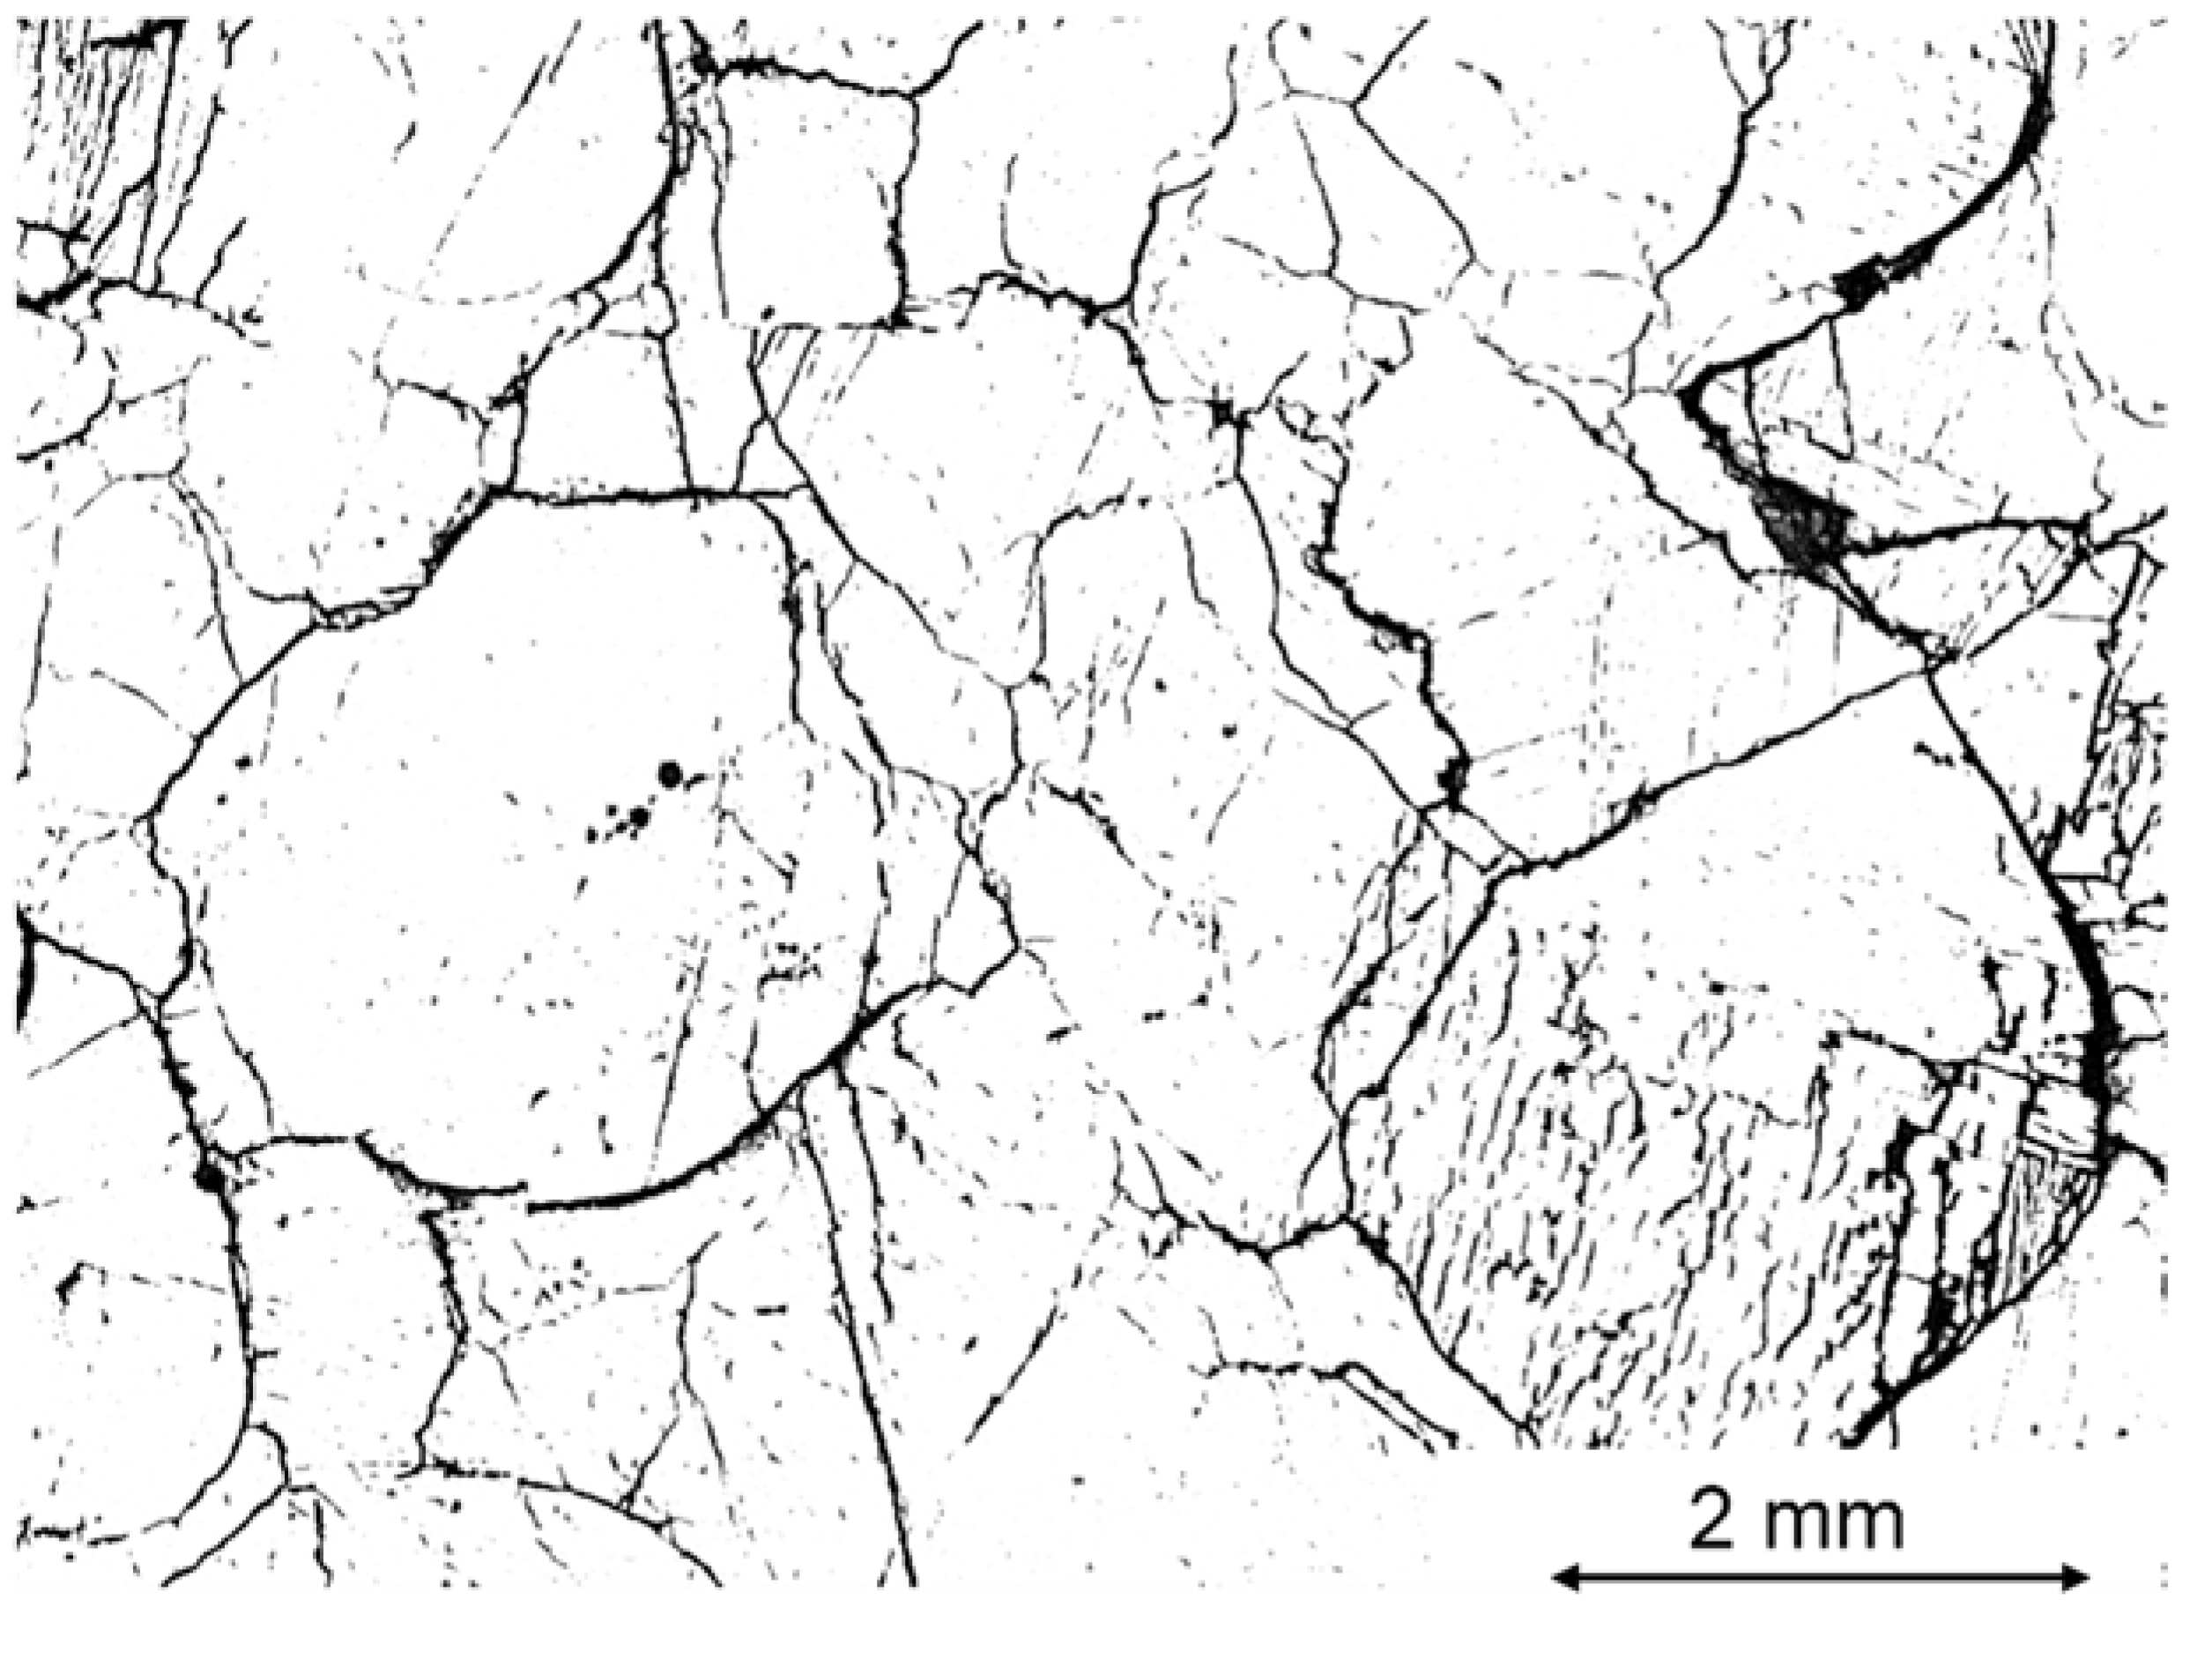
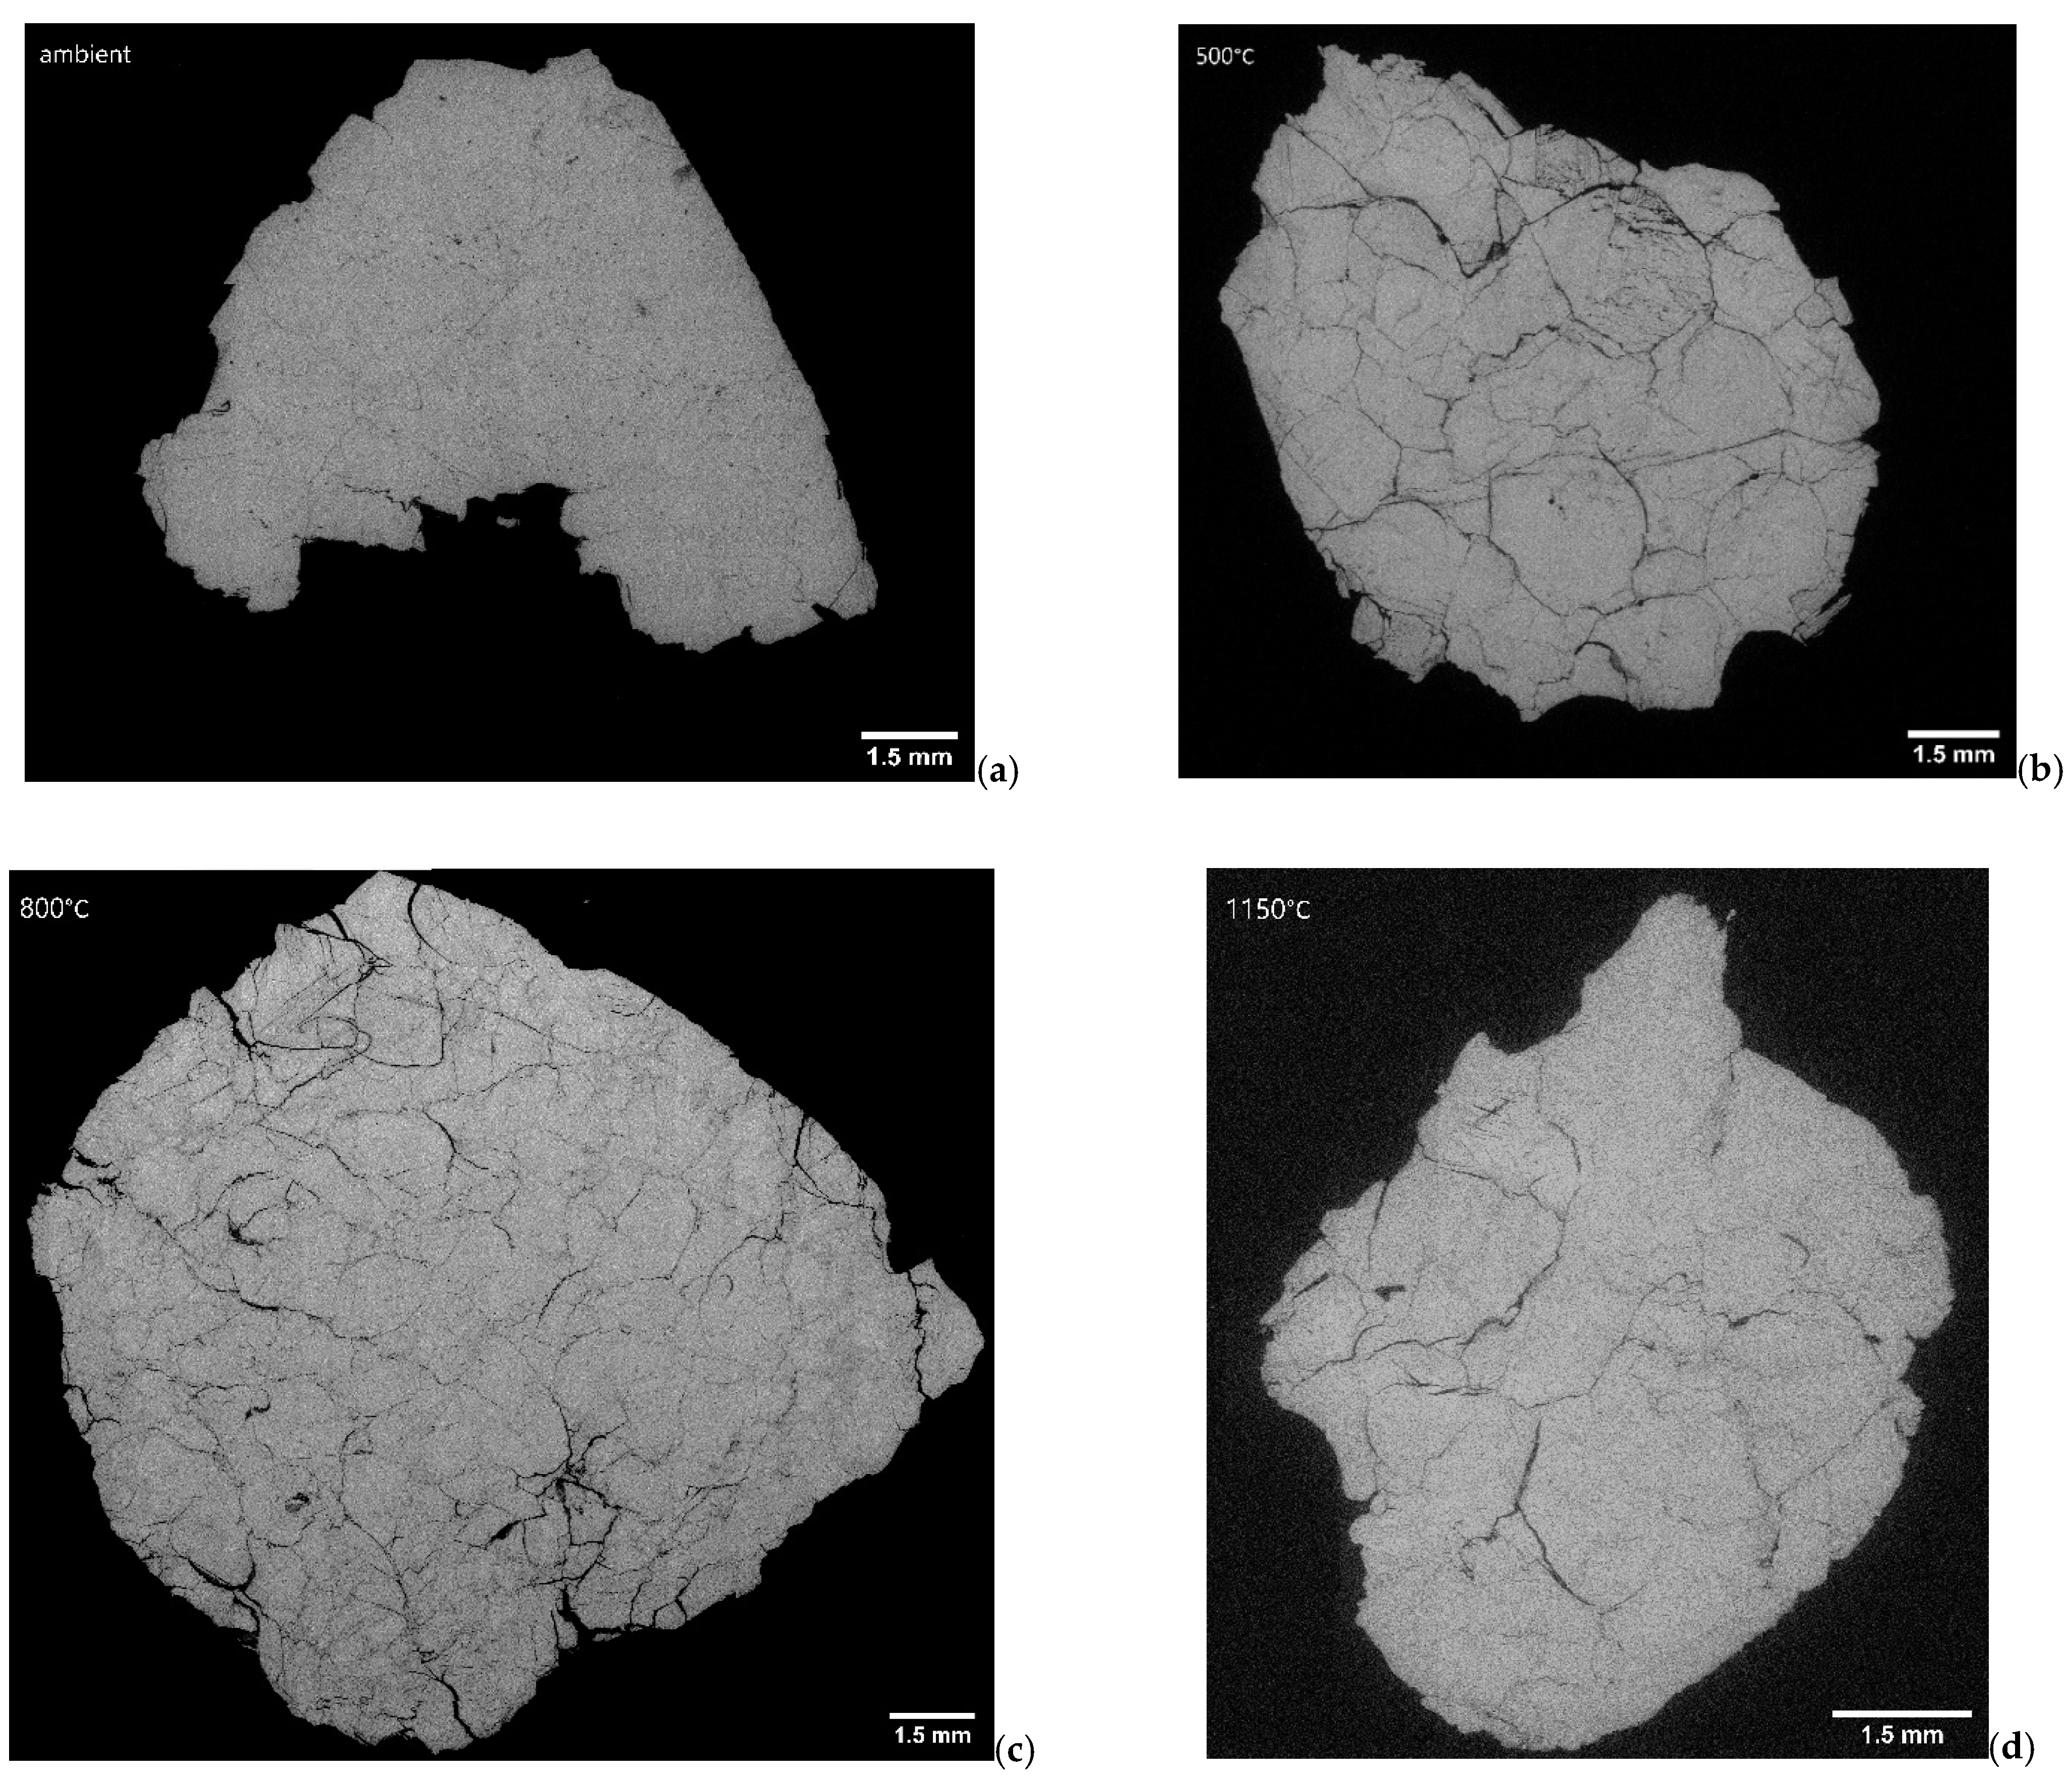
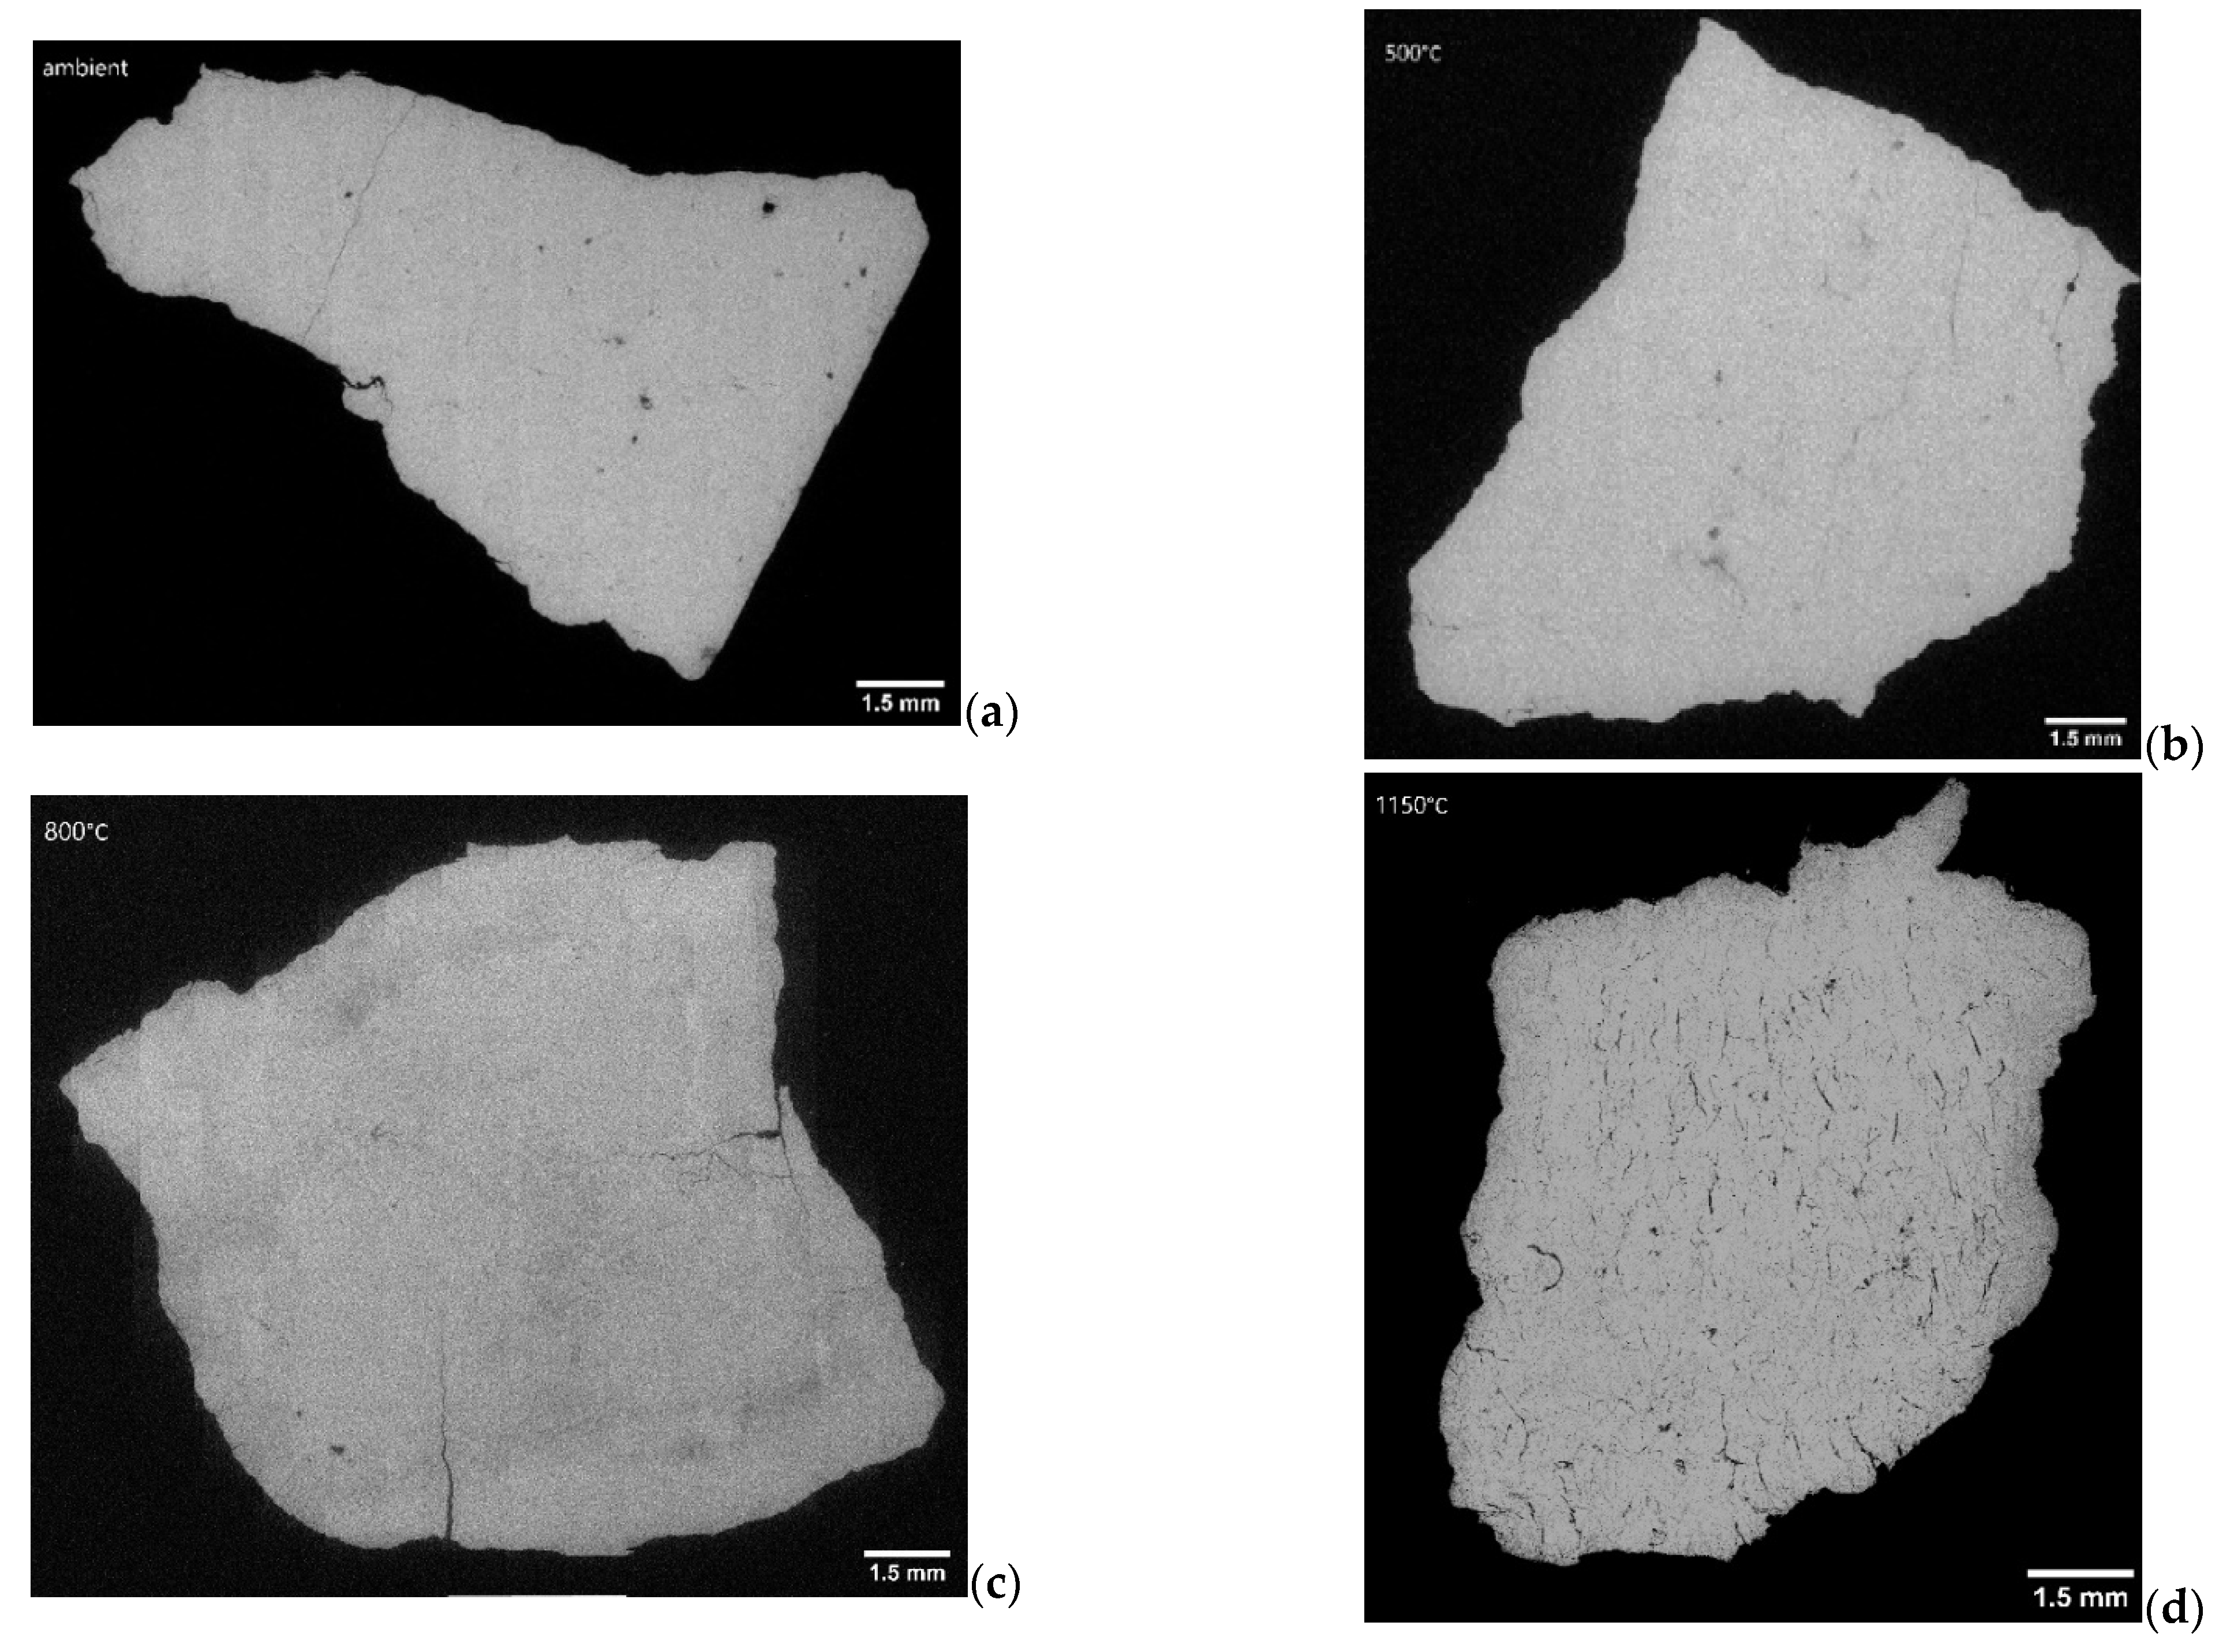
  • In a further investigation, the sample with an extreme TD value of 75% was compared to a sample with a similar chemical composition but with a low TD value of 4%. The sample with 75% TD showed significant cracking already at 500 °C, while this was not seen for the corresponding sample with the low TD value. For the low TD sample, after calcination, the pre-existing fractures seemed to grow in length and a large network of small fractures appeared, increasing the total fractured area. This pattern did not occur in the 75% TD sample, in which the already-formed cracks remained few and wide even after 60 min at 1150 °C and full calcination. The network of narrow cracks might favorably influence the internal stresses of the sample, providing an explanation for the low TD overlooked in the previous literature.
The results only represent samples from a case study of Boda Limestone from Jutjärn quarry and cannot be further generalized and directly translated to other quarries, which can differ greatly in geological background, chemical composition, textural characteristics, and/or derived quicklime microstructure. However, these samples serve as an example of how the variations of thermal decrepitation can occur within one quarry, and they also highlight the complexity of the mechanistic explanations. Increased knowledge about these issues can help in predicting limestone thermal decrepitation, enabling increased resource efficiency in quicklime production. Further studies could involve performing analysis on the TD of limestone samples taken from many quarries from different locations, and more analytical methods could be included. To the best of the authors’ knowledge, the image analysis method presented here has not been applied previously in the high-temperature mineral industry. This paper shows that the method of fracture estimation is applicable in industrial minerals research.

Supplementary Materials

The following supporting information can be downloaded at: https://www.mdpi.com/article/10.3390/min12101197/s1, Table S1: Data on all samples.

Author Contributions

Conceptualization, K.C., M.B. and M M.E.; methodology, K.C., M.B. and M M.E.; software; E.H. and K.C.; validation, K.C.; formal analysis, K.C.; investigation, K.C.; writing—original draft preparation, K.C.; writing—review and editing, K.C., M.B., K.B., K.F., E.H. and M M.E.; visualization, K.C.; supervision, M.B. and M.E.; funding acquisition, M.B. and M.E. All authors have read and agreed to the published version of the manuscript.

Funding

This study was carried out within the Industrial Doctor School for Research and Innovation at Umeå University (2019-12-03), funded by the University and the industrial partners SMA Mineral AB, Nordkalk AB, and Cementa AB. The Ellen, Walter, and Lennart Hesselman Foundation; Swedish Mineral Processing Research Association (MinFo) (2022-05-23); Swedish Energy Agency (47198-1); and Sweden’s innovation agency, Vinnova (2019-02548), are also acknowledged for financial project support.

Data Availability Statement

Not applicable.

Acknowledgments

The authors acknowledge Oksana Sjöberg at SMA Mineral AB for support with the geological description of the Jutjärn deposit, and Jenny Allered, Gina Hagelin, and Ann-Charlotte Jonsson at the SMA Mineral Central AB laboratory for technical assistance. Robert Gräsberg at SMA Mineral AB is acknowledged for project support. The authors also acknowledge the facilities and technical assistance at the Umeå Centre for electron microscopy (UCEM), and Umeå University, Sweden, for microscope access and technical support. The authors would also like to thank Emil Hiljanen and Markus Carlborg for their assistance with the SEM image analysis. We would also like to thank one of the anonymous reviewers for very useful and detailed comments on our work.

Conflicts of Interest

The authors declare no conflict of interest.

References

  1. Manocha, S.; Ponchon, F. Management of lime in steel. Metals 2018, 8, 686. [Google Scholar] [CrossRef]
  2. Boynton, R.S. Chemistry and Technology of Lime and Limestone, 2nd ed.; Wiley Interscience: New York, NY, USA, 1980. [Google Scholar]
  3. Vola, G.; Ardit, M.; Sarandrea, L.; Brignoli, G.; Natali, C.; Cavallo, A.; Bianchini, G.; Cruciani, G. Investigation and prediction of sticking tendency, blocks formation and occasional melting of lime at HT (1300 °C) by the overburning test method. Constr. Build. Mater. 2021, 294, 123577. [Google Scholar] [CrossRef]
  4. Schorcht, F.; Kuorti, I.; Scalet, B.M.; Roudier, S.; Delgado Sancho, L. Best Available Techniques (BAT) Reference Document for the Production of Cement, Lime and Magnesium Oxide; Joint Reasearch Centre of the European Comission: Seville, Spain, 2013. [Google Scholar]
  5. Cimprogetti. Mechanical Degradation and Drop Test; Cimprogetti Srl: Dalmine, Italy, 2020. [Google Scholar]
  6. Maerz. Decrepitation Test; Maerz Ofenbau AG: Zurich, Switzerland, 2020. [Google Scholar]
  7. Allared, J. Determination of Thermal Decrepitation and Abrasion Test; SMA Mineral: Filipstad, Sweden, 2019. [Google Scholar]
  8. Harrison, D.J. Industrial Minerals Laboratory Manual: Limestone; British Geological Survey: Nottingham, UK, 1993.
  9. Nordkalk. Thermal Decrepitation; Nordkalk: Pargas, Finland, 2018. [Google Scholar]
  10. Sandström, O. Energy Effective Production of Lime Products—Comparing Industrial and Scientific Laboratory Methods for Prediction; Graptolit Geoproject AB: Malmö, Sweden, 2011. [Google Scholar]
  11. Dollimore, D.; Dunn, J.G.; Lee, Y.F.; Penrod, B.M. The Decrepitation of Dolomite and Limestone. Thermochim. Acta 1994, 237, 125–131. [Google Scholar] [CrossRef]
  12. McCauley, R.A.; Johnson, L.A. Decrepitation and thermal decomposition of dolomite. Thermochim. Acta 1991, 185, 271–282. [Google Scholar] [CrossRef]
  13. Kranz, R.L. Microcracks in rocks: A review. Tectonophysics 1983, 100, 449–480. [Google Scholar] [CrossRef]
  14. Simmons, G.; Richter, D. The Physics and Chemistry of Minerals and Rocks; John Wiley & Sons Inc: New York, NY, USA, 1976; pp. 105–137. [Google Scholar]
  15. Meng, Q.B.; Wang, C.K.; Liu, J.F.; Zhang, M.W.; Lu, M.M.; Wu, Y. Physical and micro-structural characteristics of limestone after high temperature exposure. Bull. Eng. Geol. Environ. 2020, 79, 1259–1274. [Google Scholar] [CrossRef]
  16. Chen, L.J.; He, J.; Chao, J.Q.; Qin, B.D. Swelling and breaking characteristics of limestone under high temperatures. Min. Sci. Technol. 2009, 19, 503–507. [Google Scholar] [CrossRef]
  17. González-Gómez, W.S.; Quintana, P.; May-Pat, A.; Avilés, F.; May-Crespo, J.; Alvarado-Gil, J.J. Thermal effects on the physical properties of limestones from the Yucatan Peninsula. Int. J. Rock Mech. Min. Sci. 2015, 75, 182–189. [Google Scholar] [CrossRef]
  18. Yavuz, H.; Demirdag, S.; Caran, S. Thermal effect on the physical properties of carbonate rocks. Int. J. Rock Mech. Min. Sci. 2010, 47, 94–103. [Google Scholar] [CrossRef]
  19. Yang, J.; Fu, L.Y.; Zhang, W.; Wang, Z. Mechanical property and thermal damage factor of limestone at high temperature. Int. J. Rock Mech. Min. Sci. 2019, 117, 11–19. [Google Scholar] [CrossRef]
  20. Zhang, W.; Sun, Q.; Hao, S.; Wang, B. Experimental Study on the Thermal Damage Characteristics of Limestone and Underlying Mechanism. Rock Mech. Rock Eng. 2016, 49, 2999–3008. [Google Scholar] [CrossRef]
  21. Oates, J.A.H. Lime and Limestone. Chemistry and Technology, Production and Uses; Wiley-VCH: Weinheim, Germany, 1998. [Google Scholar]
  22. Rao, K.V.K.; Naidu, S.V.N.; Murthy, K.S. Precision lattice parameters and thermal expansion of calcite. J. Phys. Chem. Solids 1968, 29, 245–248. [Google Scholar] [CrossRef]
  23. Johansson, L. Energieffektiv Främstallning av Brända Barbonatprodukter—Orsaker Till Sönderfall; Lund University: Lund, Sweden, 2011. [Google Scholar]
  24. Kalasová, D.; Dvořák, K.; Slobodník, M.; Všianský, D.; Zikmund, T.; Dluhoš, J.; Váňa, R.; Bureš, J.; Kaiser, J. Characterization of inner structure of limestone by X-ray computed sub-micron tomography. Constr. Build. Mater. 2018, 174, 693–700. [Google Scholar] [CrossRef]
  25. Olsson, H. Prediction of the Degree of Thermal Breakdown of limestone: A Case Study of the Upper Ordovician Boda Limestone, Siljan District, Central Sweden; Lund University: Lund, Sweden, 2012. [Google Scholar]
  26. Jennerheim, J. Evaluation of methods to characterise the geochemistry of limestone and its fracturing in connection to heating. Master; Lund University: Lund, Sweden, 2016. [Google Scholar]
  27. Luque, A.; Ruiz-Agudo, E.; Cultrone, G.; Sebastián, E.; Siegesmund, S. Direct observation of microcrack development in marble caused by thermal weathering. Environ. Earth Sci. 2011, 62, 1375–1386. [Google Scholar] [CrossRef]
  28. Shushakova, V.; Fuller, E.R.; Siegesmund, S. Microcracking in calcite and dolomite marble: Microstructural influences and effects on properties. Environ. Earth Sci. 2013, 69, 1263–1279. [Google Scholar] [CrossRef]
  29. Shushakova, V.; Fuller, E.R.; Heidelbach, F.; Mainprice, D.; Siegesmund, S. Marble decay induced by thermal strains: Simulations and experiments. Environ. Earth Sci. 2013, 69, 1281–1297. [Google Scholar] [CrossRef]
  30. Vola, G. High-Grade Burnt Lime Products: Impact of Calcination Kinetics on Slaking Reactivity; Sticking Tendency and Blocks Formation at HT (1300 °C); University of Ferrara: Ferrara, Italy, 2019. [Google Scholar]
  31. Suzuki, Y.; Shiino, Y.; Bergström, J. Stratigraphy, carbonate facies and trilobite associations in the Hirnantian part of the Boda Limestone, Sweden. GFF 2009, 131, 299–310. [Google Scholar] [CrossRef]
  32. Sjöberg, O. Personal Communication; The Saskatchewan Mining Association: Regina, SK, Canada; p. 2020.
  33. Allared, J. XRF manual. SMA Miner. 2019. [Google Scholar]
  34. Eriksson, L.; Johansson, E.; Kettaneh-Wold, N.; Trygg, J.; Wikström, C.; Wold, S. Multi- and Megavariate Data Analysis; Second Revised and Enlarged Edition; Umetrics Academy: Umeå, Sweden, 2006. [Google Scholar]
  35. Berg, S.; Kutra, D.; Kroeger, T.; Straehle, C.N.; Kausler, B.X.; Haubold, C.; Schiegg, M.; Ales, J.; Beier, T.; Rudy, M.; et al. ilastik: Interactive machine learning for (bio)image analysis. Nat. Methods 2019, 16, 1226–1232. [Google Scholar] [CrossRef]
  36. Rueden, C.T.; Schindelin, J.; Hiner, M.C.; Dezonia, B.E.; Walter, A.E.; Arena, E.T.; Eliceiri, K.W. ImageJ2: ImageJ for the next generation of scientific image data. BMC Bioinform. 2017, 18, 529. [Google Scholar] [CrossRef]
  37. Schindelin, J.; Arganda-Carreras, I.; Frise, E.; Kaynig, V.; Longair, M.; Pietzsch, T.; Preibisch, S.; Rueden, C.; Saalfeld, S.; Schmid, B.; et al. Fiji: An open-source platform for biological-image analysis. Nat. Methods 2012, 9, 676–682. [Google Scholar] [CrossRef] [Green Version]
  38. Vola, G.; Christiansen, T.; Sarandrea, L.; Ferrari, V. Carbonate Rock Characterization for the Industrial Lime Manufacturing: Worldwide Case-Studies. In Proceedings of the 14th Euroseminar on Microscopy Applied to Building Materials, Copenhagen, Denmark, 10–14 June 2013. [Google Scholar]
  39. Beruto, D.; Barco, L. CO2-Catalyzed Surface Area and Porosity Changes in High-Surface-Area CaO Aggregates. J. Am. Ceram. Soc. 1984, 67, 512–515. [Google Scholar] [CrossRef]
  40. Borgwardt, R.H. Calcination kinetics and surface area of dispersed limestone particles. AlChE J. 1985, 31, 103–111. [Google Scholar] [CrossRef]
  41. Liu, J.; Li, B.; Tian, W.; Wu, X. Investigating and predicting permeability variation in thermally cracked dry rocks. Int. J. Rock Mech. Min. Sci. 2018, 103, 77–88. [Google Scholar] [CrossRef]
  42. Srinivasan, R. The thermal expansion of calcite from room temperature up to 400 °C. Proc. Indian Acad. Sci. Sect. A 1955, 42, 81–85. [Google Scholar] [CrossRef]
  43. Siegesmund, S.; Ullemeyer, K.; Weiss, T.; Tschegg, E.K. Physical weathering of marbles caused by anisotropic thermal expansion. Int. J. Earth Sci. 2000, 89, 170–182. [Google Scholar] [CrossRef]
Figure 1. Aerial photograph of Jutjärn quarry. The boreholes are numbered, and the sampled boreholes are marked with a red, blue, or green circle. Two samples were taken from the double-blue-marked boreholes for further investigation of crack formation. For a more detailed regional geological map, visit: https://apps.sgu.se/kartvisare/kartvisare-berg-50-250-tusen.html?zoom=-1202129.5840071687,6016943.2639965275,2381877.5840071687,7752946.7360034725 (accessed on: 10 August 2022).
Minerals 12 01197 g001
Figure 2. Example image of sample 71 (TD = 75%; heated up to 800 °C) showing the pixel classification. To the left, the yellow lines are user manual annotations of grain area, and the yellow surface is the predicted grain pixels. The blue lines inside the fractures are user manual annotations for fractures, and the light blue surface is the pixels interpreted as fractures. The original SEM image is to the right.
Minerals 12 01197 g002
Figure 3. Example of a probability map of sample 74 (TD = 4% TD; heated to 500 °C) in which the black pixels are predicted to be fractures and the white pixels are predicted to be grains.
Minerals 12 01197 g003
Figure 4. The PLS-DA score plot for the two first components colored according to classes (a) and the corresponding loading plot (b).
Minerals 12 01197 g004
Figure 5. SEM images of limestone and quicklimes of sample 74 (TD = 4%). (a) Limestone at ambient temperature, (b) heated to 500 °C, (c) heated to 800 °C, and (d) heated to 1150 °C.
Minerals 12 01197 g005
Figure 6. SEM images of limestone and quicklimes of sample 71 (TD = 75%). (a) Limestone at ambient temperature, (b) heated to 500 °C, (c) heated to 800 °C, and (d) heated to 1150 °C.
Minerals 12 01197 g006
Table 1. Thermal decrepitation evaluation methods.
Type of TestWeight [g]Size [mm]Max. Temperature [°C]Max. Time [min]Screen [mm]Reference
1Decrepitation test2 × 25012.5–19105012010Maerz [6]
2Thermal decrepitation5005–101000 60 5Nordkalk AB [9]
3Thermal decrepitation150–4005–101150 605SMA Mineral AB [7]
4Thermal decrepitation5005–101150605SMA Mineral AB [10]
5Mechanical degradation≥50037.5–4510501010Cimprogetti
[3,5]
6Decrepitation test12010–20900, 950, 1000, 1050604D. J. Harrison [8]
7Deterioration testNot specified810502402Lund method [10]
8The Pilkington test90.106–1.18104010Weight remaining after calcinationD. Dollimore [11]
9TG method0.040.09–2900Not specified Weight loss based on TG-DTG curvesD. Dollimore [11]
10TGA0.026–0.0280.106–1.181000Not specifiedWeight loss based on TG curves R. A. McCauley [12]
Table 2. The average chemical composition (XRF) and LOI values of 80 Jutjärn limestone samples.
CaO [wt.-%]MgO [wt.-%]Fe2O3 [wt.-%]SiO2 [wt.-%]Al2O3 [wt.-%]MnO [wt.-%]P2O5 [wt.-%]TiO2 [wt.-%]K2O [wt.-%]S
[wt.-%]
LOI [wt.-%]
Min.51.510.310.050.30.10.06<0.01<0.010.01<0.00541.09
Max.55.180.860.63.711.420.150.140.070.470.41243.9
Average53.840.520.211.420.490.090.020.020.140.0342.97
Std. dev0.810.120.120.750.280.020.020.010.090.050.61
LDL0.10.10.010.010.010.010.010.010.010.0050.01
Table 3. The XRF chemical compositions and thermal decrepitation values of two Jutjärn limestone samples chosen for further analysis.
SampleCaO
[wt.-%]
MgO [wt.-%]Fe2O3 [wt.-%]SiO2 [wt.-%]Al2O3 [wt.-%]MnO [wt.-%]P2O5 [wt.-%]TiO2 [wt.-%]K2O [wt.-%]S
[wt.-%]
LOI
[wt.-%]
TD
[%]
7154.680.460.080.460.160.070.01<0.010.030.0143.8375
7454.780.430.100.610.210.080.040.010.05<0.00543.504
Table 4. Summary of image analysis results of fractures for sample 74 (TD = 4%) based on three samples in each temperature group. T = temperature, DOC = degree of calcination, Avg. frac. Area = average fractured area, Avg. frac. Length = average length of fractures, Avg. frac. Width = average width of fractures.
TDOC
[%]
Avg. Frac.
Area
[%]
Avg. Frac.
Length
[mm]
Avg. Frac.
Width
[mm]
Structural Characteristics
Ambient00.60.1790.018Low number of fractures.
500 °C01.10.1660.018Low number of fractures.
800 °C761.90.2520.021Low number of fractures.
1150 °C1004.90.2750.004Increased cracking. Dense network of small cracks and some wide cracks.
Table 5. Summary of image analysis results of fractures for sample 71 (TD = 75%) based on three samples in each temperature group. T = temperature, DOC = degree of calcination, Avg. frac. Area = average fractured area, Avg. frac. Length = average length of fractures, Avg. frac. Width = average width of fractures.
TDOC
[%]
Avg. Frac.
Area
[%]
Avg. Frac.
Length
[mm]
Avg. Frac.
Width
[mm]
Structural Characteristics
Ambient03.80.1720.018Low number of fractures.
500 °C597.00.3730.016Major cracking with grain boundary and intergranular cracks.
800 °C6510.50.3700.017Increased cracking with grain boundary and intergranular cracks.
1150 °C1004.00.2870.020Reduced cracking. Less frequent crack network in comparison to samples with 4% TD (Figure 5d).
Publisher’s Note: MDPI stays neutral with regard to jurisdictional claims in published maps and institutional affiliations.

