
Identifying Pseudorutile and Kleberite Using Raman Spectroscopy


Abstract
:1. Introduction
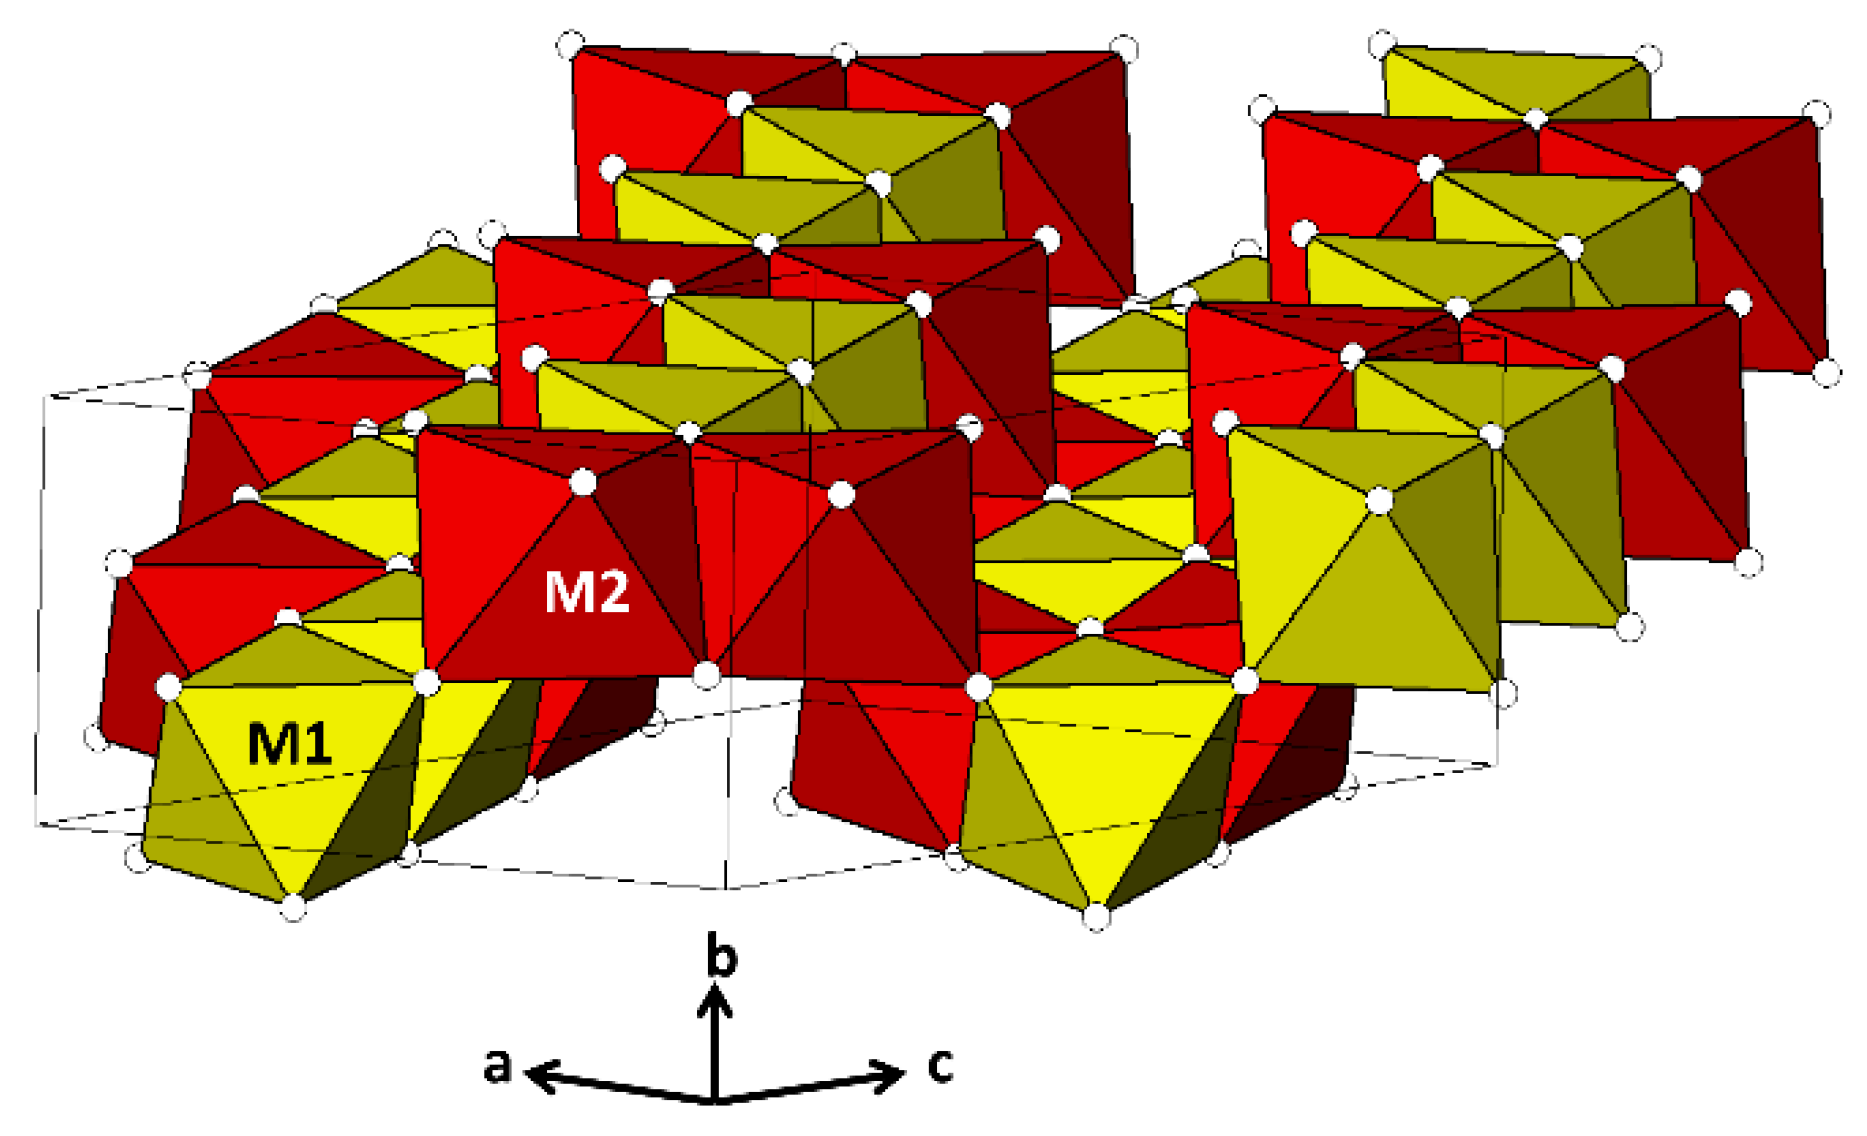
2. Review of Crystal Structure and Mineralogical Status of Pseudorutile and Kleberite
3. Materials and Methods
4. Results
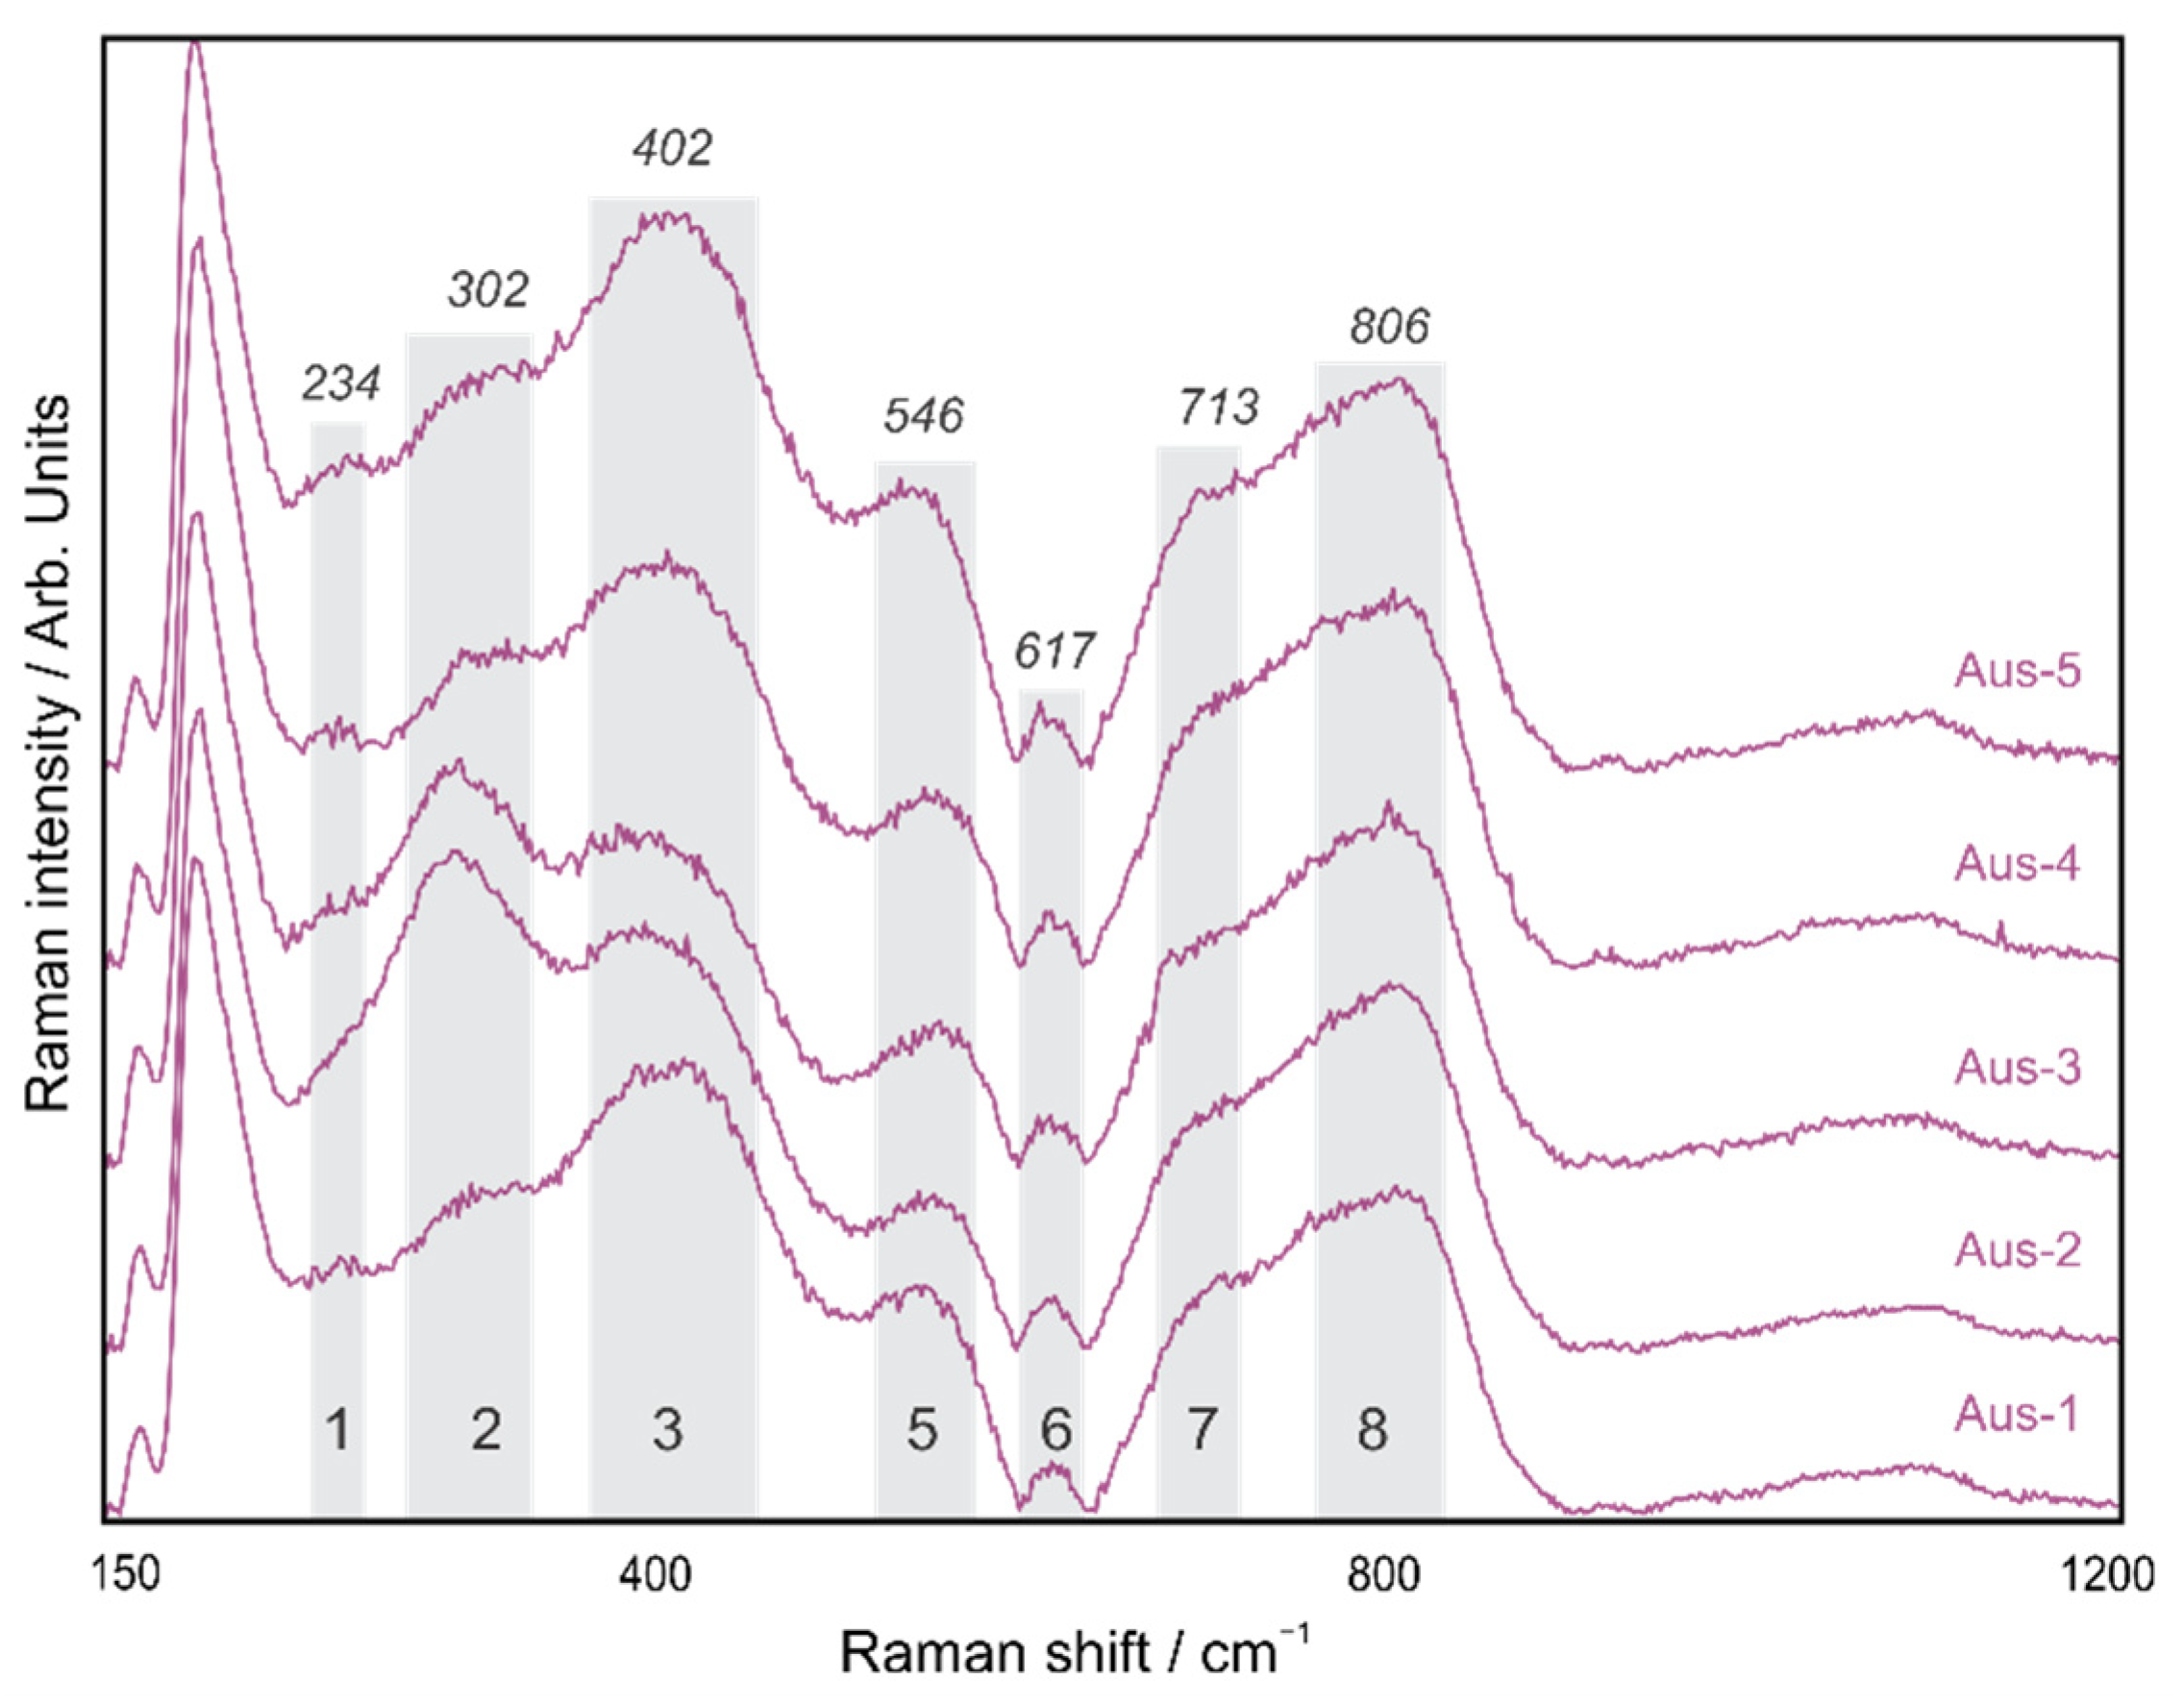
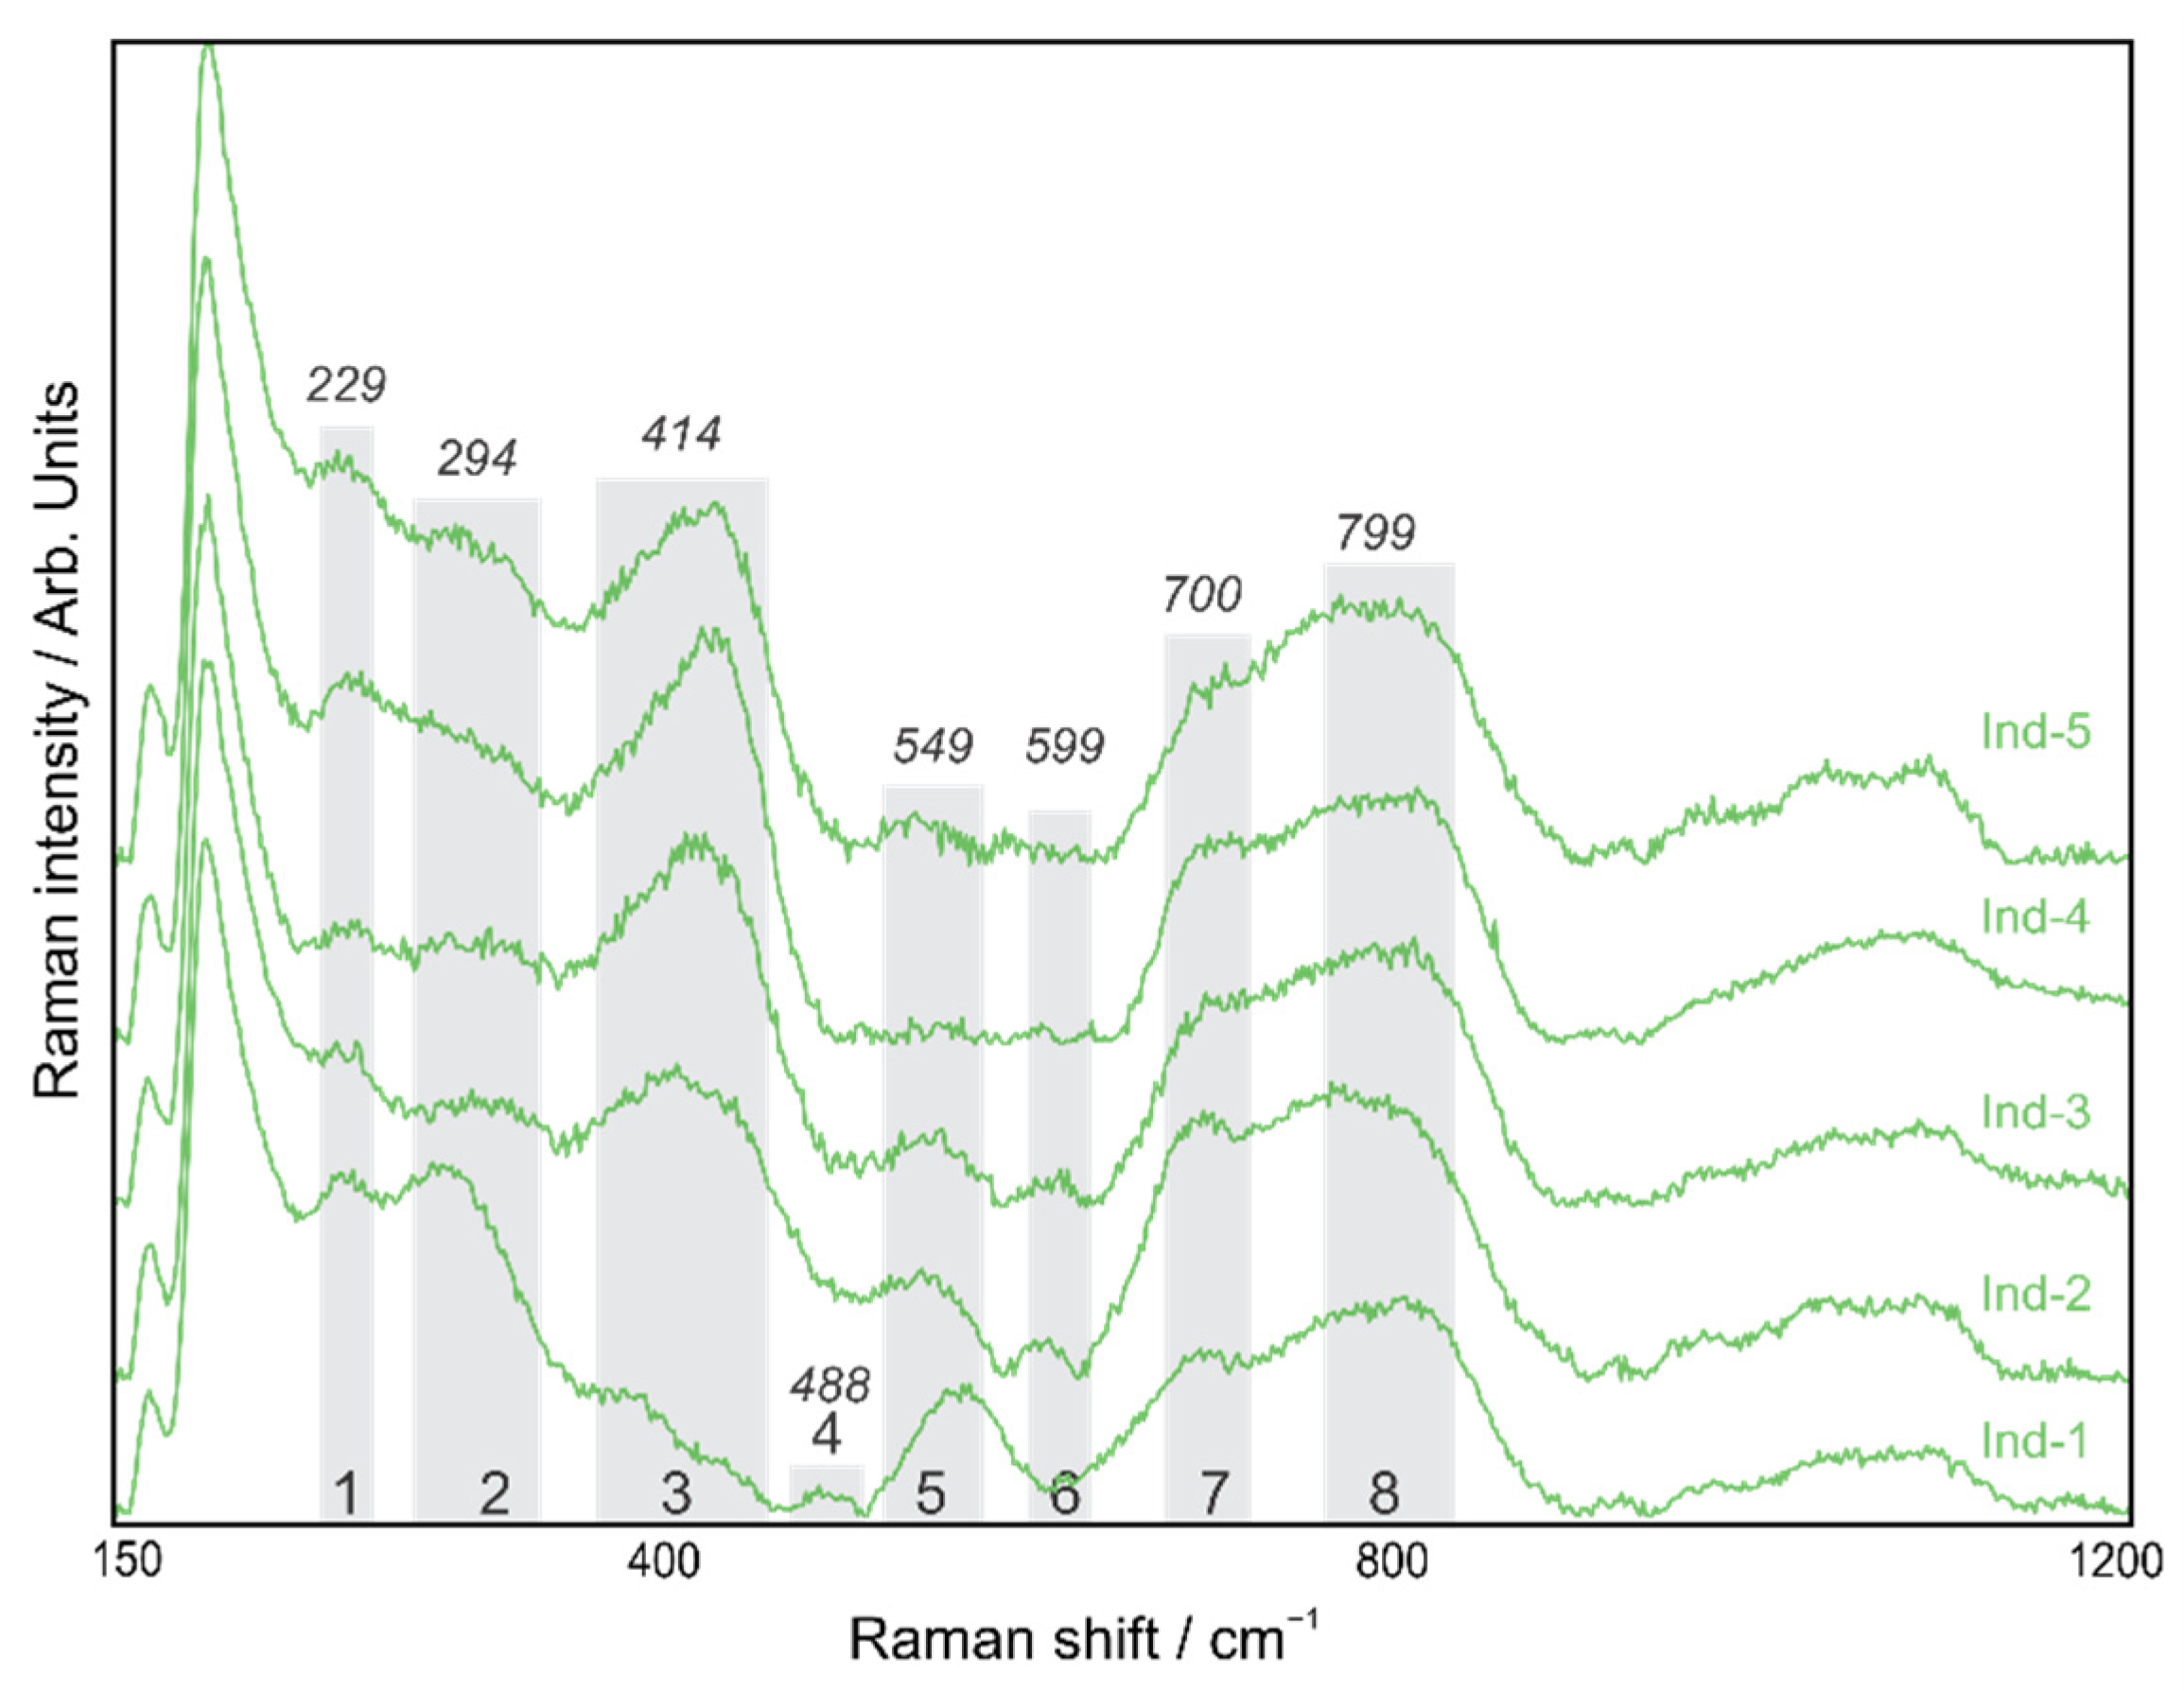
4.1. Pseudorutile
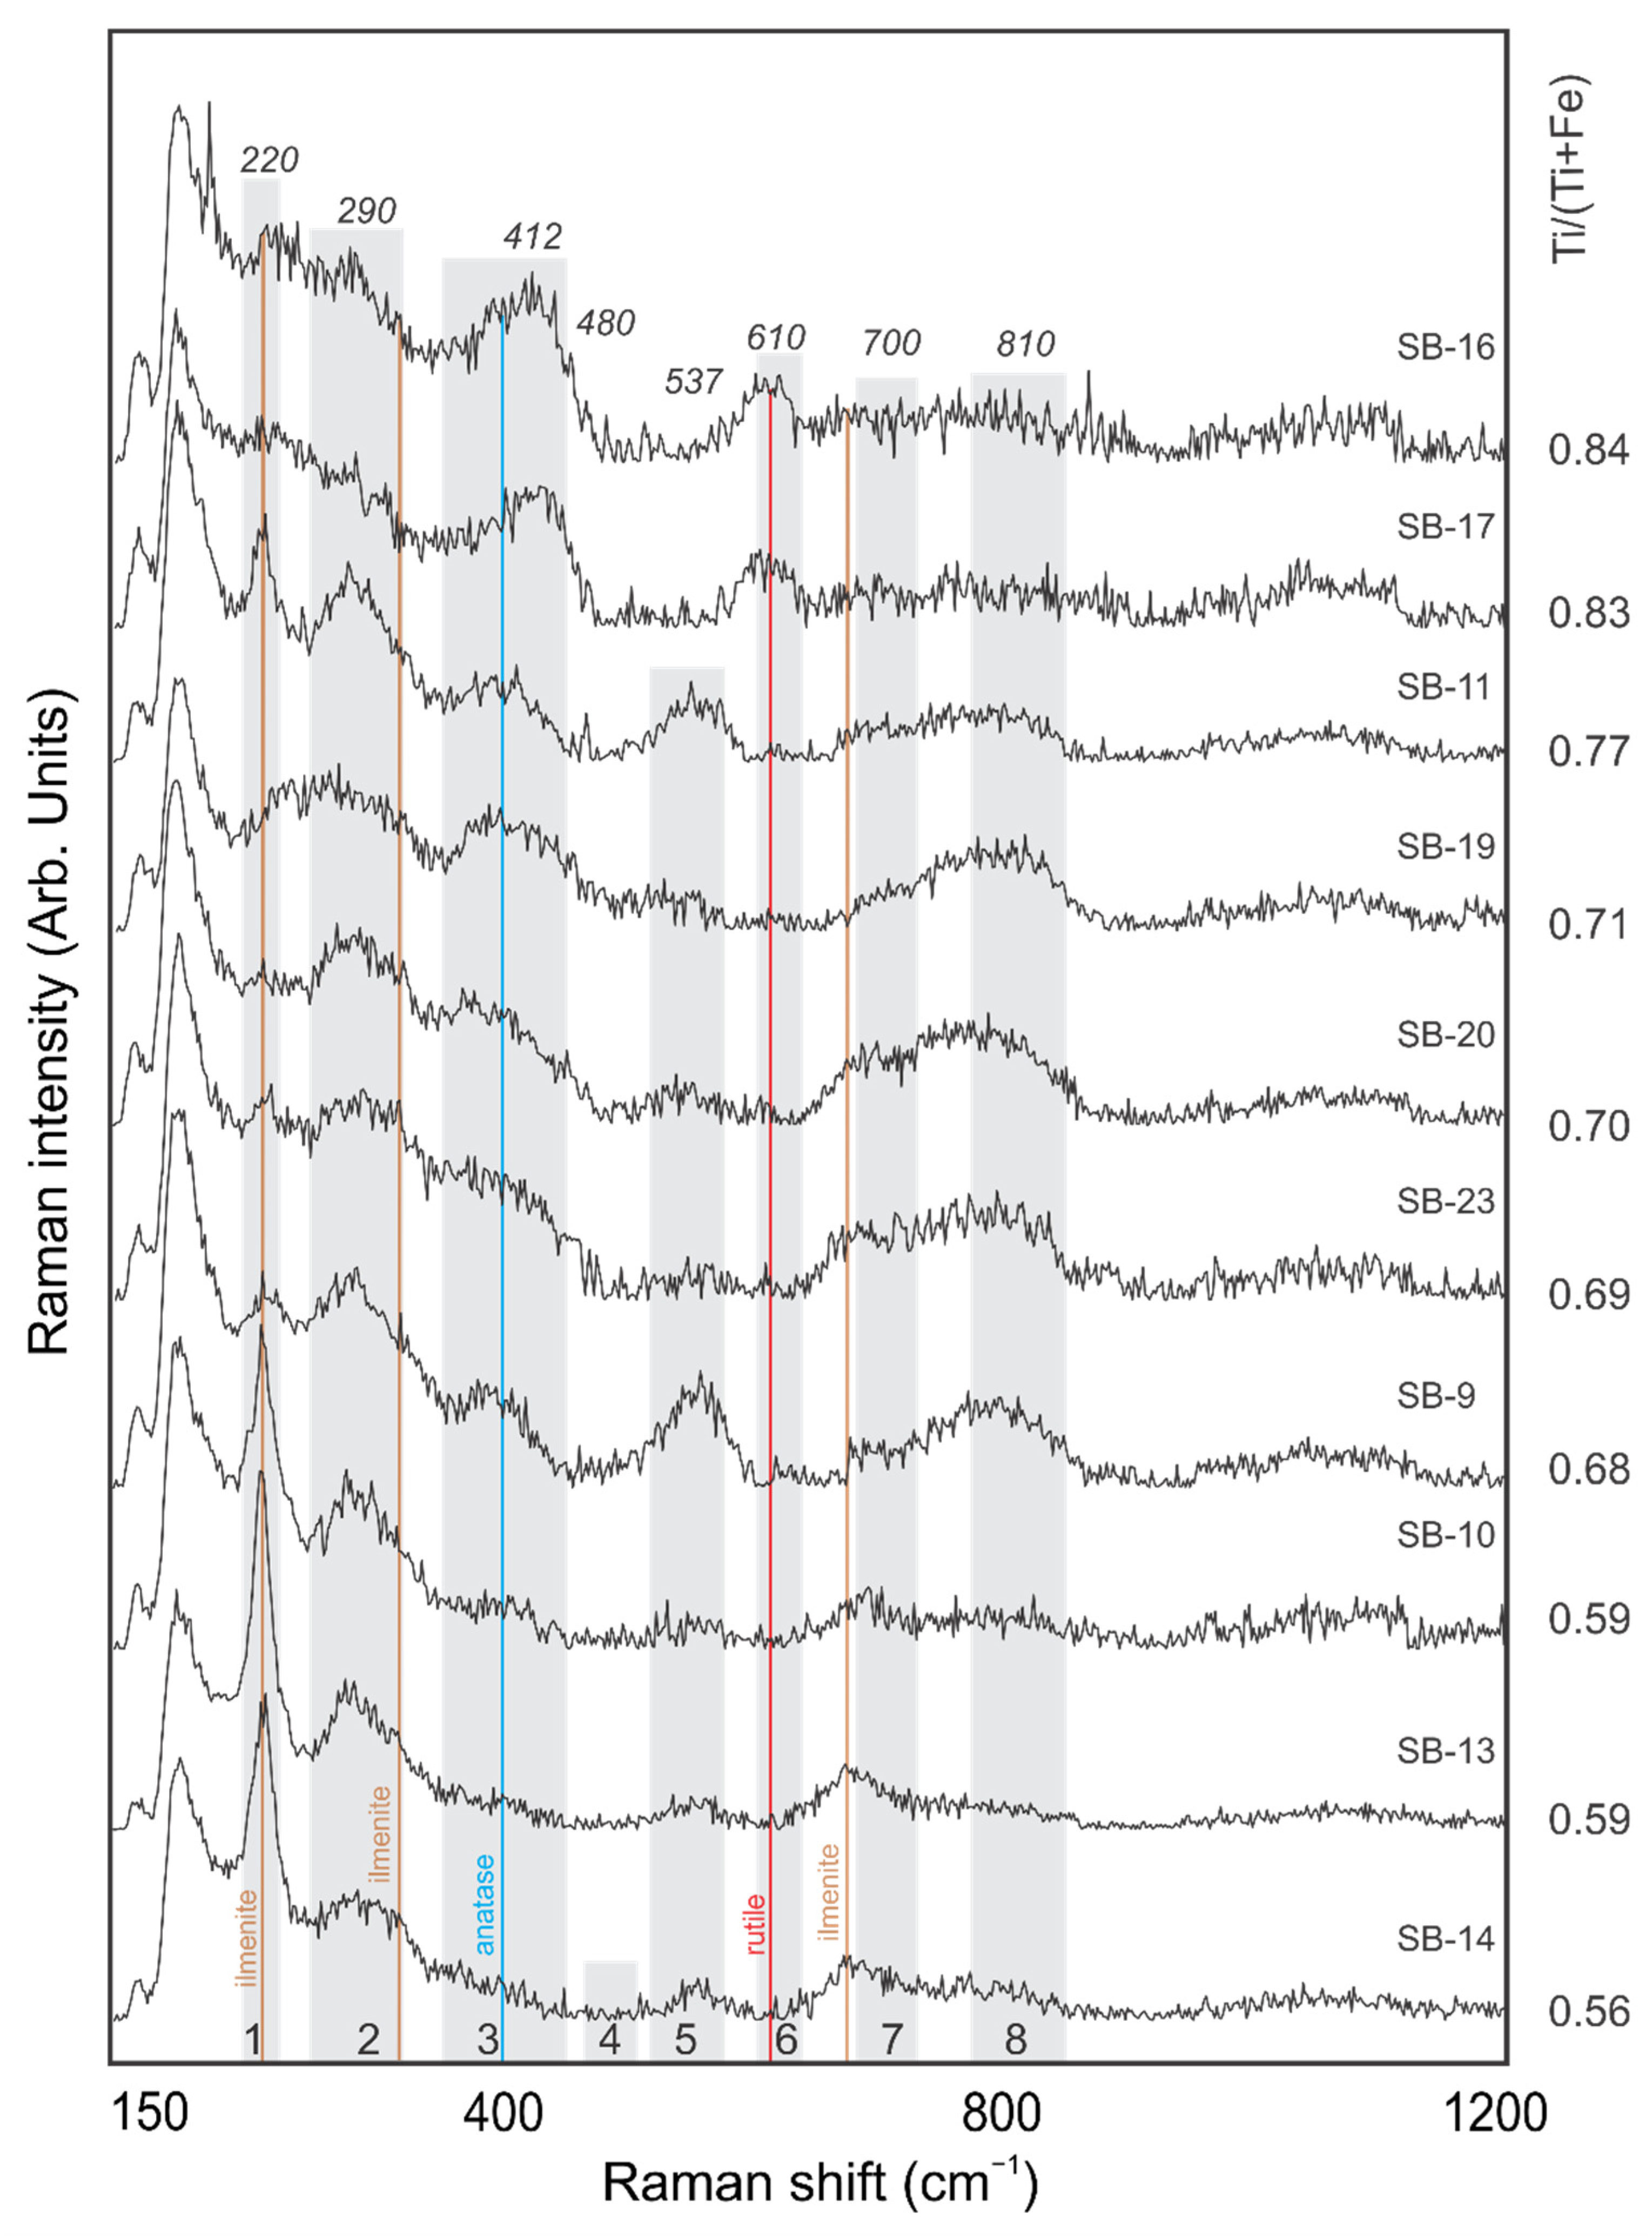
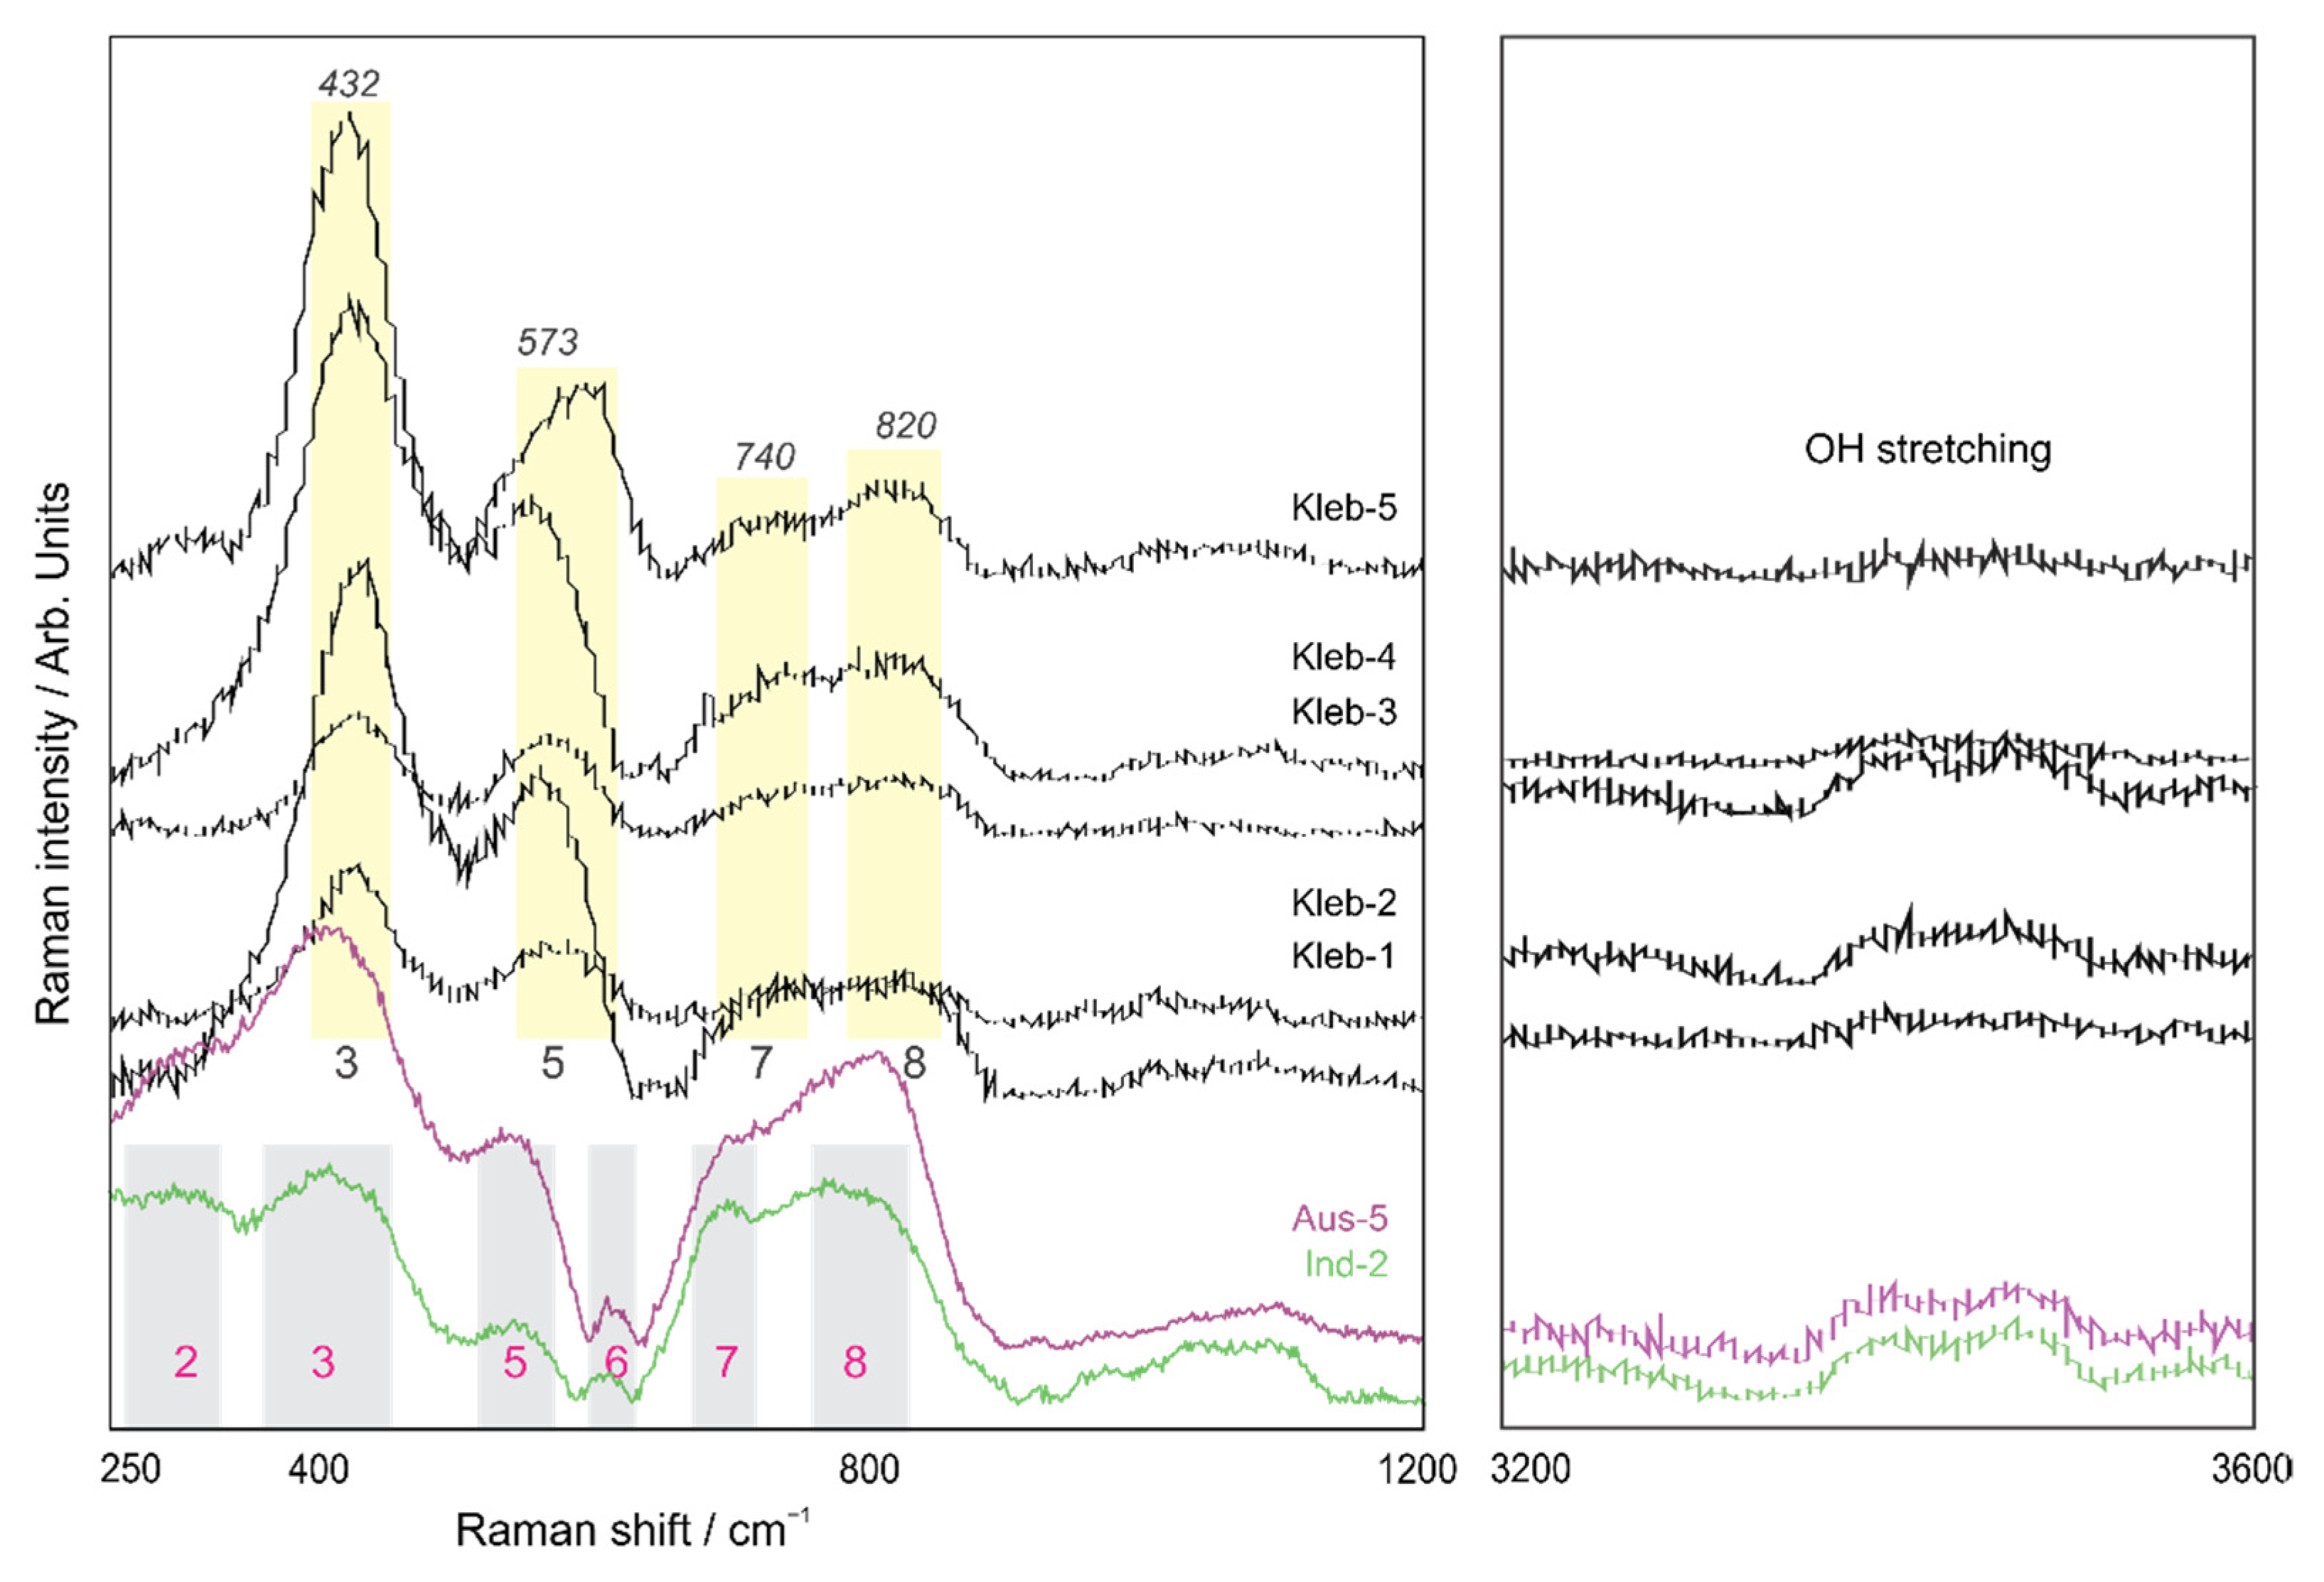
4.2. Kleberite
5. Discussion
6. Conclusions
Supplementary Materials
Author Contributions
Funding
Data Availability Statement
Acknowledgments
Conflicts of Interest
References
- Temple, A.K. Alteration of ilmenite. Econ. Geol. 1966, 61, 695–714. [Google Scholar] [CrossRef]
- Teufer, G.; Temple, A.K. Pseudorutile–a new mineral intermediate between ilmenite and rutile in the alteration of ilmenite. Nature 1996, 211, 179–181. [Google Scholar] [CrossRef]
- Frost, M.T.; Grey, I.E.; Harrowfield, I.R.; Mason, K. The dependence of alumina and silica contents on the extent of alteration of weathered ilmenites from western Australia. Mineral. Mag. 1983, 47, 201–208. [Google Scholar] [CrossRef]
- Anand, R.R.; Gilkes, R.J. Weathering of ilmenite in a lateritic pallid zone. Clays Clay Miner. 1984, 32, 363–374. [Google Scholar] [CrossRef]
- Puffer, J.H.; Cousminer, H.L. Factors controlling the accumulation of titanium-iron oxide-rich sands in the Cohansey Formation, Lakehurst Area, New Jersey. Econ. Geol. 1982, 77, 377–391. [Google Scholar] [CrossRef]
- Schulz, B.; Haser, S. The ilmenite-pseudorutile-leucoxene alteration sequence in placer deposits in the view of automated SEM mineral liberation analysis. GeoBerlin 2015, 2015, 336. [Google Scholar]
- Morad, S.; Aldahan, A.A. Alteration of detrital Fe-Ti oxides in sedimentary rocks. Geol. Soc. Am. Bull. 1986, 97, 567–578. [Google Scholar] [CrossRef]
- Grey, I.E.; Watts, J.A.; Bayliss, P. Mineralogical nomenclature: Pseudorutile revalidated and neotype given. Mineral. Mag. 1994, 58, 597–600. [Google Scholar] [CrossRef]
- Pe-Piper, G.; Piper, D.J.W.; Dolansky, L. Alteration of ilmenite in the Cretaceous sandstones of Nova Scotia, southeastern Canada. Clays Clay Miner. 2005, 53, 490–510. [Google Scholar] [CrossRef]
- Steinike, K. Der Kleberit im nordöstlichen Teil Deutschlands (1949–1990 Staatsgebiet der DDR). Geohistorische Blätter 2008, 11, 121–128. [Google Scholar]
- Pownceby, M.I. Alteration and associated impurity element enrichment in detrital ilmenites from the Murray Basin, southeast Australia: A product of multistage alteration. Aust. J. Earth Sci. 2010, 52, 243–258. [Google Scholar] [CrossRef]
- Grey, I.E.; Li, C. Hydroxylian pseudorutile derived from picroilmenite in the Murray Basin, southeastern Australia. Mineral. Mag. 2003, 67, 733–747. [Google Scholar] [CrossRef]
- Grey, I.E.; Bordet, P.; Wilson, N.C.; Townend, R.; Bastow, T.J.; Brunelli, M. A new Al-rich hydroxylian pseudorutile from Kalimantan, Indonesia. Am. Mineral. 2010, 95, 161–170. [Google Scholar] [CrossRef]
- Grey, I.E.; Reid, A.F. The structure of pseudorutile and its role in the natural alteration of ilmenite. Am. Mineral. 1975, 60, 898–906. [Google Scholar]
- Bautsch, H.J.; Rohde, G.; Sedlacek, P.; Zedler, A. Kleberit-Ein neues Eisen-Titan-Oxidmineral aus Tertiären Sanden. Z. für Geol. Wiss. 1978, 6, 661–671. [Google Scholar]
- Grey, I.E.; Steinike, K.; MacRae, C.M. Kleberite, Fe3+Ti6O11(OH)5, a new ilmenite alteration product, from Konigshain, northeast Germany. Mineral. Mag. 2013, 77, 45–55. [Google Scholar] [CrossRef]
- Warr, L.N. IMA–CNMNC approved mineral symbols. Mineral. Mag. 2021, 85, 291–320. [Google Scholar] [CrossRef]
- Dyadchenko, M.G.; Khatuntseva, A.Y. Mineralogy and petrology of the weathering process in ilmenite. Dokl. Akad. Nauk. SSSR 1960, 132, 435–458. [Google Scholar]
- Grey, I.E.; Li, C.; Watts, J.A. Hydrothermal synthesis of goethite-rutile intergrowth structures and their relationship to pseudorutile. Am. Mineral. 1983, 68, 981–988. [Google Scholar]
- Grey, I.E.; Nickel, E.H. Tivanite, a new oxyhydroxide mineral from Western Australia, and its structural relationship to rutile and diaspore. Am. Mineral. 1981, 66, 866–871. [Google Scholar]
- RRUFF Database. Available online: http://rruff.info/about/about_general.php (accessed on 4 September 2022).
- Lafuente, B.; Downs, R.T.; Yang, H.; Stone, N. The power of databases: The RRUFF project. In Highlights in Mineralogical Crystallography; Armbruster, T., Danisi, R.M., Eds.; W. De Gruyter: Berlin, Germany, 2015; pp. 1–30. [Google Scholar]
- RRUFF Database: Goethite; RRUFF IDs R050142.3, R120086, X050093, X050091. Available online: https://rruff.info/goethite/display=default/ (accessed on 4 September 2022).
- RRUFF Database: Rutile; RRUFF IDs R040049.3, R050031.3, R050417.3. Available online: https://rruff.info/rutile/display=default/ (accessed on 4 September 2022).
- Blanch, A.J.; Quinton, J.S.; Lenehan, C.E.; Pring, A. The crystal chemistry of Al-bearing goethites: An infrared spectroscopic study. Mineral. Mag. 2008, 72, 1043–1056. [Google Scholar] [CrossRef]
- Sklute, E.C.; Kashyap, S.; Dyar, M.D.; Holden, J.F.; Tague, T.; Wang, P.; Jaret, S.J. Spectral and morphological characteristics of synthetic nanophase iron (oxyhydr)oxides. Phys Chem Miner. 2018, 45, 1–26. [Google Scholar] [CrossRef] [PubMed]

| Pseudorutile | Kleberite | ||||||
|---|---|---|---|---|---|---|---|
| South Australia | Indonesia | Scotian B. | South Australia | ||||
| This Study EMP (5 Grains) Average | (Grey and Reid (1975) [14] | This Study EMP (5 Grains) Average | (Grey and Reid (1975) [14] | This Study EMP (10 Grains) Average | This Study SEM (5 Grains) Average | (Grey et al., 2013) [16] | |
| SiO2 | 0.2 | b.d. | 0.3 | b.d. | 0.54 | 1.2 | 1.70 |
| TiO2 | 58.0 | 58.84 | 60.8 | 63.02 | 63.19 | 71.6 | 69.30 |
| Al2O3 | 0.2 | b.d. | 0.4 | b.d. | 0.39 | 1.4 | 2.50 |
| FeOt | 31.9 | 35.89 | 25.3 | 30.51 | 27.57 | 8.6 | 10.30 |
| Cr2O3 | b.d. | b.d. | b.d. | b.d. | 0.10 | b.d. | b.d. |
| MgO | 0.3 | b.d. | b.d. | b.d. | 0.09 | 0.4 | 0.46 |
| MnO | 0.7 | 0.6 | 2.8 | 2.87 | 1.12 | b.d. | 0.21 |
| CaO | 0.1 | b.d. | b.d. | b.d. | 0.03 | b.d. | b.d. |
| Na2O | b.d. | b.d. | b.d. | b.d. | 0.07 | 0.6 | b.d. |
| P2O5 | b.d. | b.d. | b.d. | b.d. | b.d. | 0.6 | 0.41 |
| ZnO | b.d. | b.d. | b.d. | b.d. | 0.05 | b.d. | b.d. |
| Nb2O5 | b.d. | b.d. | 0.4 | b.d. | 0.06 | b.d. | b.d. |
| BaO | b.d. | b.d. | b.d. | b.d. | 0.12 | b.d. | b.d. |
| ZrO2 | b.d. | b.d. | b.d. | b.d. | 0.02 | b.d. | b.d. |
| V2O5 | b.d. | b.d. | b.d. | b.d. | 0.07 | 1.2 | 0.30 |
| H2O | n.d. | 3.24 | n.d. | 2.08 | n.d. | n.d. | 10.90 |
| Total | 91.6 | 98.57 | 90.1 | 98.48 | 93.42 | 84.0 | 96.10 |
| Band no. | Goethite and *Rutile | Pseudorutile | Kleberite | ||||
|---|---|---|---|---|---|---|---|
| [23,24] | This Study | ||||||
| S. Austr. | Indonesia | Scotian B. | S. Austr. | ||||
| 1 | A1g | Fe-O sym str | 223 | 234 | 229 | 220 | - |
| 2 | Eg | Fe-OH sym bend | 298 | 302 | 294 | 290 | - |
| 3 | Eg | Fe-O-Fe/-OH sym str | 397 | 402 | 414 | 412 | 432 |
| 4 | A1g | Fe-OH asym str | 477 | - | 488 | 480 | - |
| 5 | - | Fe-OH asym str | 548 | 546 | 549 | 537 | 573 |
| 6 | *A1g | *Ti-O | *615 | 617 | 599 | 610 | - |
| 7 | - | Fe-O sym str | 678 | 713 | 700 | 700 | 740 |
| 8 | - | - | 806 | 799 | 810 | 820 | |
Publisher’s Note: MDPI stays neutral with regard to jurisdictional claims in published maps and institutional affiliations. |
© 2022 by the authors. Licensee MDPI, Basel, Switzerland. This article is an open access article distributed under the terms and conditions of the Creative Commons Attribution (CC BY) license (https://creativecommons.org/licenses/by/4.0/).
Share and Cite
Imperial, A.; Pe-Piper, G.; Piper, D.J.W.; Grey, I.E. Identifying Pseudorutile and Kleberite Using Raman Spectroscopy. Minerals 2022, 12, 1210. https://doi.org/10.3390/min12101210
Imperial A, Pe-Piper G, Piper DJW, Grey IE. Identifying Pseudorutile and Kleberite Using Raman Spectroscopy. Minerals. 2022; 12(10):1210. https://doi.org/10.3390/min12101210
Chicago/Turabian StyleImperial, Alexis, Georgia Pe-Piper, David J. W. Piper, and Ian E. Grey. 2022. "Identifying Pseudorutile and Kleberite Using Raman Spectroscopy" Minerals 12, no. 10: 1210. https://doi.org/10.3390/min12101210
APA StyleImperial, A., Pe-Piper, G., Piper, D. J. W., & Grey, I. E. (2022). Identifying Pseudorutile and Kleberite Using Raman Spectroscopy. Minerals, 12(10), 1210. https://doi.org/10.3390/min12101210