Article

Comprehensive Characterization Integrating Static and Dynamic Data for Dynamic Fractures in Ultra-Low Permeability Reservoirs: A Case Study of the Chang 6 Reservoir of the Triassic Yanchang Formation in the Ordos Basin, China

PetroChina Research Institute of Petroleum Exploration & Development, Beijing 100083, China
*
Author to whom correspondence should be addressed.
Minerals 2022, 12(10), 1277; https://doi.org/10.3390/min12101277
Submission received: 21 September 2022 / Revised: 9 October 2022 / Accepted: 10 October 2022 / Published: 11 October 2022
(This article belongs to the Special Issue Reservoir Geology and Oil & Gas Reservoir Characterization)

Abstract

:
The generation of dynamic fractures during the process of water injection in ultra-low permeability reservoirs aggravates the heterogeneity of the reservoir, resulting in a rapid rise of water cut and directional flooding of the producers, which affects waterflood sweep efficiency and recovery. A dynamic fracture, as the geological feature of ultra-low permeability reservoirs, has a complex genetic mechanism and is difficult to characterize. Taking the Chang 6 reservoir of the Triassic Yanchang Formation in the Ordos Basin of central China as an example, this paper presents the characterization method and workflow of dynamic fractures. On the one hand, through the analysis of triaxial-compression rock-mechanic experiments and the mineral composition of the core, we evaluated rock brittleness in order to identify the lithology that can easily generate new fractures. On the other hand, beginning with the ancient tectonic stress field and combining the fracture characteristics of core and geological outcrop, the multi-fractal method and the probabilistic neural network were applied to identify the natural fractures and to quantitatively predict the intensity of natural fractures. Based on the rock brittleness evaluation and the natural fracture feature, the intensity of dynamic fractures was characterized by integrating the analysis of the bottom hole pressure, fracture pressure, and production response characteristics. A dynamic fracture is a “double-edged sword” during the waterflooding development of ultra-low permeability reservoirs. The premature activation and generation of dynamic fractures could lead to a worse development status. Nevertheless, the rational control and utilization of dynamic fractures play a positive role in improving oil recovery. Dynamic fractures are of great significance to the optimization and adjustment of well patterns for ultra-low permeability reservoirs. This can provide a reference for similar reservoirs.

1. Introduction

Dynamic fractures, as a new geological feature in the waterflood development of ultra-low permeability reservoirs [1], have a significant influence on recovery and have attracted attention from technicians. Dynamic fractures are new fractures generated when the bottom hole pressure (BHP) exceeds the crack and extension pressure due to the holding pressure near the wellbore area of the injectors in the process of water injection of ultra-low permeability reservoirs. Alternatively, the dynamic fractures can also indicate the effective fracture-channel generation by the reactivation of natural fractures, which are closed and filled in the original state [1]. Dynamic fractures may undergo dynamic changes during the waterflood process: open–extend to maximum–shrink [2,3].
It is now well established that thermo-elastic effects substantially change the magnitude and orientation of in situ stress, which induces fracture generation [4]. An approximate but convenient and explicit method for estimating induced stresses has been given [5]. Based on the mechanisms of dynamic fracture generation [5,6,7], crack propagation was studied through experiments [8]. In the process of water injection, the scale of dynamic fractures is related to geological and reservoir parameters, such as fluid mobility, mobility ratio, 3D saturation distribution, positions of producers and injectors, and flow baffles [3]. The quality, rate, and temperature of injection water and reservoir permeability are also relatively important for the growth of fractures [9]. By establishing the mathematical model describing the dynamic changes of fracture geometry and properties [2], the fluid-flow and fracture growth (fully coupled) within the framework of an existing ‘standard’ reservoir simulator were combined in a model [3] for simulating the dynamic growth of cracks [3,5] and to study the influence on sweep efficiency [10]. A reasonable control for the growth of dynamic fractures [11,12], such as the optimization of well patterns, fracture directions and contaminated degree of injection water, can maximize the recovery [13,14,15]. With the deepening of oilfield development, the permeability of fractures in different directions will change dynamically [16,17]. Dynamic fractures interact with existing fractures [18], and the simulation results demonstrate the sensitivity of fracture geometry to stress difference and natural fracture orientation [19,20]. It is difficult to characterize dynamic fractures because of their complex genetic mechanisms and dynamic variation.

2. Dynamic Fracture Characterization Method and Workflow

A dynamic fracture is an important factor controlling the remaining oil distribution of ultra-low permeability reservoirs [1,3]. The characterization of dynamic fractures involves many disciplines, such as rock mechanics, tectonic stress, geology, and reservoir engineering, etc. The two causes of dynamic fractures are new fractures opening in the weak surfaces of rock strata, and the reactivation and extension of natural fractures from ineffective to effective during water injection [1]. The current tectonic stress field controls the extension direction of dynamic fractures.
Regarding the characterization of dynamic fractures, on the one hand, rocks that can relatively easily form new fractures can be identified by the evaluation of rock brittleness, based on the analysis of the rock mineral composition and triaxial-compression mechanics experiments. On the other hand, based on the paleo-tectonic stress field analysis, a combination of the core and geological outcrop observation, the multi-fractal method, and the probabilistic neural network can be applied to identify natural fractures and to quantitatively describe the intensity of the natural fractures. The current tectonic stress magnitude and orientation could be obtained by induced fractures and artificial hydraulic fracturing. Based on the static fracture description, combined with the BHP, the fracture pressure, and the production response characteristics—rising in a stepped manner from the water cut of the producers, the peak shape of the water-absorption profile of the injectors, the fracture-seepage characteristics of the well-testing interpretation, and the obvious directionality of the tracer monitoring—the dynamic fracture distribution intensity can be characterized (Figure 1).

3. Comprehensive Characterization of Dynamic Fractures

The Chang 6 Member of the Triassic Yanchang Formation in the Ordos Basin is a typical ultra-low permeability reservoir with a porosity of less than 15% and a permeability of less than 10 mD. The reservoir is a set of fluvial–deltaic clastic deposits. The lithological profile is mainly composed of interlayers of grayish-brown fine sandstone, gray siltstone, grayish-black mudstone, and grayish-white fine sandstone. At present, in the medium–high water-cut stages, the major development problem is the directional waterflooding of the producers, which is mainly caused by dynamic fractures.

3.1. Brittleness Evaluation

One type of dynamic fracture arises when the BHP exceeds the fracture pressure, and new fractures open from the weak surface of the rock and continue to extend. Alternatively, some short-scale fractures with variable orientations appear near the borehole due to the detonation and composite perforation of injectors in order to improve the injection capacity, which continue to extend with the increase in water-injection volume and pressure.
The formation of this type of dynamic fracture is related to the brittleness of rock strata. The greater the rock brittleness, the more likely it is to fracture and form dynamic fractures. In this study, the brittleness index was calculated via rock-mineral-composition analysis and the rock mechanical parameters to identify the lithologic sections prone to the formation of dynamic fractures.

3.1.1. Analysis of Rock Mechanic Parameter Experiment

Rock mechanic parameters are used to characterize the brittleness based on the stress–strain relationship of rock, which is represented by Young’s modulus for longitudinal deformation and Poisson’s ratio for lateral deformation. High brittleness is represented by a high Young’s modulus and a low Poisson’s ratio [21]. Three types of lithology (brown fine sandstone, grayish-white calcareous sandstone, and greyish-black siltstone) were selected for triaxial-compression mechanics experiments, and the rock mechanical parameters, such as Young’s modulus and the Poisson’s ratio, were measured. According to the variation in the Young’s modulus and Poisson’s ratio of the sandstone and mudstone in the Yanchang Formation, the brittleness index was calculated by the formula presented in Ref. [21]. Among the three selected lithologies, brown fine sandstone had the best oil-bearing property, followed by the greyish-black siltstone, and the greyish-white calcareous sandstone cannot be used as a reservoir. From the analysis of the experimental results (Table 1), it can be seen that the greyish-white calcareous sandstone had the highest brittleness, followed by the brown fine sandstone, and the greyish-black siltstone had the lowest brittleness.

3.1.2. Analysis of Rock Mineral Composition

From the analysis of rock mineralogical characteristics, the reservoir lithology of the Chang 6 Member of the Yanchang Formation in the Triassic was mainly fine-grained lithic feldspar sandstone, with an average quartz content of 21.1%, feldspar content of 50.4%, and rock debris content of 11.5%. The clay minerals were mainly chlorite. The composition maturity was low, and the texture maturity was medium.
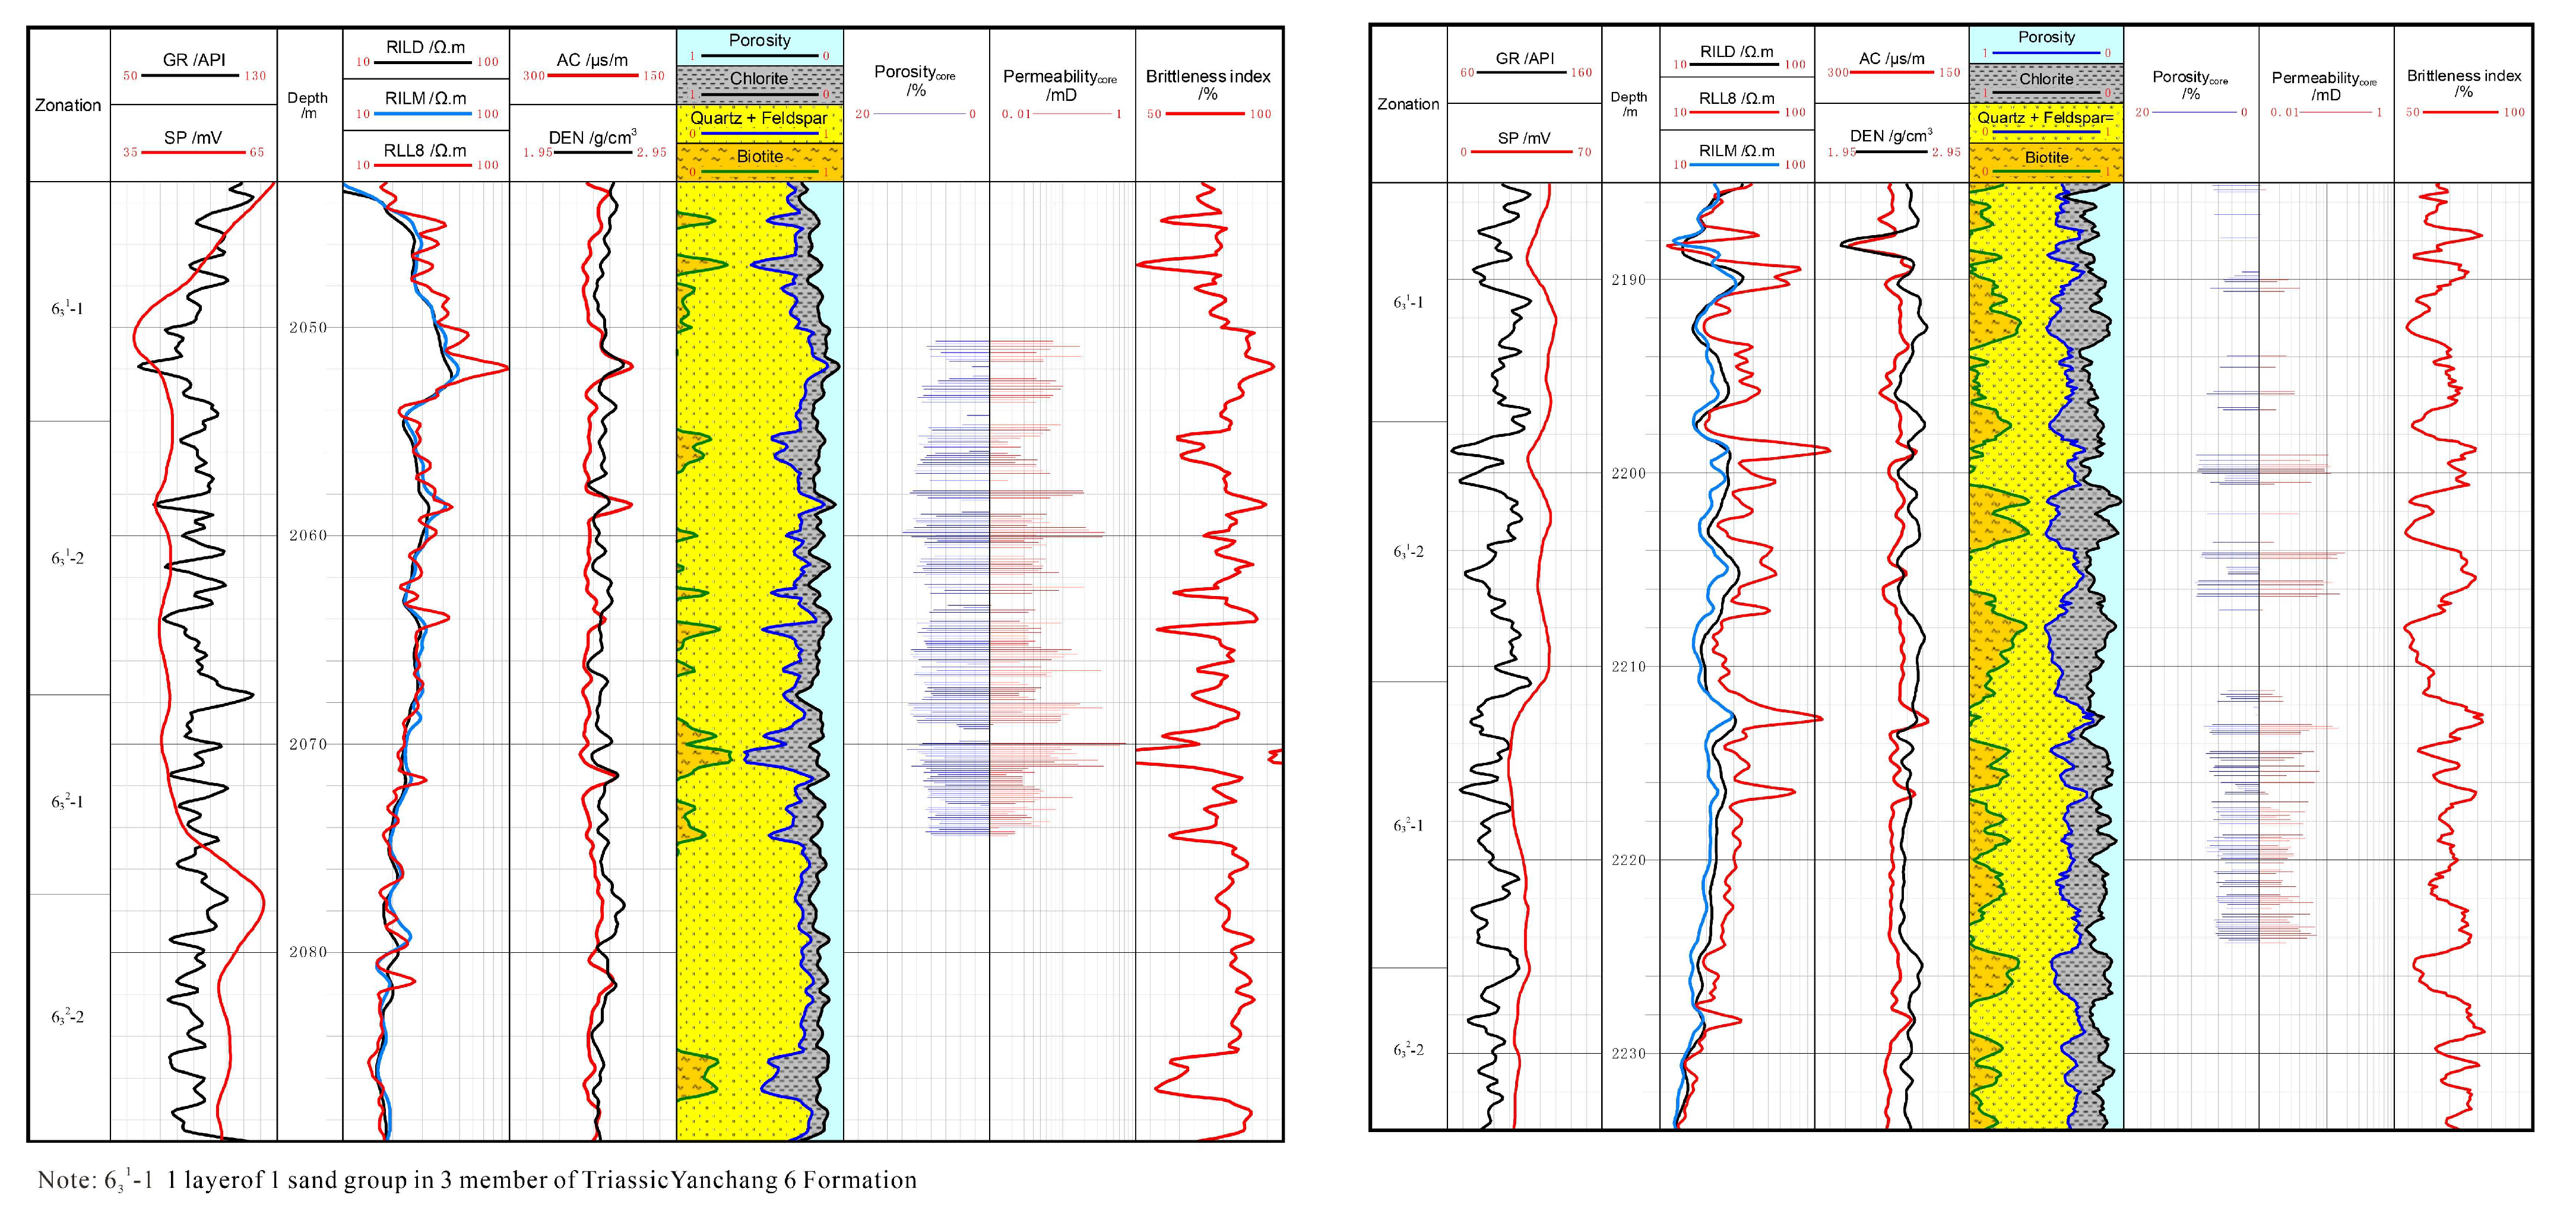
According to the content of brittle minerals in the rock mineral composition, the rock brittleness can be approximately assessed. Rock with a high content of brittle minerals may have high brittleness. The brittleness can be calculated by the percentage of brittle minerals, such as quartz, feldspar, and carbonate in the total minerals [21]. Through a comparative analysis of the B153 area, the brittleness index in the northern area was found to be high, with an average of 74%, and that of the southern area was relatively low, with an average of 61%. The northern area had a lower clay content, lower plastic mineral content, such as rock debris and mica, and a higher brittle mineral content, such as quartz and feldspar, which consequently caused this area to show higher brittleness index values than the southern area. This is one of the reasons that dynamic fractures are relatively more developed in the northern area compared to the southern area. Figure 2 shows the results of calculating the brittleness index of two typical wells, respectively, in the northern and southern parts of the B153 area.
The intensity of dynamic fractures is related to the lithology. A higher brittle mineral content resulted in a greater Young’s modulus, lower Poisson’s ratio, and stronger brittleness, indicating that it is easier to crack. With the increase in water-injection pressure and volume, the newly formed fracture continued to extend and eventually connected with the hydraulic fractures in the producers, forming fracture-seepage channels, which affects the oilfield development effect.

3.1.3. Case Analysis

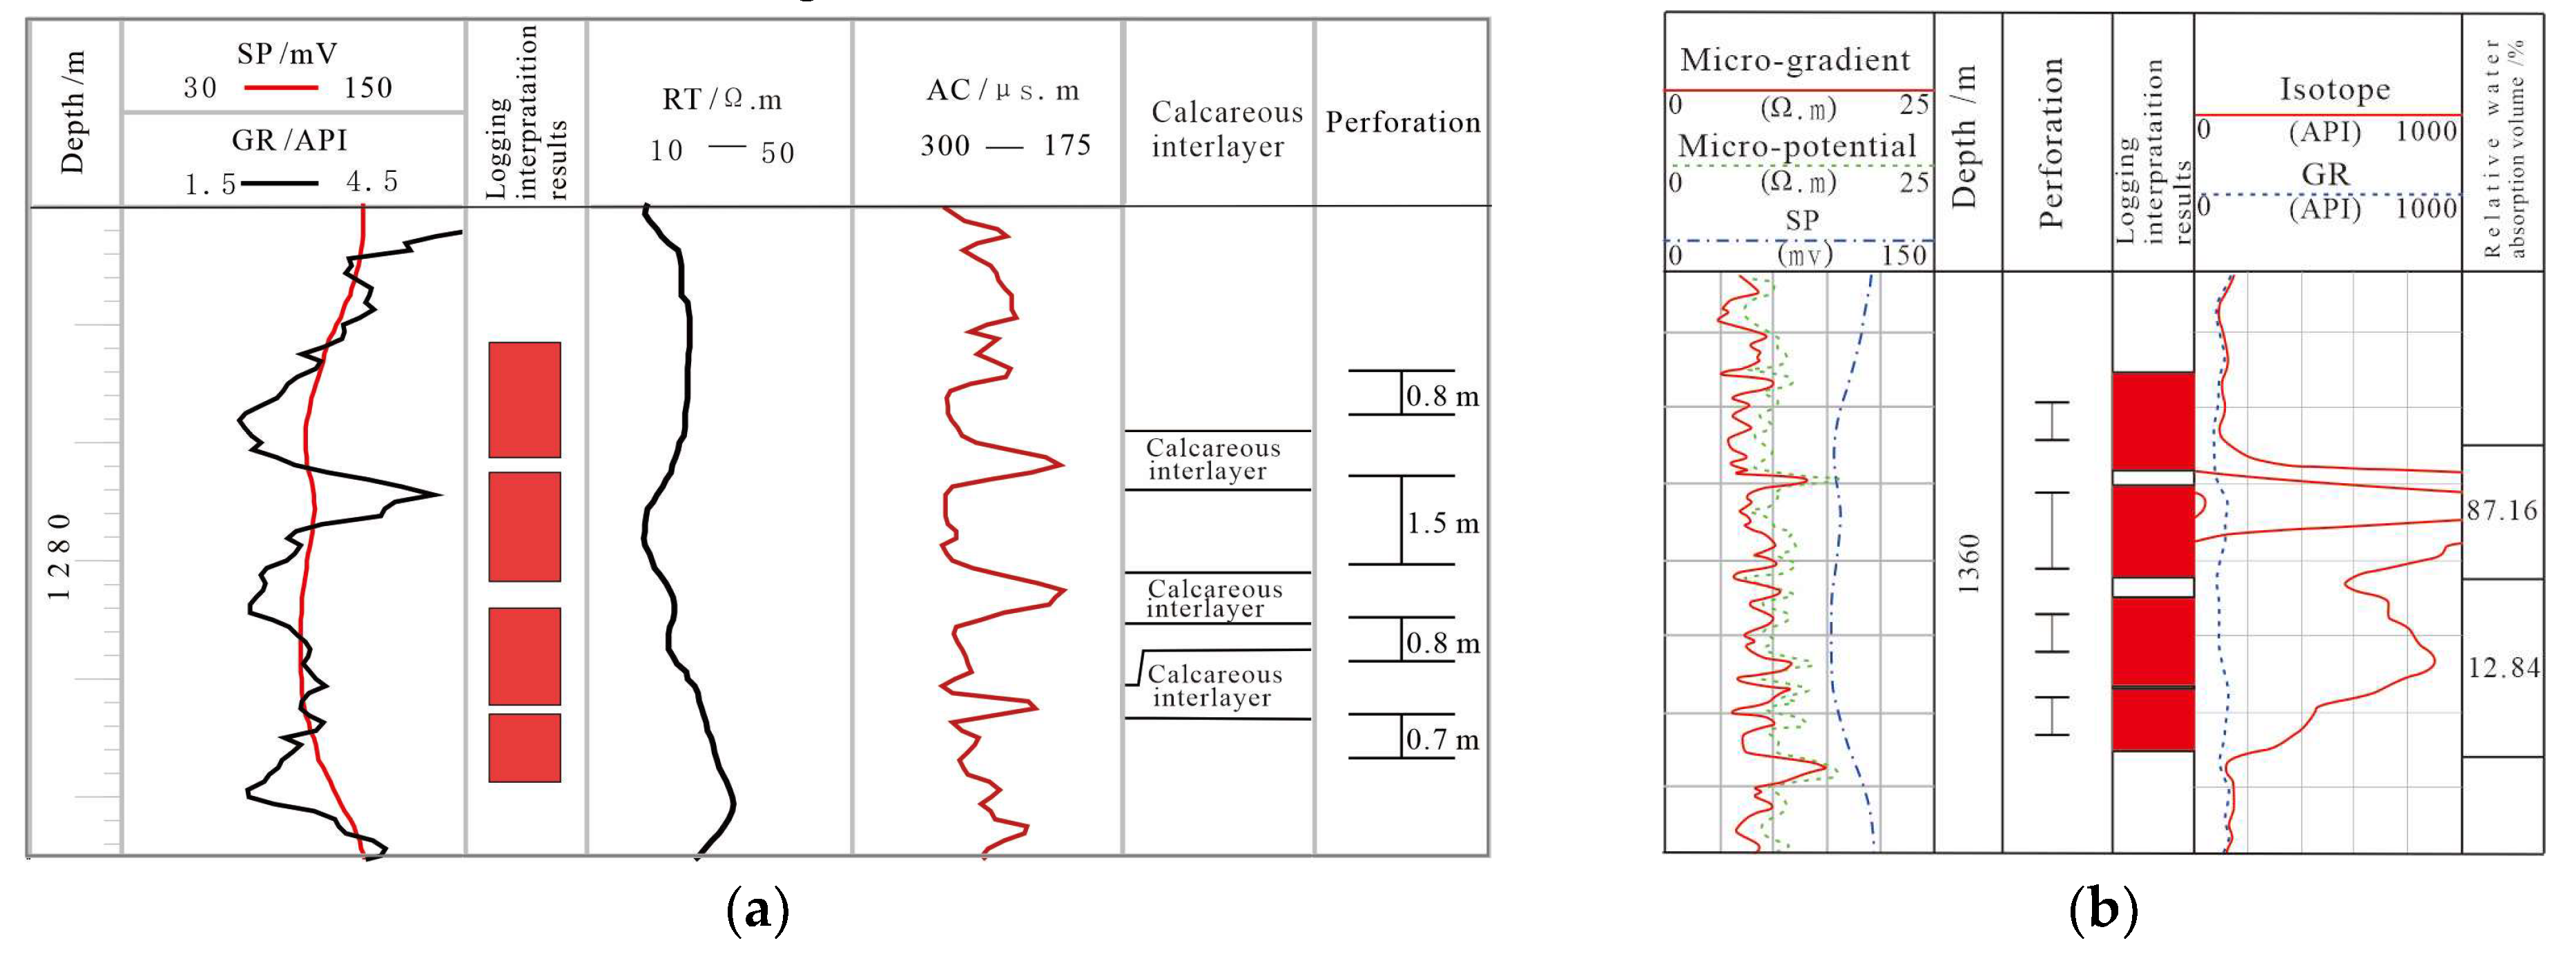
Taking the injector W22-03 as an example (Figure 3), the calcareous interlayers in the water-absorption profile showed a spike-shaped profile (Figure 3a,b). The tracer monitoring had obvious directionality (Figure 3c), and the tracer advancing velocity increased obviously in the direction of the current maximum-horizontal principal stress. Well-testing interpretation results show the characteristics of fracture seepage (Figure 3d). The analysis indicates that dynamic fractures occurred in the calcareous interlayers with relatively high brittleness, resulting in the sudden waterflooding of the two producers along the current maximum-horizontal principal-stress direction. The thickness of the strong water-absorption section was roughly the height of the dynamic fracture, which was around 1.5 m. The permeability of the well-testing interpretation reached more than 20 mD (Figure 3d).

3.2. Quantitative Description of Natural Fractures

In the process of water injection, natural fractures are reactivated and extended from ineffective to effective, which is another important cause of dynamic fractures [1]. However, the quantitative description of natural fractures has always been difficult. Based on the study of the paleotectonic stress field, and the fracture characteristics of cores and geological outcrops, the logging parameters of different lithologies in the coring wells are extracted by the multifractal method as learning samples, and the natural fractures of non-coring wells are identified by the probabilistic neural network. As a result, the distribution of natural fractures is described quantitatively.

3.2.1. Characteristics of Natural Fractures in Cores

The strata of the Triassic Yanchang Formation in the Ordos Basin were mainly affected by the paleo-tectonic stress fields of the Yanshan and Xishan periods, and the Yanshan period had a greater impact [22]. The maximum principal stress direction of the Yanshanian tectonic stress field was NWW–SEE, and the major orientation of the maximum principal stress was 116°–296°, forming a group of conjugate shear fractures in the NW and EW directions. The direction of the tectonic stress fields’ maximum principal stress in the Himalayan period was NE–SW, and the major orientation of the maximum principal stress was 45°–225°, forming a group of conjugate shear fractures in the NS and NE directions [23,24,25].
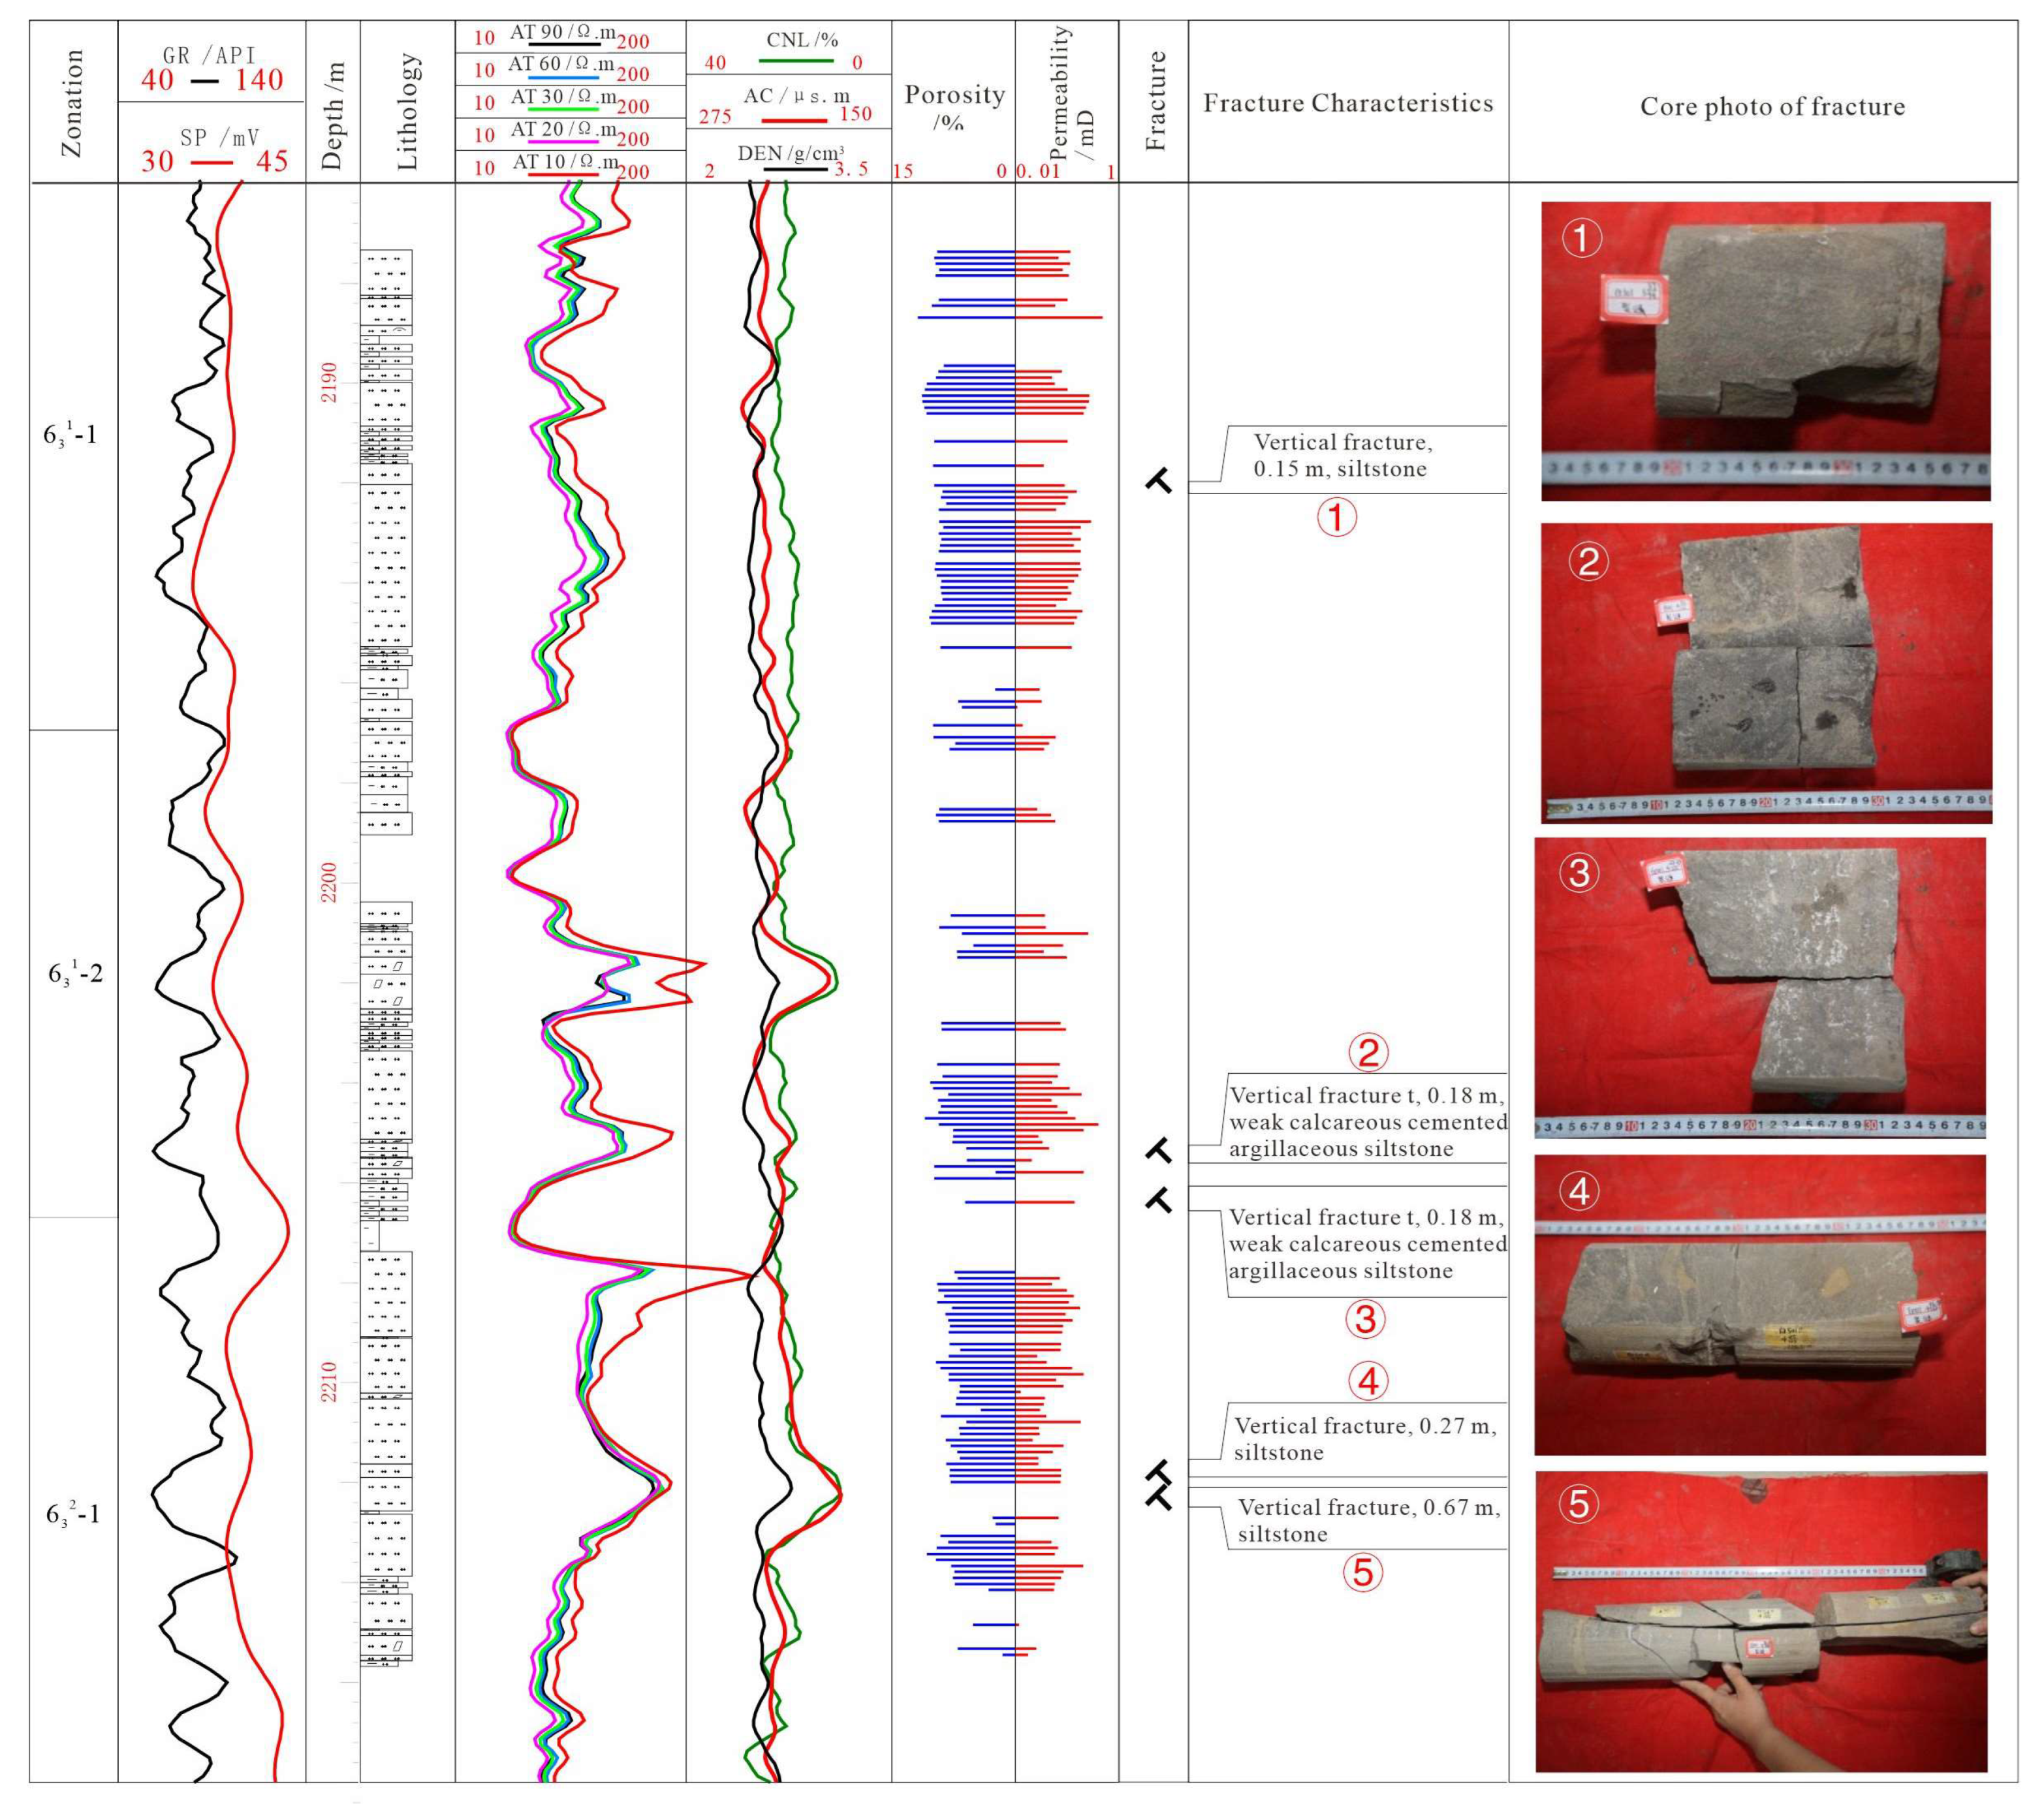
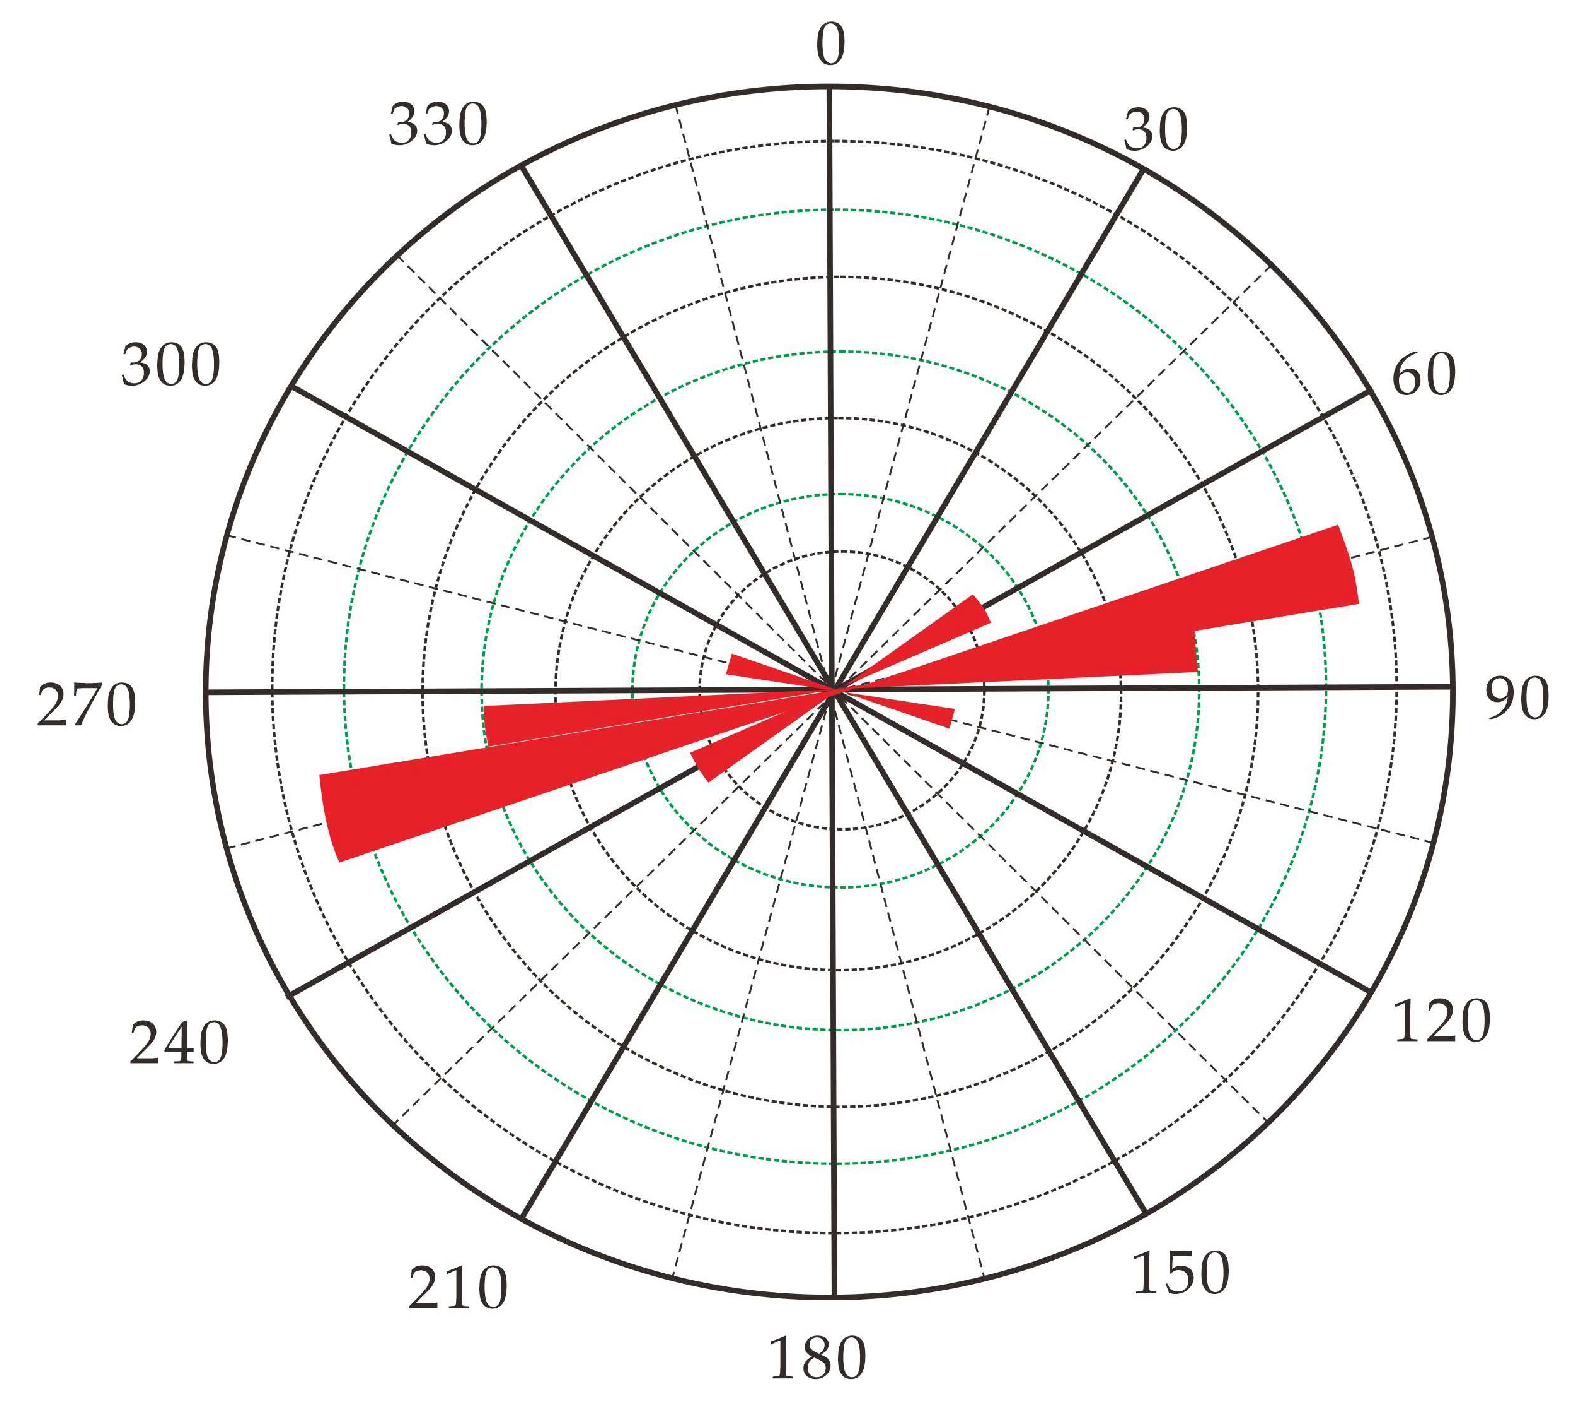
According to the observation and description of coring wells in the B153 area of the Huaqing oilfield, the penetration rate of natural fractures was 91.7%. The fracture height range was 0.04–0.85 m, and most of the fracture height was less than 0.4 m, accounting for 92.6%. The fractures were mainly high-angle fractures (45°–75°) and vertical fractures (≥75°). The fracture surfaces were mostly unfilled and showed weakly calcareous cementation. They were mainly formed as a small-scale fracture system, defined as “small cutting depth, high angle, and unfilled”. The fractures are mainly compression and tension torsion fractures [21] (Figure 4), which developed in relatively large brittle siltstone, silty mudstone, and calcareous fine sandstone. From statistics on the imaging logging, the strike of natural fractures was approximately 60°–85° NE (Figure 5).

3.2.2. Characteristics of Natural Fractures in Geological Outcrops

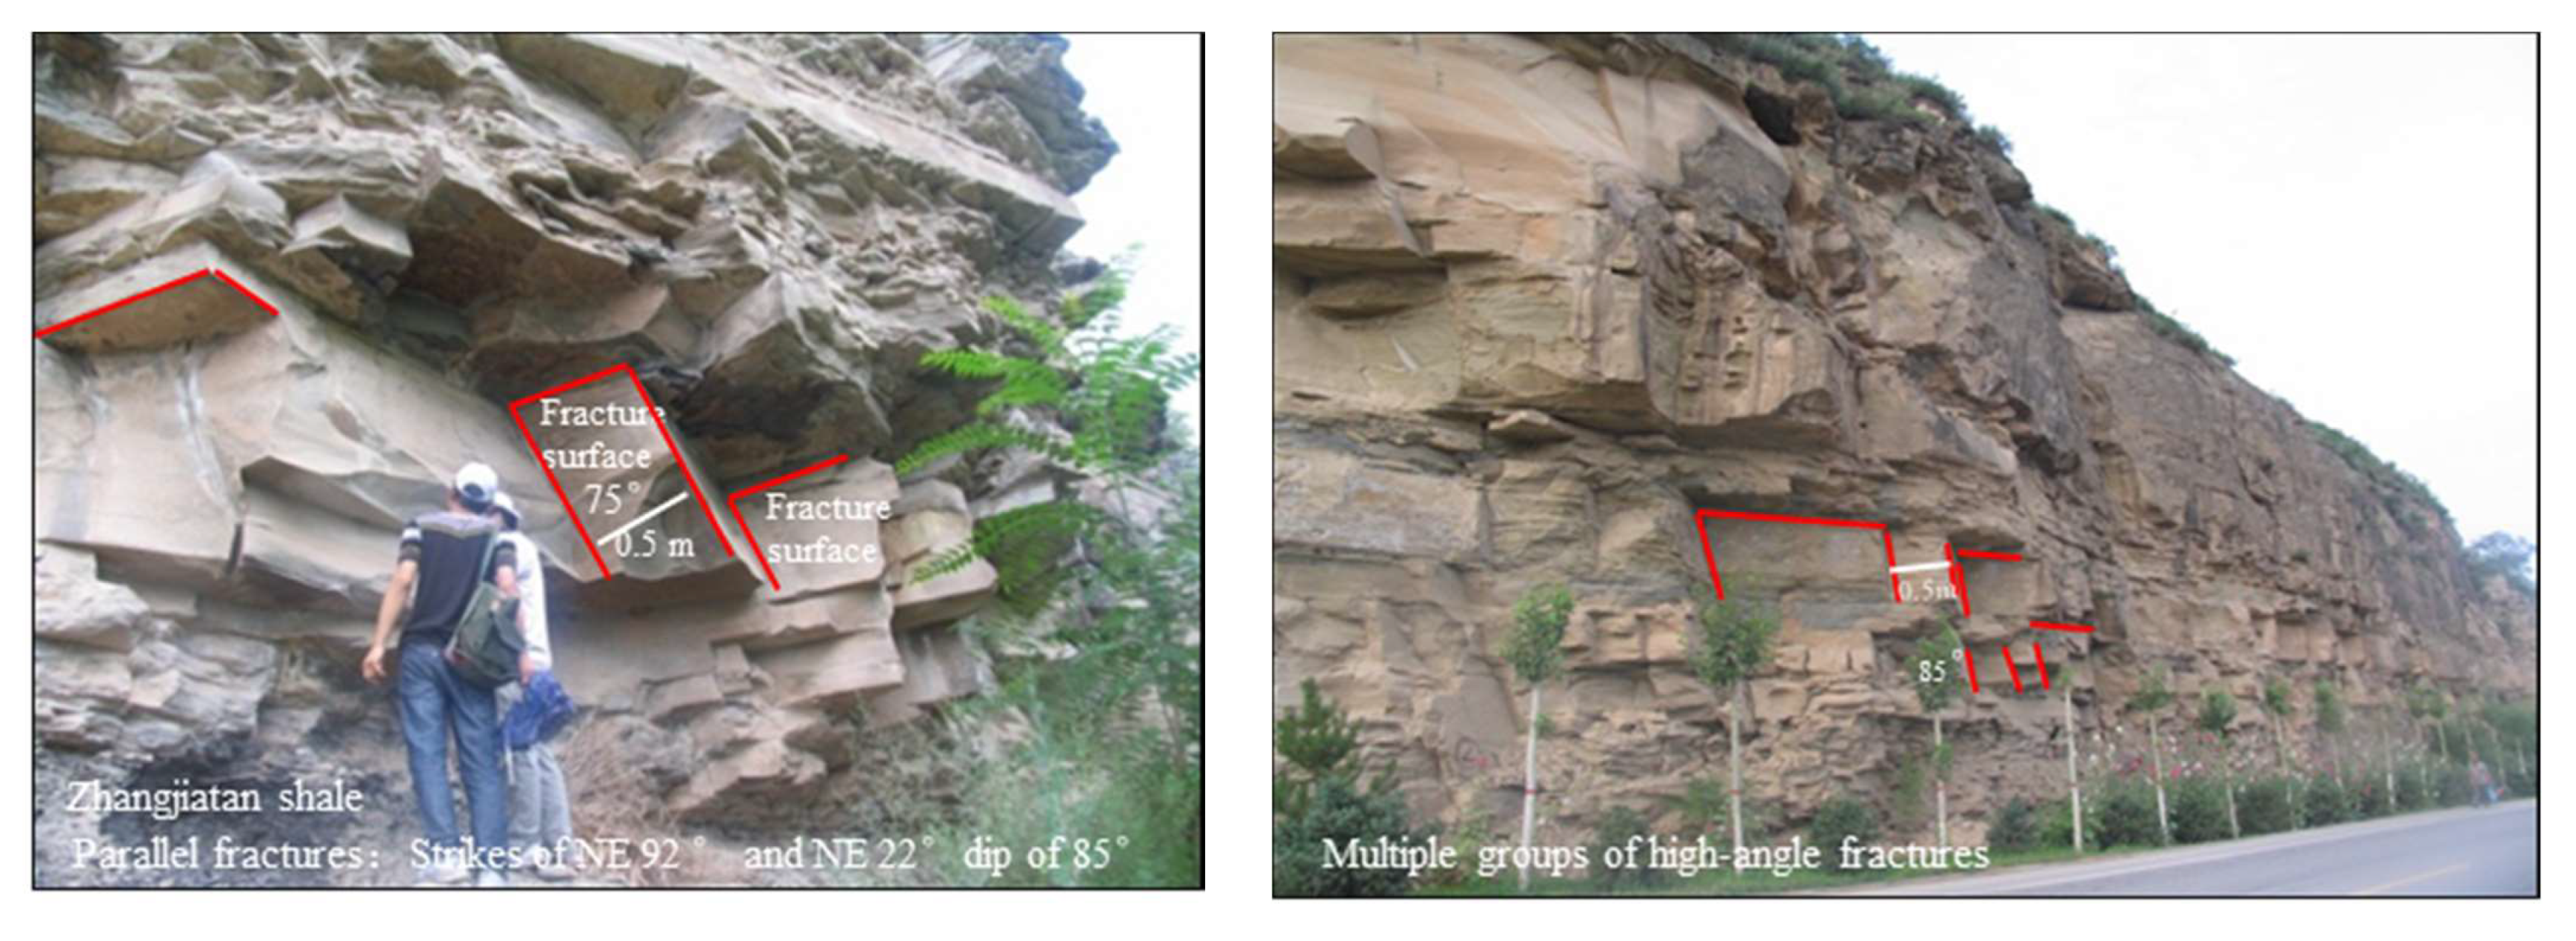
A geological outcrop survey was conducted on the Yanchang Formation of the Ordos Basin. It was found that natural fractures are widely developed in the sand–mudstone in the upper part of the Zhangjiatan shale (Figure 6). Most of the fractures are high-angle fractures with space of less than 0.5 m, a dip of 70°–90°, and a strike of 90° NE and 22° NE. The fracture surfaces are relatively flat and smooth. The fractured rocks are mainly composed of siltstone and silty mudstone. The fractures terminate at the lithologic interfaces and are perpendicular to the lithologic interface.

3.2.3. Natural Fracture Intensity

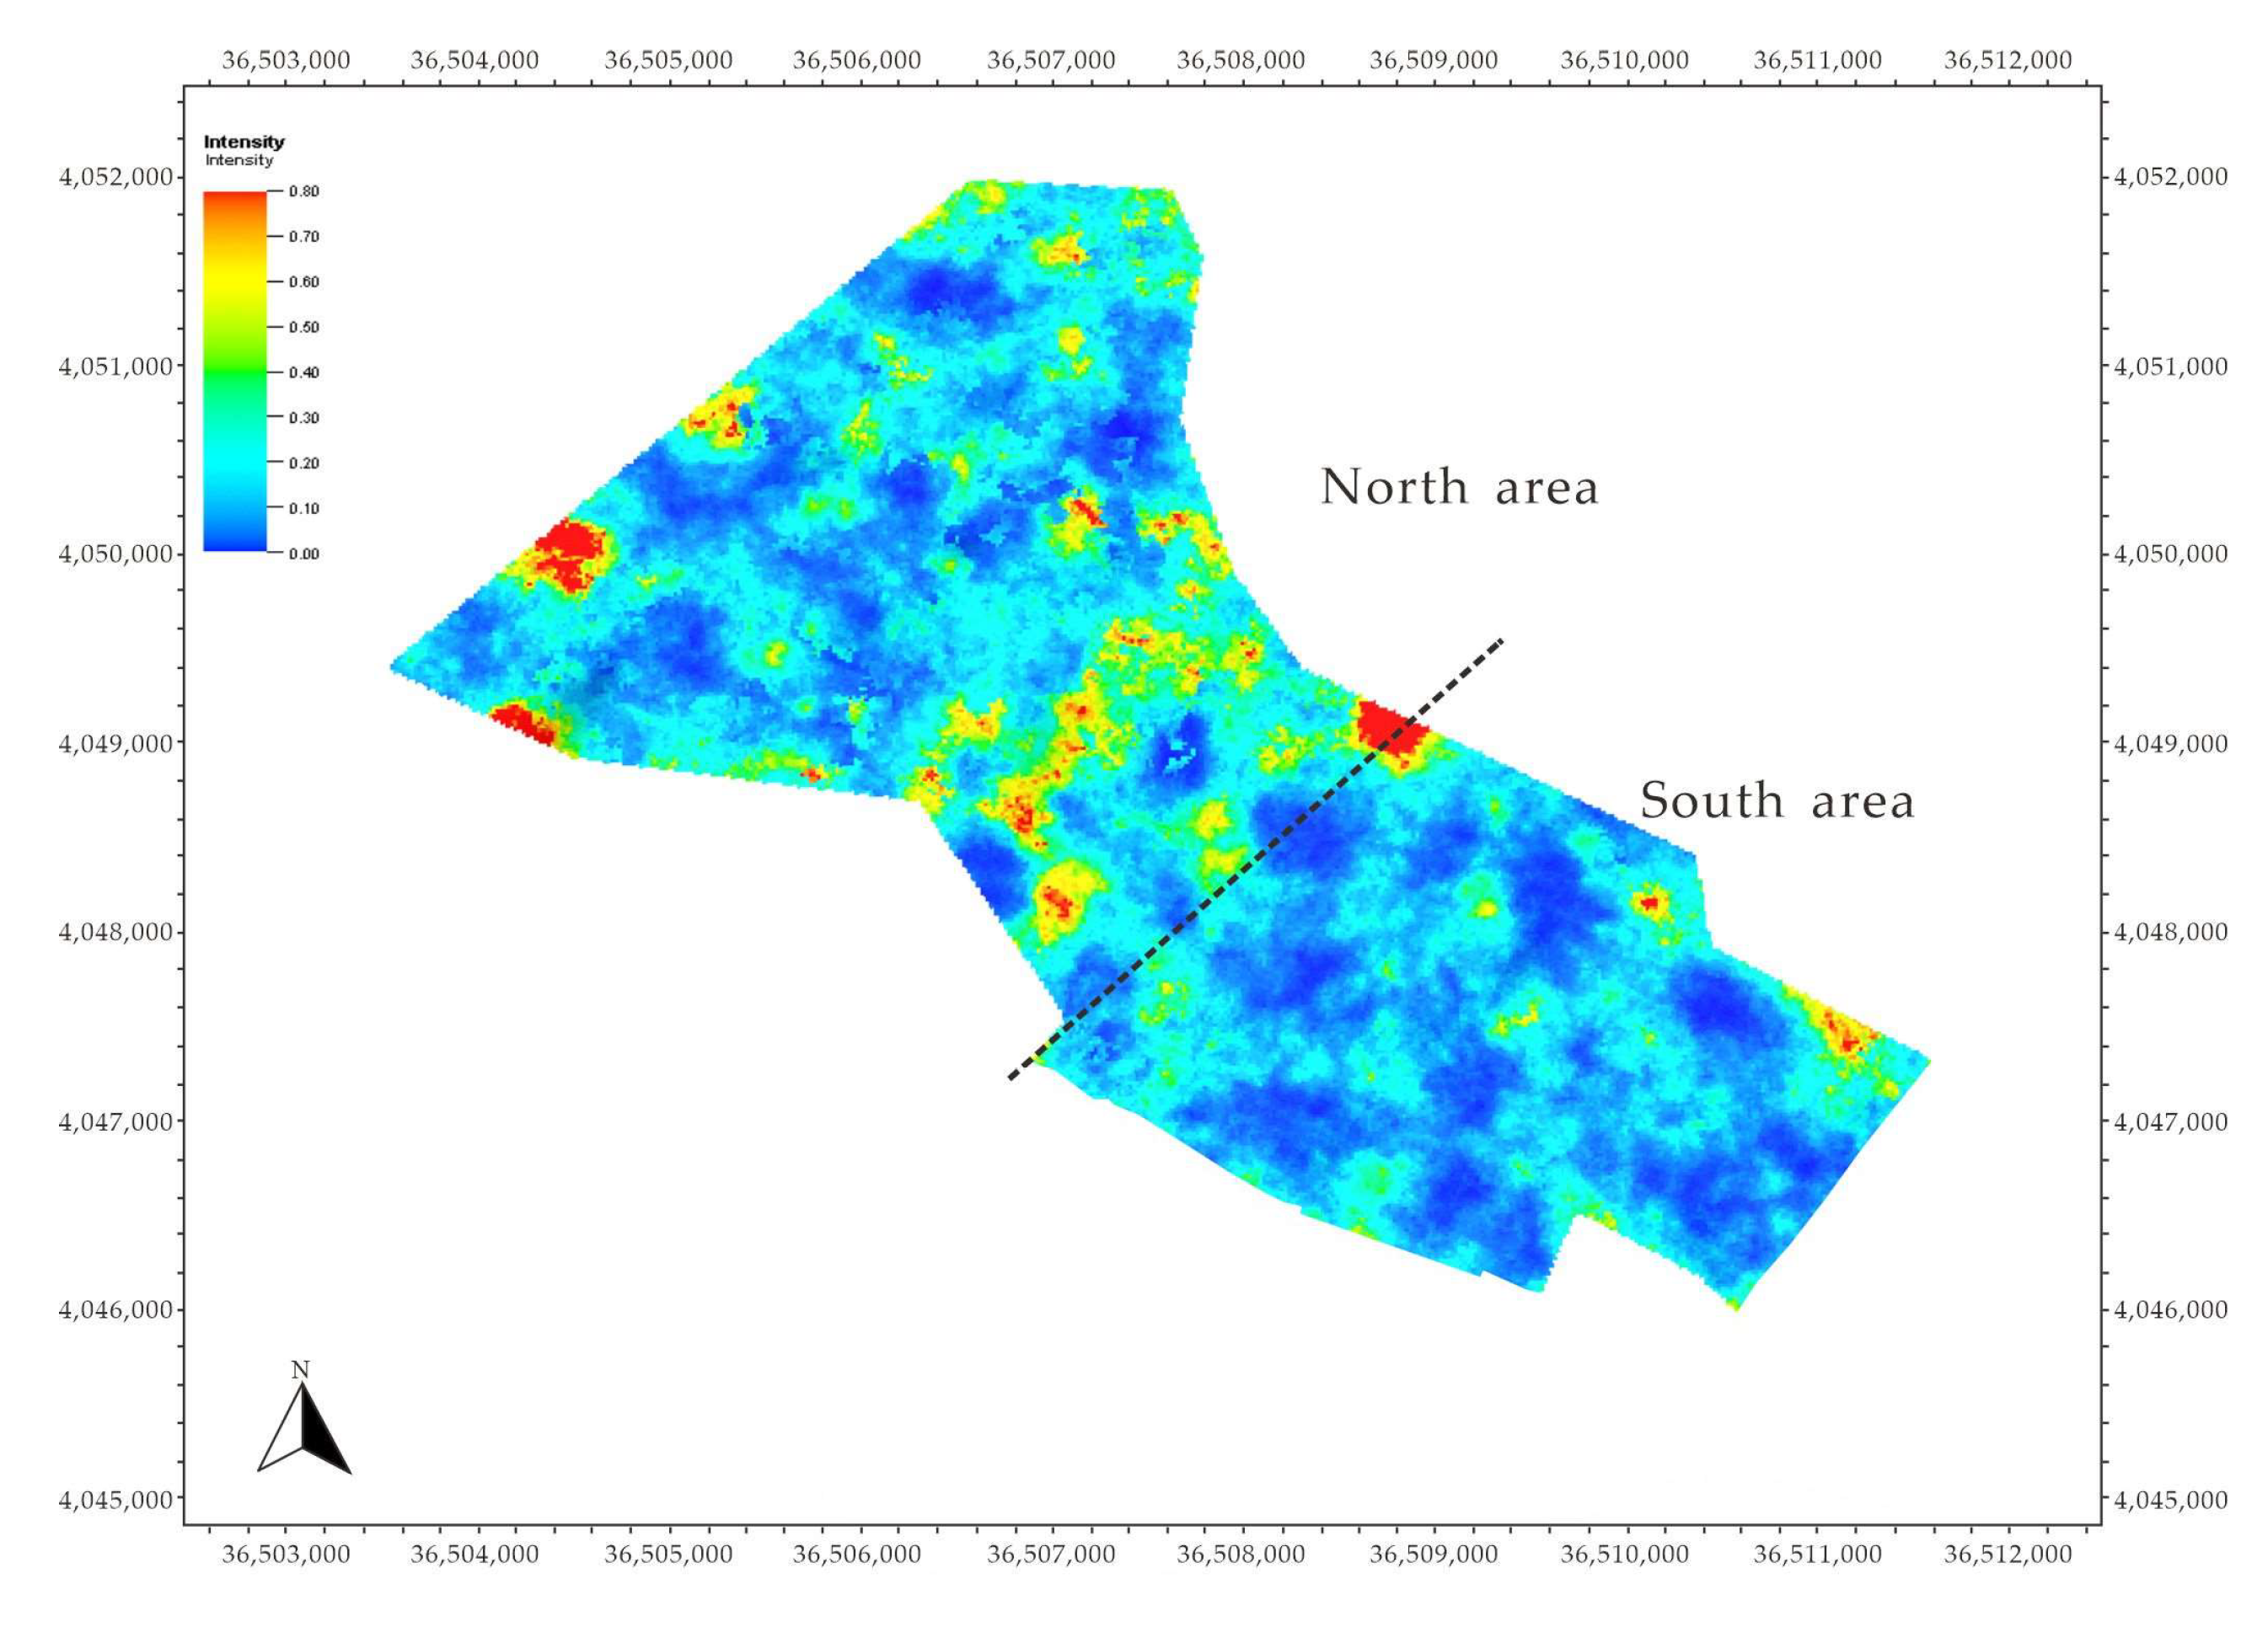
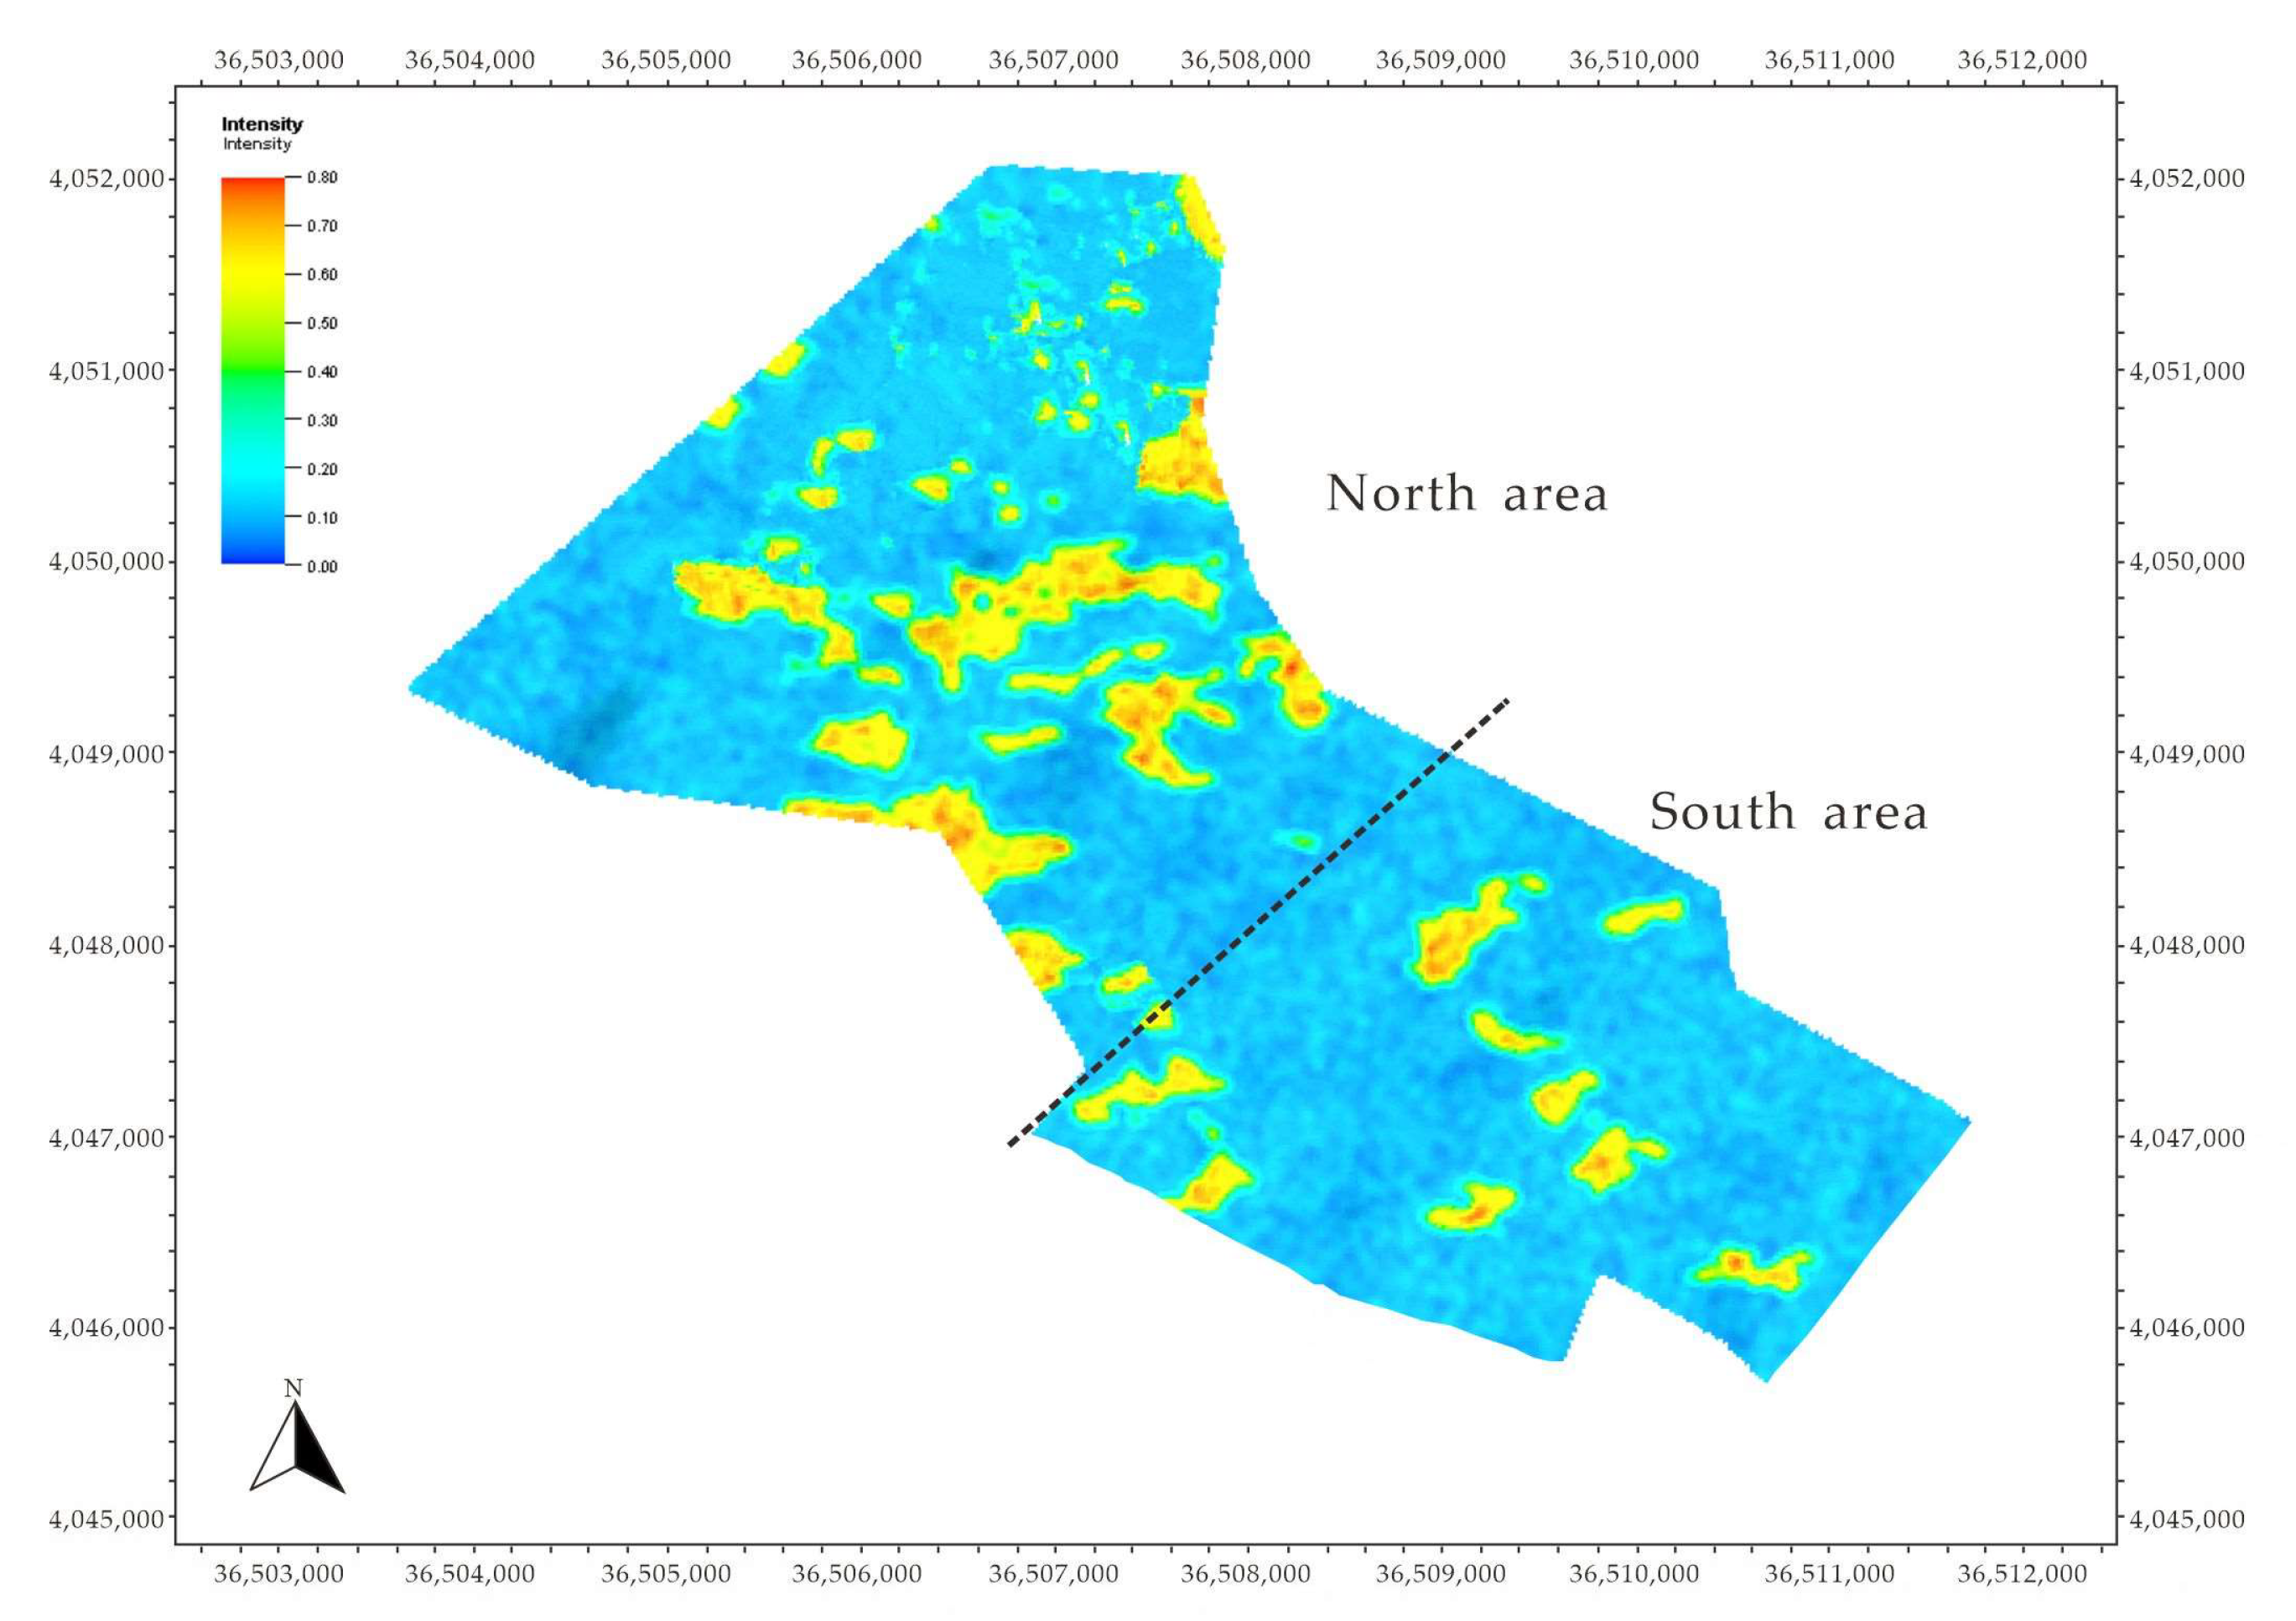
The natural fractures in B153 are relatively small in scale, and the conventional logging response is not sensitive enough to identify them. On the basis of detailed core observations, the fracture development positions between the core and logging curves were finely calibrated. The logging parameters in different lithologies were extracted by the multifractal method [26,27,28,29,30], and the samples from the coring wells were learned by the probabilistic neural network [31,32,33] to identify the natural fractures of non-coring wells (Figure 7). The natural fracture intensity of the whole area was simulated by sequential Gauss simulation (Figure 8).
The fracture development degree can be divided into three levels: developed, weakly developed, and undeveloped. In Figure 8, the red–yellow areas are the developed fracture areas, the green areas are the weakly developed fracture areas, and the blue areas are the undeveloped fracture areas. The intensity of natural fractures in the northern part of B153 is greater than that in the southern part. The formation of dynamic fractures is related to the intensity of natural fractures. The areas with a high intensity of natural fractures can easily form dynamic fractures during waterflooding, and the natural fractures with the smallest angle to the current maximum-horizontal principal stress direction open first.

3.2.4. Case Analysis

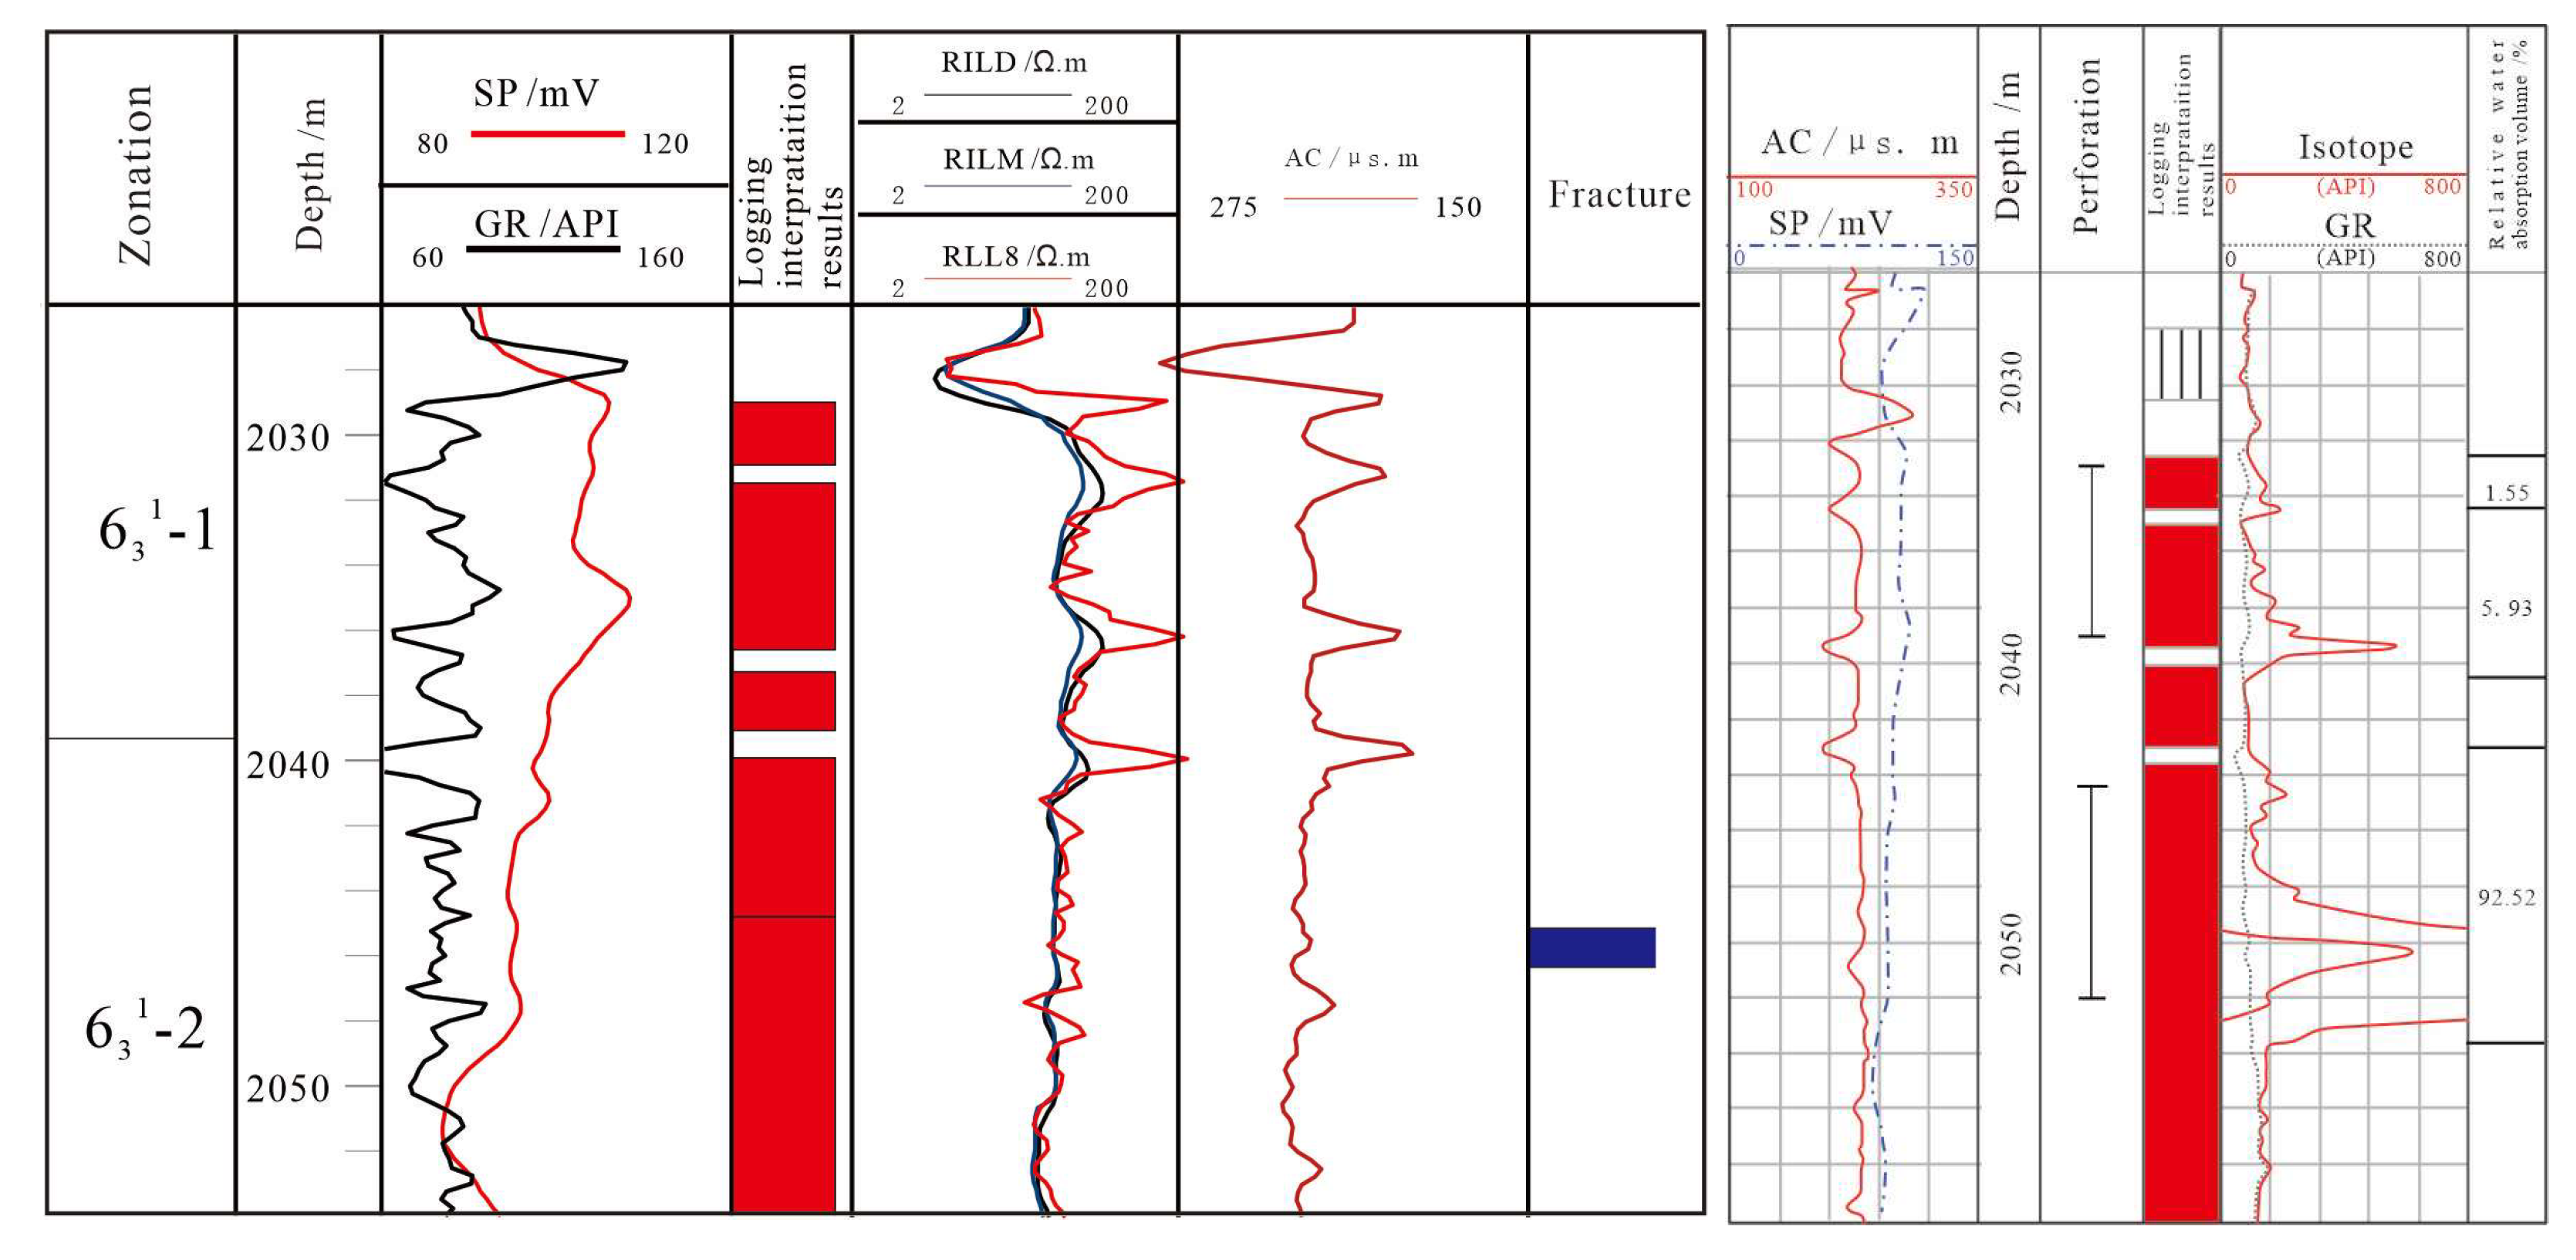
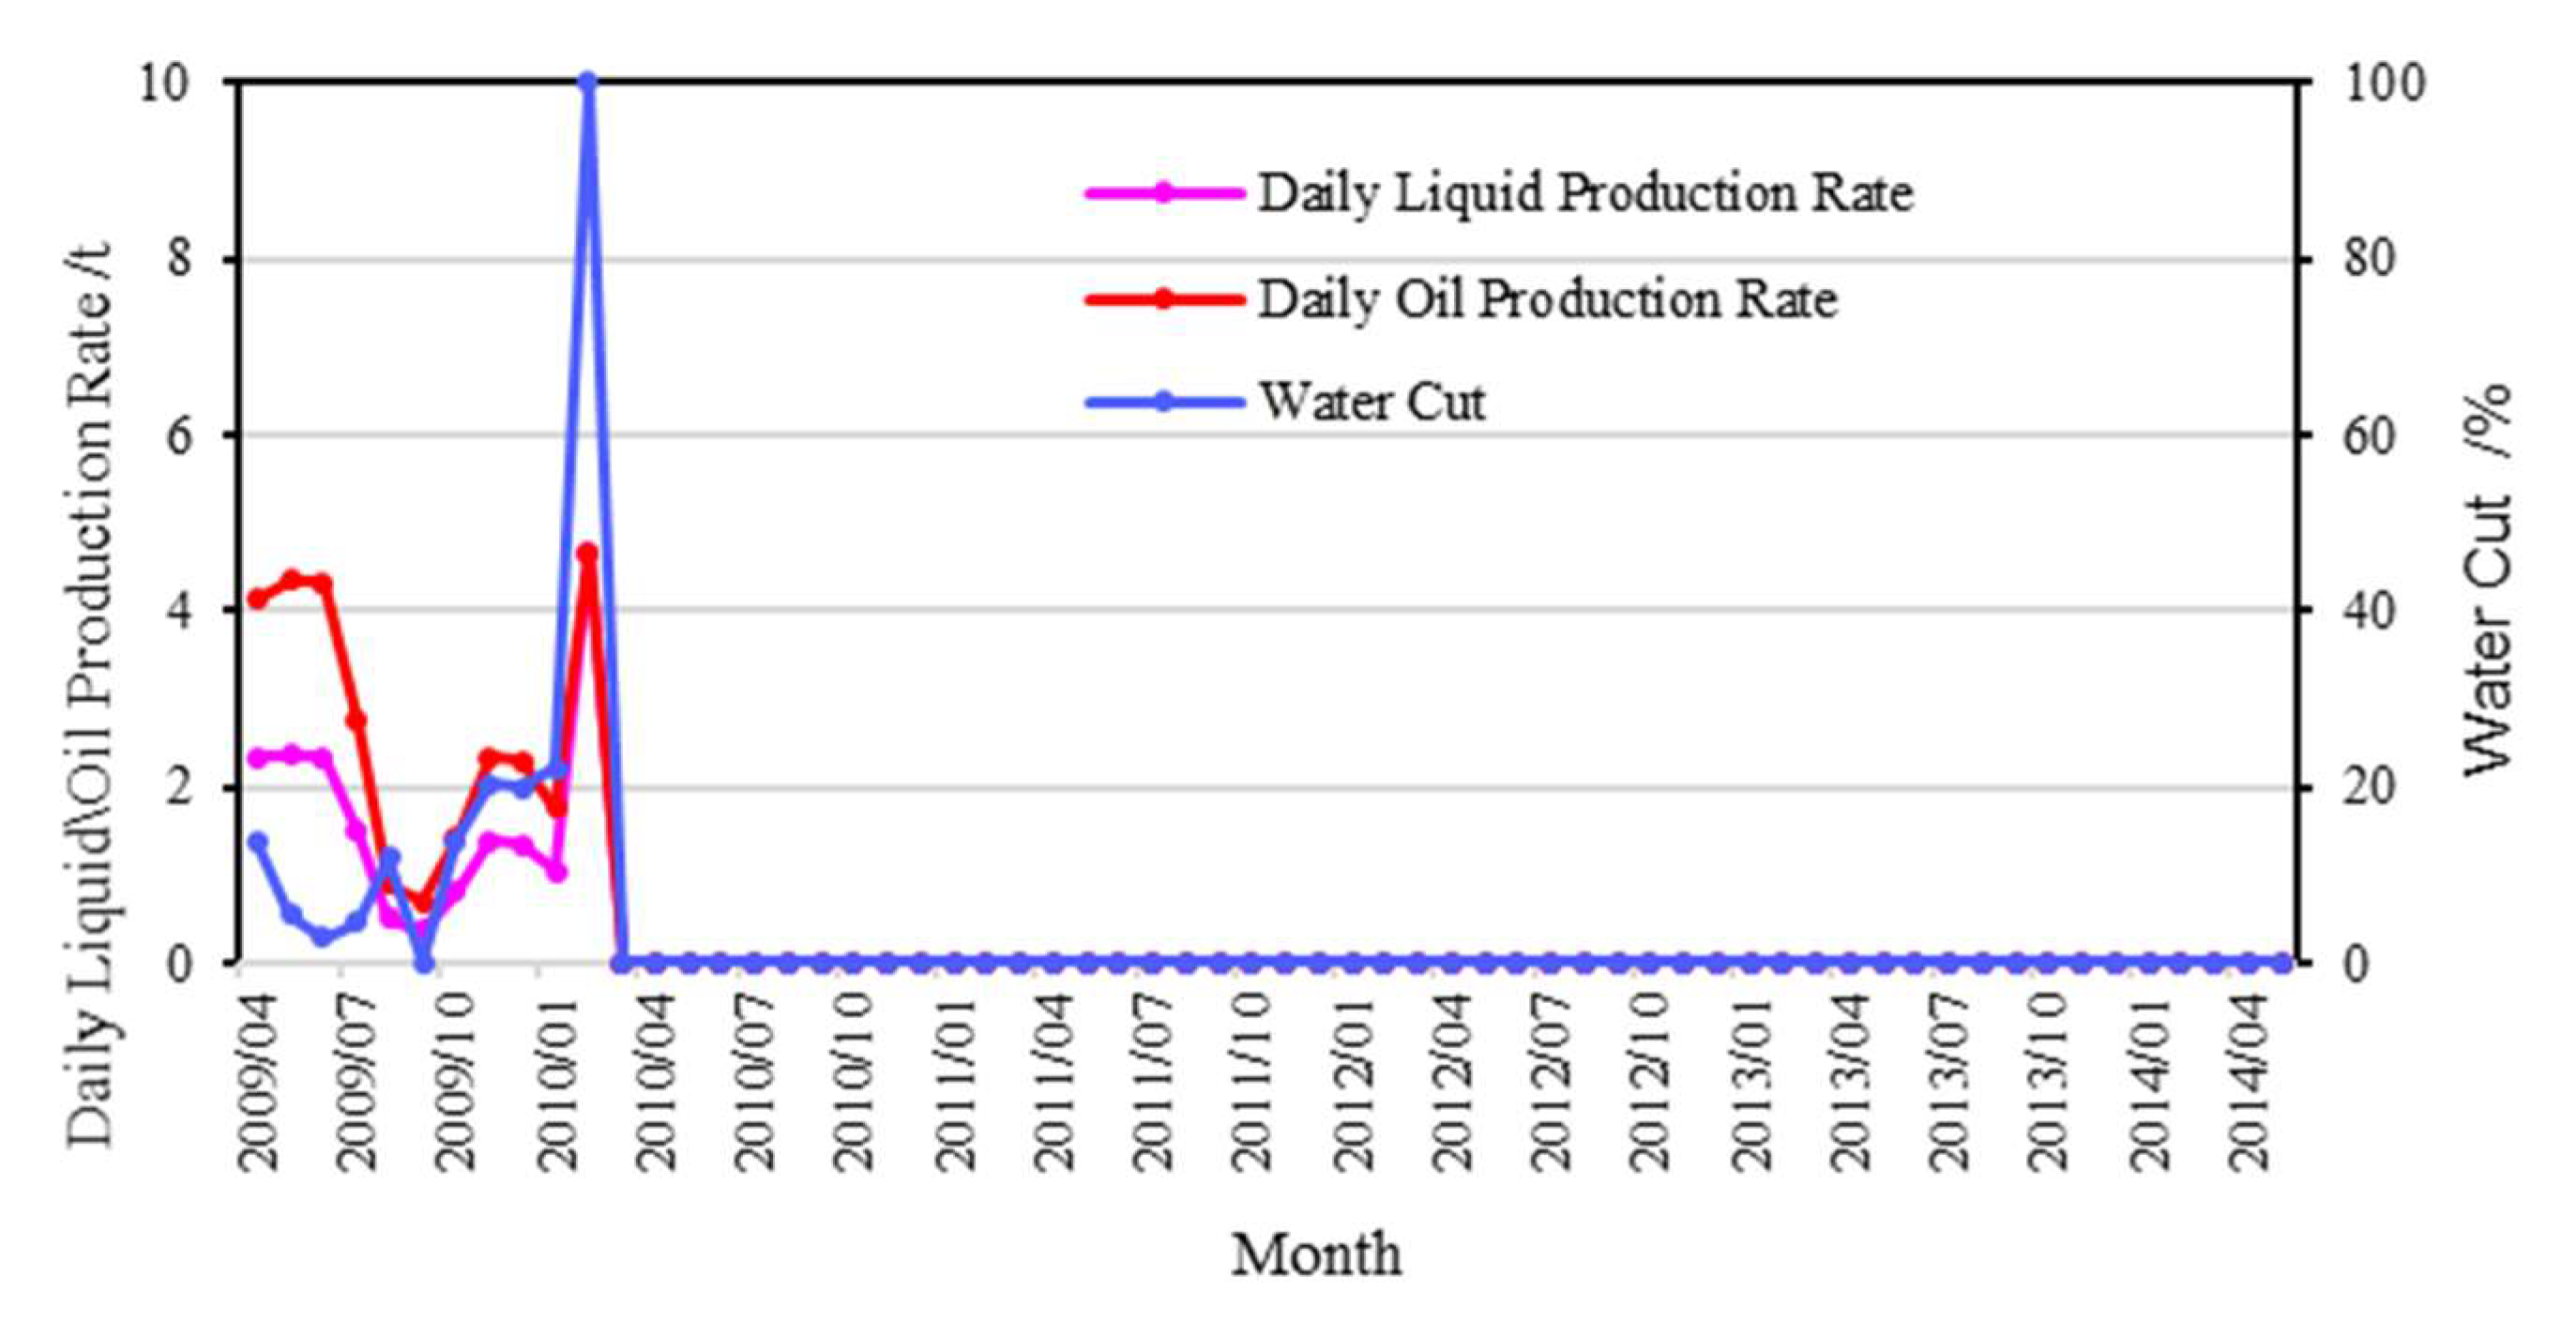
Using the above method, it was identified that a natural fracture developed in the interval 631-2 of Well G122-159 in the B153 area (left in Figure 9), which formed dynamic fractures during water injection, and the water-absorption profile showed a peak shape (right in Figure 9), resulting in the sudden waterflooding in producer G123-161 located in the direction of the maximum-horizontal principal stress (Figure 10). The height of the dynamic fracture corresponded to the strong water-absorption section of the profile, which was approximately 3 m.

3.3. Dynamic Fracture Distribution Intensity

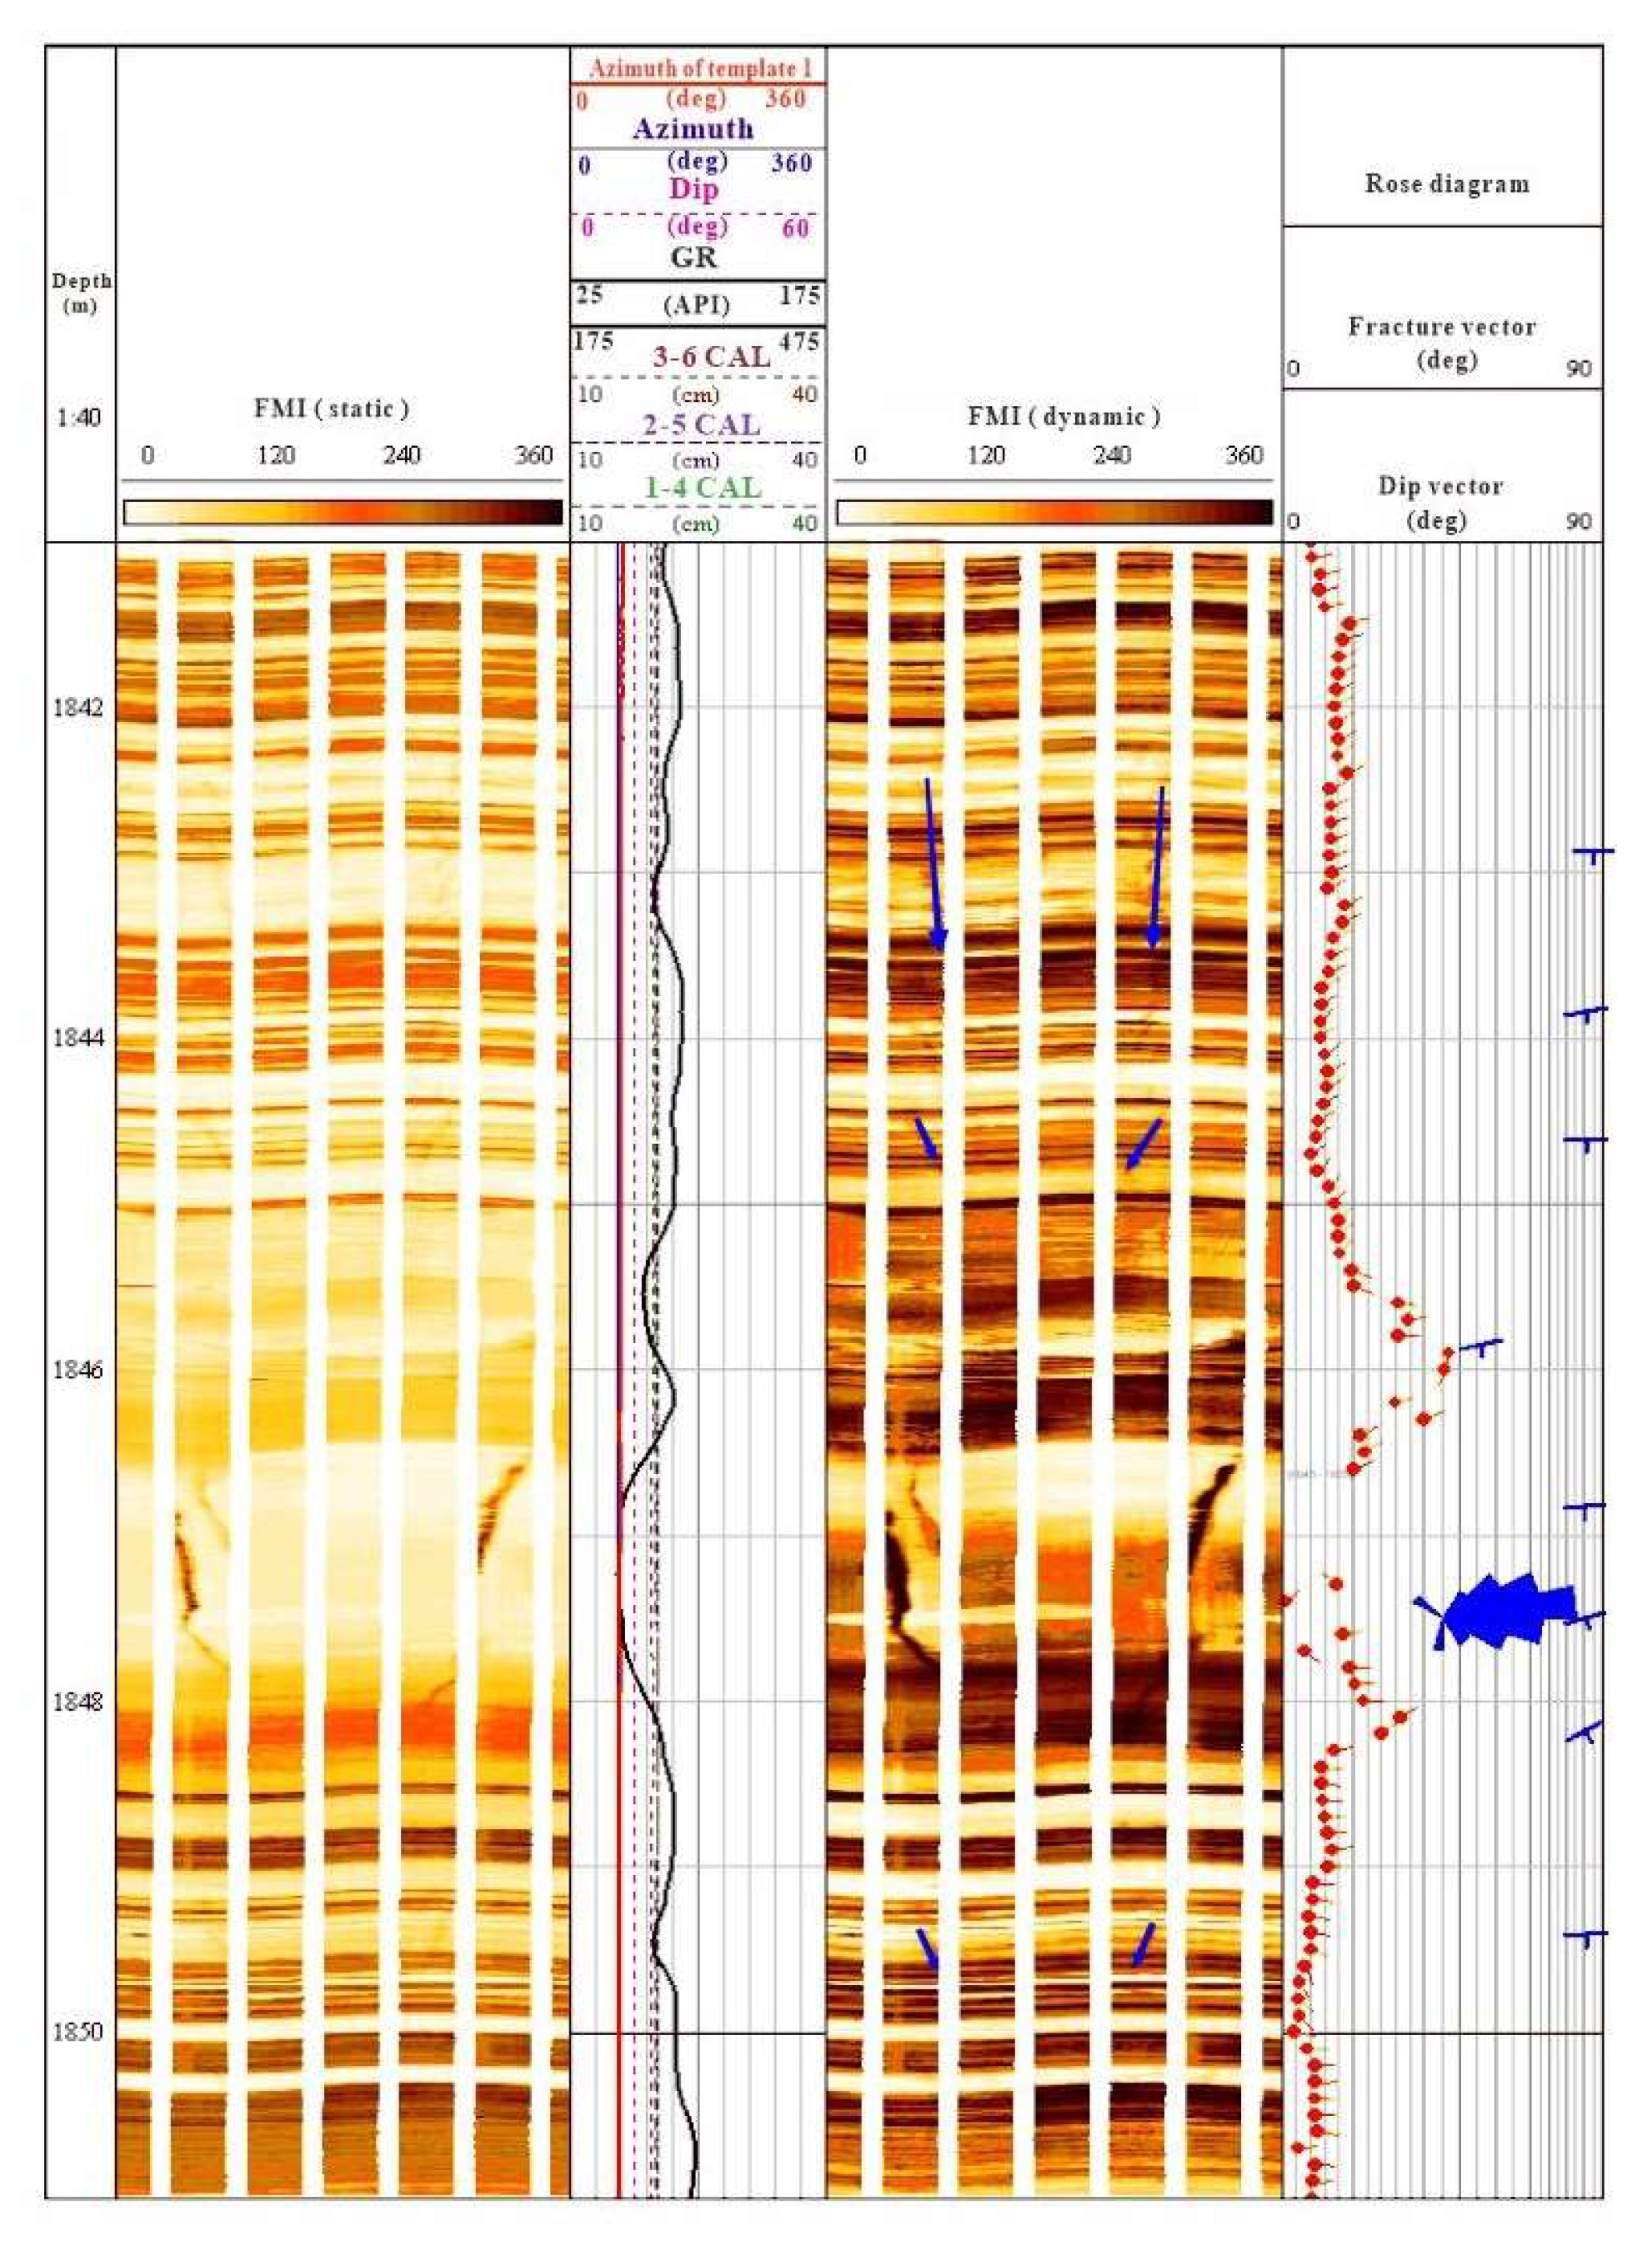
The evaluation of rock brittleness and the quantitative description of natural fractures are the basis for characterizing the distribution of dynamic fractures. During the process of waterflooding, the dynamic fractures from two causes would be cross-coupled, which makes the fracture network more complex. The cross behaviors of the two include penetrating the natural fractures, stopping the expansion, and turning to expand along the natural fracture surface [34,35,36]. The current tectonic stress field controls the whole extension of dynamic fractures. From the analysis of imaging logging, the position indicated by the blue arrow in Figure 11 has a feather-like feature on the imaging logging and is distributed symmetrically at 180°, indicating a typical drilling-induced fracture. From the statistics of several wells, the direction of induced fractures in the B153 area of the Huaqing oilfield ranges mainly within 80°–90°. This is also the direction of the maximum-horizontal principal stress of the current stress field controlling the extension of dynamic fractures during water injection.
When the BHP exceeds the fracture pressure, the weak surfaces of the rock strata easily form fractures. When the pressure at the fracturing tip is greater than the current minimum-horizontal principal stress, the fracture extends until it is connected with the hydraulic fracture in the producer. The evolution of dynamic fractures undergoes four stages [3,4,5,6]:
Establishment stage of transient pressure—fractures grow rapidly to a certain scale;
Dry oil production stage—the fracture length is fixed;
Water breakthrough stage of the producers—the waterflooding front enters the surrounding area of the producers with a relatively high-pressure gradient, and the dynamic fracture develops to the maximum length;
Fracture shrinkage stage—the water cut of the producers keeps rising and the fracture shrinks.
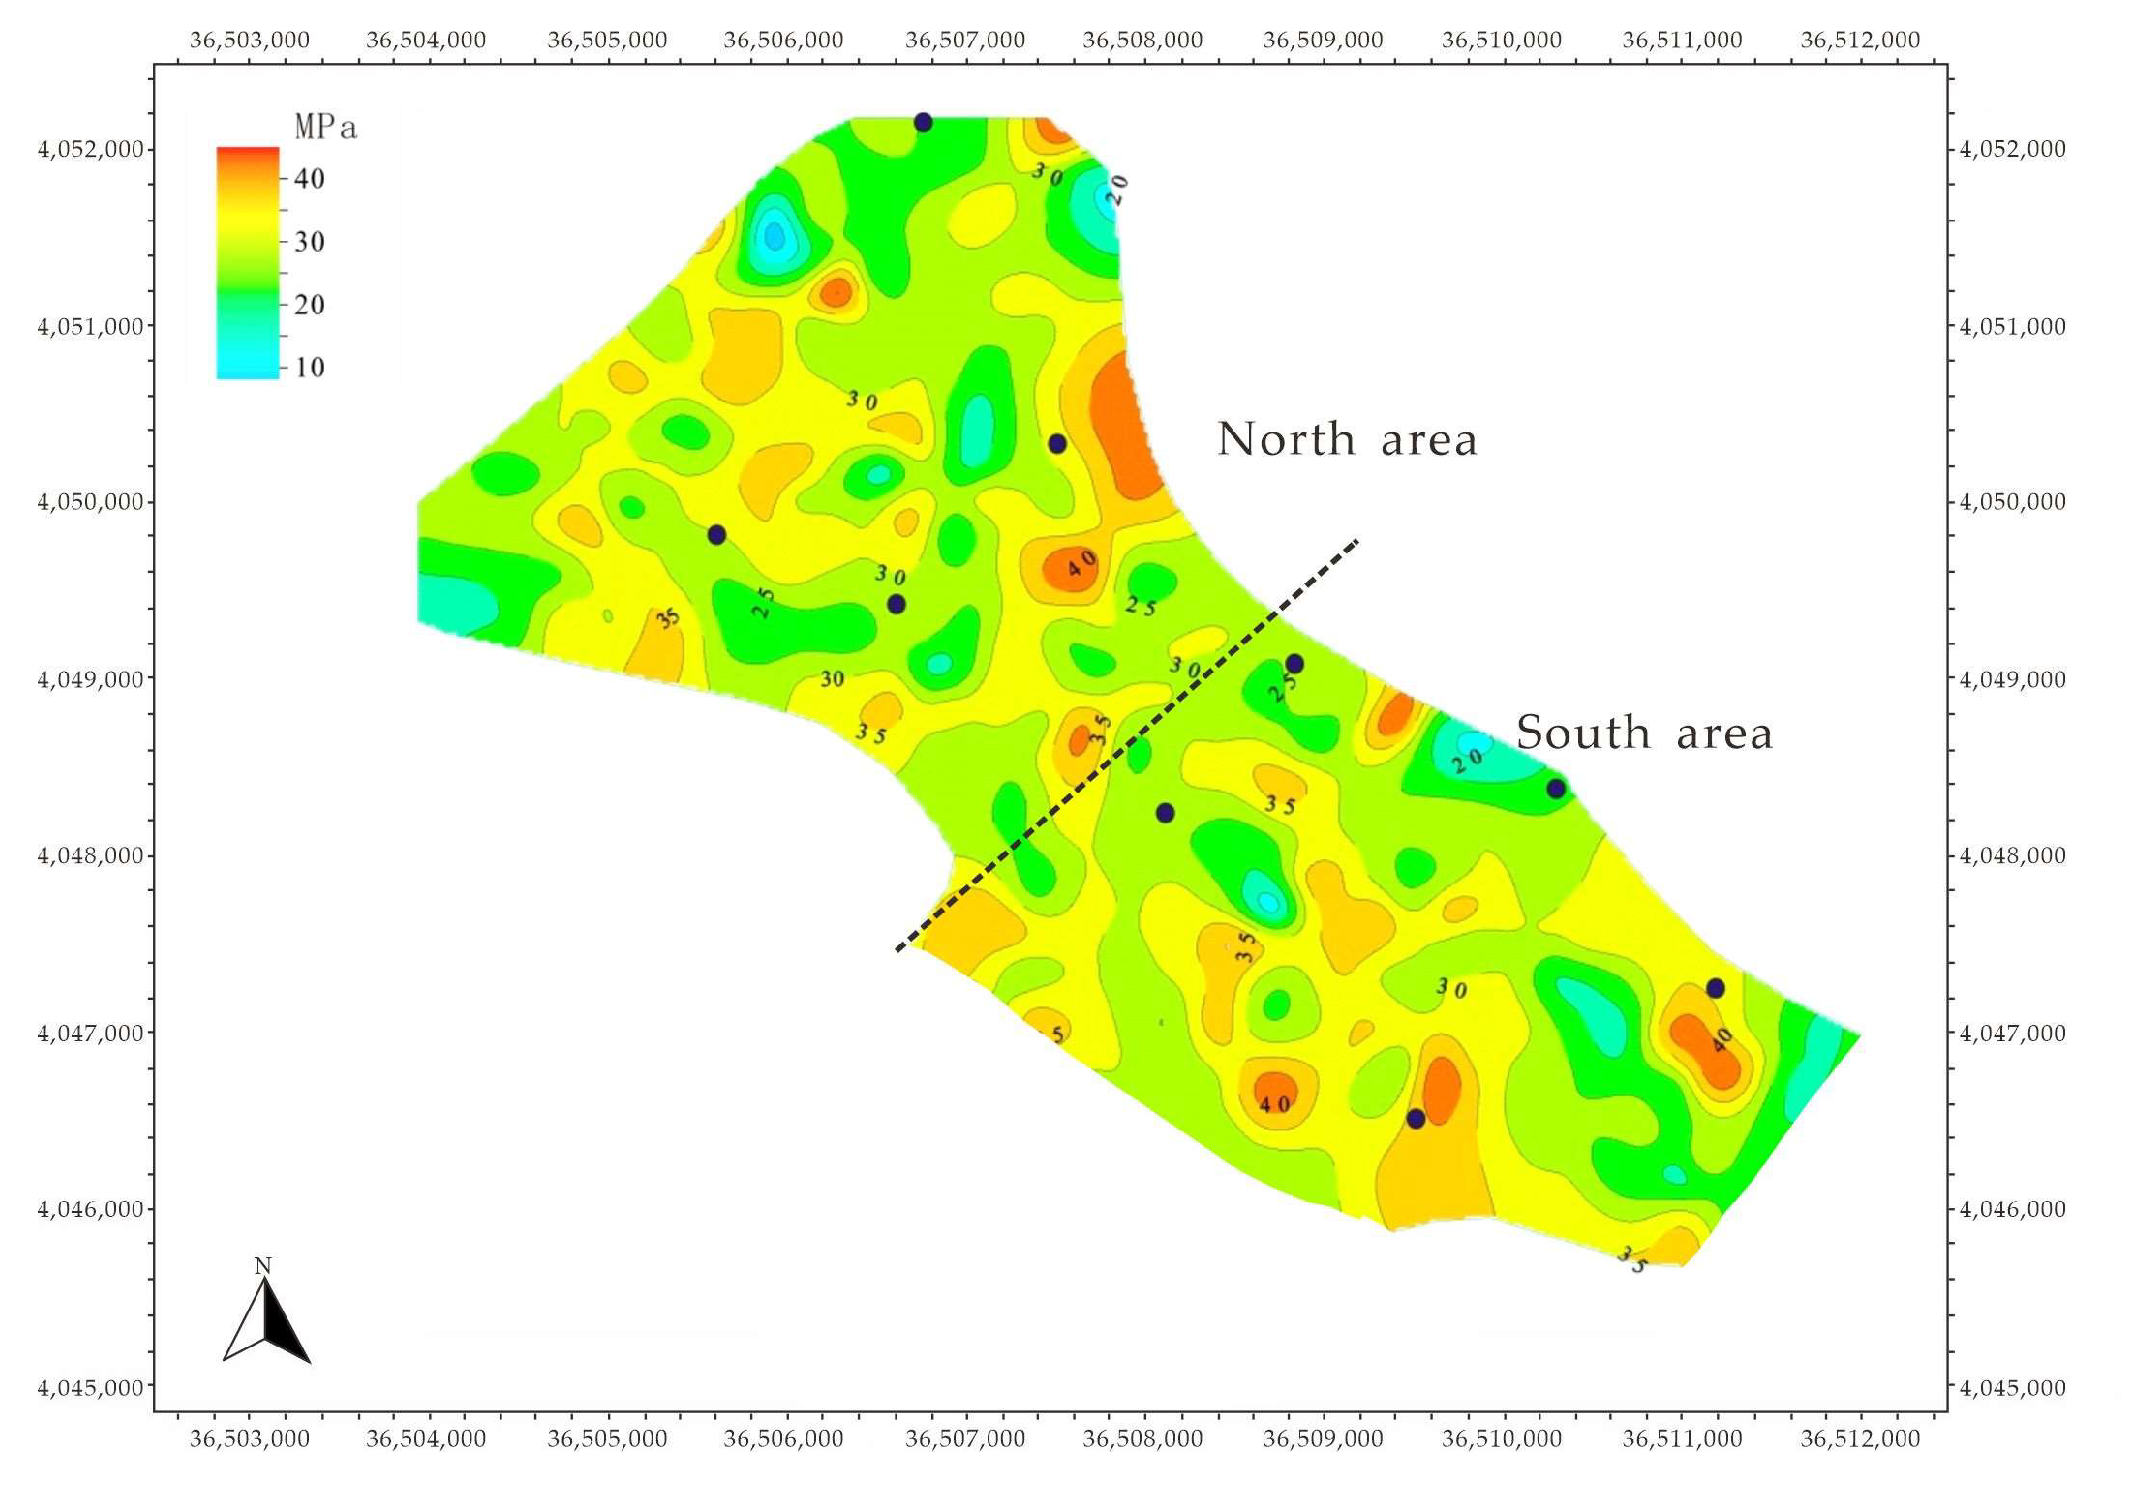
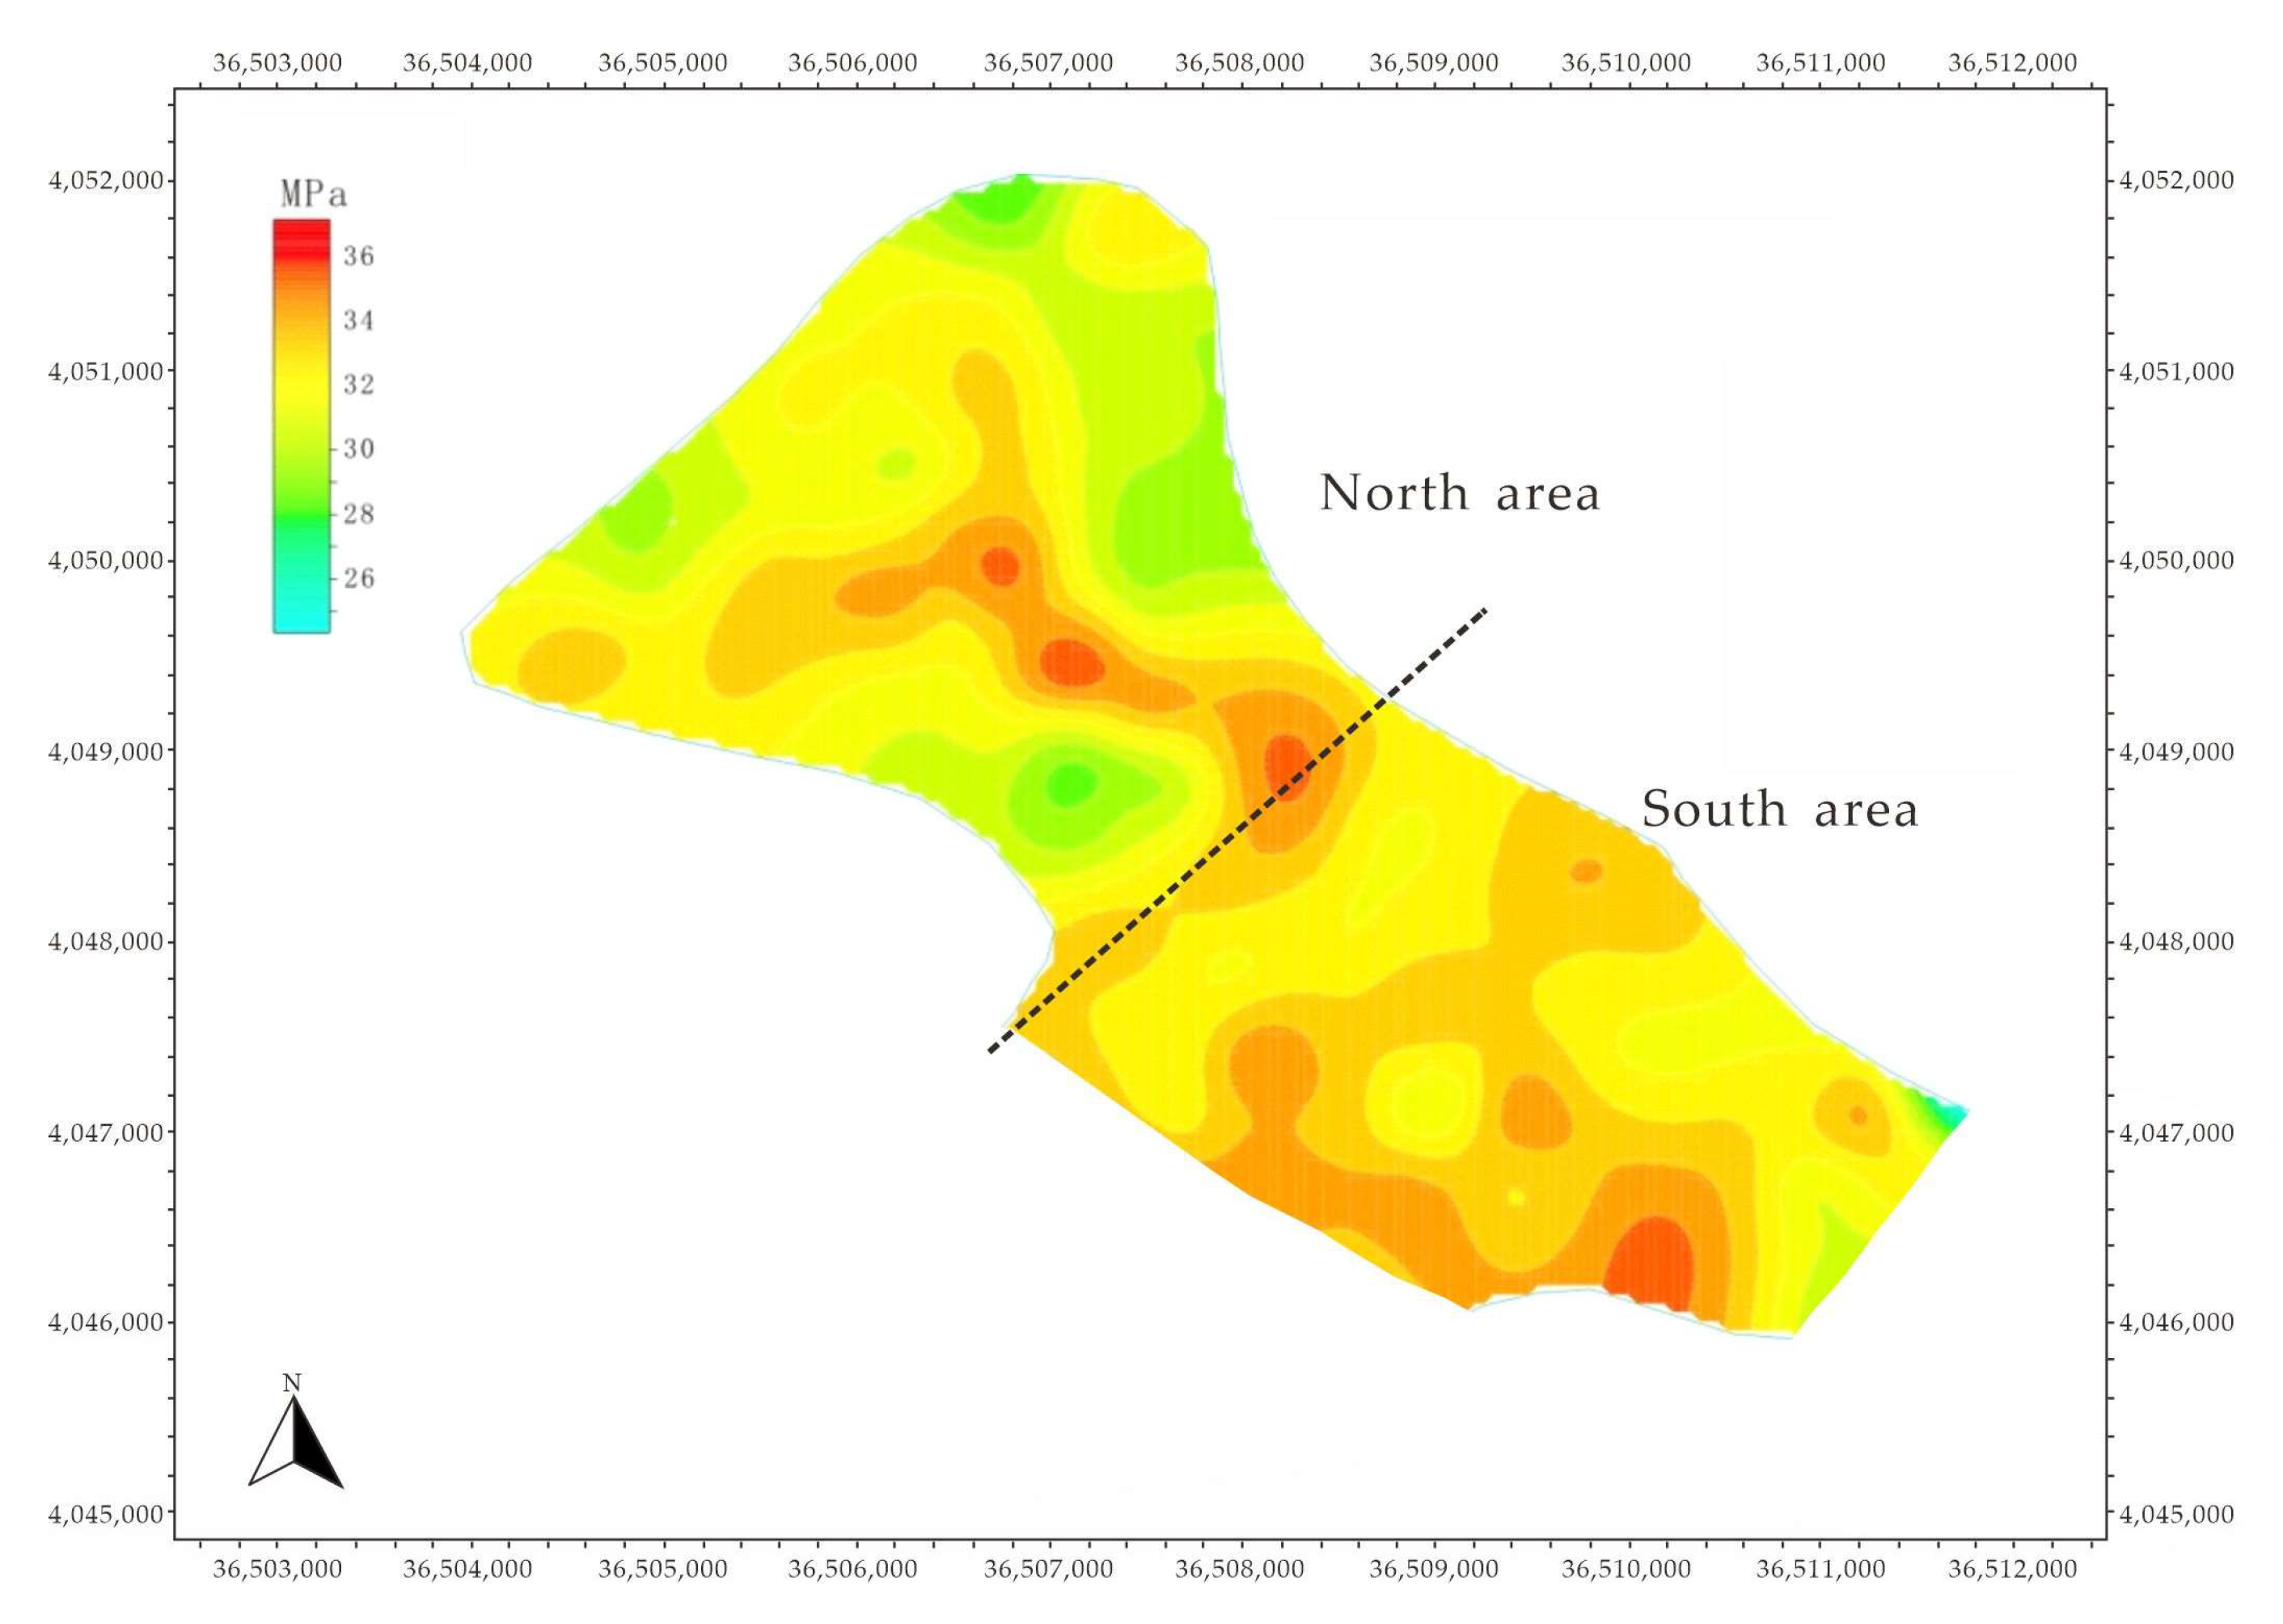
The dynamic fractures are centered around the injectors and extend along the direction of the maximum-horizontal principal stress. The formation position is the relatively weak surface of the rock strata or the developed intervals of natural fractures. The height and aperture of the fractures are determined by a combination of the water-injection profile and the well-testing interpretation. The dynamic fracture intensity is obtained through integrating the fracture pressure (Figure 12), BHP distribution (Figure 13), production data from producers and injectors, water-absorption profile, well-testing interpretation, tracer, and other characteristics of the production dynamic response by analyzing the injection–production well groups, one by one.
In order to maintain the formation pressure, ultra-low permeability reservoirs are subjected to advanced water injection. The advanced injectors in the B153 area are mainly distributed in the northern area. Currently, the reservoir pressure is maintained at a level of 90.3%, but the pressure distribution on the plane is uneven.
The formation pressure in the middle of the northern part is higher than in the southern part. The north, which is low in shale content, low in plastic minerals, such as rock debris and mica, and high in brittle minerals, such as quartz and feldspar, has a higher brittleness index than the south. Moreover, the development intensity of natural fractures in the northern part is higher than that in the southern part. Thus, the development intensity of dynamic fractures in the northern part is higher than that in the southern part (Figure 14).
From the development status, it can be seen that the directional waterflooding of the producers in the northern part of the B153 area is serious, and dynamic fractures in the southern part are not prevalent, as the productivity of the producers is low, and they are inefficient.

4. Conclusions

Dynamic fractures are new fractures generated when the bottom hole pressure exceeds the crack pressure, or the effective fracture channels are generated by the reactivation of the closed natural fractures due to the holding pressure near the wellbore area of the injectors in the long process of water injection. The characterization of dynamic fractures should integrate static and dynamic data. Firstly, the rocks that easily form new fractures could be identified by the evaluation of rock brittleness based on the analysis of the rock mineral composition and triaxial-compression mechanics experiments. Secondly, beginning with the ancient tectonic stress field and combining the fracture characteristics of the core and geological outcrop observation, the multi-fractal method and the probabilistic neural network are applied to identify the natural fractures and quantitatively describe the distribution intensity of natural fractures. Based on the rock brittleness evaluation and natural fracture description, the distribution intensity of dynamic fractures is characterized by integrating the analysis of the BHP, fracture pressure, and production response characteristics. The intensity of dynamic fracture characterization in the B153 area of the Huaqing oilfield corresponds closely to the reservoir’s performance, which can effectively guide the development adjustment during the middle–high water-cut stage.
The characterization of dynamic fractures involves many disciplines, such as rock mechanics, tectonic stress, geology, and reservoir engineering. This study only discussed the characterization workflow of dynamic fractures. Due to the complexity of the formation mechanism, the tectonic stress field and dynamic fracture evolution still require further study.

Author Contributions

Conceptualization, Y.W.; methodology, Y.W.; formal analysis, Y.W.; data curation, Y.W.; writing—original draft preparation, Y.W. and X.S.; writing—review and editing, Y.W. and X.S.; project administration, X.S. All authors have read and agreed to the published version of the manuscript.

Funding

This research was funded by ‘the ballast stone project of PetroChina’, grant number 2022KT08.

Data Availability Statement

Not applicable.

Conflicts of Interest

The authors declare no conflict of interest.

References

  1. Wang, Y.; Song, X.; Tian, C.; Shi, C.; Li, J.; Hui, G.; Hou, J.; Gao, C.; Wang, X.; Liu, P. Dynamic fractures are an emerging new development geological attribute in water-flooding development of ultra-low permeability reservoirs. Pet. Explor. Dev. 2015, 42, 222–228. [Google Scholar] [CrossRef]
  2. Fan, T.; Song, X.; Wu, S.; Li, Q.; Wang, B.; Li, X.; Li, H.; Liu, H. A mathematical model and numerical simulation of waterflood induced dynamic fractures of low permeability reservoirs. Pet. Explor. Dev. 2015, 42, 496–501. [Google Scholar] [CrossRef]
  3. Van den Hoek, P.J.; Hustedt, B.; Sobera, M.; Mahani, H. Dynamic induced fractures in waterfloods and EOR. In Proceedings of the SPE Russian Oil and Gas Technical Conference and Exhibition, Moscow, Russia, 28–30 October 2008. [Google Scholar]
  4. Gadde, P.B.; Sharma, M.M. Growing injection well fractures and their impact on waterflood performance. In Proceedings of the SPE Annual Technical Conference and Exhibition, New Orleans, LA, USA, 30 September–3 October 2001. [Google Scholar]
  5. Van den Hoek, P.J. Impact of Induced Fractures on Sweep and Reservoir Management in Pattern Floods. In Proceedings of the SPE Annual Technical Conference and Exhibition, Houston, TX, USA, 26–29 September 2004. [Google Scholar]
  6. Dikken, B.J.; Niko, H. Waterflood-Induced Fractures: A Simulation Study of Their Propagation and Effects on Waterflood Sweep Efficiency. In Proceedings of the SPE Offshore Europe, Aberdeen, UK, 8–11 September 1987. [Google Scholar]
  7. Perkins, T.K.; Gonzalez, J.A. The effect of thermos–elastic stresses on injection well fracturing. Soc. Pet. Eng. J. 1985, 25, 78–88. [Google Scholar] [CrossRef]
  8. Hubbert, M.K.; Willis, D.G. Mechanics of hydraulic fracturing. J. Am. Assoc. Pet. Geol. 1957, 12, 239–257. [Google Scholar] [CrossRef]
  9. Sæby, J.; Bjørndal, H.P.; van den Hoek, P. Managed Induced Fracturing Improves Waterflood Performance in South Oman. In Proceedings of the International Petroleum Technology Conference, Doha, Qatar, 21–23 November 2005. [Google Scholar]
  10. Zeng, L.; Gao, C.; QI, J.; Wang, Y.; Li, L.; Qu, X. The distribution rule and seepage effect of the fractures in the ultra-low permeability sandstone reservoir in east Gansu Province, Ordos Basin. Sci. China Ser. D Earth Sci. 2008, 51, 44–52. [Google Scholar] [CrossRef]
  11. Zeng, L.; Li, X. Fractures in sandstone reservoirs with ultra-low permeability: A case study of the Upper Triassic Yanchang Formation in the Ordos Basin, China. AAPG Bull. 2009, 93, 461–477. [Google Scholar]
  12. Beugelsdijk, L.J.L.; de Pater, C.J.; Sato, K. Experimental hydraulic fracture propagation in a multi-fractured medium. Presented at the SPE Asia Pacific Conference On Integrated Modeling for Asset Management, Yokohama, Japan, 25–26 April 2000. [Google Scholar]
  13. Blanton, T.L. Propagation of hydraulically and dynamically induced fractures in naturally fractured reservoirs. Presented at the Unconventional Gas Technology Symposium, Louisville, KY, USA, 18–21 May 1986. [Google Scholar]
  14. Wang, Y.; Cheng, S.; Zhang, K.; He, Y.; Feng, N.; Qin, J.; Luo, L.; Yu, H. A comprehensive Work Flow to Characterize Waterflood-Induced Fractures by Integrating Real-tine Monitoring, Formation Test, and Dynamic Production Analysis Applied to Changqing Oil Field, China. SPE Res. Eval. Eng. 2018, 22, 692–708. [Google Scholar] [CrossRef]
  15. Bhardwaj, P.; Hwang, J.; Manchanda, R.; Shauma, M. Injection Induced Fracture Propagation and Stress Reorientation in Waterflooded Reservoirs. Presented at the SPE Annual Technical Conference and Exhibition, Dubai, United Arab Emirates, 26–28 September 2016. [Google Scholar]
  16. Waheibi, H.A.; Garimella, S.; Wardy, W. Safeguarding Reserves of a Large Carbonate Waterflood Field by Preventing Induced Fractures. Presented at the SPE Reservoir Characterization and Simulation Conference and Exhibition, Abu Dhabi, United Arab Emirates, 16–18 September 2013. SPE-165967-MS. [Google Scholar]
  17. Wang, Y.; Cheng, S.; Qin, J.; Lei, Z.; An, X.; Yu, H. Development theory and practice of water injection induced fractures in ultra-low permeability reservoirs. Sci. Sin. Technol. 2022, 52, 613–626. [Google Scholar] [CrossRef]
  18. Wang, W.; Peng, H.; Li, G.; Lyu, W.; Wei, C.; Qin, Y. Opening mechanism of dynamic fractures caused by water injection and effective adjustments in low permeability reservoirs. Daqing oilfield in Songliao Basin. Oil Gas Geol. 2015, 36, 842–847. [Google Scholar]
  19. Taleghani, A.D.; Olson, J.E. How Natural Fractures Could Affect Hydraulic-Fracture Geometry. SPE J. 2014, 19, 161–171. [Google Scholar] [CrossRef]
  20. Gu, H.; Weng, X.; Lund, J.; Mack, M.; Ganguly, U.; Suarez-Rivera, R. Hydraulic Fracture Crossing Natural Fracture at Nonorthogonal Angles: A Criterion and its Validation. SPE Prod. Oper. 2012, 27, 20–26. [Google Scholar] [CrossRef]
  21. Xia, H.; Yang, S.; Gong, H.; Wang, C. Research on rock brittleness experiment and logging piediction of hydraulic fracture height & width. J. Southwest Pet. Univ. Sci. Technol. Ed. 2013, 35, 81–89. [Google Scholar]
  22. Xu, L.; Zhou, L.; Zhang, Y.; Dang, B. Characteristics and tectonic setting of tectono-stress field of Ordos basin. Geotecton. Metallog. 2006, 30, 455–462. [Google Scholar]
  23. Liu, G. Research on Fracture Developing Characteristics of Chang 63 Reservoir, Yanchang Group in Huaqing Aera, Changqing Petroleum Field. Ph.D. Thesis, Lanzhou University, Lanzhou, China, 2010. [Google Scholar]
  24. Liu, G.; Huang, C.; Zhou, X.; Zhang, L.; Pan, Y. Quantitative evaluation of fracture development for Triassic Yanchang Formation, Ordos Basin, NW China. Pet. Explor. Dev. 2015, 42, 486–496. [Google Scholar] [CrossRef]
  25. Zeng, L.; Li, Z.; Shi, C.; Wang, Z.; Zhao, J.; Wang, Y. Characteristics and origin of fractures in the extra-low permeability sandstone reservoirs of the Upper Triassic Yanchang Formation in the Ordos Basin. Acta Geol. Sin. 2007, 81, 174–178. [Google Scholar]
  26. Pan, B.; Xue, L. Fractal Dimension and Its Application to Geologic Interpretation of Log Data. Logging Technol. 1992, 16, 214–221. [Google Scholar]
  27. Yang, X. Review of Fractal Research in Geophysics. Adv. Earth Sci. 1991, 6, 31–37. [Google Scholar]
  28. Yue, Y.; Wang, C. The application of multifractals in fracture research. Geophys. Prospect. Pet. 1998, 37, 109–114. [Google Scholar]
  29. Chen, Y.; Chen, L. Fractal Geometry, 2nd ed.; Seismological Press: Beijing, China, 2005; pp. 121–122. [Google Scholar]
  30. Sun, X.; Wu, Z.; Huang, Y. Fractal Principle and Its Application; China University of Science and Technology Press: Hefei, China, 2003; pp. 53–74. [Google Scholar]
  31. Cheng, G.; Zhou, G.; Wang, X. The probability Neural Networks for Lithology Identification. Micro-Comput. Inf. 2007, 23, 288–289. [Google Scholar]
  32. Yang, B.; Kuang, L.; Sun, Z. Neural Network and Its Application in Oil Well Logging; Petroleum Industry Press: Beijing, China, 2005. [Google Scholar]
  33. Zhang, H.; Zou, L.; Shen, X. The Application of BP Neural Network in Well Lithology Identification. Geol. Explor. 2002, 38, 63–65. [Google Scholar]
  34. Cheng, W.; Jin, Y.; Chen, M.; Xu, T.; Zhang, Y.; Diao, C. A criterion for identifying hydraulic fractures crossing natural fractures in 3D space. Pet. Explor. Dev. 2014, 41, 336–339. [Google Scholar] [CrossRef]
  35. Chen, M.; Jin, Y.; Zhang, G. Rock Mechanics in Petroleum Engineering; Science Press: Beijing, China, 2008. [Google Scholar]
  36. Yan, T.; Li, W.; Bi, X. An experimental study of fracture initiation mechanisms during hydraulic fracturing. Pet. Sci. 2011, 8, 87–92. [Google Scholar] [CrossRef] [Green Version]
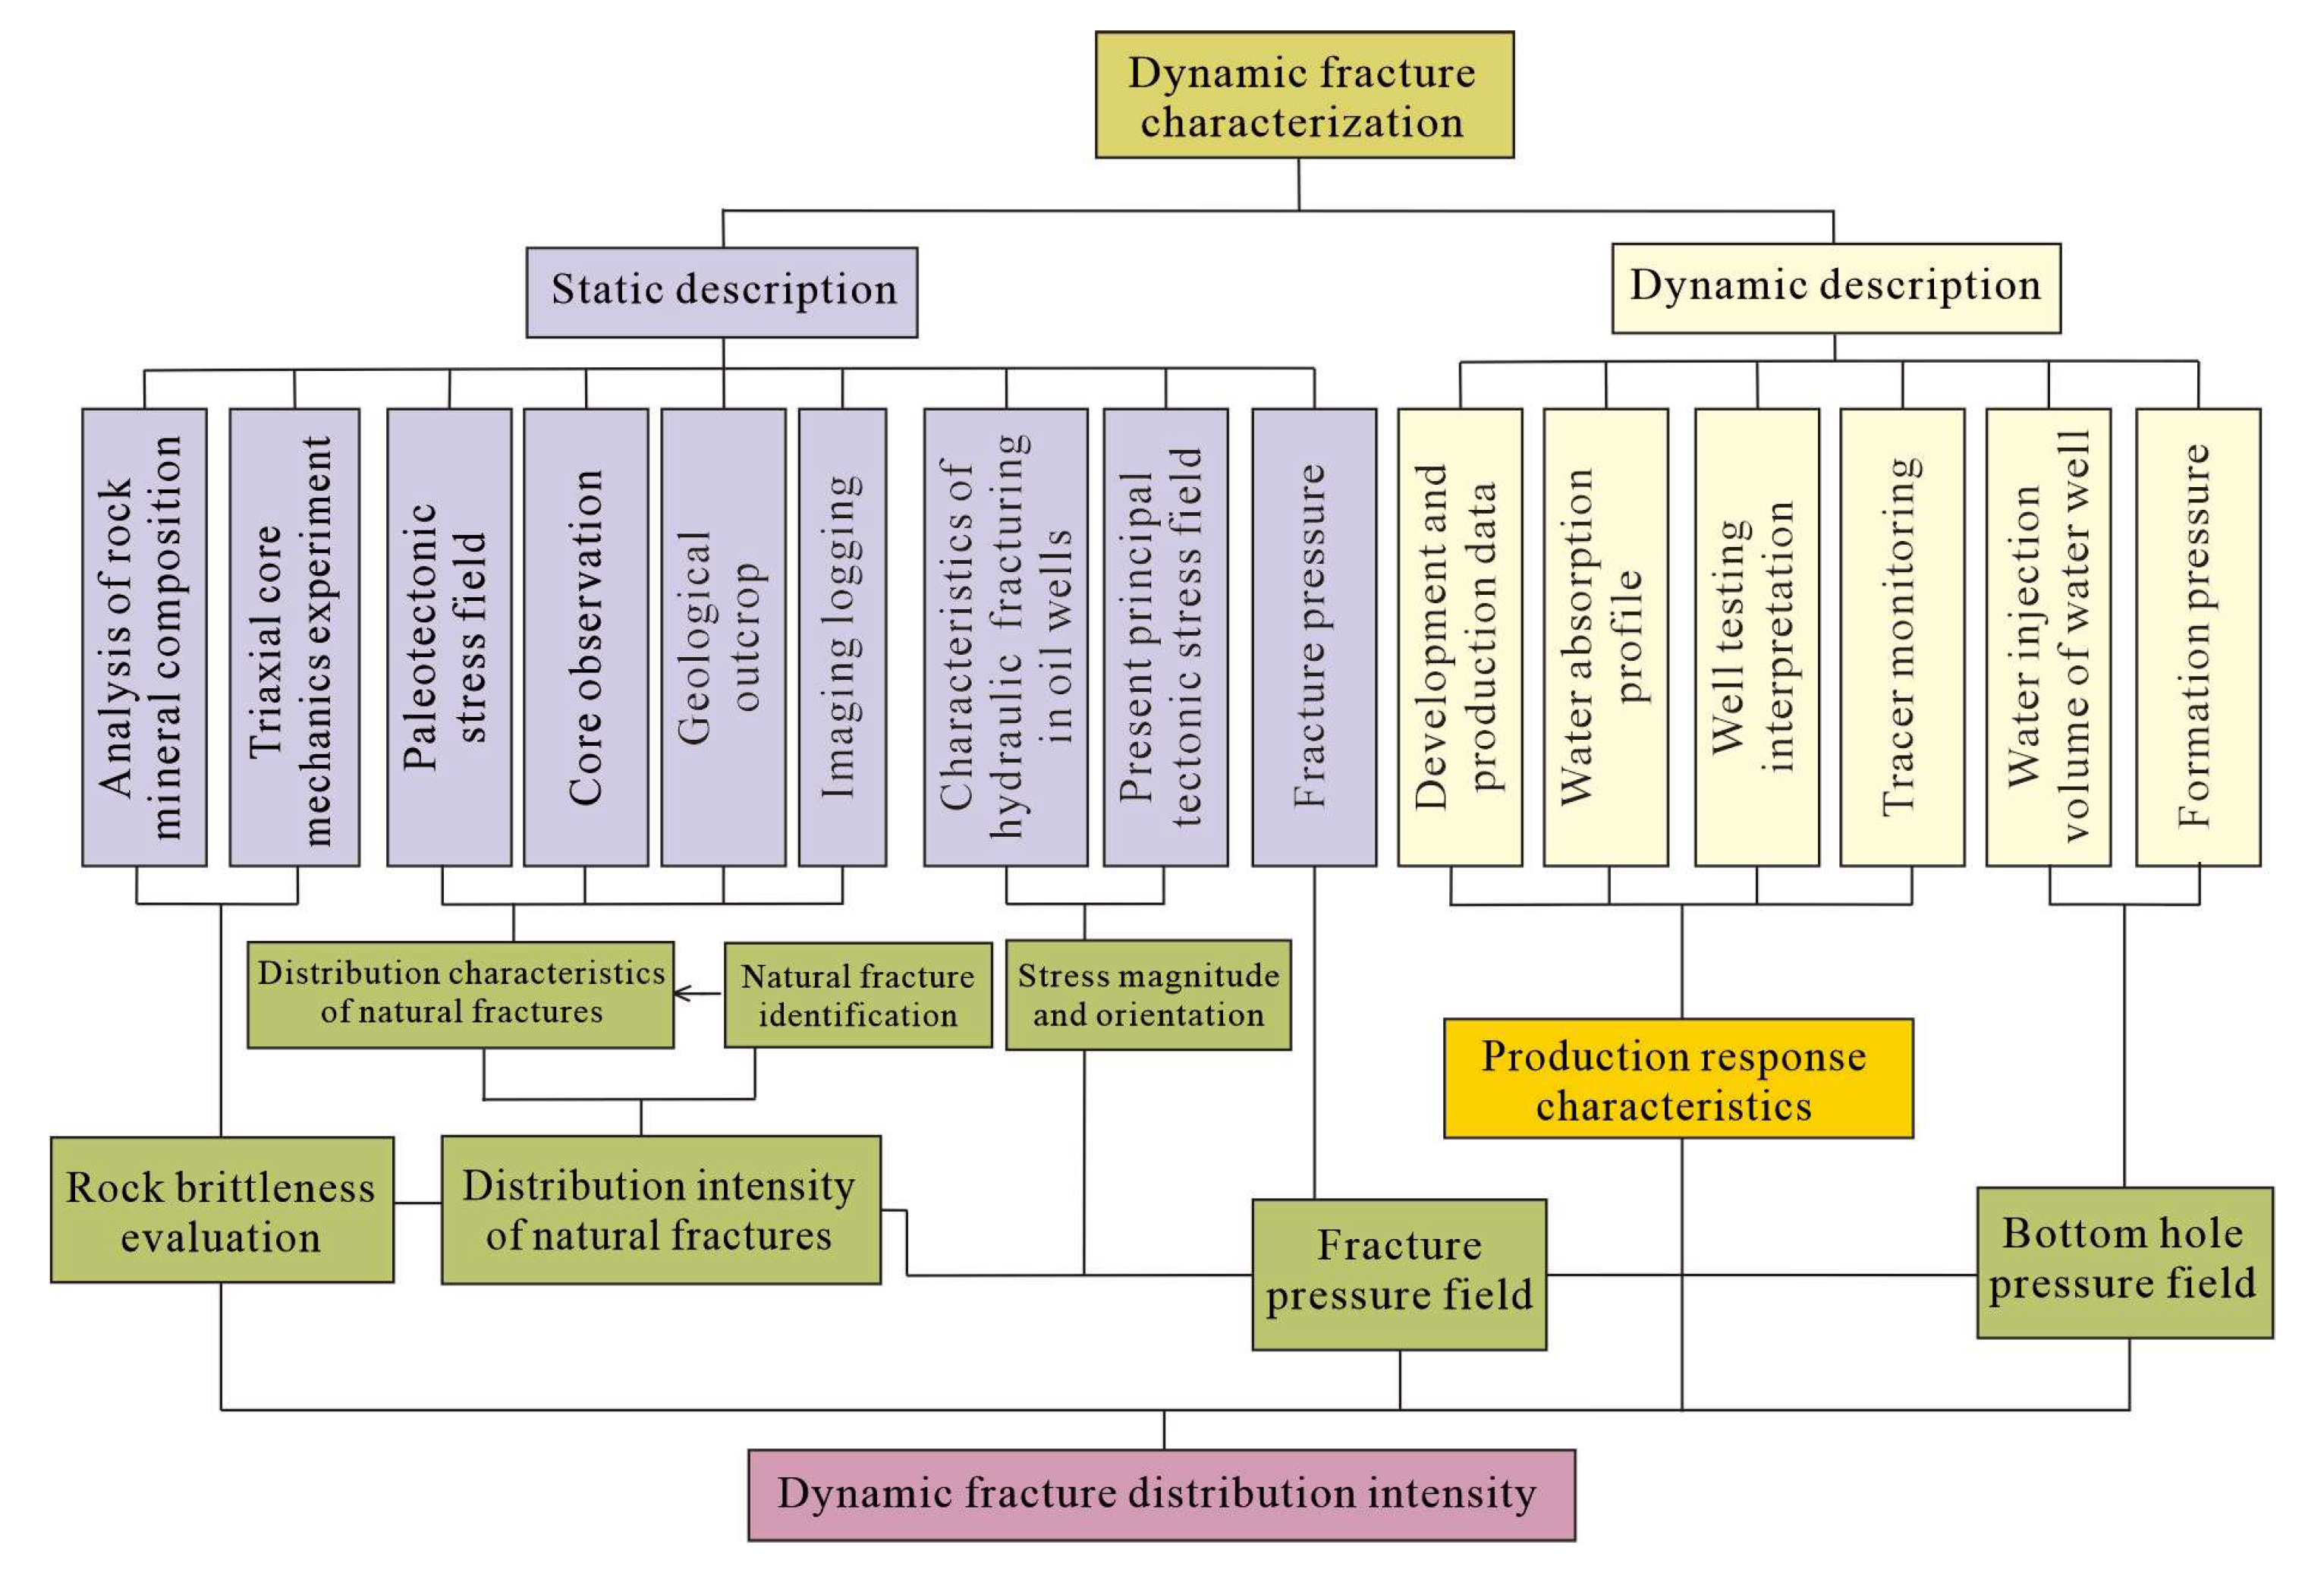
Figure 1. Characterization workflow diagram of dynamic fracture.
Minerals 12 01277 g001
Figure 2. Brittleness index evaluation ((left) Well G134-144 in northern part; (right) Well B493 in southern part).
Minerals 12 01277 g002
Figure 3. Case analysis. (a) Comprehensive column diagram of Well W22-03; (b) Water-absorption profile; (c) Tracer monitoring direction; (d) Well-testing interpretation.
Minerals 12 01277 g003aMinerals 12 01277 g003b
Figure 4. Fractures of Well B501.
Minerals 12 01277 g004
Figure 5. Rose diagram of natural fractures (based on imaging logging).
Minerals 12 01277 g005
Figure 6. Natural fracture characteristics of geological outcrop.
Minerals 12 01277 g006
Figure 7. Natural fracture density of single well.
Minerals 12 01277 g007
Figure 8. Natural fracture intensity distribution.
Minerals 12 01277 g008
Figure 9. Comprehensive column diagram of Well G122-159 (left); and water-absorption profile (right).
Minerals 12 01277 g009
Figure 10. Production curve of G123-161.
Minerals 12 01277 g010
Figure 11. FMI imaging logging.
Minerals 12 01277 g011
Figure 12. Fracture pressure distribution of B153.
Minerals 12 01277 g012
Figure 13. BHP distribution of B153.
Minerals 12 01277 g013
Figure 14. Dynamic fracture distribution intensity of B153.
Minerals 12 01277 g014
Table 1. Mechanical parameters of rocks with different lithology.
WellLithologyDepth/mDensity/
g/cm3
Confining Pressure, Pore Pressure/MPaCompressive Strength σ1/MpaElastic Modulus E/GPaPoisson’s Ratio μBrittleness Index %
ABrown fine sandstone1028.262.275, 289.4130.1838.88
BGrayish-white calcareous sandstone1025.672.515, 2118.4221.450.1843.99
CGreyish-black siltstone1035.12.585, 278.3910.570.2231.03
Publisher’s Note: MDPI stays neutral with regard to jurisdictional claims in published maps and institutional affiliations.