
Evaluation of Operating Performance of Backfilling Hydraulic Support Using Six Hybrid Machine Learning Models


Abstract
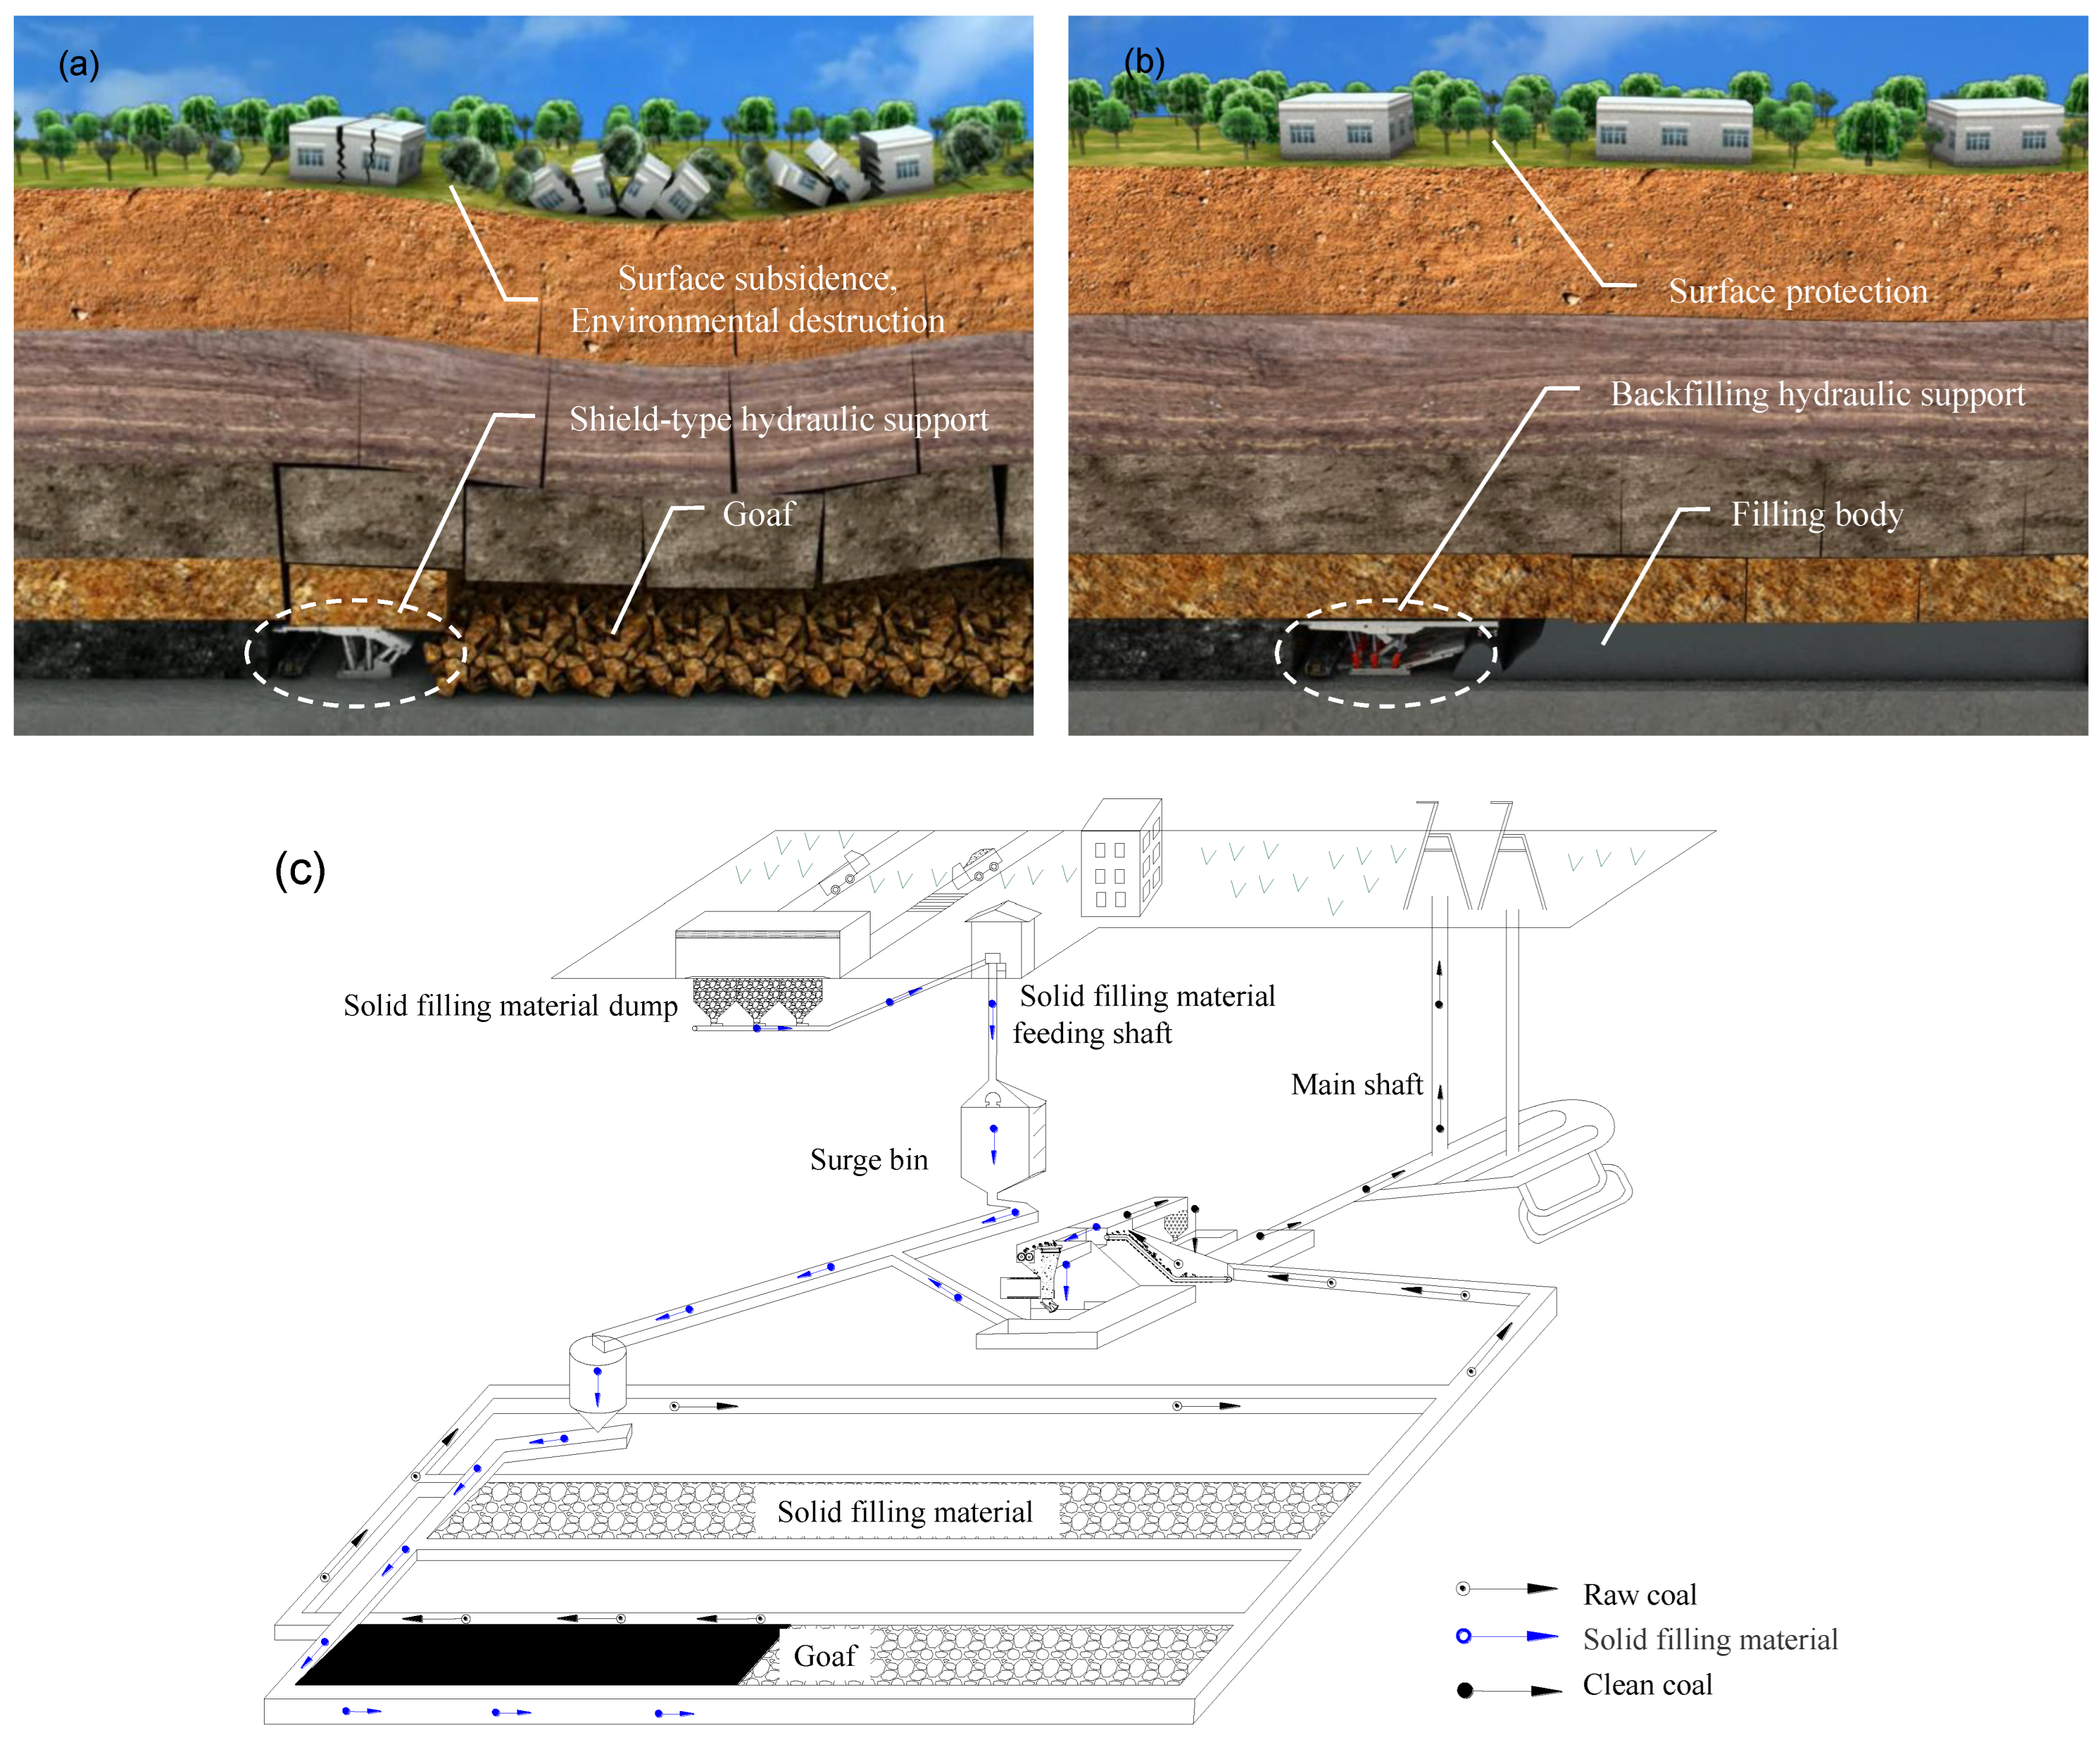
:1. Introduction
2. Establishment of Evaluation Indices and Materials
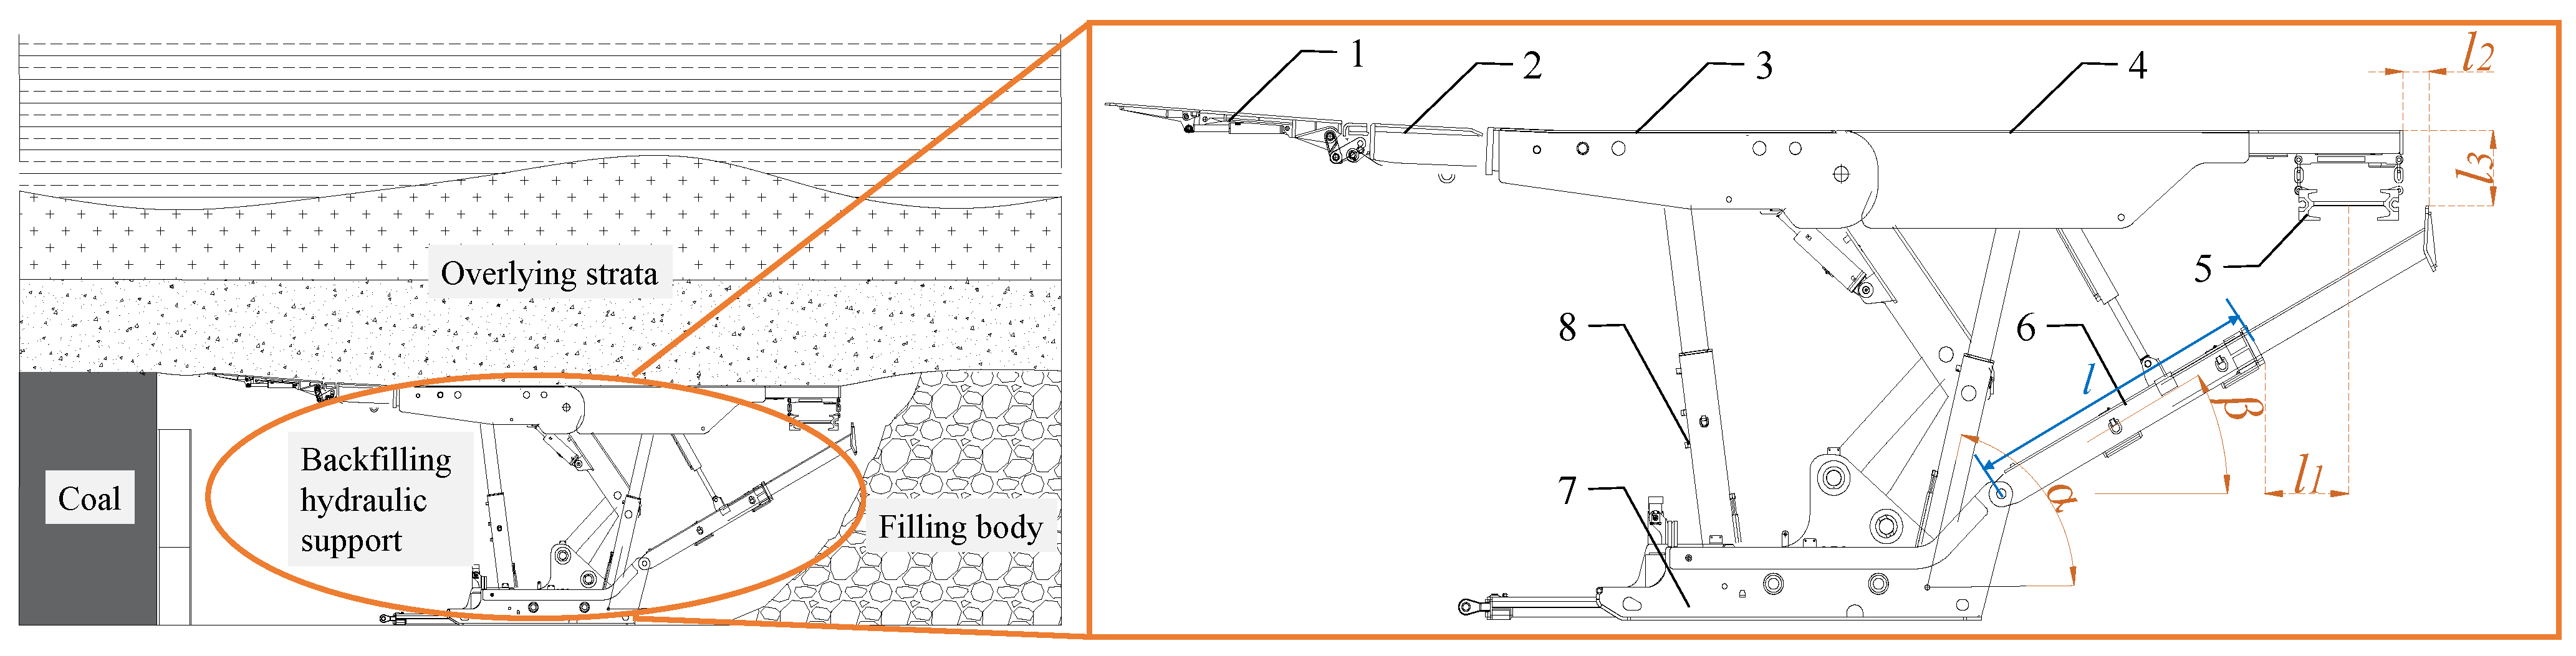
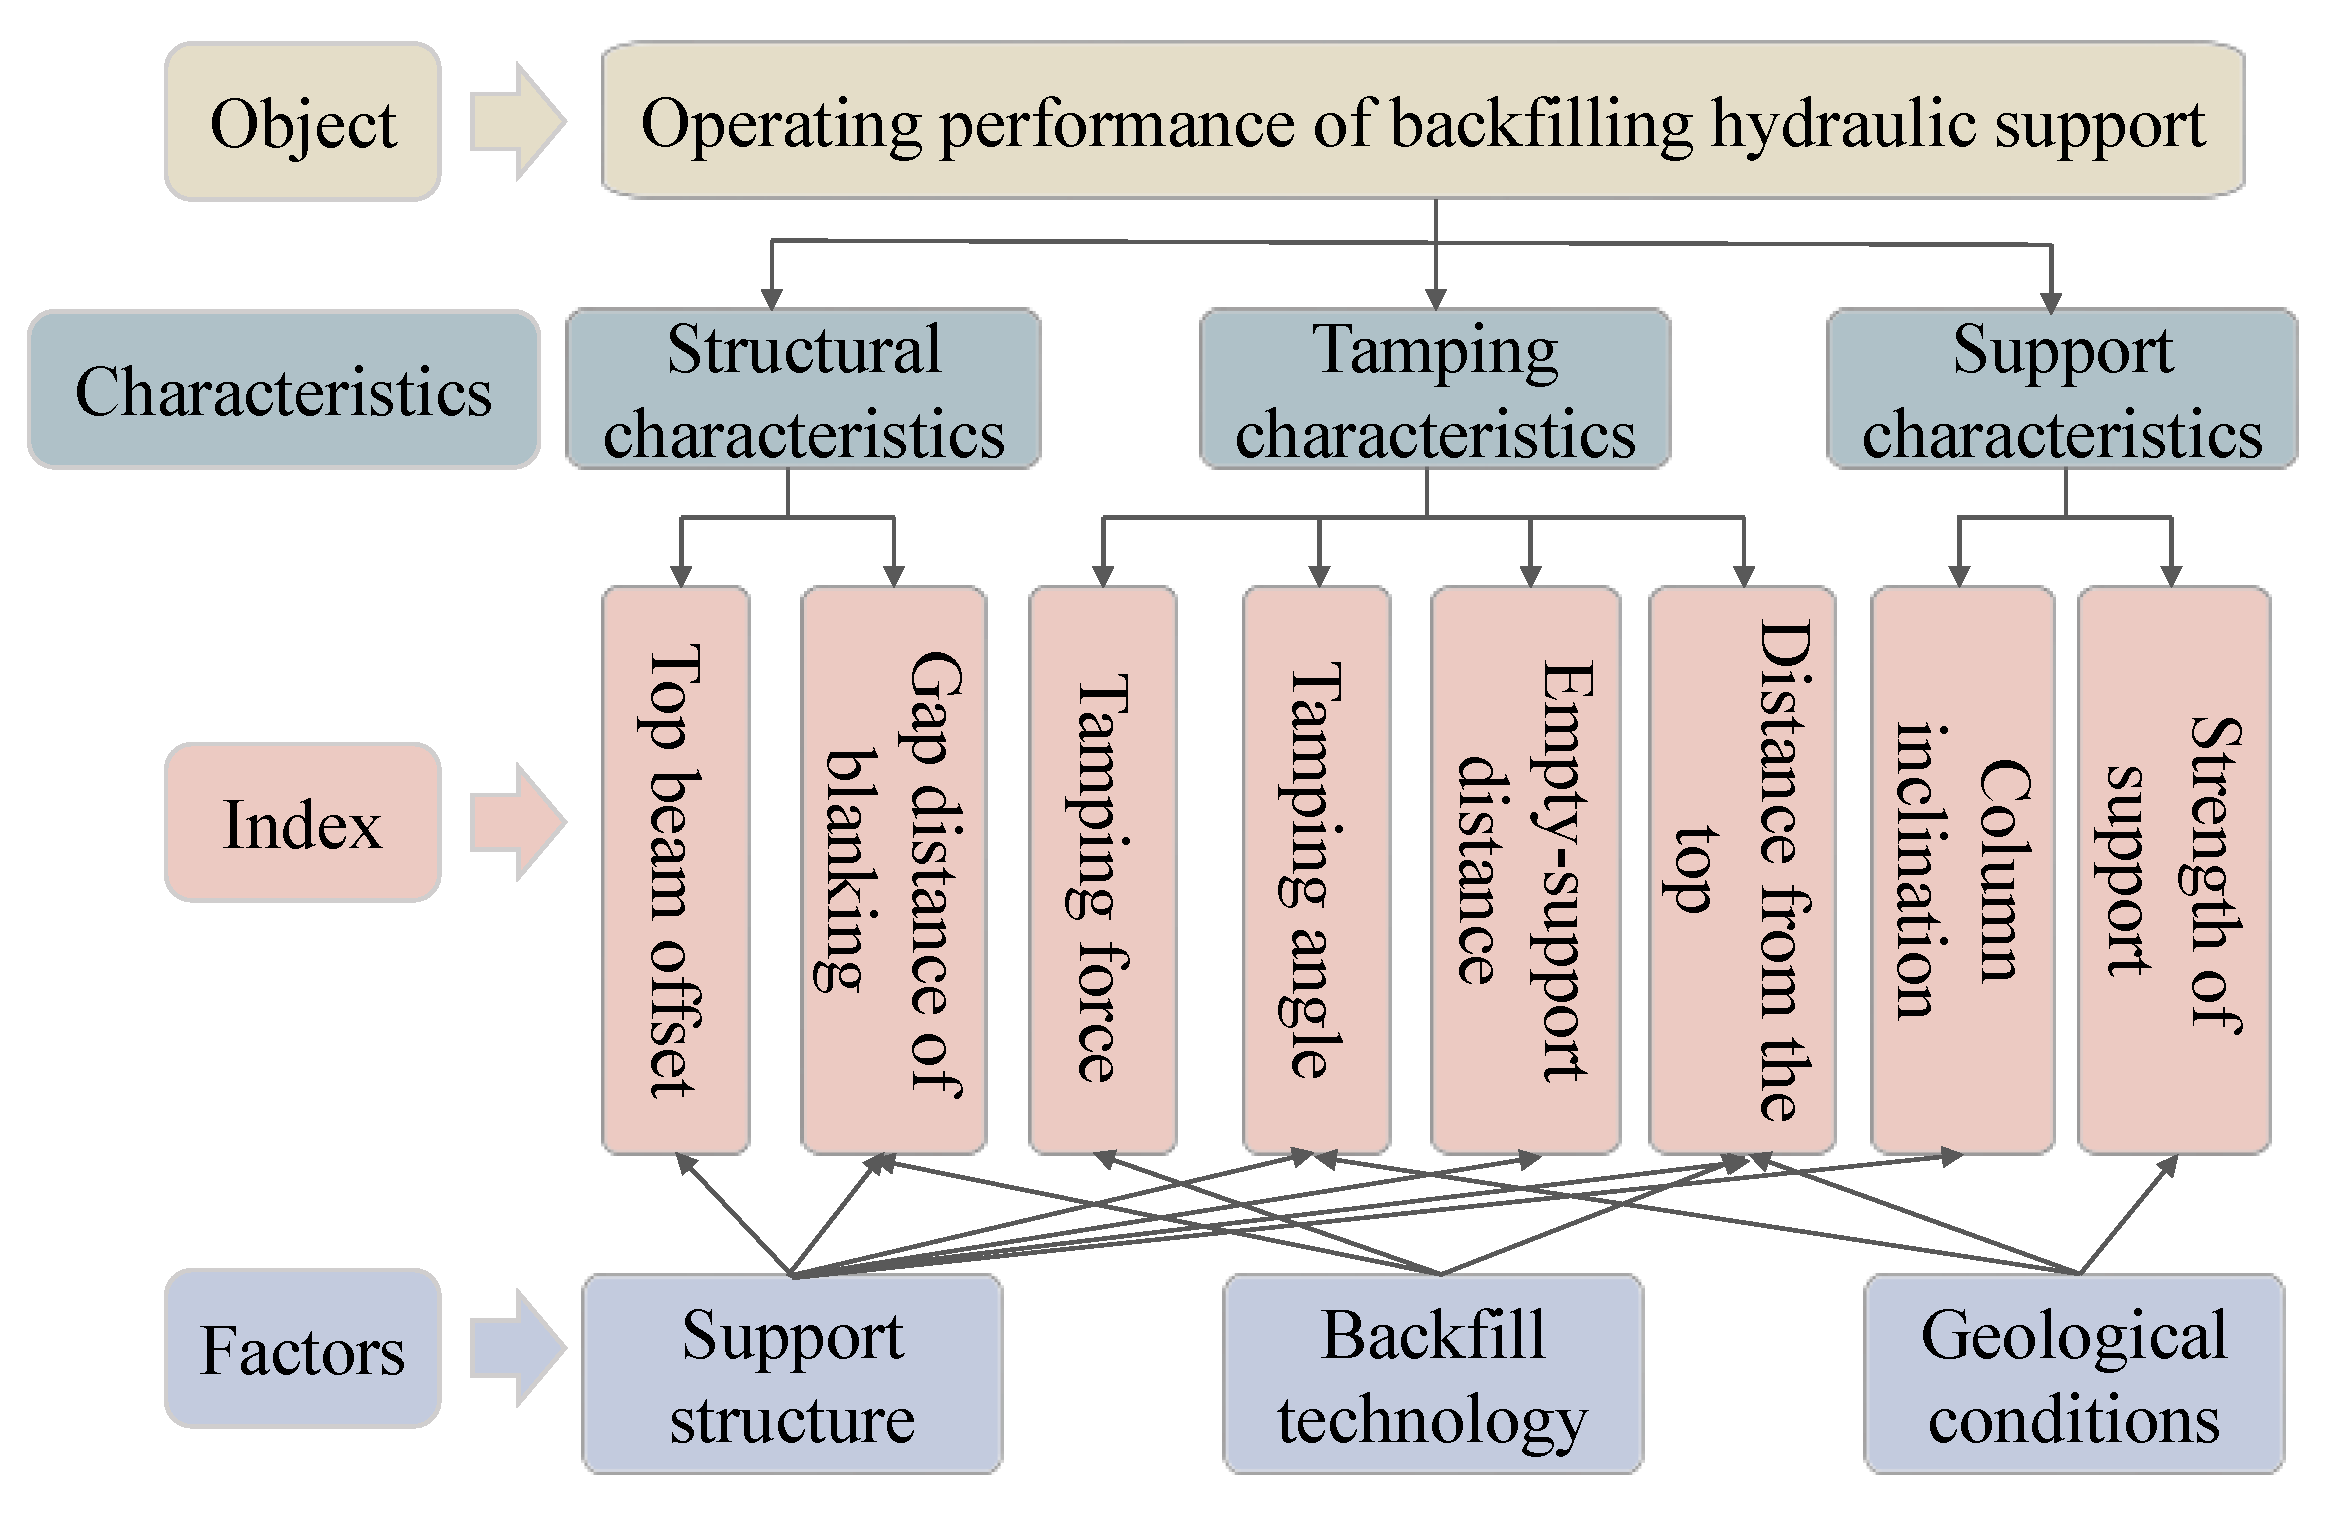
2.1. Determination of Evaluation Indices of the Operating Performances of Backfilling Hydraulic Supports
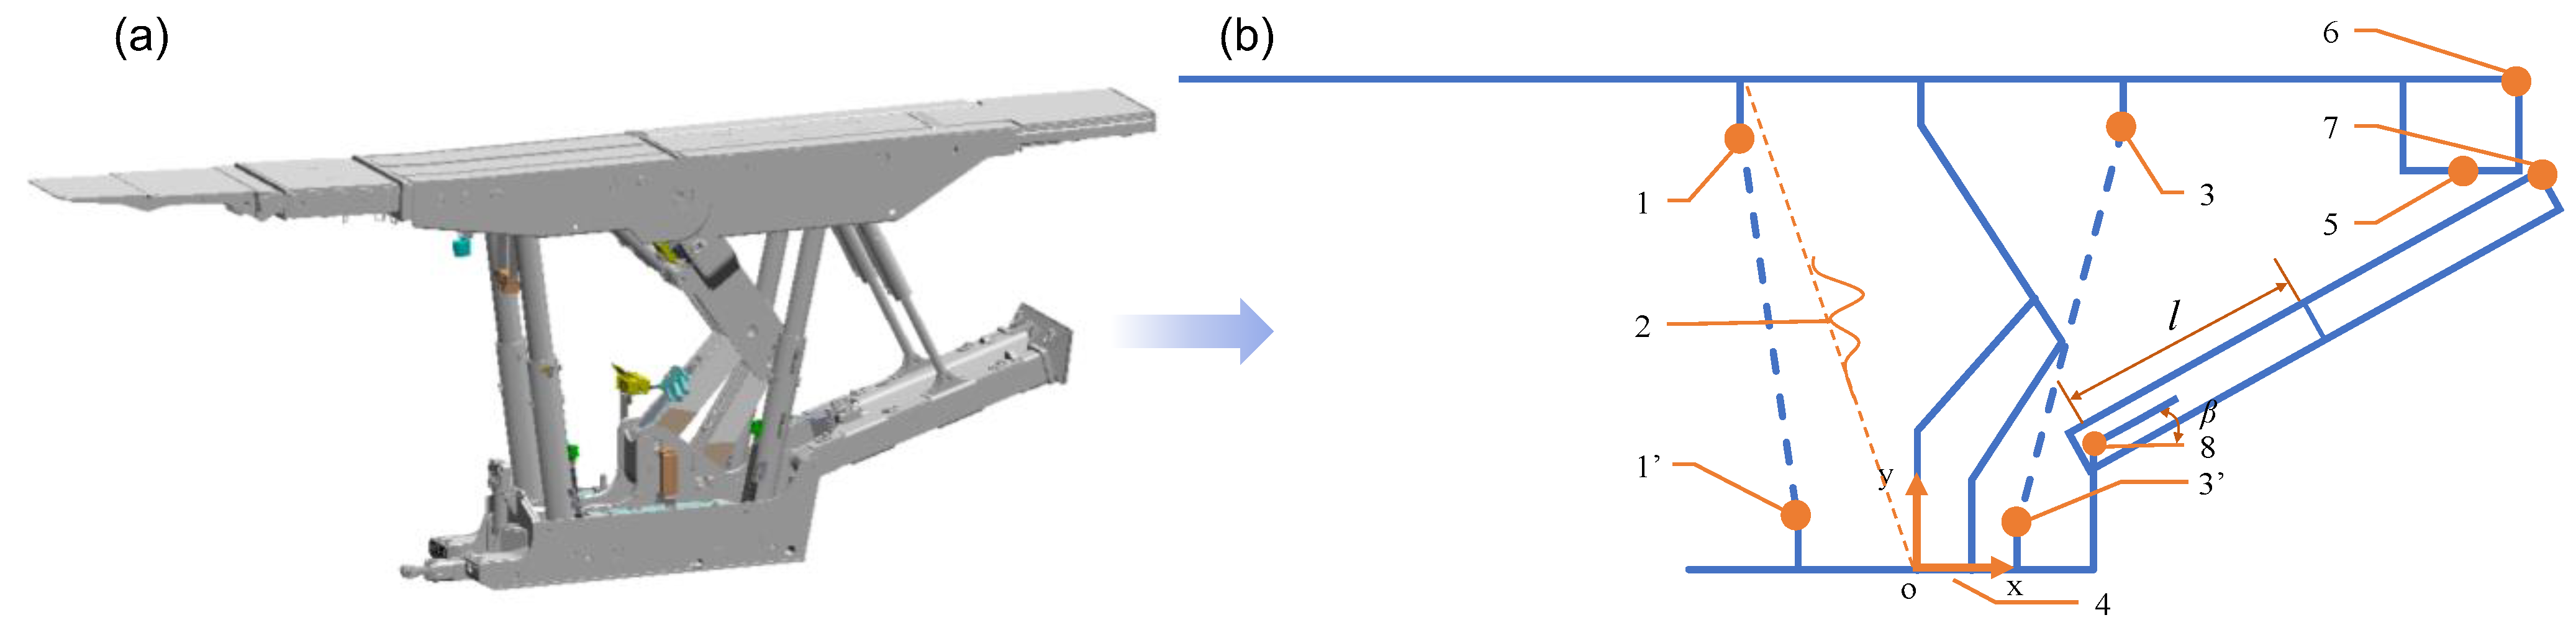
2.2. Acquisition of Operating Performance Indices and Preparation of Datasets
3. X06—Initial abscissa of monitoring point 63. Methodology
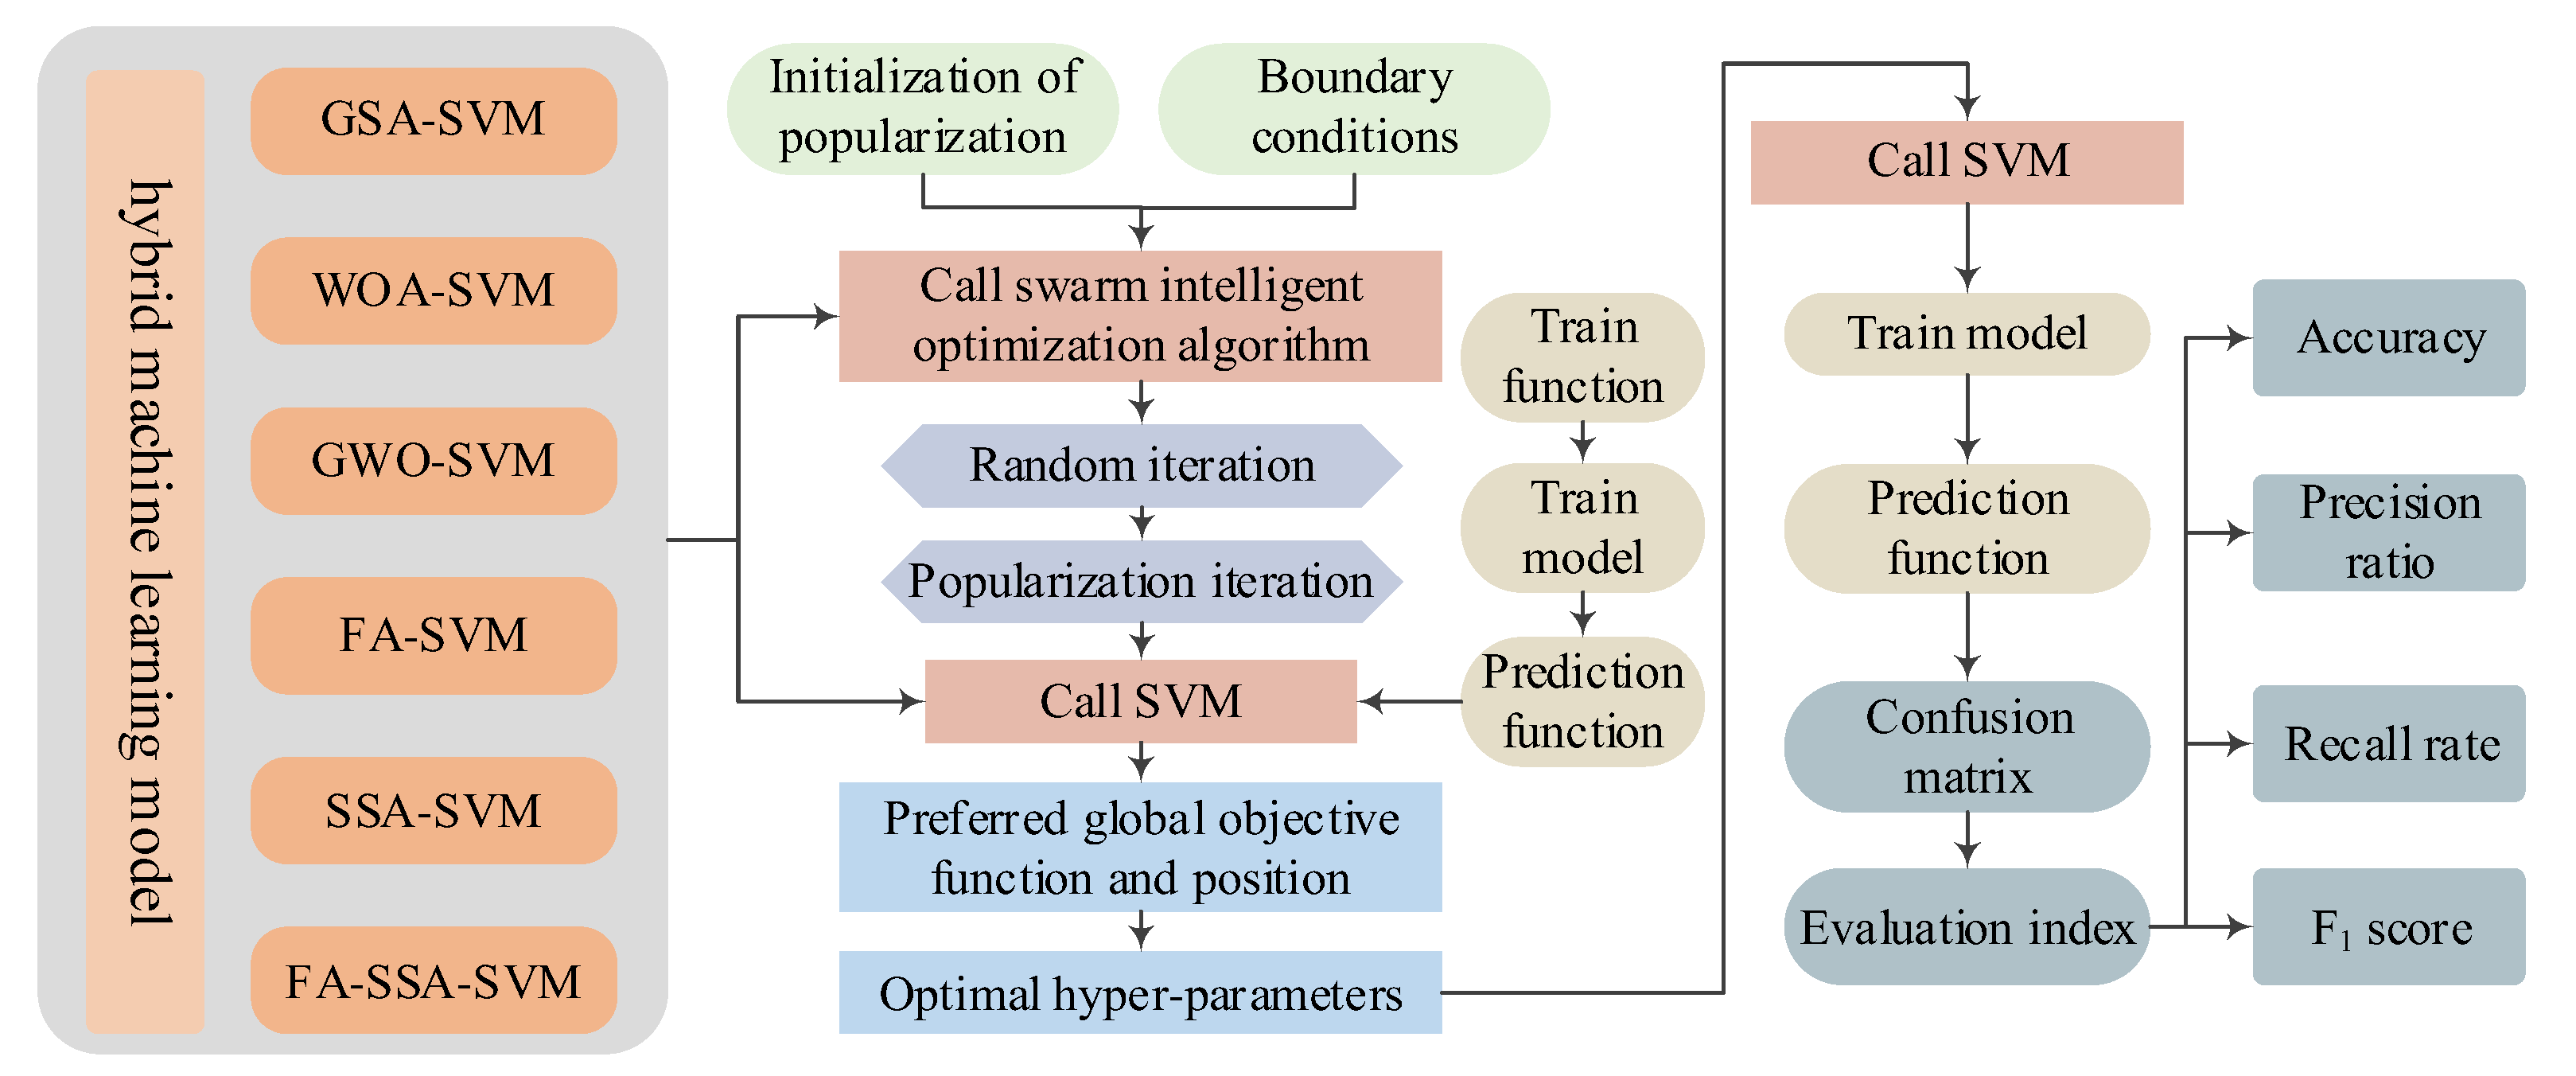
3.1. Principle of Hybrid Machine Learning Models
3.2. Support Vector Machine
3.3. Hybrid Machine Learning Models
3.3.1. SVM Models Optimized by a Single Swarm Optimization Algorithm
- (1)
- SVM optimized by gravity search algorithm (GSA-SVM)
- (2)
- SVM optimized by whale optimization algorithm (WOA-SVM)
- (3)
- SVM optimized by gray wolf optimization algorithm (GWO-SVM)
- (4)
- SVM optimized by firefly algorithm (FA-SVM)
- (5)
- SVM optimized by sparrow search algorithm (SSA-SVM)
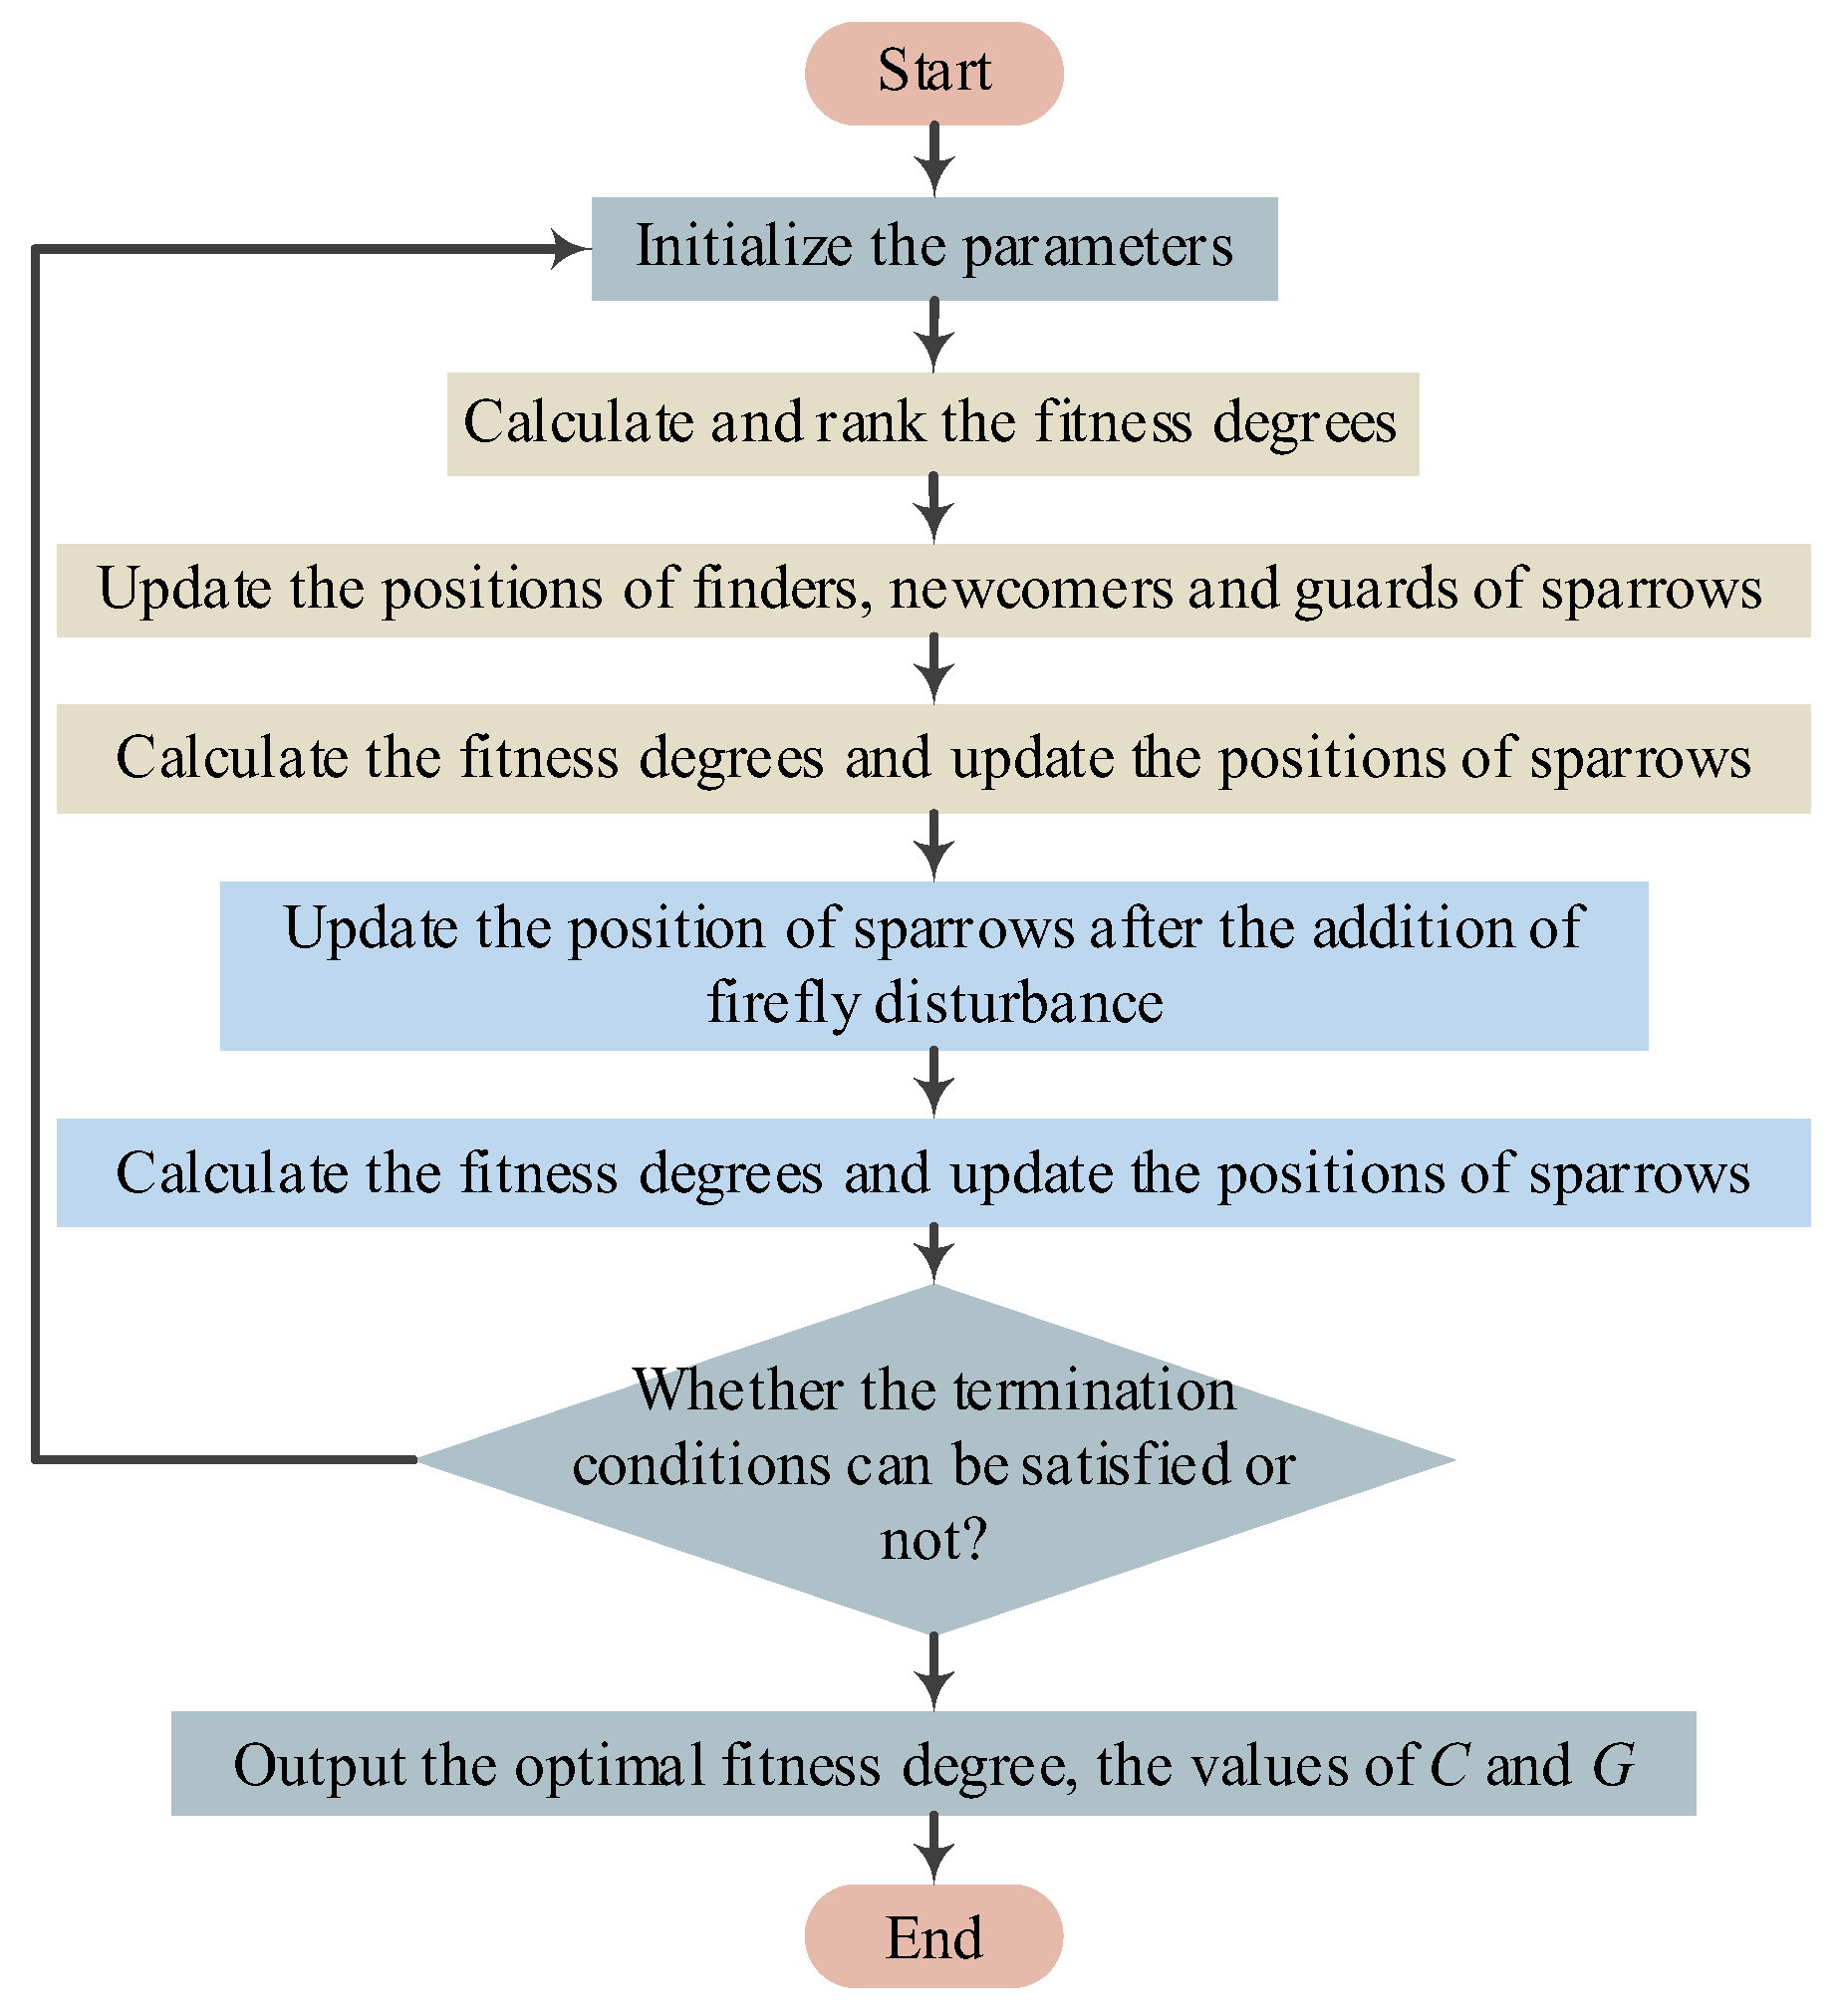
3.3.2. Model of Improved Optimization Algorithm—SVM Optimized by Firefly-Disturbed SSA (FA-SSA-SVM)
4. Results and Discussion
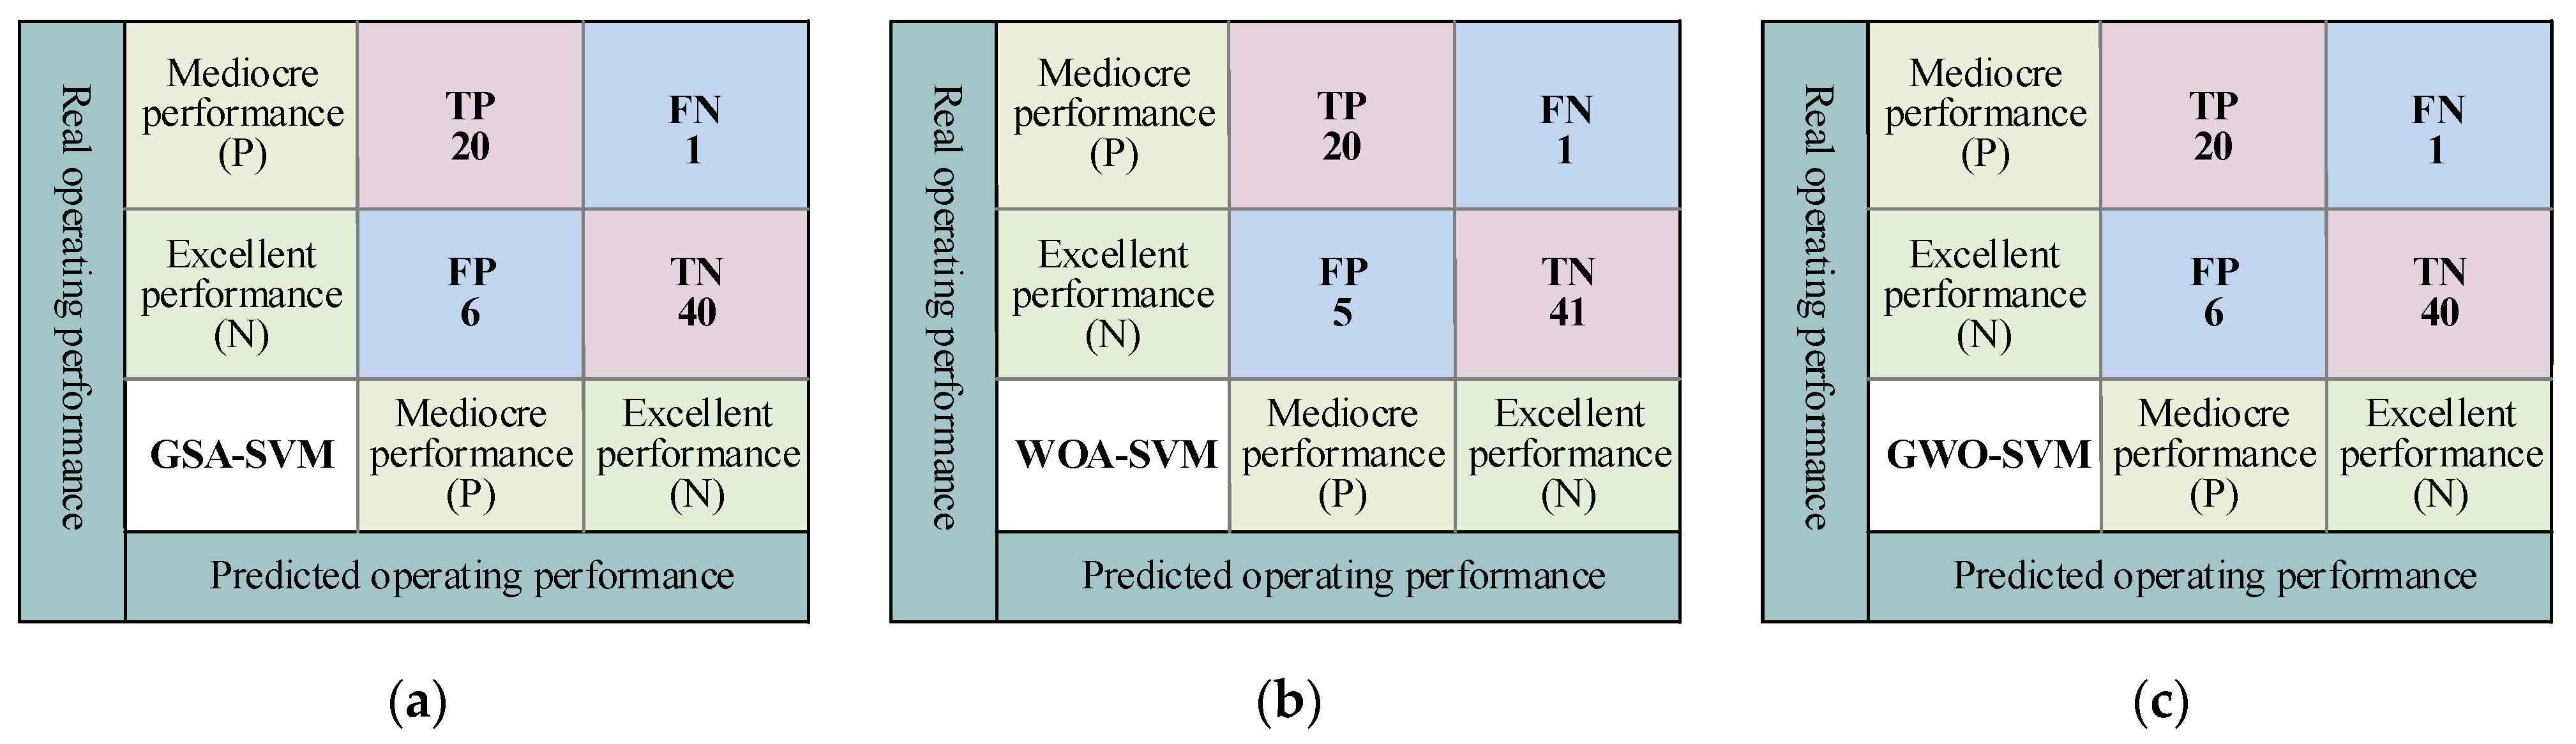
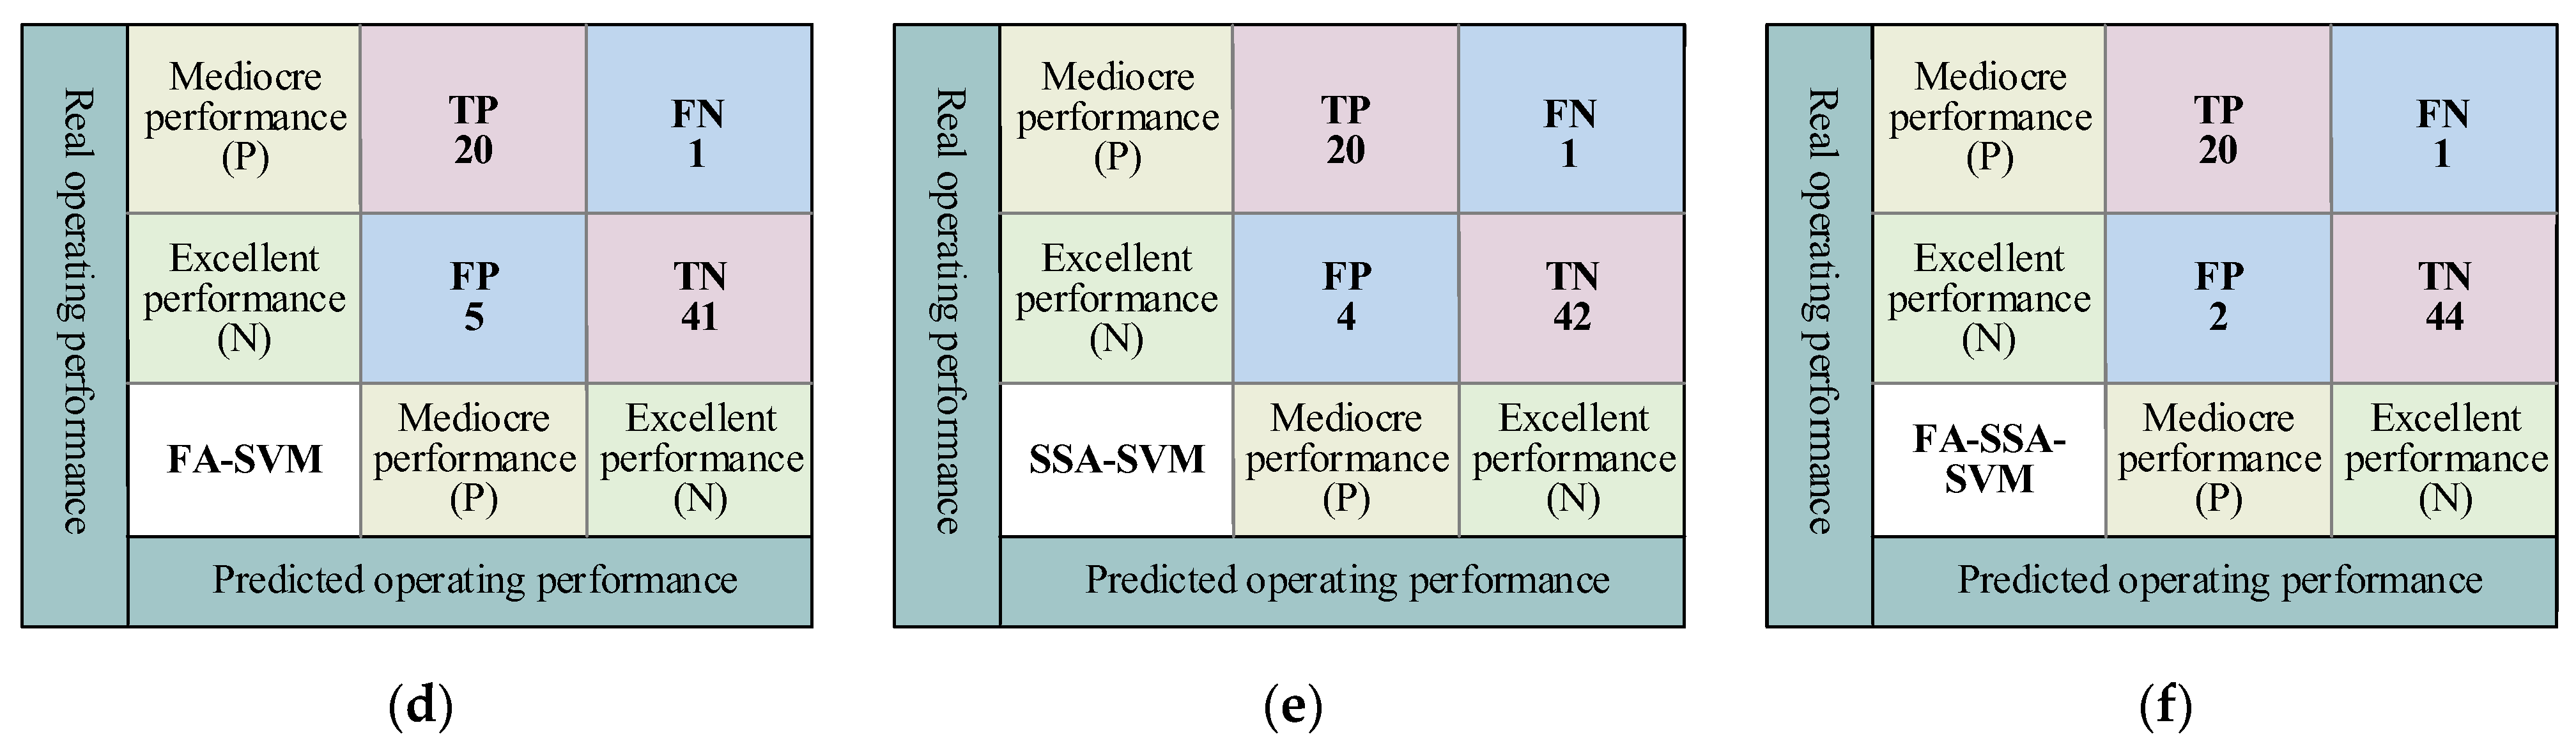
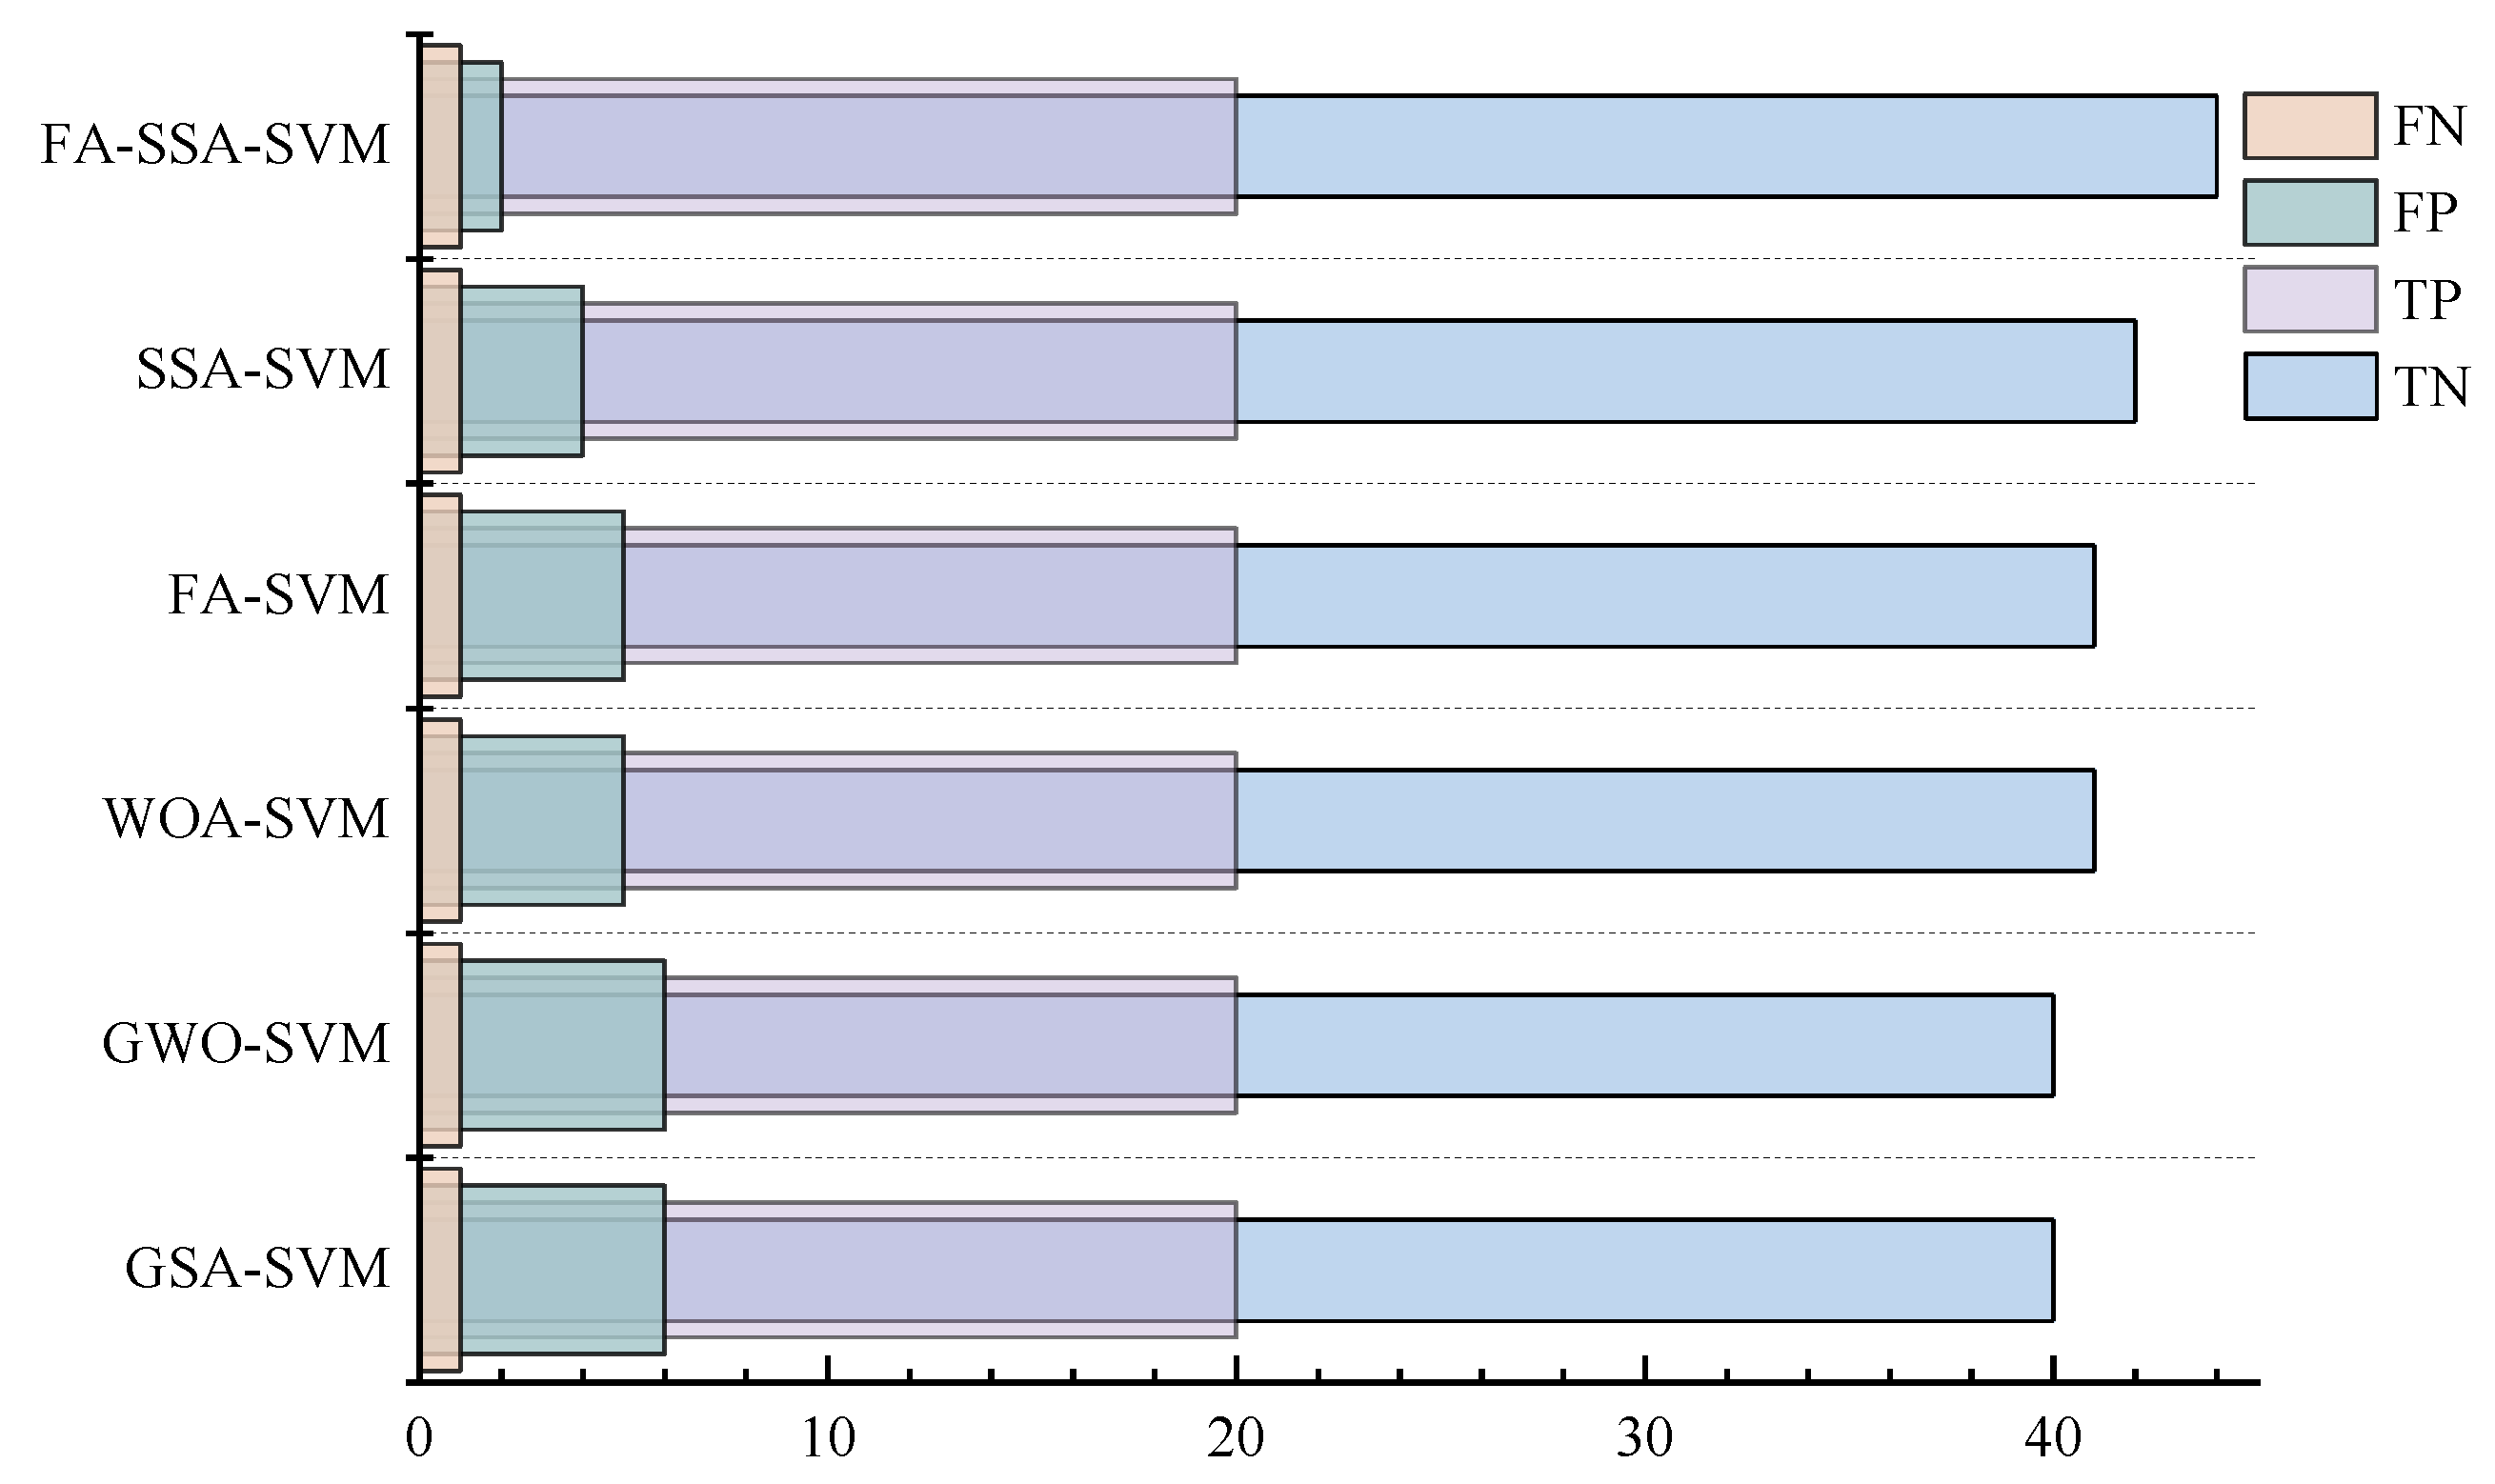
4.1. Model Validation Evaluation and Contrast Analysis
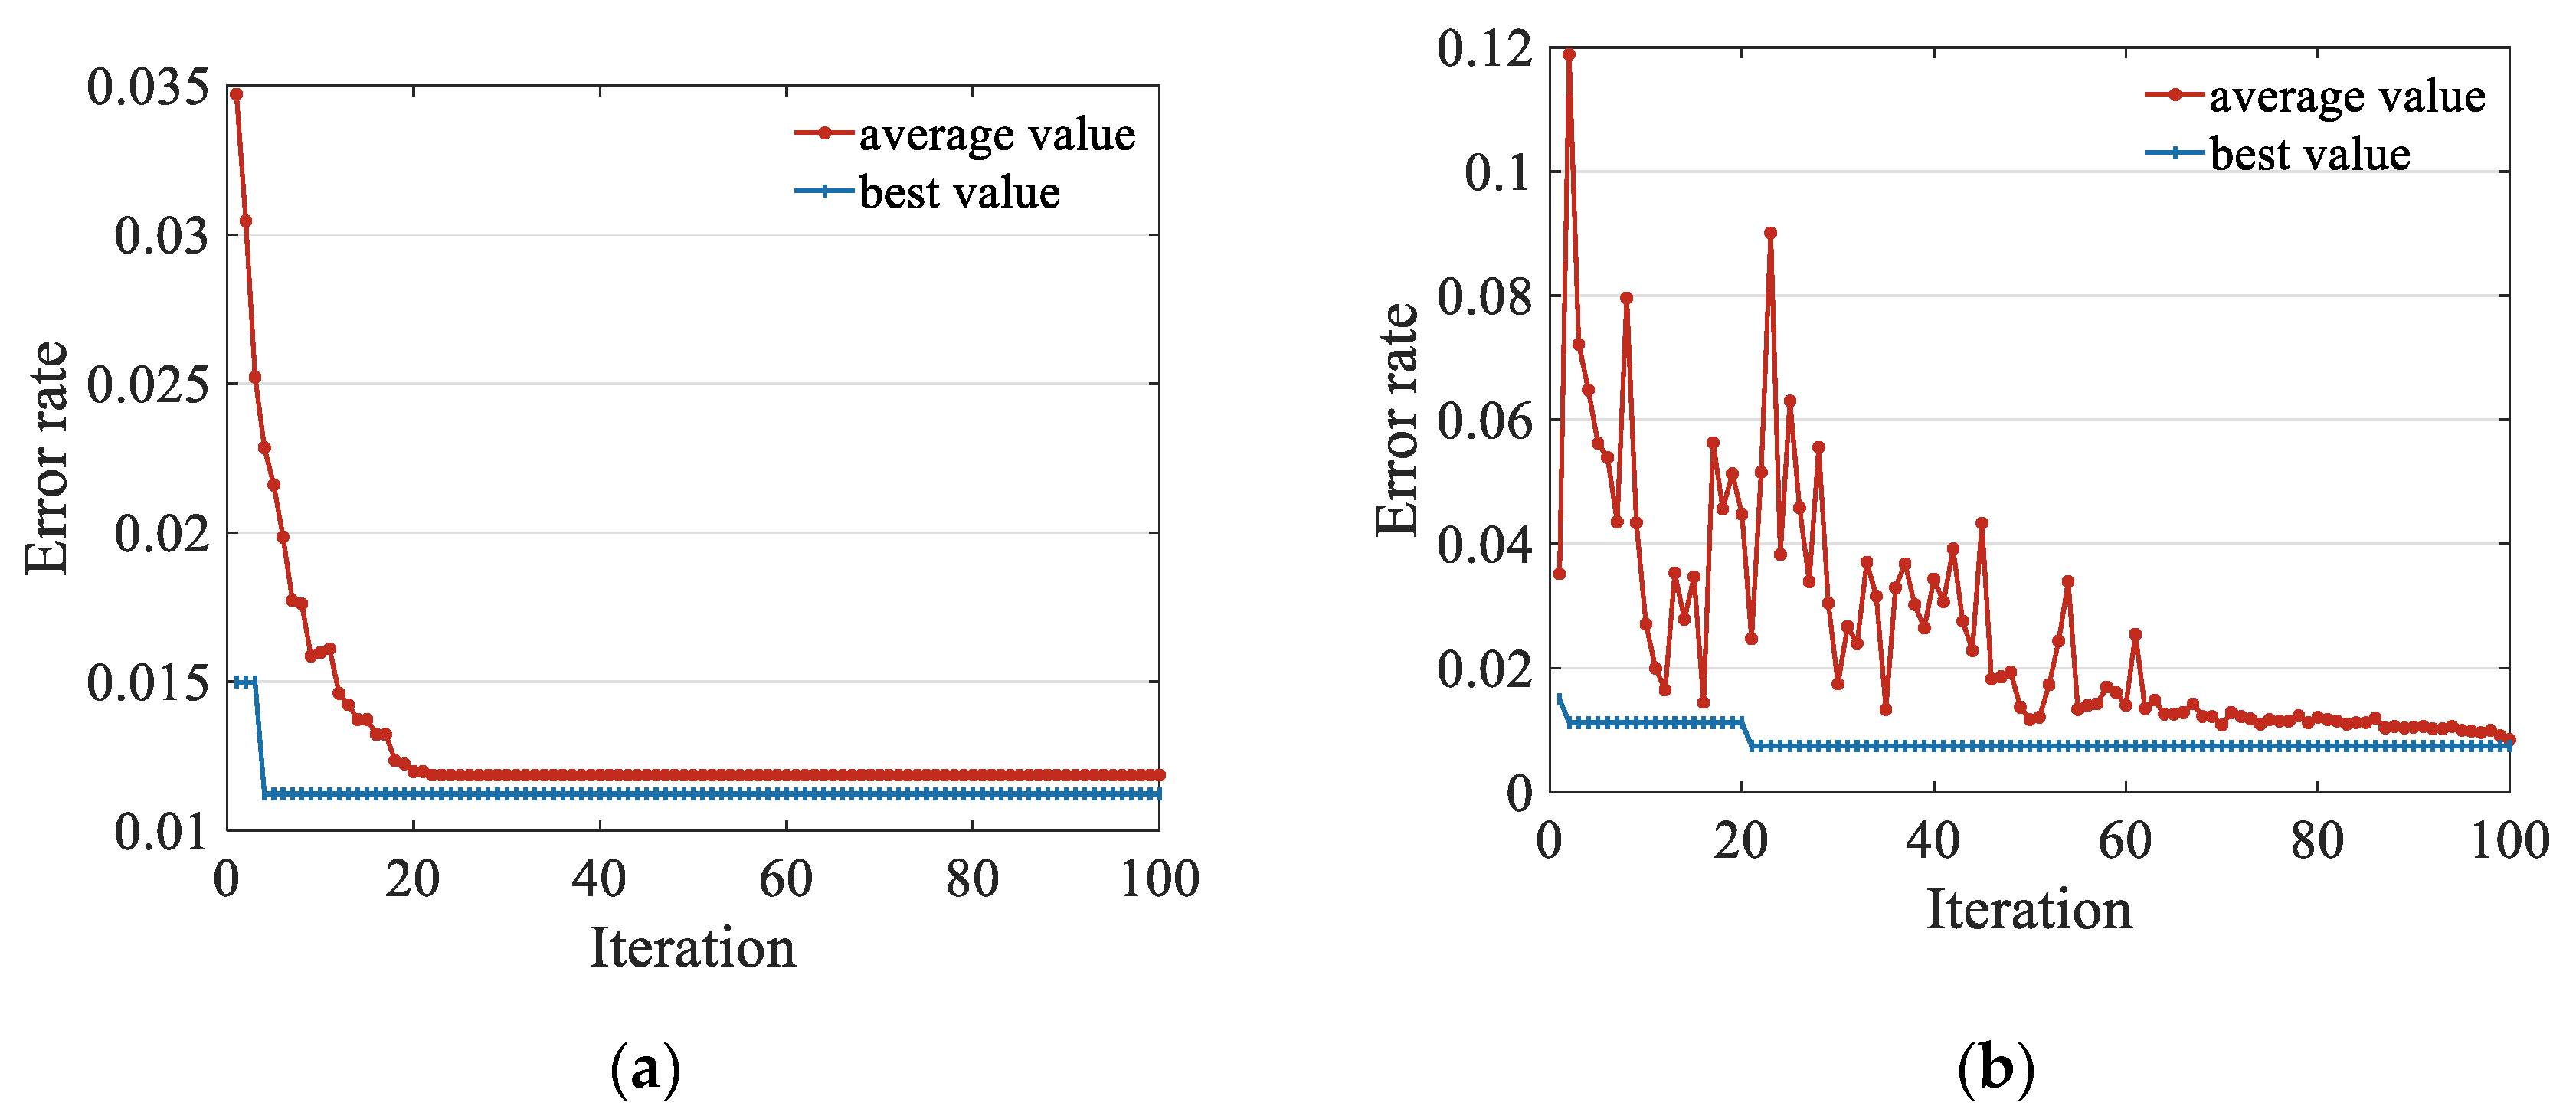
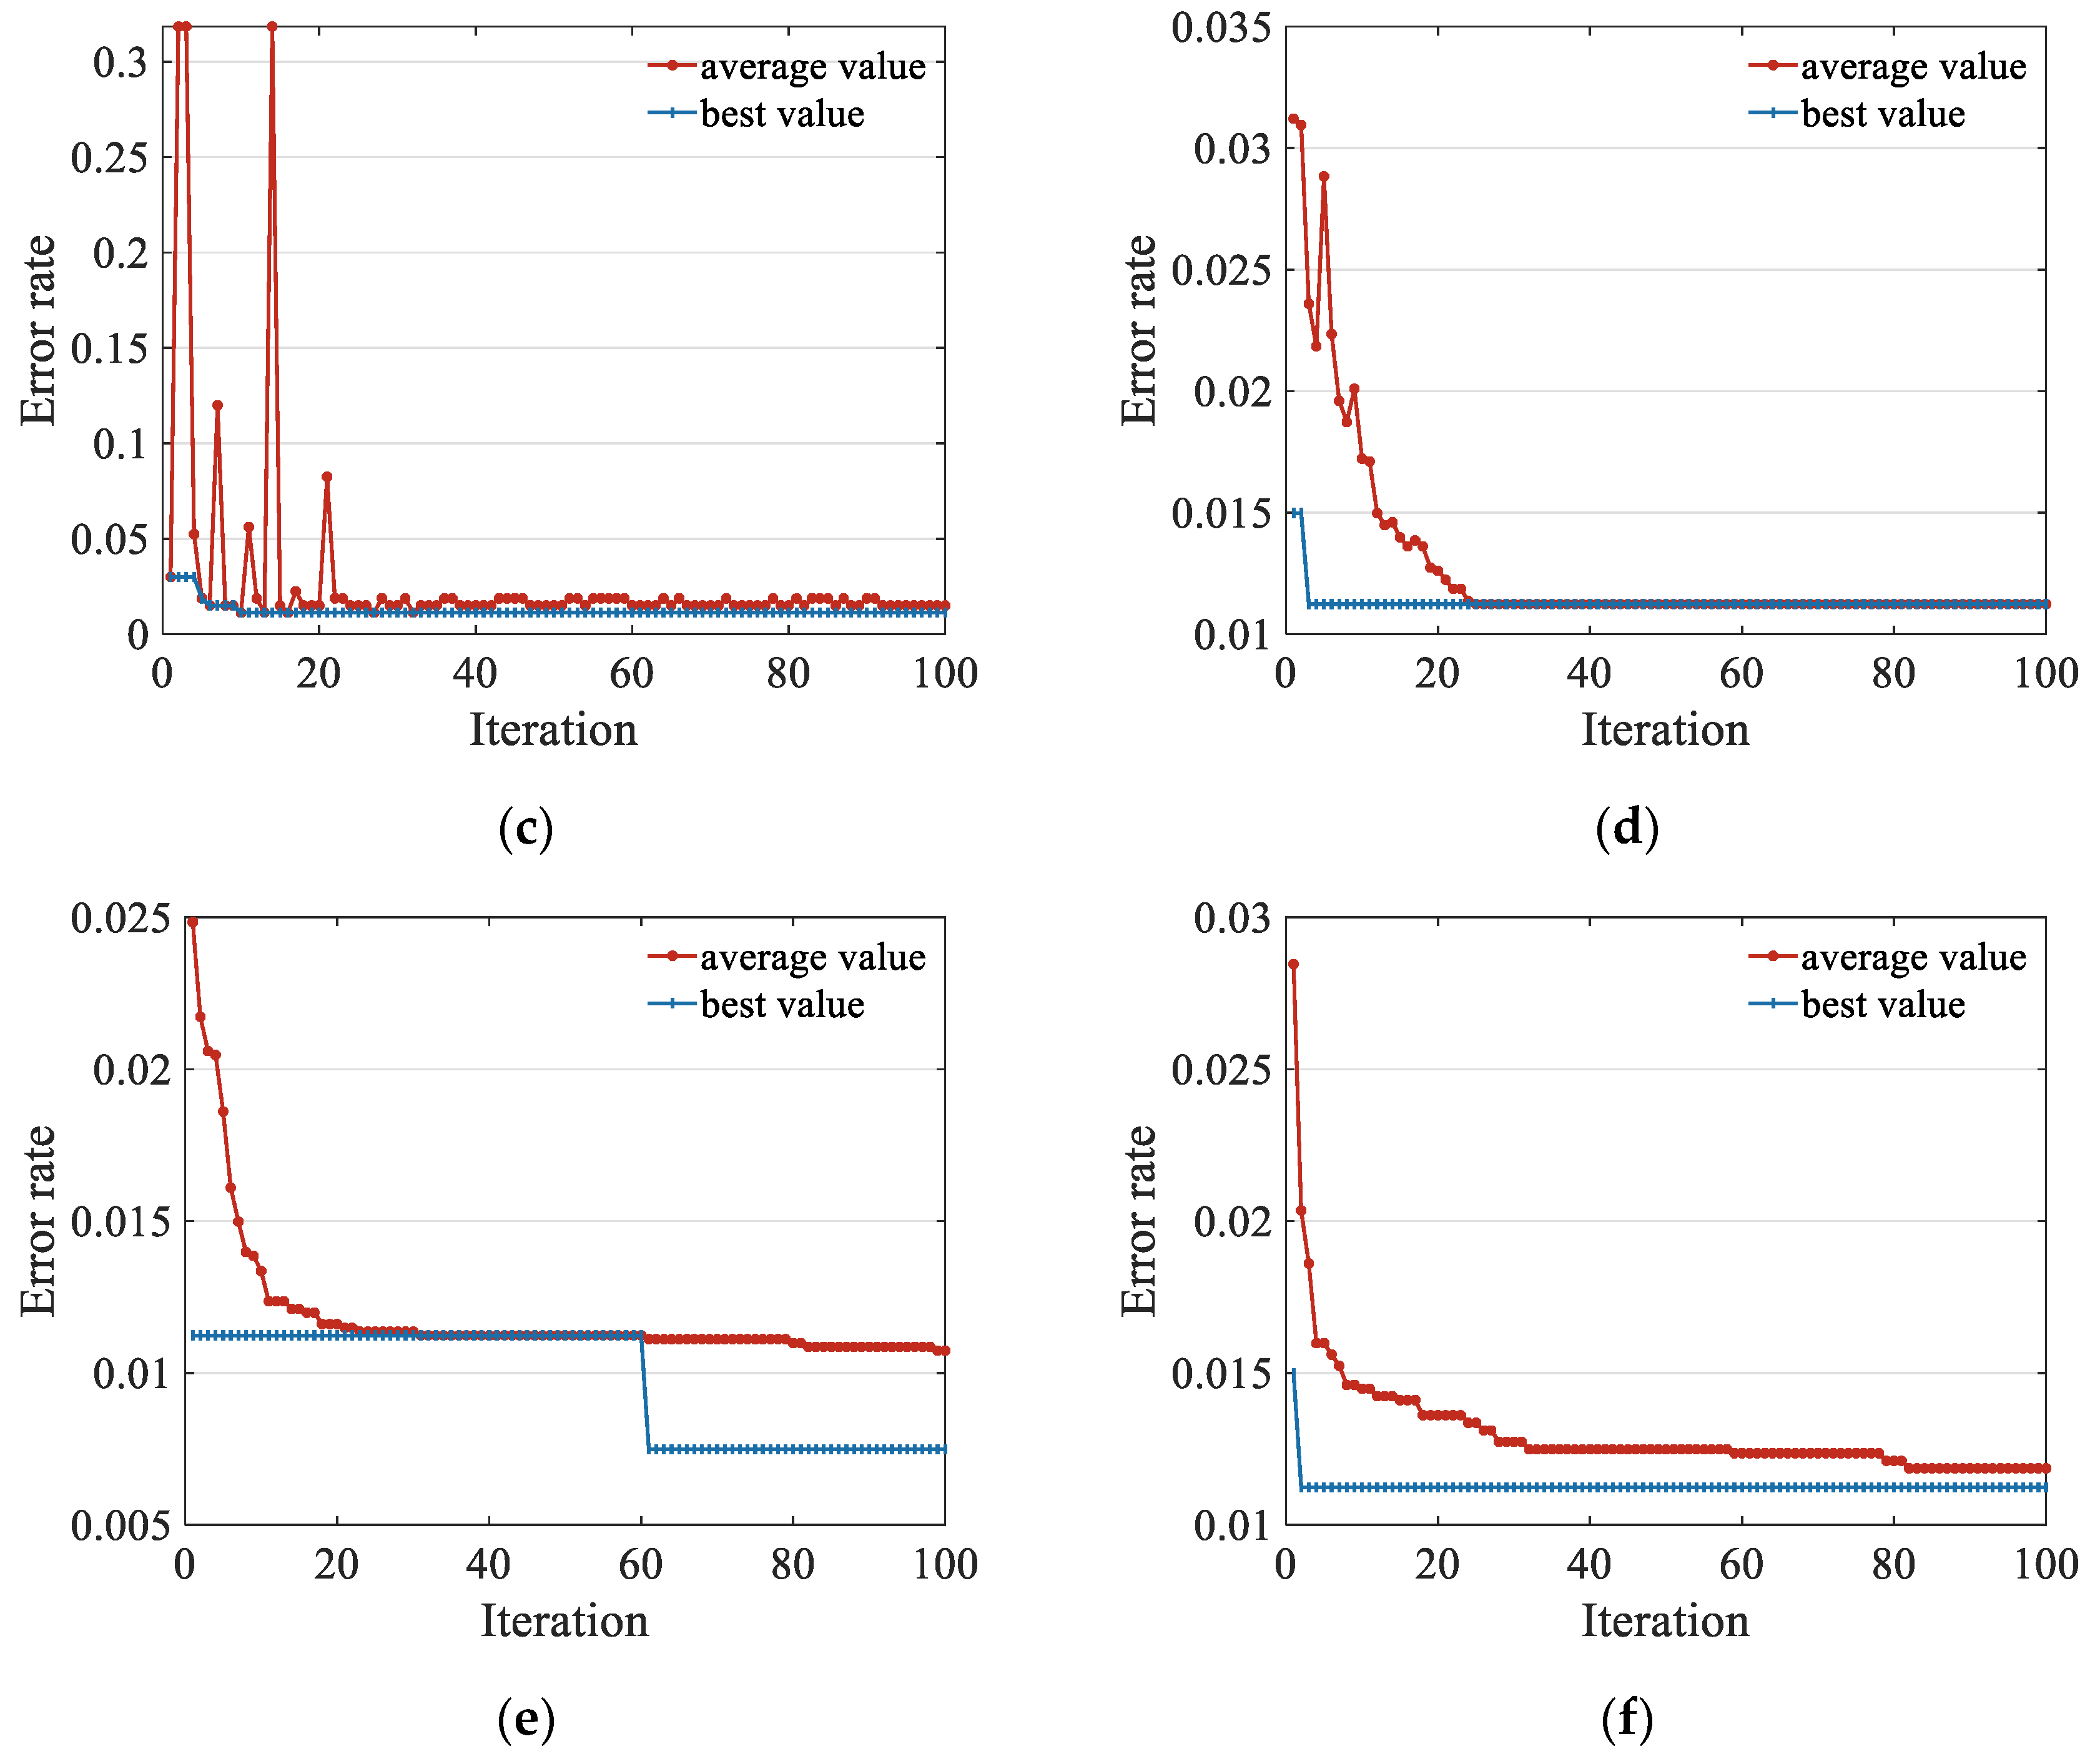
4.2. Convergence Analysis of the Models
5. Conclusions
- (1)
- The calculation and acquisition methods for the operating performance indices are determined. The six SVM-based hybrid models proposed in this paper show a good potential for evaluating the operating performance of backfilling hydraulic supports.
- (2)
- In terms of evaluation indices, the FA-modified SSA-SVM shows the best accuracy (95.52%), precision ratio (95.65%), and F1 score (95.447), and the six hybrid models can be arranged in the order of their evaluation performance from high to low as FA-SSA-SVM, SSA-SVM, FA-SVM, WOA-SVM, GWO-SVM, and GSA-SVM.
- (3)
- FA-SSA-SVM and GSA-SVM give the fastest and smoothest convergence. Overall, the FA-modified SSA-SVM showed the best evaluation capability and convergence performance, and the related prediction results are most consistent with the actual appropriate support interval.
Author Contributions
Funding
Data Availability Statement
Acknowledgments
Conflicts of Interest
References
- Ju, Y.; Zhu, Y.; Xie, H.; Nie, X.; Zhang, Y.; Lu, C.; Gao, F. Fluidized Mining and In-Situ Transformation of Deep Underground Coal Resources: A Novel Approach to Ensuring Safe, Environmentally Friendly, Low-Carbon, and Clean Utilisation. Int. J. Coal. Sci. Technol. 2019, 6, 184–196. [Google Scholar] [CrossRef] [Green Version]
- Xie, H.; Gao, M.; Zhang, R.; Peng, G.; Wang, W.; Li, A. Study on the Mechanical Properties and Mechanical Response of Coal Mining at 1000 m or Deeper. Rock Mech. Rock Eng. 2019, 52, 1475–1490. [Google Scholar] [CrossRef]
- Xie, H.; Ju, Y.; Ren, S.; Gao, F.; Liu, J.; Zhu, Y. Theoretical and Technological Exploration of Deep in Situ Fluidized Coal Mining. Front Energy 2019, 13, 603–611. [Google Scholar] [CrossRef]
- Jiang, Y.; Misa, R.; Gao, J.; Liu, H.; Sroka, A.; Preusse, A.; Jiang, Y. Non-Pollution Damage Hazard of Underground Mining on Reservoir Ecological Environment. Environ. Earth Sci. 2021, 80, 431. [Google Scholar] [CrossRef]
- Xu, J.; Zhu, W.; Xu, J.; Wu, J.; Li, Y. High-Intensity Longwall Mining-Induced Ground Subsidence in Shendong Coalfield, China. Int. J. Rock Mech. Min. Sci. 2021, 141, 104730. [Google Scholar] [CrossRef]
- Xie, J.; Zhu, W.; Xu, J.; Wang, X.; Wang, L. Impact of the Mining Dimensions on the Stability of Backfilled Pier-Columns. Appl. Sci. 2021, 11, 9640. [Google Scholar] [CrossRef]
- Pomykała, R.; Kępys, W. The Properties of the Backfill Mixtures Based on Own Fine-Grained Waste. In Proceedings of the Minefill 2020–2021, Katowice, Poland, 25–28 May 2021; pp. 102–107. [Google Scholar]
- Behera, S.K.; Mishra, D.P.; Singh, P.; Mishra, K.; Mandal, S.K.; Ghosh, C.N.; Kumar, R.; Mandal, P.K. Utilization of Mill Tailings, Fly Ash and Slag as Mine Paste Backfill Material: Review and Future Perspective. Constr. Build. Mater. 2021, 309, 125120. [Google Scholar] [CrossRef]
- Rybak, J.; Khayrutdinov, M.; Kuziev, D.; Kongar-Syuryun, C.; Babyr, N. Prediction of the Geomechanical State of the Rock Mass When Mining Salt Deposits with Stowing. PMI 2022. Online first. [Google Scholar] [CrossRef]
- Khayrutdinov, A.M.; Kongar-Syuryun, C.B.; Kowalik, T.; Tyulyaeva, Y.S. Stress-Strain Behavior Control in Rock Mass Using Different-Strength Backfill. ГИАБ 2020, 2020, 42–55. [Google Scholar] [CrossRef]
- Ermolovich, E.A.; Ivannikov, A.L.; Khayrutdinov, M.M.; Kongar-Syuryun, C.B.; Tyulyaeva, Y.S. Creation of a Nanomodified Backfill Based on the Waste from Enrichment of Water-Soluble Ores. Materials 2022, 15, 3689. [Google Scholar] [CrossRef]
- Zhang, J.; Li, B.; Zhou, N.; Zhang, Q. Application of Solid Backfilling to Reduce Hard-Roof Caving and Longwall Coal Face Burst Potential. Int. J. Rock Mech. Min. Sci. 2016, 88, 197–205. [Google Scholar] [CrossRef]
- Wang, X.; Zhu, W.; Xu, J.; Han, H.; Fu, X. Mechanism of Overlying Strata Structure Instability during Mining below Unconsolidated Confined Aquifer and Disaster Prevention. Appl. Sci. 2021, 11, 1778. [Google Scholar] [CrossRef]
- Li, J.; Huang, Y.; Chen, Z.; Zhang, J.; Jiang, H.; Zhang, Y. Characterizations of Macroscopic Deformation and Particle Crushing of Crushed Gangue Particle Material under Cyclic Loading: In Solid Backfilling Coal Mining. Powder Technol. 2019, 343, 159–169. [Google Scholar] [CrossRef]
- Zhang, Q.; Du, C.; Zhang, J.; Wang, J.; Li, M.; Qi, W. Backfill Support’s Backfill and Operation Properties and Evaluation. J. Cent. South Univ. 2018, 25, 1524–1534. [Google Scholar] [CrossRef]
- Wang, B.; Xie, J.; Wang, X.; Liu, S.; Liu, Y. A New Method for Measuring the Attitude and Straightness of Hydraulic Support Groups Based on Point Clouds. Arab. J. Sci. Eng. 2021, 46, 11739–11757. [Google Scholar] [CrossRef]
- Tian, Z.; Jing, S.; Gao, S.; Zhang, J. Establishment and Simulation of Dynamic Model of Backfilling Hydraulic Support with Six Pillars. J. Vibroeng. 2020, 22, 486–497. [Google Scholar] [CrossRef]
- Ren, H.; Zhang, D.; Gong, S.; Zhou, K.; Xi, C.; He, M.; Li, T. Dynamic Impact Experiment and Response Characteristics Analysis for 1:2 Reduced-Scale Model of Hydraulic Support. Int. J. Min. Sci. Technol. 2021, 31, 347–356. [Google Scholar] [CrossRef]
- Li, M.; Wang, W.; De, G.; Ji, X.; Tan, Z. Forecasting Carbon Emissions Related to Energy Consumption in Beijing-Tianjin-Hebei Region Based on Grey Prediction Theory and Extreme Learning Machine Optimized by Support Vector Machine Algorithm. Energies 2018, 11, 2475. [Google Scholar] [CrossRef] [Green Version]
- Wang, X.; Luo, D.; Zhao, X.; Sun, Z. Estimates of Energy Consumption in China Using a Self-Adaptive Multi-Verse Optimizer-Based Support Vector Machine with Rolling Cross-Validation. Energy 2018, 152, 539–548. [Google Scholar] [CrossRef]
- Lei, Z.; Gao, S.; Gupta, S.; Cheng, J.; Yang, G. An Aggregative Learning Gravitational Search Algorithm with Self-Adaptive Gravitational Constants. Expert Syst. Appl. 2020, 152, 113396. [Google Scholar] [CrossRef]
- Mirjalili, S.; Lewis, A. The Whale Optimization Algorithm. Adv. Eng. Softw. 2016, 95, 51–67. [Google Scholar] [CrossRef]
- Agarwal, A.; Chandra, A.; Shalivahan, S.; Singh, R.K. Grey Wolf Optimizer: A New Strategy to Invert Geophysical Data Sets. Geophys. Prospect. 2018, 66, 1215–1226. [Google Scholar] [CrossRef]
- Zitouni, F.; Harous, S.; Maamri, R. A Novel Quantum Firefly Algorithm for Global Optimization. Arab. J. Sci. Eng. 2021, 46, 8741–8759. [Google Scholar] [CrossRef]
- Xue, J.; Shen, B. A Novel Swarm Intelligence Optimization Approach: Sparrow Search Algorithm. Syst. Sci. Control. Eng. 2020, 8, 22–34. [Google Scholar] [CrossRef]
- Ewees, A.A.; Al-qaness, M.A.A.; Abd Elaziz, M. Enhanced Salp Swarm Algorithm Based on Firefly Algorithm for Unrelated Parallel Machine Scheduling with Setup Times. Appl. Math. Model. 2021, 94, 285–305. [Google Scholar] [CrossRef]
- Nguyen, T.-T.; Ngo, T.-G.; Dao, T.-K.; Nguyen, T.-T.-T. Microgrid Operations Planning Based on Improving the Flying Sparrow Search Algorithm. Symmetry 2022, 14, 168. [Google Scholar] [CrossRef]
- Zhang, C.; Ding, S. A Stochastic Configuration Network Based on Chaotic Sparrow Search Algorithm. Knowl. Based Syst. 2021, 220, 106924. [Google Scholar] [CrossRef]
- Arora, S.; Kaur, R. An Escalated Convergent Firefly Algorithm. J. King Saud Univ. Comput. Inf. Sci. 2022, 34, 308–315. [Google Scholar] [CrossRef]
- Sababha, M.; Zohdy, M.; Kafafy, M. The Enhanced Firefly Algorithm Based on Modified Exploitation and Exploration Mechanism. Electronics 2018, 7, 132. [Google Scholar] [CrossRef] [Green Version]
- Singha, S.; Aydin, B. Automated Drone Detection Using YOLOv4. Drones 2021, 5, 95. [Google Scholar] [CrossRef]
- Cook, J.; Ramadas, V. When to Consult Precision-Recall Curves. Stata J. 2020, 20, 131–148. [Google Scholar] [CrossRef]
- Williams, C.K.I. The Effect of Class Imbalance on Precision-Recall Curves. Neural Comput. 2021, 33, 853–857. [Google Scholar] [CrossRef] [PubMed]


| Objects | Parameters | Objects | Parameters |
|---|---|---|---|
| Height (mm) | 2900~4800 | Initial support force (kN) | 3870 |
| Width (mm) | 1430~1600 | Working resistance (kN) | 5160 |
| Step distance (mm) | 630 | Support strength (MPa) | 0.57 |
| Center distance (mm) | 1500 | Floor specific pressure (MPa) | 2.98 |
| Indices | Calculation Method | Minimum | Maximum | Unit | Source |
|---|---|---|---|---|---|
| Top beam offset | X6-X06 | 0 | 216.4 | mm | Simulation model |
| Gap distance of blanking | X5-X8-l*cos(β) | 120 | 1310.9 | mm | |
| Empty support distance | X7-X6 | 69.3 | 1202.9 | mm | |
| Distance from the top | Y6-Y7 | 370.7 | 629.3 | mm | |
| Front column inclination | arctan(|(Y1-Y1’)/(X1-X1’)|) | 70.2 | 76.5 | ° | |
| Rear column inclination | arctan(|(Y3-Y3’)/(X3-X3’)|) | 73.7 | 83.8 | ° | |
| Tamping angle | arctan(Y7/X7) | 13.2 | 37.3 | ° | |
| Tamping force | - | 695 | 762 | kN | Field measurement |
| Strength of support | - | 26 | 47 | Mpa |
| Index | Meaning |
|---|---|
| TP | The positive sample is predicted to be positive. |
| FN | The positive sample is predicted to be negative. |
| FP | The negative samples are predicted to be positive. |
| TN | The negative samples are predicted to be negative. |
Publisher’s Note: MDPI stays neutral with regard to jurisdictional claims in published maps and institutional affiliations. |
© 2022 by the authors. Licensee MDPI, Basel, Switzerland. This article is an open access article distributed under the terms and conditions of the Creative Commons Attribution (CC BY) license (https://creativecommons.org/licenses/by/4.0/).
Share and Cite
Shi, P.; Zhang, J.; Yan, H.; Zhang, Y.; Zhang, Q.; Feng, W. Evaluation of Operating Performance of Backfilling Hydraulic Support Using Six Hybrid Machine Learning Models. Minerals 2022, 12, 1388. https://doi.org/10.3390/min12111388
Shi P, Zhang J, Yan H, Zhang Y, Zhang Q, Feng W. Evaluation of Operating Performance of Backfilling Hydraulic Support Using Six Hybrid Machine Learning Models. Minerals. 2022; 12(11):1388. https://doi.org/10.3390/min12111388
Chicago/Turabian StyleShi, Peitao, Jixiong Zhang, Hao Yan, Yuzhe Zhang, Qiang Zhang, and Wenchang Feng. 2022. "Evaluation of Operating Performance of Backfilling Hydraulic Support Using Six Hybrid Machine Learning Models" Minerals 12, no. 11: 1388. https://doi.org/10.3390/min12111388
APA StyleShi, P., Zhang, J., Yan, H., Zhang, Y., Zhang, Q., & Feng, W. (2022). Evaluation of Operating Performance of Backfilling Hydraulic Support Using Six Hybrid Machine Learning Models. Minerals, 12(11), 1388. https://doi.org/10.3390/min12111388