Article

An Open Integrated Rock Spectral Library (RockSL) for a Global Sharing and Matching Service

1
Department of Surveying, Mapping and Remote Sensing Science, School of Geosciences and Info-Physics, Central South University, Changsha 410083, China
2
School of Resources and Civil Engineering, Northeastern University, Shenyang 110819, China
*
Author to whom correspondence should be addressed.
Minerals 2022, 12(2), 118; https://doi.org/10.3390/min12020118
Submission received: 4 December 2021 / Revised: 3 January 2022 / Accepted: 17 January 2022 / Published: 20 January 2022
(This article belongs to the Special Issue Mapping of Rocks and Minerals Using Hyperspectral Remote Sensing)

Abstract

:
Minerals and rocks are important natural resources that are formed over a long period of geological history. Spectroscopy is the basis of the identification and characterisation of rocks and minerals via proximal sensing in the field or remote sensing systems with multi- and hyper-spectral capabilities. However, spectral data is scattered around different institutions worldwide and stored in various formats, resulting in poor data usability and an unnecessary waste of time and information. To improve the usability and performance of mineral spectral data, we developed an integrated open mineral spectral library (Rock Spectral Library, RockSL). Shared spectral data and related information were collected worldwide, and data cleaning measures were performed to retain the qualified spectra and merge all qualified data (raster, vector, and text formats) in a common framework to establish a reliable and comprehensive digital data set for an easy sharing and matching service. A software system was developed for the RockSL to manage, analyse, and apply the spectral data of minerals and rocks. We demonstrate how the information encoded in RockSL can determine the species of unknown rocks and describe specific mineral compositions. We also provide a reference scheme of the work chain and present key technologies for building different spectral libraries in diverse fields using RockSL. New contributions to RockSL are encouraged for this work to be improved to provide a better service and extend the applications of geo-sciences. This article introduces the characteristics of RockSL and demonstrates an experimental application.

1. Introduction

Rocks are special materials formed in the Earth’s crust and composed of one or multiple minerals. Rocks play a key role in the resource production of human society. The analysis of rocks and minerals involves determination of the chemical composition of the target minerals to provide accurate prior information for ore exploitation and mineral deposit discovery. In the 1950s, the wet chemical method was used to analyse the mineral composition, which can carry out detailed analysis and ingredients records. However, this method has a relatively long process, involves great costs to obtain results, and is likely to cause serious environmental pollution. After the 1950s, the original method of chemical analysis began to be replaced by instrumental analysis (e.g., the thin section identification method, X-ray diffraction, and electron microprobe analysis) due to the emergence of many advanced and accurate instruments. Some instrumental analysis methods are expensive and time-consuming, but visible and infrared spectroscopy is a relatively fast, economical, and real-time technique for characterising minerals and rocks by remote sensing and proximal sensing [1,2].
Many researchers have shown that the reflectance spectra in the visible and infrared bands can characterise the physical properties and chemical composition of rocks and minerals [3,4,5,6]. According to the range of wavelengths, hyperspectral technology consists of visible-near infrared (0.45–1.1 μm), short-wave infrared (1.1–2.5 μm), mid-infrared to thermal infrared (2.5–14 μm), and far infrared spectroscopy [7]. Spectroscopy represents different response mechanisms to minerals in different wavelength ranges, such as the electronic processes of metal ions (e.g., Fe2+, Fe3+, Cr3+, Mn2+) in the visible-near infrared, the double and co-frequency of the molecular vibration of hydroxyl minerals (e.g., clay minerals, carbonate, hydrated sulphate) in the short-wave infrared band, and the fundamental frequency of the molecular vibration of hydroxyl-free minerals (e.g., silicate, carbonate, sulphate) in the thermal infrared band [8,9].
Multi- and hyper-spectral mineralogical data obtained by field-based, airborne, or spaceborne measurements are mainly stored in various spectral databases [10,11,12]. Figure 1 shows a brief record of representative mineralogical spectral libraries around the world. Since the 1970s, many research teams have set up separate spectral databases for various fields. Since 2010, the United States Geological Survey (USGS) and Advanced Spaceborne Thermal Emission Reflection Radiometer (ASTER) spectral libraries (as the most representative ground-object libraries worldwide) have been cited more than 200 times per year on average, indicating the broad recognition of spectral libraries in scientific research [13]. However, the availability of the existing shared libraries is limited by particular sample representativeness, semantic differences, test conditions, and sharing formats, making the wide sharing and use of rocks/minerals spectral data difficult or inconvenient [14,15].
Figure 1 shows that the spectral libraries could be divided into universal spectral libraries and specialised libraries, that is, rock and mineral (geological) spectral libraries. universal spectral libraries (e.g., Earth Resources Spectral Information System (ERSIS) [16], Johns Hopkins University (JHU) [17], USGS [18,19], ASTER [20,21], Hyperspectral Image Processing and Analysis System (HIPAS) [22], Spectral Library (SpeLib) [23,24,25], ground object background spectral library (GOSPEL) [26], SPECCHIO spectral library [27]) are collections of rich ground-object types from the surrounding environment, providing a basic data platform for geoscience and ecological environment research. The directional hemispherical reflectance spectra of natural Earth surface materials were summarised by Salisbury et al. [17] to establish the JHU spectral library for exploring the relationship of the remotely sensed infrared radiance and physical/chemical properties of landcover. The USGS library of spectra measured with laboratory, field, and airborne spectrometers was built to identify the components of an unknown spectrum and support imaging spectroscopy studies on Earth and other planets [18,19]. On the basis of the widespread application of ASTER on NASA’s Terra platform, the ASTER library was compiled with more than 2000 spectra of natural and man-made materials to provide one of the most comprehensive collections, including contributions from the Jet Propulsion Laboratory (JPL), JHU, and the USGS [21]. The HIPAS was developed by the Institute of Remote Sensing Applications of the Chinese Academy of Sciences (CAS) based on the applications of the modular airborne imaging spectrometer (MAIS) and the push-broom hyperspectral imager (PHI) to support mineral identification, agriculture investigation, urban mapping, and the study of wetland vegetation [22]. The SpeLib of typical objects in China was jointly established by Beijing Normal University and CAS, covering vegetation, rock, mineral, and water and providing support for agricultural monitoring, water quality monitoring, and lithology-mineral identification [23,24,25]. The GOSPEL expanded the contents of SpeLib to include more ground object spectral data compiled by vegetation, water, soil, rock and mineral, snow and ice, and artificial targets and characteristic data sets for full-band, multi-scale, multi-angle, and time series directions [26]. The SPECCHIO database (as a repository for spectroradiometer data and associated metadata) was established by the Remote Sensing Laboratories in the University of Zurich, which provides a platform for spectral signature data exchange and data sharing [27].
Although universal libraries contain the high-quality spectra of numerous targets (mainly minerals), they mainly include first-order statistical information (i.e., one representative spectrum per target) instead of second-order statistics, posing a serious restriction on practical use for the variation described [28]. Therefore, the focus of spectral library construction shifted gradually from a universal spectral library to a specialised spectral library, paying more attention to the exploration and mining of spectral knowledge [9,13]. The related rock and mineral spectral libraries established can be used to verify the influence of measurement conditions (e.g., angle, waveband, and resolution, etc.), sample size, mineral purity, and geological environment on spectral characterisation.
The International Geologic Correlation Program (Project IGCP-264), consisting of reflectance spectra measured by 5 spectrometers for 26 common minerals with different spectral resolutions, can be applied for the automated identification of geologic materials on the basis of their spectral characteristics in the imaging spectrometer data from the Airborne Visible/Infrared Imaging Spectrometer (AVIRIS) [29]. JPL took the lead in developing a standard mineral spectral database in which 135 minerals were selected according to three particle size scales to study the influence of mineral particle size on reflectivity [30,31]. The mineral infrared atlas that covers wavelengths from visible-near infrared to mid-infrared (0.3–4 μm) [32], Arizona State University (ASU) thermal infrared spectral library that covers wavelengths from mid-infrared to far infrared (5–45 μm) [33], and Commonwealth Scientific and Industrial Research Organization spectral library [34] that covers wavelengths from mid-infrared to far infrared (2–25 μm) were established for rock/mineral infrared information and mineral resources exploration. The spectral libraries of planetary geology (e.g., PDS [35] and Gaia spectral library [36]), containing the spectral data of Earth and other planetary materials, are widely used in planetary geology and astronomy.
Generally, the existing spectral libraries collected rock or mineral specimens at a local scale rather than the global scale, neglecting the geological environment. Universal libraries pay more attention to the breadth for geological mapping and remote sensing monitoring, whereas specialised libraries focus on the spectra and descriptive metadata to verify the relationship of spectral data and internal attributes/external conditions. Furthermore, the libraries are published in different formats (e.g., ASCII and image file) and semantic contents (e.g., English and Chinese), resulting in unnecessary data gaps. To avoid the data gaps of diverse libraries and improve spectral data utilisation, the RockSL is established by integrating the massive data from diversified shared spectral libraries. Here, we collected more shared spectra, and optimized the database structure and methods in a previous work [15]. We report our efforts in consolidating the format of shared spectral data to establish a comprehensive, standardised, and global data set and in developing an operating system to integrate various identification methods for an easy sharing and matching service. We unified the semantic meaning around the world by constructing a table of minerals and rocks in different languages, which is conducive for building a big data set of rock/mineral spectra. We provide a reference scheme to realise the integration of data in multiple formats and present the workflow and key technologies for other researchers to establish their own spectral libraries. We also demonstrate the usefulness of RockSL in recognising the mineral composition of unknown rocks. The spectral matching based on the RockSL is proven to be capable of improving the efficiency and accuracy of rock/mineral identification.

2. Materials

2.1. Data Sources

The RockSL database consists of shared data from open libraries and field sampling data on Earth and currently contains more than 200 mineral samples, 50 mineral subclasses, and more than 3500 spectra, providing users with original information for reference.

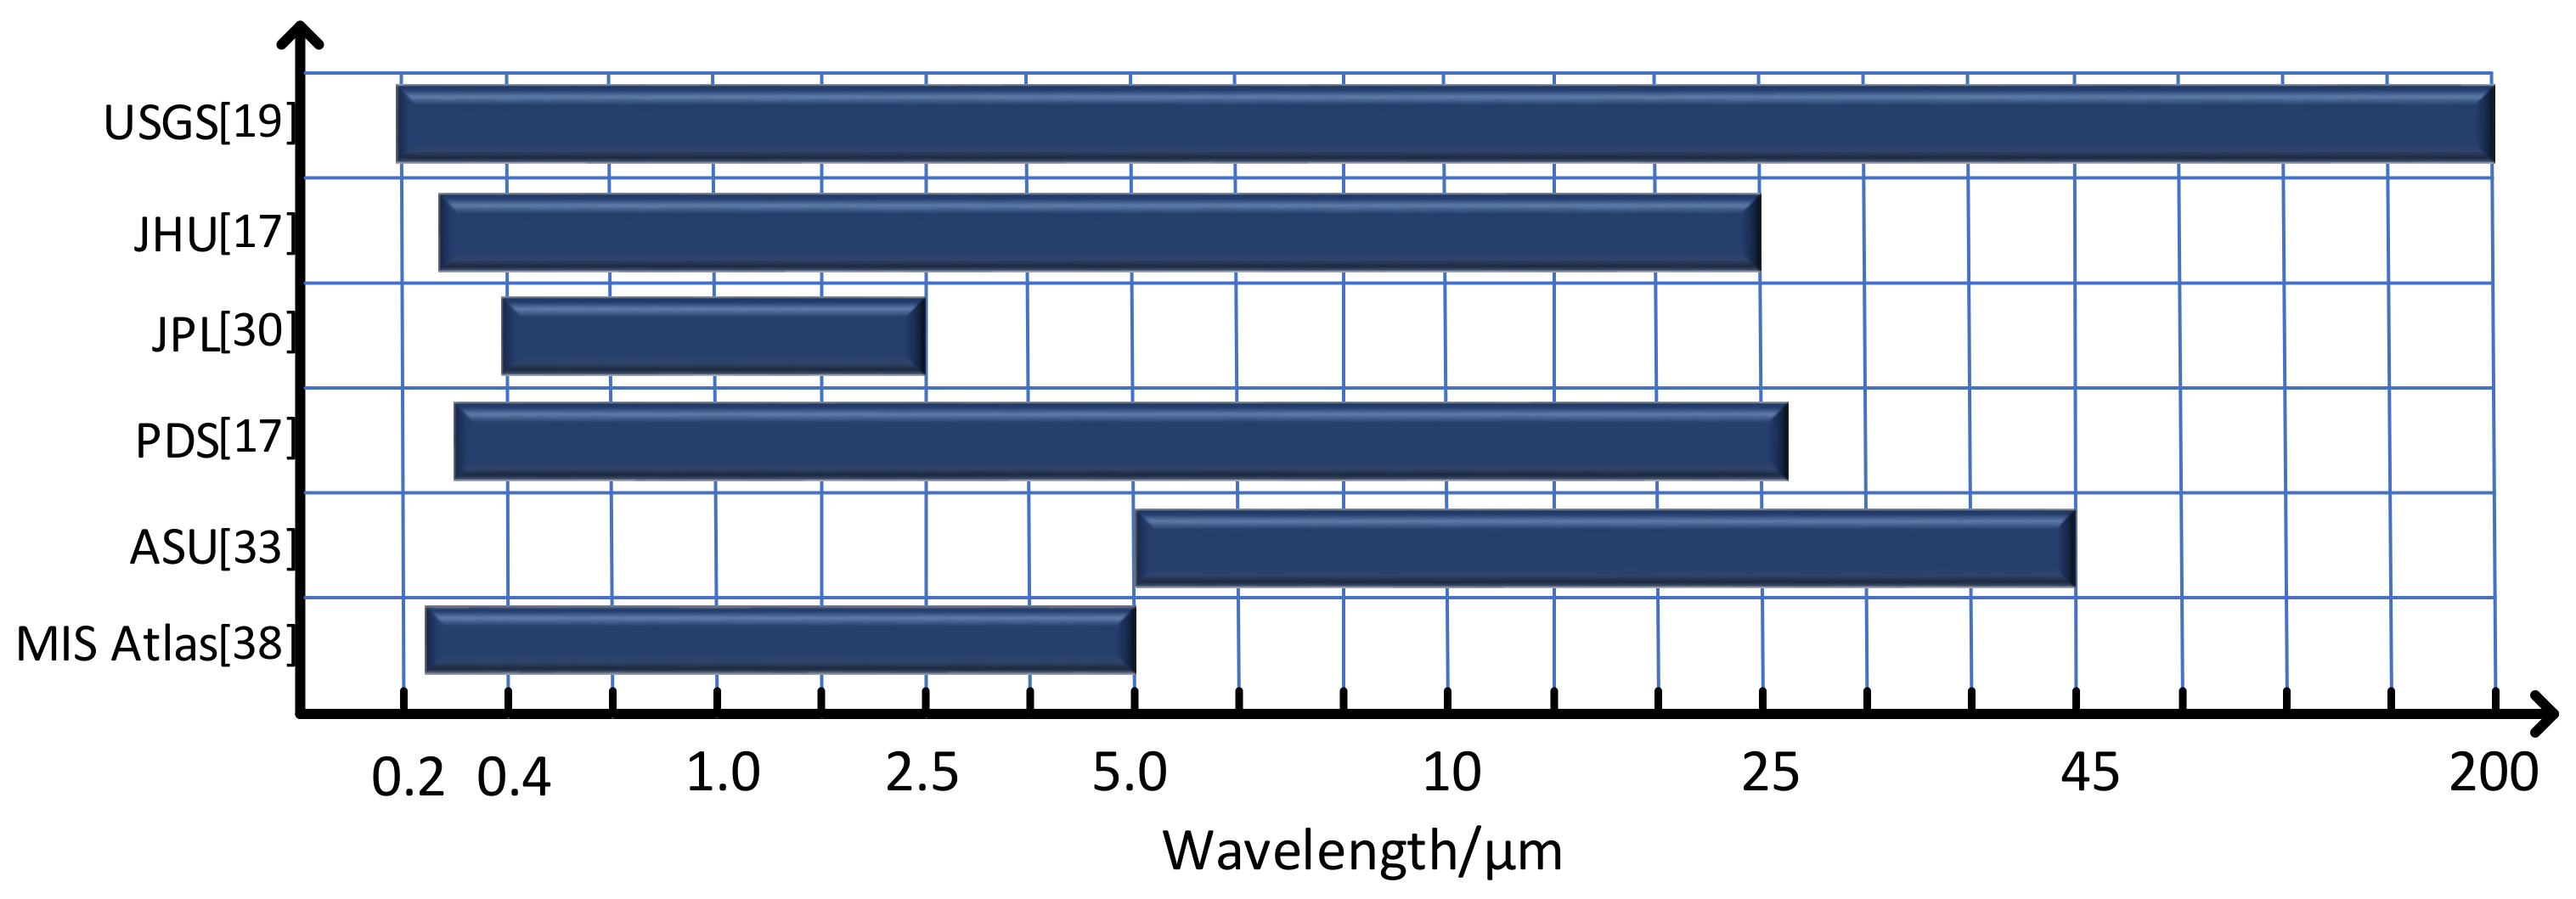
2.1.1. Shared Spectral Libraries

The RockSL is a collection of contributions in standard format with representative spectral libraries, including some universal spectral libraries (e.g., the spectral libraries of USGS, JHU, and JPL) and specialised libraries, such as ASU Thermal Infrared Spectral Library, the PDS Geoscience Spectral Library, and the Mineral Infrared Spectral (MIS) Atlas [37,38]. The measurement parameters that differ in each spectral library are considered in detail (as in Table 1).
The spectral data downloads from the JPL and JHU spectral libraries are basically identical. The comparison of the wavelength ranges of the shared libraries (Figure 2) indicates that the RockSL covers a complete spectral range of various minerals and rocks. According to the supporting parameters of multiple shared spectral libraries, we designed the corresponding spectral data table, including the sample names in English and Chinese, spectral data, measured parameters, mineral and rock types, and the original descriptions from the shared databases.

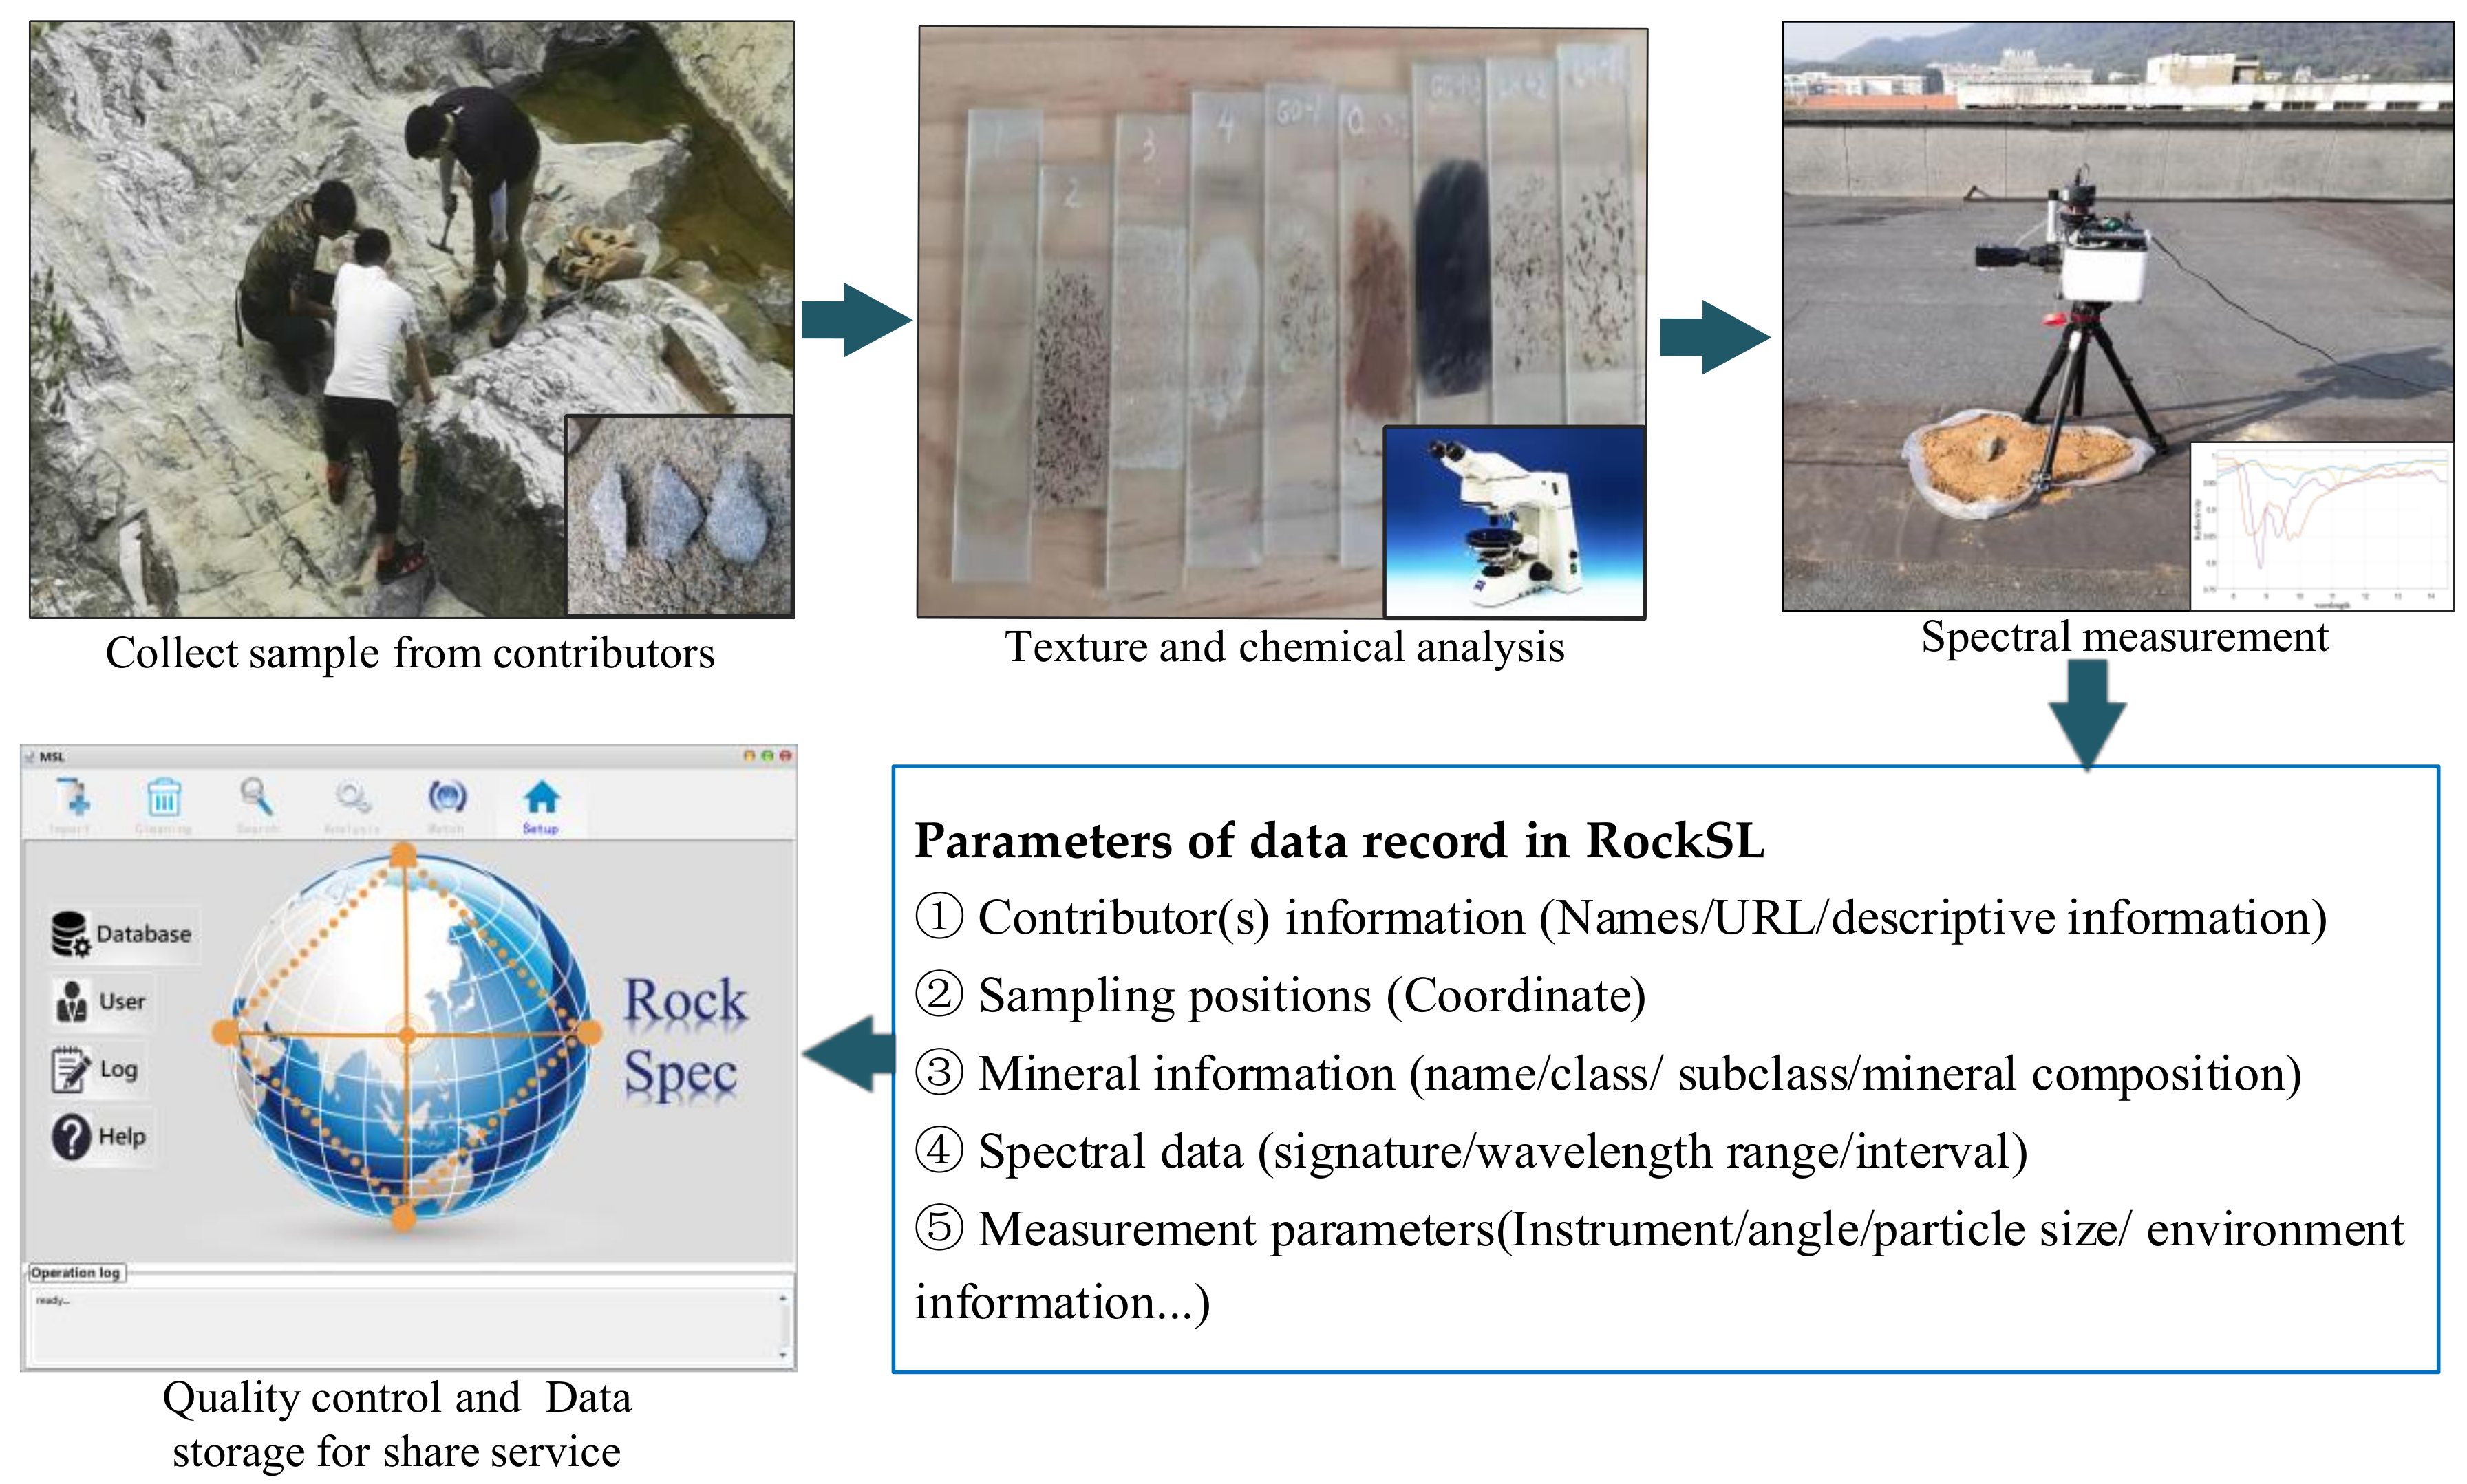
2.1.2. Field Sampling Data

The spectral data in the RockSL include not only the shared reflective spectra data from the shared spectral libraries but also the spectra of the rock/mineral specimens obtained through our laboratory measurements. The specimens (e.g., coal, iron, and pyrolite) were collected from Northern and Central China and measured in the Central South University and Northeastern University in China [38,39]. Given the difference in the measurement conditions between the shared data from multiple spectral libraries and the measured data in the laboratory, a standard model of data record parameters was established to ensure long-term data usability and exchange, as explained in our previous work [40]. The collaboration system and required parameters of the RockSL are shown in Figure 3.

3. Methods and Key Technologies

3.1. Processing Workflow

The RockSL aims to establish an integrated shared dataset using an open-access operating software. We designed the work procedure from data acquisition to spectral application (Figure 4), slightly adjusting that from a previous study [15] to increase its effectiveness and reliability.

3.2. Data Acquisition and Transformation

Data organisation and management are essential activities, including data acquisition, data classification, coding, and data cleaning. We briefly elaborate on the problems encountered in the process of database construction and present solutions and methods, some of which were described in detail in our previous work [15].

3.2.1. Data Acquisition

The original data integrated include the shared data downloaded from share libraries and the specimen data measured in the laboratory. The shared data formats commonly use ASCII or text files, which can be imported directly into the RockSL. However, some of the spectra stored in shared spectral libraries (e.g., Mineral Infrared Spectral Atlas) are in image formats, which are inconvenient to use.
We developed a functional module using the thinning and non-thinning algorithms [41,42] to extract digital spectral curves from images. The thinning algorithm is used to extract the skeleton pixel for the thick linear target while the non-thinning algorithm focuses on the boundary of the curve rather than the skeleton line. We also quantitatively evaluated the effect of the two vectorisation algorithms with the R2, RMSE, and MAE indexes [15]. The R2 values of the two algorithms are proven to be near 1.0, and the value represented by each pixel in the vertical axis (spectral reflectivity) is equal to 0.000375. Verifications show that the resolution of the extracted digital spectral curves reaches 2 nm, and the spectral absorption accuracy reaches the pixel level (referring to the PC screen).

3.2.2. Data Transformation

After data acquisition, the gathered information must be transformed and standardised. According to the encoding method [15] of the RockSL on the basis of the chemical composition and crystal structure of minerals/rocks, the spectral curves of the samples are mapped to the expected field of the spectrum. To standardise the data storage format for easy use, the conversion operation mainly unifies the spectral measurements (i.e., emissivity and reflectivity) and the wavelength units (i.e., micron, nanometre, and wave number). Various spectral data were standardised to the reflectance spectral curves with a nanometre spectral resolution.

3.3. Quality Control

The spectral data downloaded from the shared databases, the digital coordinates extracted from imaged curves, and the sampling spectra measured by a Fourier transform infrared (FTIR) spectrometer in the laboratory must be checked to guarantee data quality [43]. Quality control measures were designed for single and multiple spectral curves. Firstly, the maximum and minimum thresholds of reflectance in the spectral data are set to 1.0 and 0, respectively, and data outside the range are considered abnormal data. Secondly, the coefficient of variation (CV) is equal to the standard deviation divided by the mean value of reflectivity, and its value can represent the degree of relative change of the reflectivity and serve as the basis for the data quality checking of a single spectral curve. Thirdly, the boxplot algorithm, which mainly uses statistics (e.g., median and quartile), can be used to examine the dataset distribution and the errors therein.
Given that repeated measurements of the same specimen with the same instrument can obtain multiple similar data, the precision index must be determined to check the quality of each spectral curve. The accuracy of the internal conformity and the position offset of the wavelength of the main absorption peak are used as indicators to check whether they are unqualified or not [15]. The internal conformity is characterised in this article. The average reflectivity curve is calculated from a series of curves under repeated observations, and then the internal conformity of the reflectivity curve for each repeated observation is calculated as follows:
ε = ± j = 1 m ( i = 1 n δ i j 2 ) m × n ,
δ i j = F i j F i     i = 1 , 2 , , n ;   j = 1 , 2 , , m ,
F i = j = 1 m F i j m , i = 1 , 2 , , n ,
where ε is the data stability index of the consistency of the spectra obtained from repeated measurements, F i is the average reflectivity at the corresponding point of multiple similar spectra, F i j is the observed reflectivity at the corresponding point of spectrum, m is the number of repeated observations, and n is the number of curve points involved in the calculation.
The original data may have identical spectral data for each rock/mineral because of the overlap of some shared libraries. The consistency and similarity of spectral curves were determined by several correlation coefficients (e.g., Pearson correlation coefficient and angle cosine) to avoid the repeated imports of data. Identical spectral curves (i.e., with a correlation coefficient approaching 1.0) were removed, and slightly different data (i.e., with a correlation coefficient below 0.99) that might imply composition information were retained. Furthermore, the representative curve was selected from highly similar spectra and tagged to avoid repeat matching and increase the efficiency of the matching service. The similar spectra to be processed must be obtained under the same measurement condition, and the correlation coefficient of multiple curves must exceed 0.95. The two main methods for calculating the similarity of spectra are described below.
(1)
Spectral correlation coefficient [44]. This coefficient is used to fit the two reflectivity curves on the basis of the principle of least squares. The formula of the correlation coefficient is as follows:
f = C o ν P , ρ D P D ρ = C o ν P , ρ σ P σ ρ ,  
where f is the correlation coefficient between the reference spectrum P and target spectrum ρ ,   C o ν P , ρ is the covariance of the reference and matched target spectra, D P is the reference spectral variance, and D ρ is the matched target spectral variance.
(2)
Angle cosine [45]. The value represents the generalised included angle of two target curves in n-dimensional space. The formula of angle cosine is as follows:
cos θ i j = α = 1 n x i α x j α α = 1 n x i α 2 α = 1 n x i α 2 0 cos θ i j 1 ,
where x i α is the sample reflectance of the α th point of the ith curve,   x j α is the sample reflectance of the α th point of the jth curve, and n is the number of sample points at the spectral curve.
A custom spectral classifier (Figure 5) was developed based on the data features to limit the matching range when unknown spectra without any parameters are matched with the reference spectra. The absorption position of the spectrum reflects the mineral composition that can be used to distinguish mineral categories and establish the tree of classification characteristics [46]. The customised classifier method resamples spectral data, calculates the absorption position of each curve, and then intersects with the eigen values of the multiple curves of the same mineral to determine the common characteristics [47]. Subsequently, the absorption positions of different minerals from the same mineral subclass or class were intersected to determine new subclasses and classes. Based on the custom classifier, a multifurcating tree containing the absorption positions of each mineral, subclass, and class was established in the RockSL.

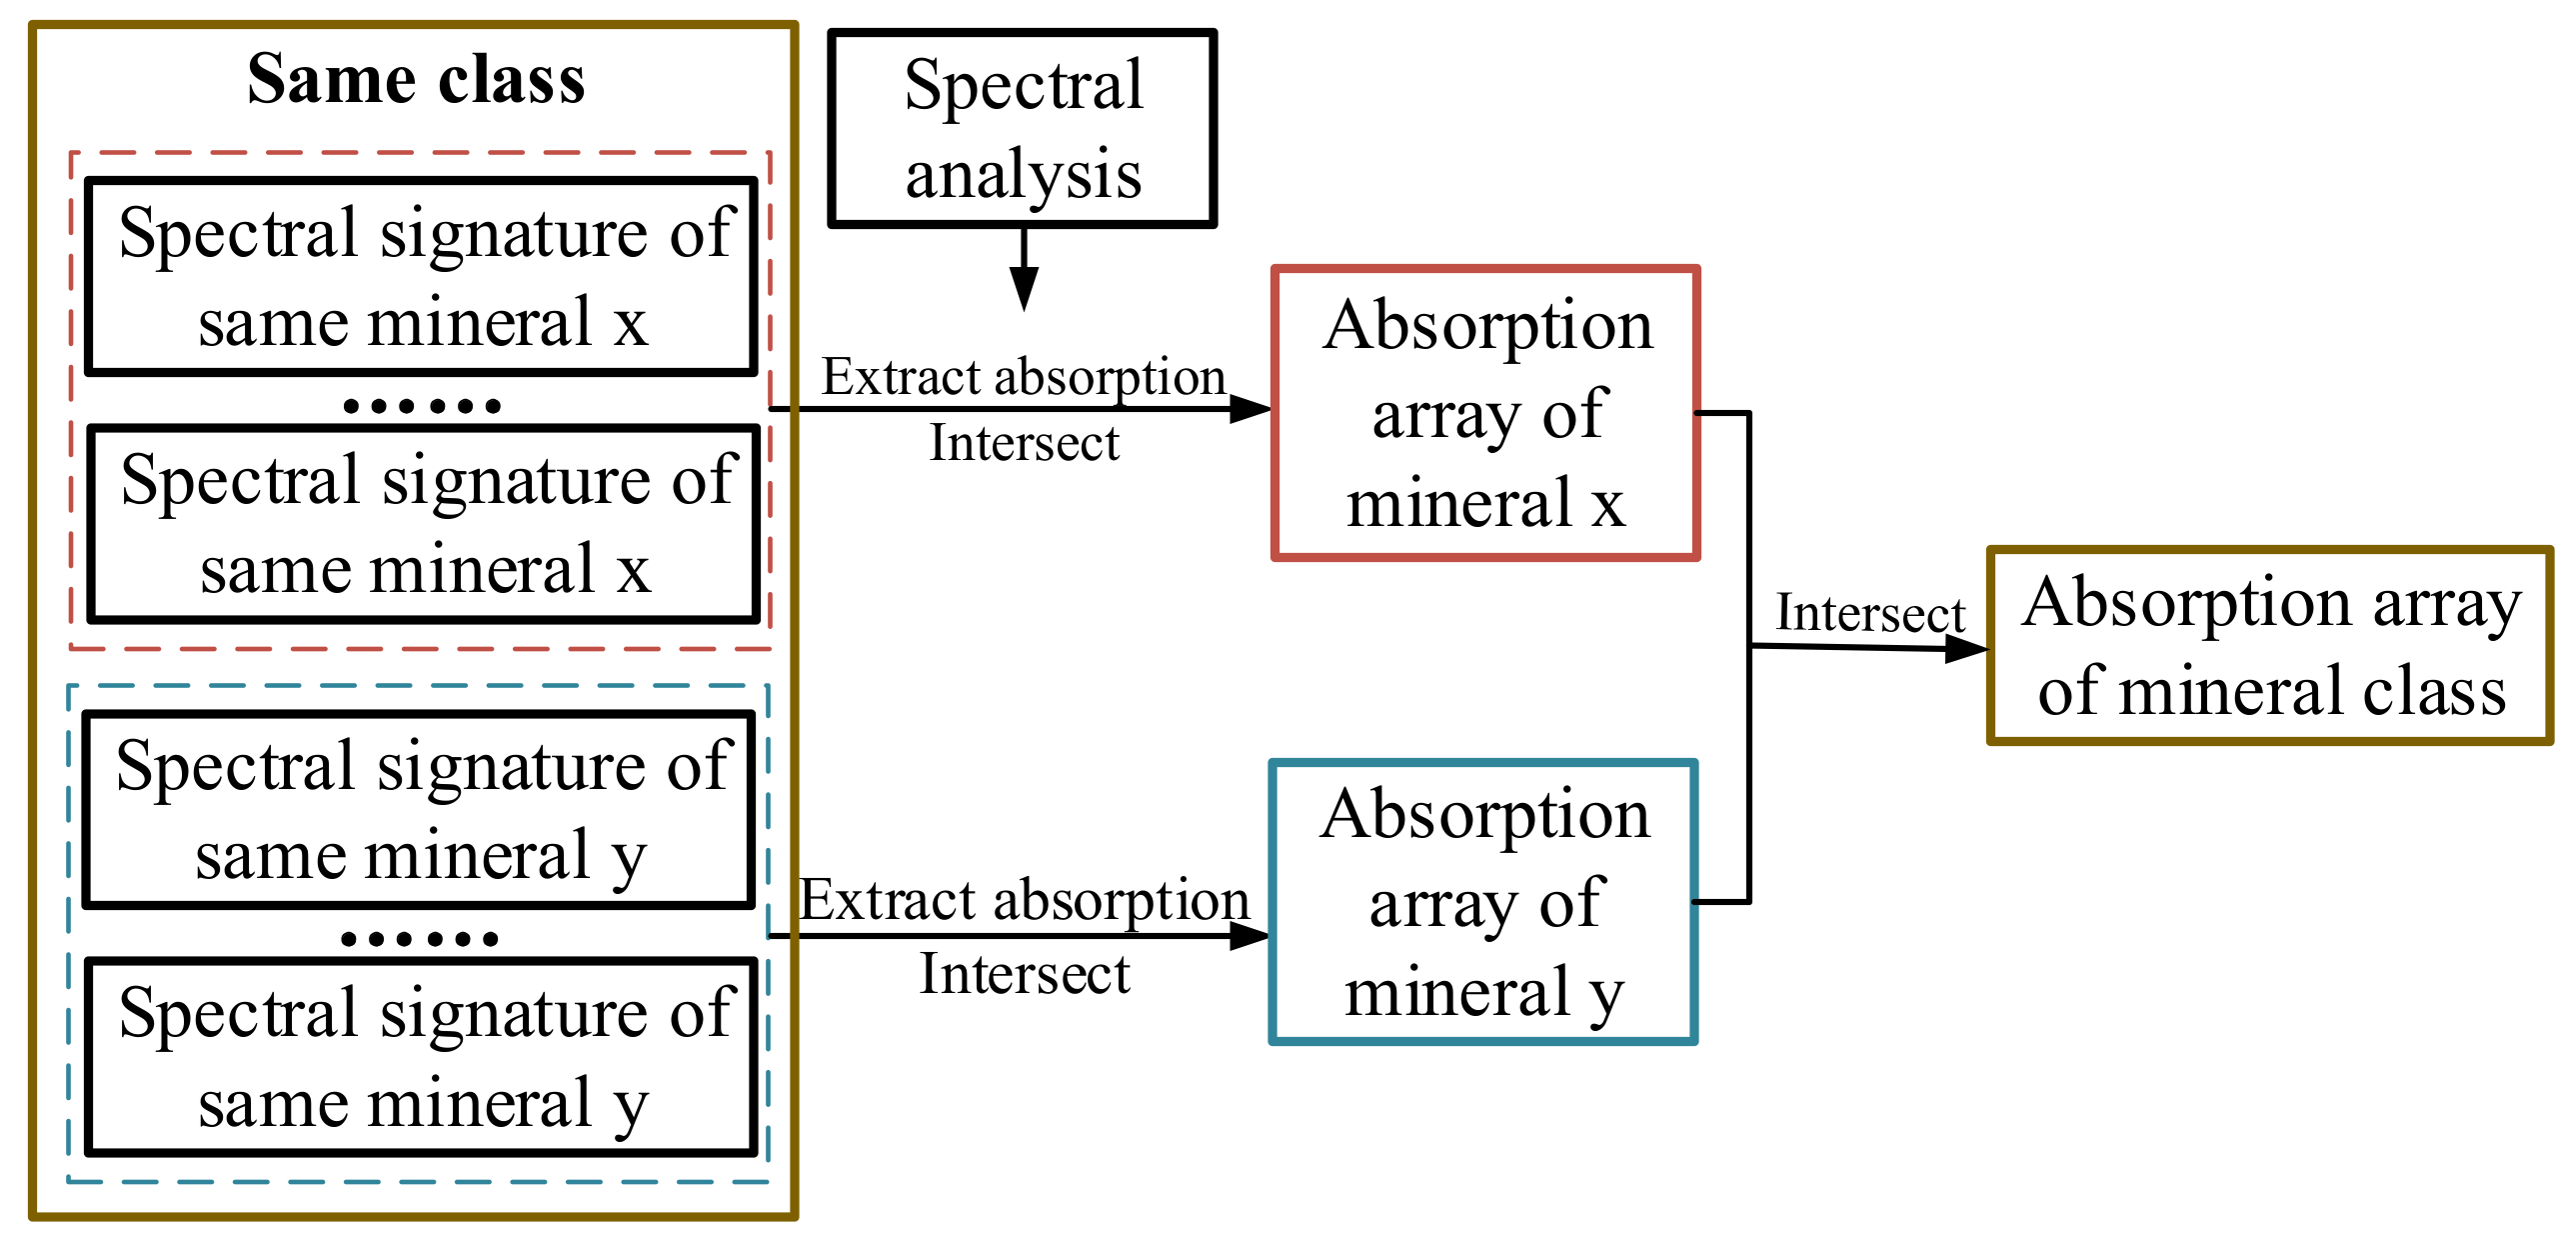
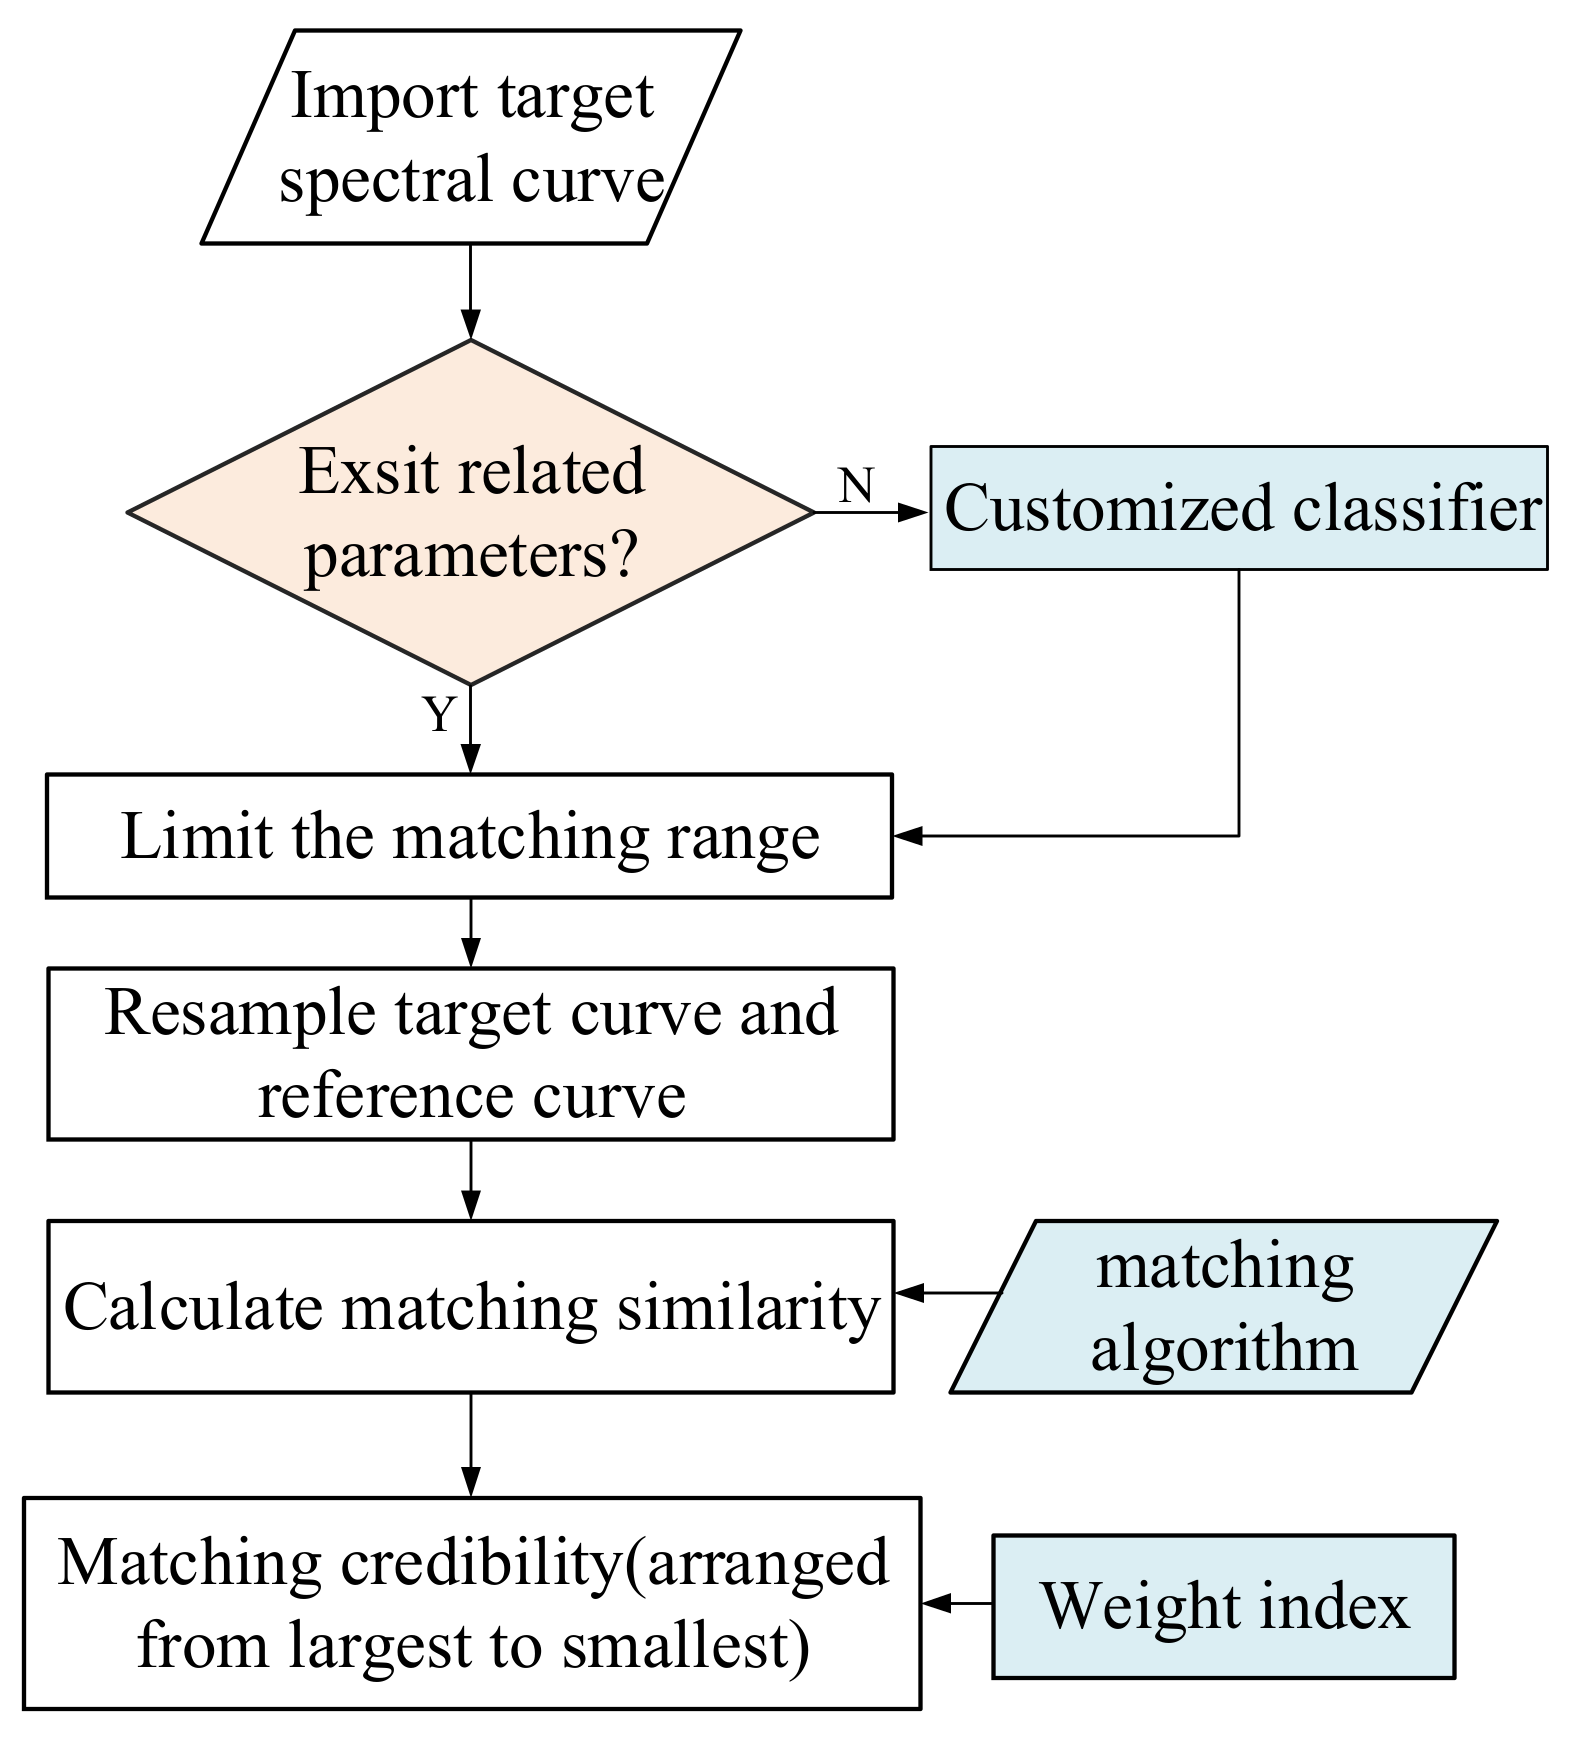
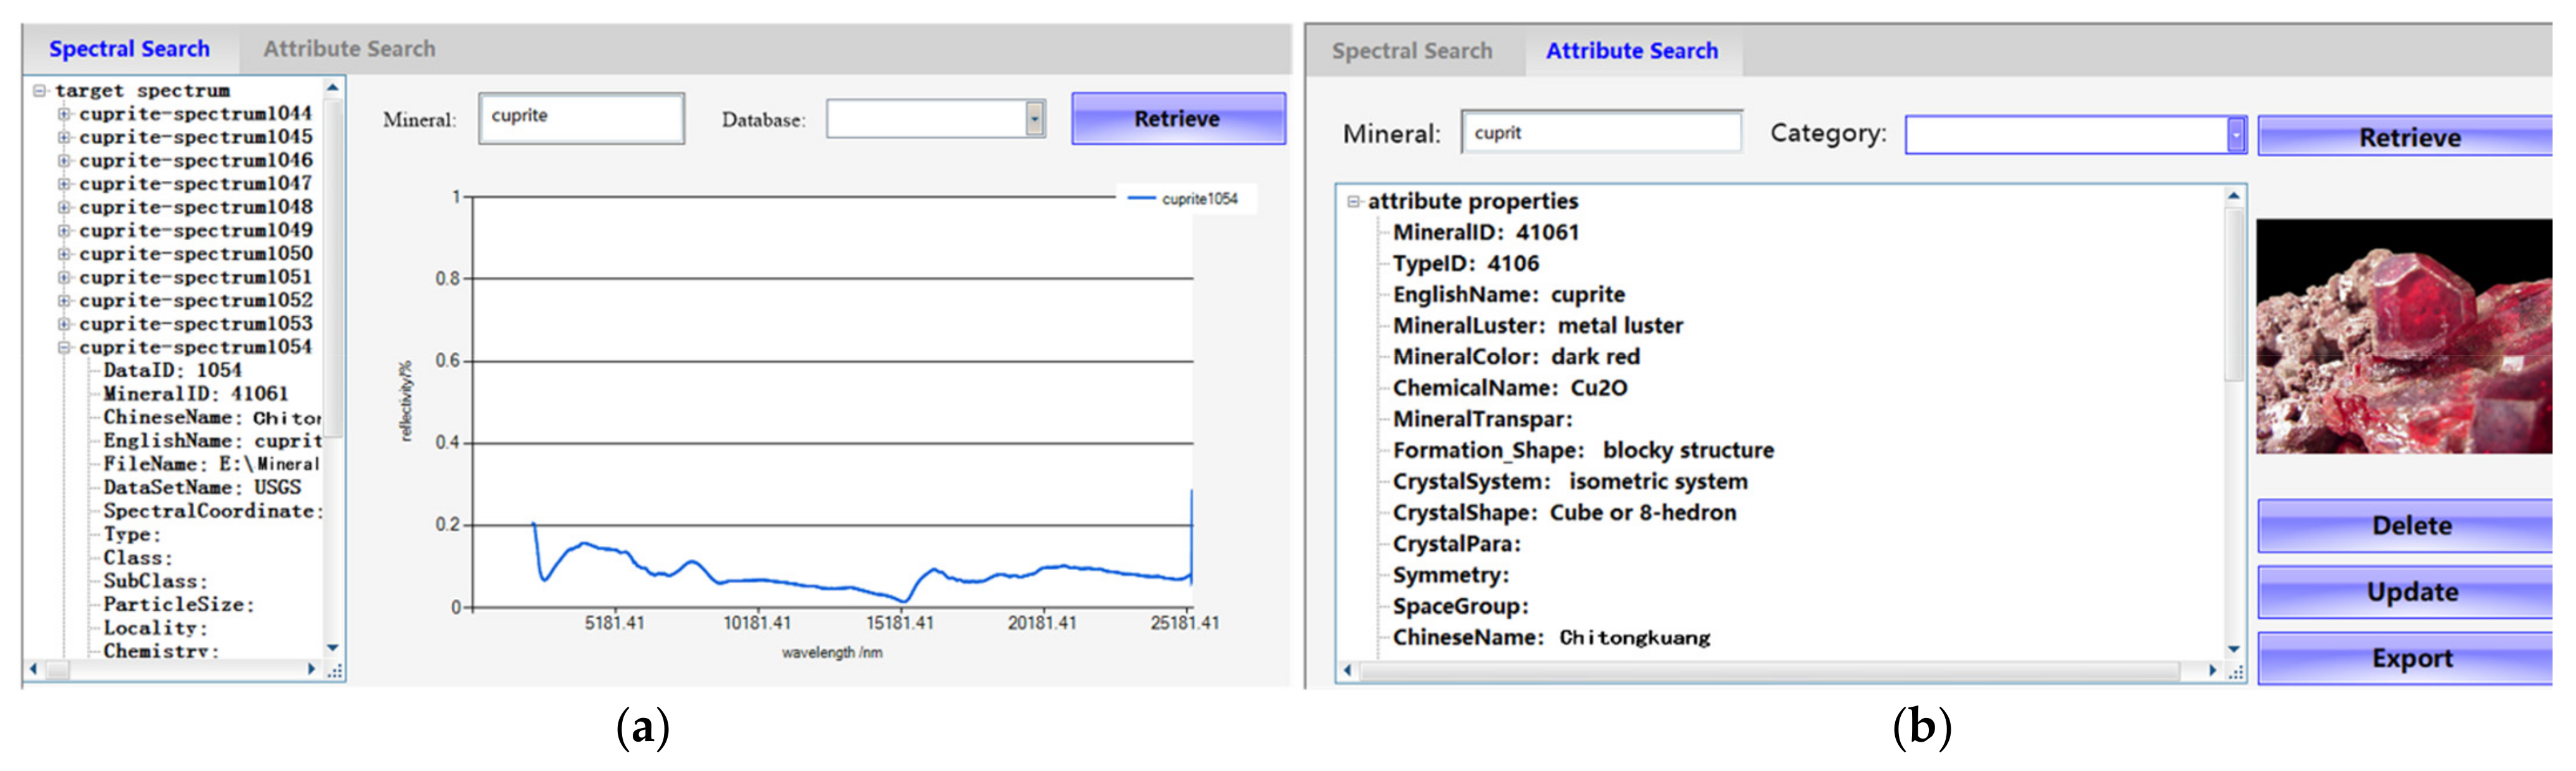
3.4. Spectral Retrieve, Analysis, and Matching

The preliminary employment of spectral retrieval, analysis, and matching was achieved and embedded in the operating system of the RockSL (local desktop program in window system). The queried data can be quickly located and displayed by inputting the rock/mineral name (in English or Chinese), providing a qualitative way for users to preliminarily judge the rock/mineral category.
As mentioned above, the absorption position and waveform information (e.g., absorption depth and width) of spectral data are the determination indices of the mineral composition category and content. Hence, a spectral analysis module was design to perform pre-processing (i.e., spectral derivative and continuous spectrum removal), highlighting the characteristics of spectral curves. The implementation of the convex hull algorithm [48] is shown in Figure 7. However, the absorption features in a wide concave region are difficult to distinguish, which will be addressed and embedded into the system for release. In addition, the spectral analysis module calculates several absorption waveform parameters of the spectral curve (e.g., absorption position, absorption width, absorption height, absorption area, absorption peak number, absorption symmetry, spectral slope, and spectral absorption index), providing certain support for the subsequent establishment of a spectral knowledge base [49].
Spectral matching technology based on a spectral library is mainly a quantitative method for identifying the spectrum of an unknown object through comparison with the reference spectra. According to the similarity analysis, the types of target object can be determined. Various frequently used matching algorithms (e.g., binary coding mapper (BCM), spectral angle mapper (SAM), spectral information divergence (SID), SID_SA, and spectral coefficient fitting (SCF)) are implemented in the RockSL operating system.
The BCM assigns the points on the spectral curve to 0 or 1.0 in advance through the spectral reflectance/emissivity threshold (the average value of the entire spectrum), greatly improving the efficiency of matching recognition. After converting the reference and target spectra into binary arrays, the matching similarity of the two arrays is calculated [50]. The SAM regards the spectral curve as a vector in multidimensional space and uses the angle between the target and reference spectra to represent their matching similarity [45], relying on the shape of the entire spectral curve and ignoring the differences between local features. The calculation is shown in Formula (5). The SID mapping method aims to calculate the SID from the perspective of information theory [51]. SID_SA combines SID and spectral angle matching (SA). The correlation coefficient of two spectral curves can also be calculated by SCF [43] as shown in Formula (4). We also propose a custom matching method, which unifies the similarity measures of the above methods and takes their average value to evaluate the matching effect. The matching mechanism of the operating system is shown in Figure 6. To improve the matching efficiency, the existing information of the unknown spectrum is used to limit the matching range. The target spectrum without corresponding information is pre-classified by the customised classifier described above. Given that the RockSL retains the original information of the shared data (i.e., the spectral resolution), the system automatically resamples the spectrum according to the target spectrum information. We also consider the proportion of the matching wavelength range to the entire range of the target spectrum as the weighted index, which is multiplied by the matching similarity to obtain the index of the matching credibility. Finally, the reference spectra to be matched (with the matching credibility arranged from largest to smallest) and the related metadata are displayed.

4. Results and Experiment

4.1. Platform Development

SQL Server and the Visual Studio platform are used for constructing the RockSL and the operating system, respectively. The main functions of the operating system are shown below.
The spectral analysis interface (Figure 7) aims to calculate the absorption waveform parameters, mark the absorption position of the curve in the form of points and lines, calculate the envelope of the corresponding curve, and display the spectral curve after removing the envelope. Envelope removal (known as continuum removal) can effectively strengthen the absorption valley characteristics of the spectrum. The reflectance value of the entire band is normalised and maintained between 0 and 1 after removing the envelope, which is conducive to the analysis and comparison of the absorption characteristics. The data retrieval interface (Figure 8) provides a qualitative way of displaying the target mineral or rock with spectral and attribute information. The spectral matching interface is a significant part of the RockSL, helping users match unknown spectra quickly. The user can click the ‘Open file’ button to import the measured mineral spectral curve (choose whether to remove the envelope or not) and then select the related parameters and pre-process options. Subsequently, the matching correlation coefficient (matching credibility) can be obtained from largest to smallest.

4.2. Experimental Validation

Using the RockSL, we also made a preliminary application by matching and analysing the measured spectral data of the rock specimen tested by rock slice identification. The rock specimen was collected from Hengyang, Hunan Province, China. The spectral data (Figure 9b) of the rock specimen measured by an FTIR spectrometer (Figure 9a) were compared with the reference spectra in the RockSL to determine the rock category and the mineral composition. The sample slice identification (Figure 9d) observed with an Axioskop40 microscope (Figure 9c) was used as the reference to verify the spectral matching results on the basis of the RockSL. According to the analysis of the rock slice identification, we ascertained the mineralogic components of the rock specimen as 55% plagioclase, 30% K-feldspar, 15% biotite, and some secondary minerals (chlorite and epidote).

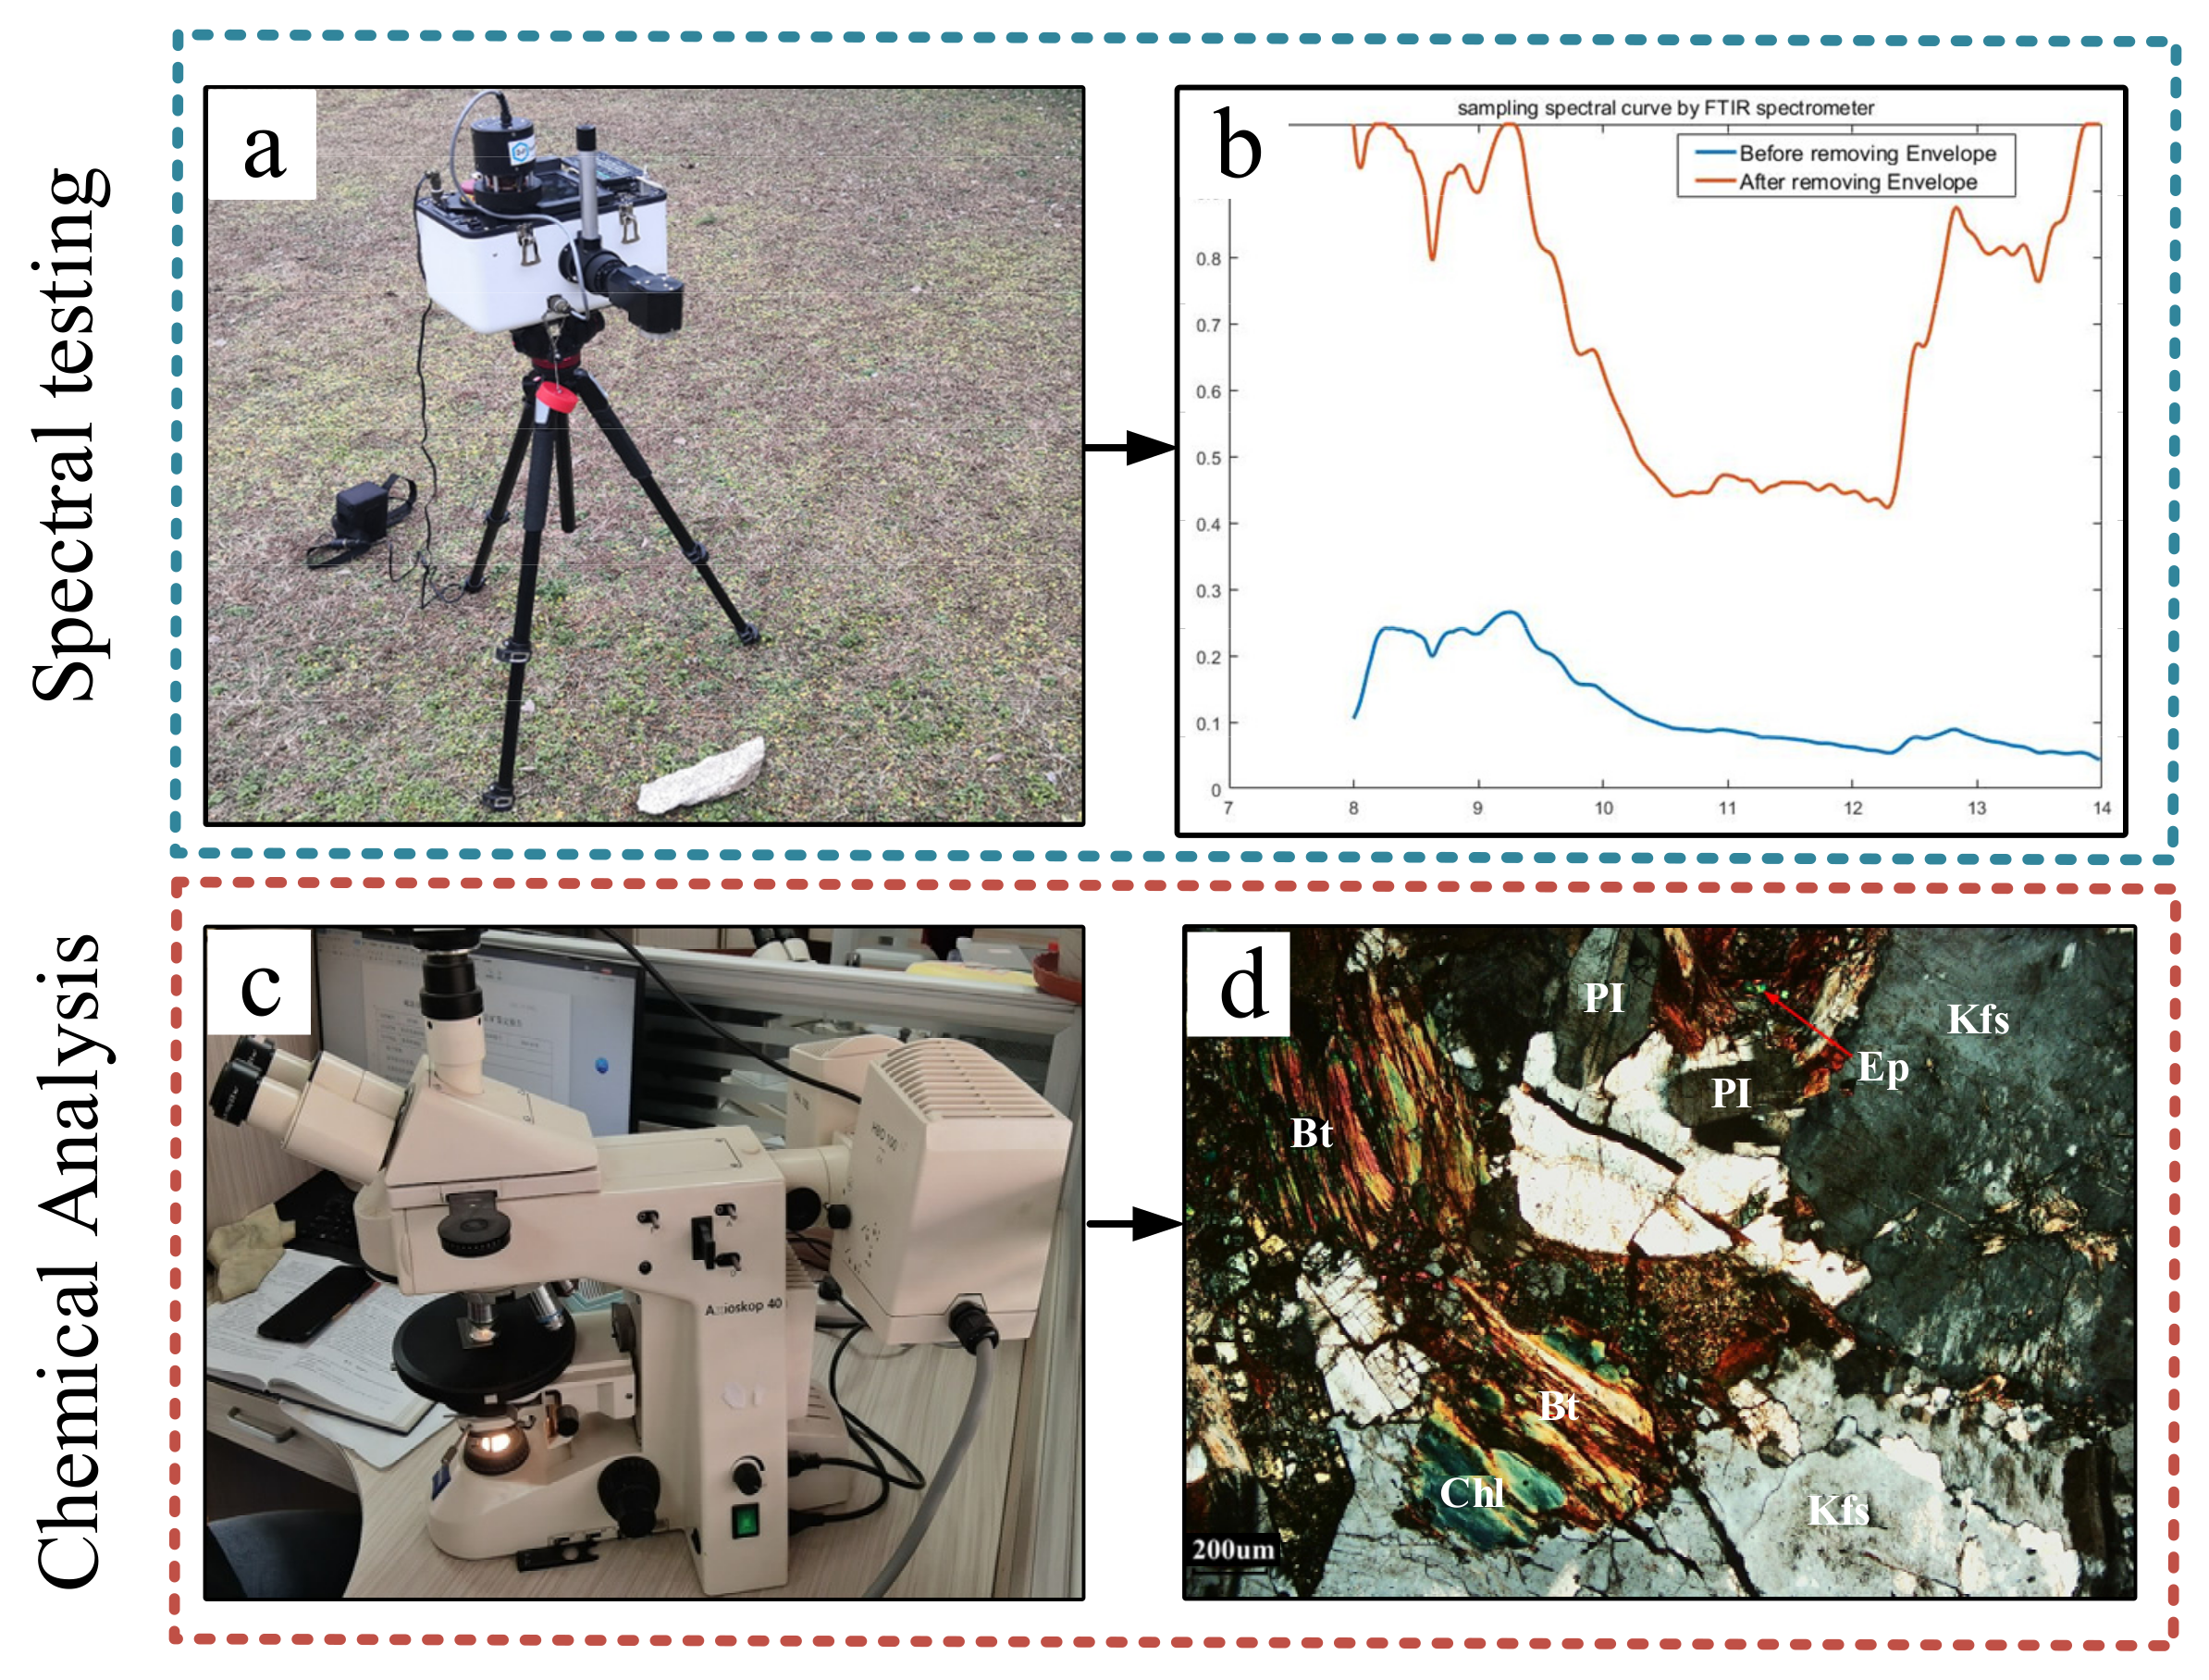
4.2.1. FTIR Spectrometer

In this study, the portable 102F FTIR spectrometer (Figure 8b) designed and manufactured by the D&P Instrument company in the USA was used to measure the unknown rock specimen repeatedly in a cloudless outdoor environment, finally obtaining the spectral emissivity curve (thermal information). The detectors mounted on the 102F FTIR are dual-colour photovoltaics of mercury cadmium telluride (MCT) and indium antimonide (InSb) and capable of simultaneously collecting data over the entire wavelength range of 3–14 μm. The HgCdTe detector operating at 77 K cryogenic liquid nitrogen refrigeration can obtain high-quality observations on reflectivity at spectral bands 8–14 μm.
The spectrometer was used for the vertical observation of the rock specimen at a distance of approximately 1.0 m in cloudless conditions at an air temperature of approximately 300.15 K. During the experiment, each specimen was measured thrice. The instrument was set for 10 repeated samplings of each measurement, and then the average curve was taken as the measured spectrum.

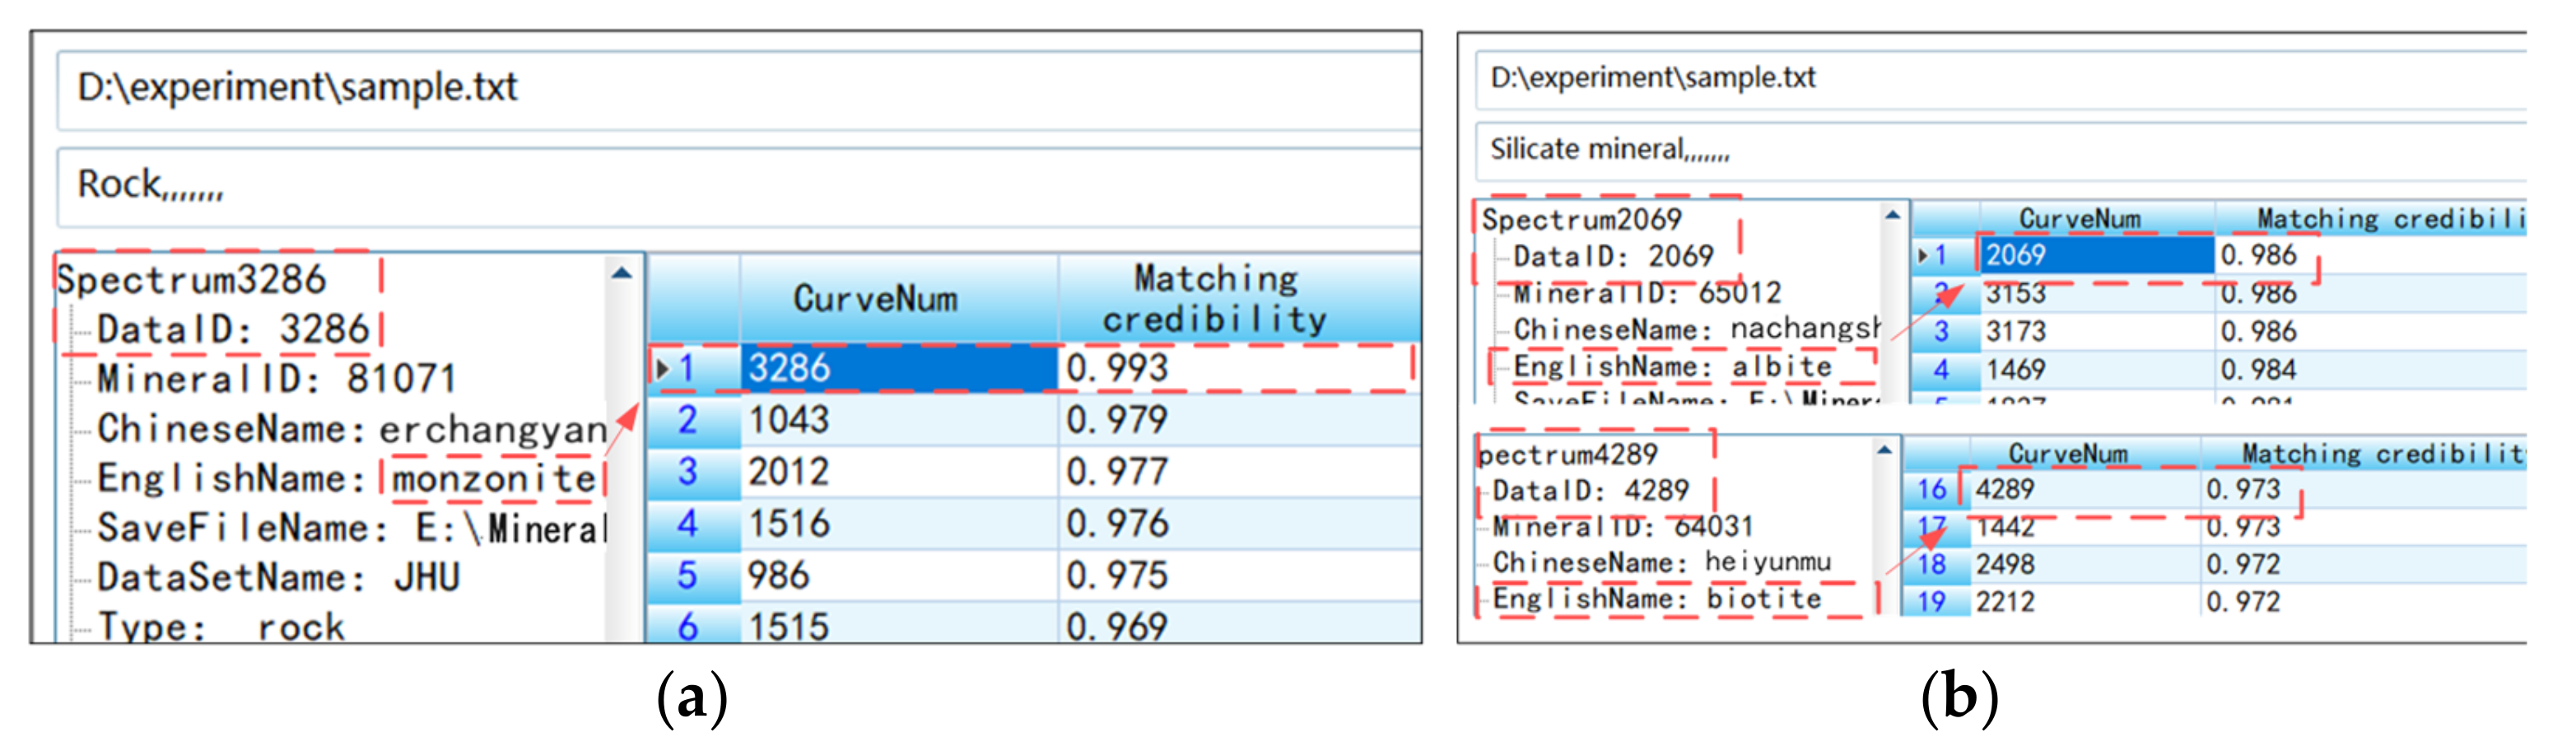
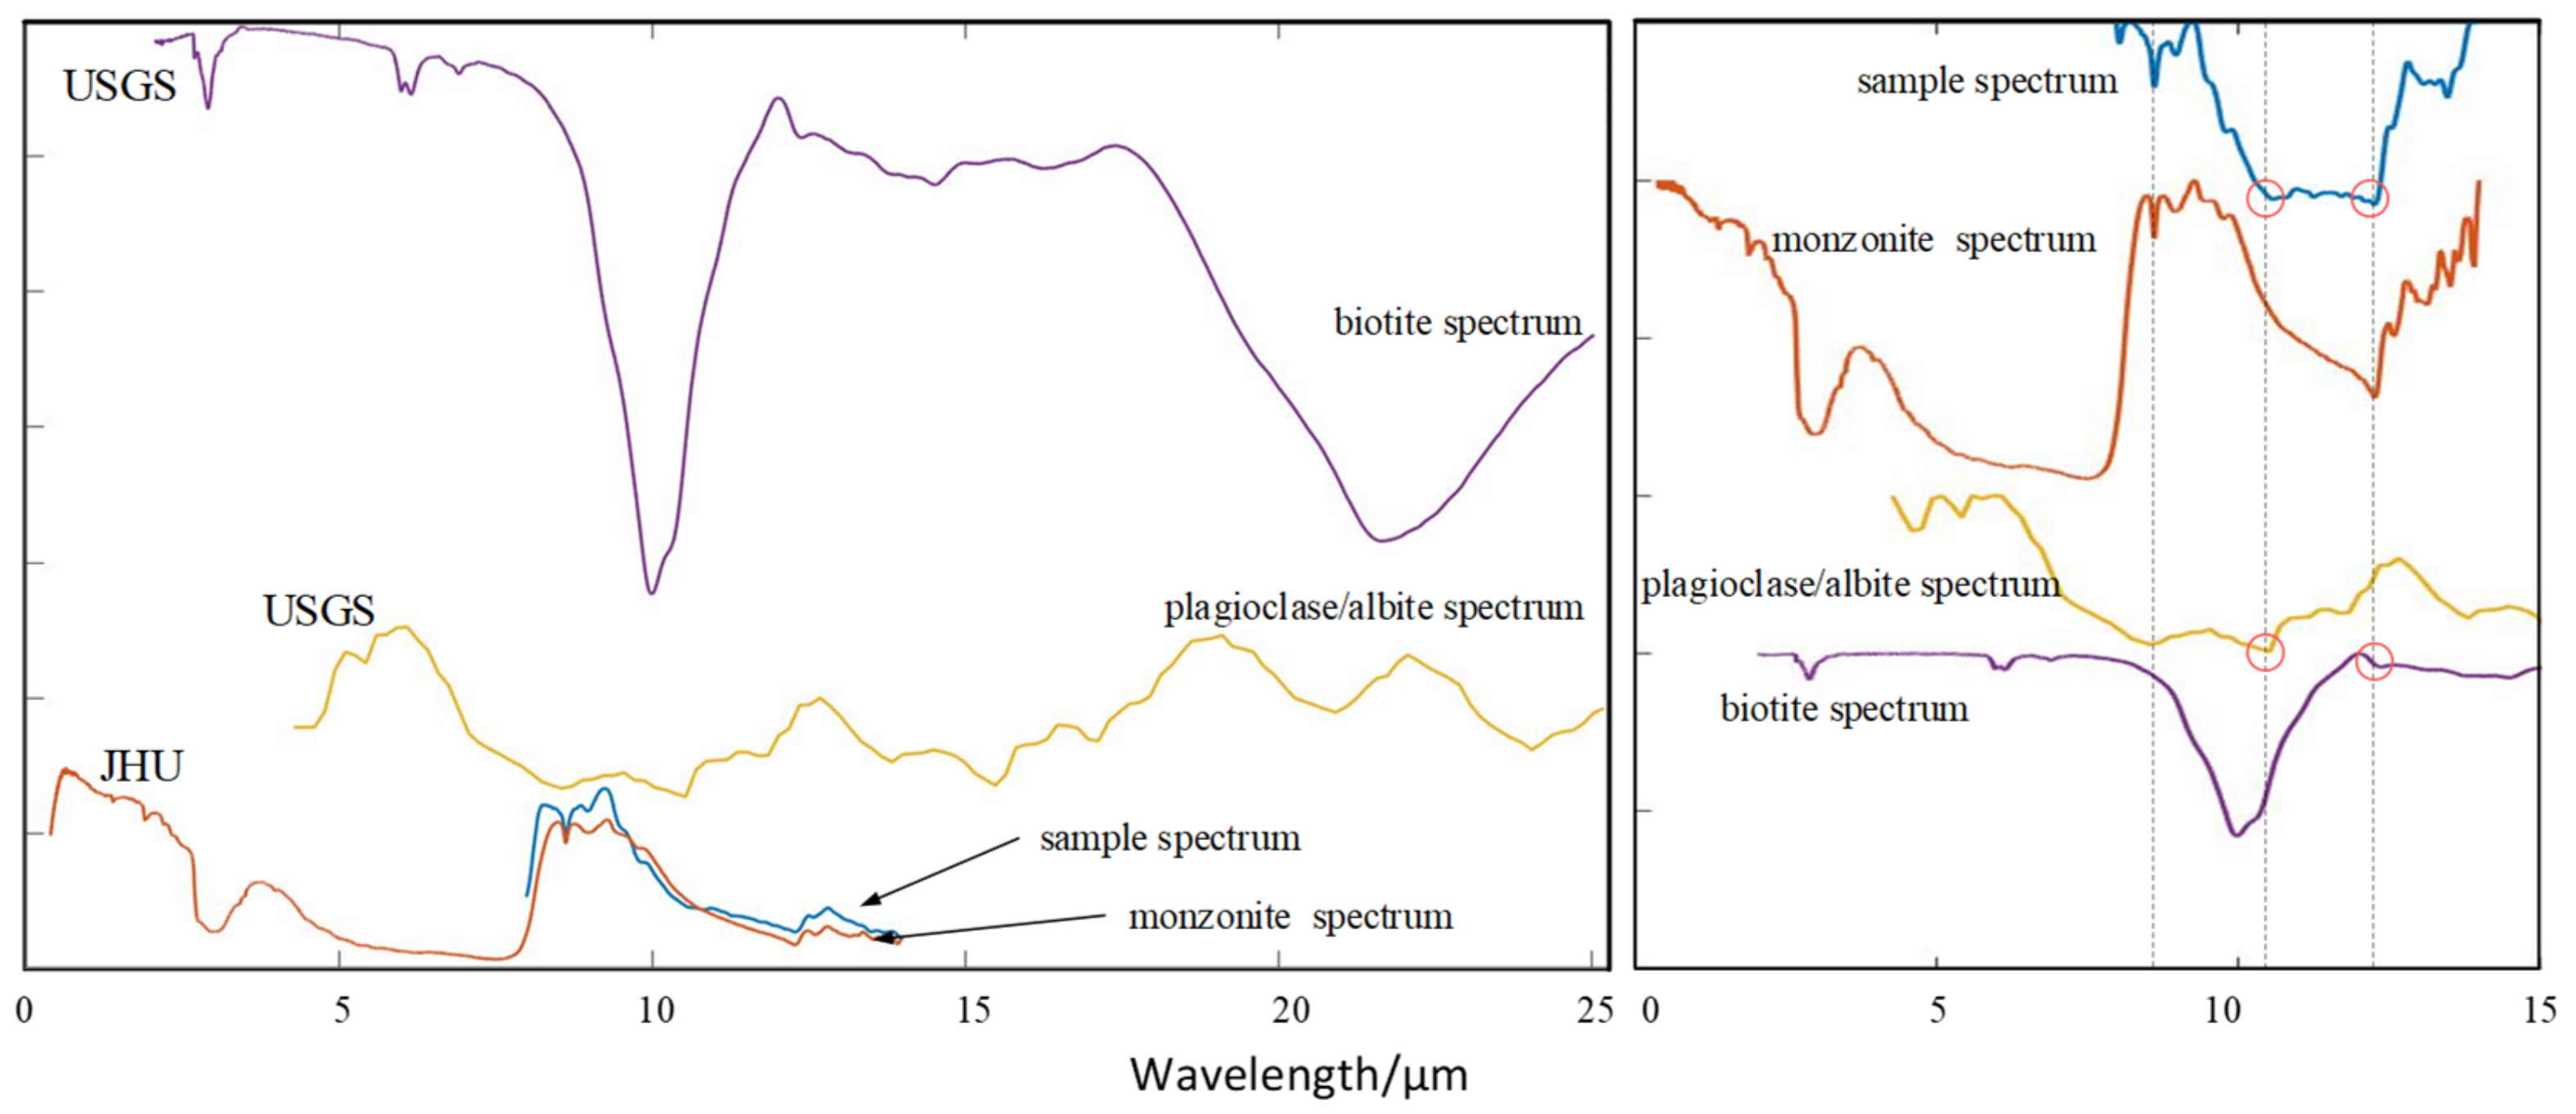
4.2.2. Experimental Analysis

Considering atmospheric transmission, we usually acquire spectroscopy information in atmospheric windows (i.e., mid-infrared and thermal infrared bands) for identifying ground objects. Here, we selected the thermal infrared band (8–14 μm) for spectral measurement and matching. Various matching methods supporting the RockSL were used to compare the spectrum of the specimen with the reference spectrum to obtain its matching accuracy and analyse its mineral components. Two parameters, namely, the rock and mineral types, are used as limiting conditions to respectively determine the specific rock type and the mineral composition that might be contained in the rock specimen.
As shown in Figure 10a, we first used the SID_SA algorithm to match the spectral data of rock categories in the RockSL and finally found the monzonite spectrum with a matching credibility of approximately 0.993. The matching credibility of the reference spectrum of monzonite and the unknown spectrum calculated by various methods obtained the highest value. We inferred that the rock sample is monzonite, which could be composed of silicate minerals, including plagioclase, alkaline feldspar, pyroxene, amphibole, mica, and other minerals. The reference spectrum of monzonite in the RockSL was collected from the JHU library, including the petrographic description and chemical analysis of the specific mineral compositions (i.e., 70% feldspar, 18% quartz, 8.2% pyroxene, 2% opaques, and 1.2% biotite). Then, the matching module was set in the range of silicate minerals for the matching analysis of its mineral composition. Furthermore, the mineral curves of albite and biotite collected from the USGS library also obtained high matching credibility scores of 0.986 and 0.973, respectively, through the SID_SA algorithm (Figure 10b). These spectral curves are consistent with the features of the target spectrum in different intervals and consistent with the mineral compositions of the monzonite spectrum. To make the result of the curve matching obvious, multiple mineral spectral curves are visualised together for detailed comparison and cognition (Figure 11).
Using the RockSL, we quickly obtained the type of rock sample, that is, monzonite, and its mineral compositions of feldspar and biotite. These results are basically consistent with the results of the rock slices test. The quartz specimen was also tested using an FTIR spectroradiometer and compared with the reference spectra in the RockSL. The result indicates that the target spectrum has a high matching similarity with the reference spectra (quartz) from different libraries (i.e., ASU and PDS spectral libraries) with different measurement parameters [41]. The reference spectra of matching are from multiple spectral libraries, further proving that the use of the RockSL is a fast and effective method of identifying unknown rocks and minerals.

5. Discussion and Conclusions

Massive spectral data that are stored in different libraries have different storage formats and spectral resolutions and inconsistent mineral categories and measurement parameters, resulting in low data utility. No integrated data sharing platform that considers the diversity of rocks and minerals spectral libraries at global scale exists. We believe that these limitations can be overcome by integrating spectral data worldwide to achieve easy sharing and provide good matching services for the efficient identification of mineral compositions. The spectral data from the USGS, JHU, JPL, PDS, and ASU libraries and the Mineral Infrared Spectral Atlas were collected and integrated into an open database with different sampling ranges and mineral categories, retaining the qualified data to establish a reliable and comprehensive open spectral dataset (i.e., the RockSL). Furthermore, database management software was developed for the RockSL for the management of diversified data, including spectral curves, measurement information, and original files. The measured spectrum can be compared with the present reference spectra in the RockSL through the developed software, thereby obtaining the matching similarity and determining the sample type and mineral compositions of an unknown rock/mineral specimen.
This paper introduces the general information on the RockSL and several key techniques of data acquisition (i.e., curve vectorisation), quality inspection, and spectral application. The RockSL provides not only a novel pattern of spectral data organisation but also an easy solution for users to build thematic spectral libraries for particular applications. A case demonstrates that the RockSL can be used to identify unknown rocks and quickly and accurately analyse its compositions.
Given the breadth and complexity of spectral data mining and application, many deep-seated problems must be further studied. Firstly, the RockSL should be expanded with the inclusion of spectral libraries developed by other institutions or organisations. We also call on relevant researchers to join us in building an even more comprehensive spectral dataset and access platform for improved global sharing and an easy matching service. Secondly, the spectral library should be extended to full wave band to cover near infrared to far infrared and add data with a spectral resolution of increased accuracy. A collection of multi-scale (such as in spectrum resolution) mineral spectral data must also be established to lay a foundation for knowledge extraction and further research. Thirdly, we should combine the knowledge of spectroscopy, mineralogy, and geophysics to summarise the spectral characteristics of mineral composition, clarify the influence of measurement parameters on spectral curves, and finally establish a reliable knowledge base. The current trends of spectral library development not only involve the accumulation of spectral data but also the use of data mining and deep analysis techniques to develop a reliable spectral knowledge base to provide improved support for future remote sensing applications.
We will continuously update the laboratory measurement spectrum, build a rock/mineral spectral data sharing cloud platform, and continue to improve the unified data standards to break the data barrier and improve the reusability of crowd-sourced spectral data. We also look forward to expanding the development of technologies for spectral analysis and matching service and encourage other researchers to participate in our project.

Author Contributions

Conceptualization, L.W., B.X. and S.Z.; methodology, B.X.; software, B.X.; validation, W.M.; formal analysis, W.M.; investigation, S.Z.; resources, L.W. and S.L.; data curation, W.M.; writing—original draft preparation, B.X.; writing—review and editing, L.W.; supervision, L.W.; funding acquisition, L.W. All authors have read and agreed to the published version of the manuscript.

Funding

This work was jointly supported by the Project on theory and application of resource and environment management in the digital economy era of Basic Science Center of National Natural Science Foundation of China (grant no. 72088101), the Key Program of National Nature Science Foundation of China (grant no. 41930108), the innovation leading program of Central South University (grant no. 506030101), and the Talents gathering program of Hunan Province China (grant no. 2018RS3013).

Data Availability Statement

The integrated spectral library (RockSL) described in this article is openly available on GitHub at https://github.com/CSU-PCP-XBS/spectral-dataset-RockSL (accessed on 4 January 2022).

Acknowledgments

We would like to thank the providers and institutions of spectral data, including the National Aeronautics and Space Administration (PDS3 data set), the United States Geological Survey (USGS spectral library), Johns Hopkins University (JHU spectral library), Jet Propulsion Laboratory (JPL Spectral Library), Arizona State University (ASU Spectral Library), Institute of Organic Chemistry and Chinese Academy of Sciences (MISA Spectral Library). Open source shared spectral data is an important foundation and content of our work.

Conflicts of Interest

The authors declare no conflict of interest.

References

  1. Fang, Q.; Hong, H.; Zhao, L.; Kukolich, S.; Yin, K.; Wang, C. Visible and Near-Infrared Reflectance Spectroscopy for Investigating Soil Mineralogy: A Review. J. Spectrosc. 2018, 2018, 1–14. [Google Scholar] [CrossRef]
  2. Viscarra Rossel, R.A.; Behrens, T.; Ben-Dor, E.; Brown, D.J.; Demattê, J.A.M.; Shepherd, K.D.; Shi, Z.; Stenberg, B.; Stevens, A.; Adamchuk, V.; et al. A global spectral library to characterize the world’s soil. Earth Sci. Rev. 2016, 155, 198–230. [Google Scholar] [CrossRef] [Green Version]
  3. Tong, Q.; Zhang, B.; Zheng, L. Hyperspectral Remote Sensing: Principle, Technique and Application; Higher Education Press: Beijing, China, 2006. [Google Scholar]
  4. Magendran, T.; Sanjeevi, S. Hyperion image analysis and linear spectral unmixing to evaluate the grades of iron ores in parts of Noamundi Eastern India. Int. J. Appl. Earth Obs. Geoinform. 2014, 26, 413–426. [Google Scholar] [CrossRef]
  5. Dai, J.; Zhao, L.; Jiang, Q.; Wang, H.; Liu, T. Review of thermal-infrared spectroscopy applied in geological ore exploration. Acta Geol. Sin. 2020, 94, 8. [Google Scholar]
  6. Goetz, A.F.H. Spectroscopic Remote Sensing for Geological Applications. Imaging Spectrosc. I Int. Soc. Opt. Photonics 1981, 268, 17–21. [Google Scholar]
  7. Clark, R.N.; Swayze, G.A.; Livo, K.E.; Kokaly, R.F.; Sutley, S.J.; Dalton, J.B.; Gent, C.A. Imaging spectroscopy: Earth and planetary remote sensing with the usgs tetracorder and expert systems. J. Geophys. Res. Planets 2003, 108. [Google Scholar] [CrossRef]
  8. Meer, F.; Werff, H.; Ruitenbeek, F.; Hecker, C.A.; Bakker, W.H.; Noomen, M.F.; der Meijde, M.E.; Carranza, J.M.; de Smeth, B.J.; Woldai, T. Multi and hyperspectral geologic remote sensing: A review. Int. J. Appl. Earth Obs. Geoinform. 2012, 14, 112–128. [Google Scholar] [CrossRef]
  9. Zhang, Y.T.; Xiao, Q.; Wen, J.G.; You, D.Q.; Dou, B.C.; Tang, Y. Review on spectral libraries: Progress and application. J. Remote Sens. 2017, 21, 12–26. [Google Scholar] [CrossRef] [Green Version]
  10. Goetz, A.F.H.; Vane, G.; Solomon, J.E.; Rock, B.N. Imaging spectrometry for earth remote sensing. Science 1985, 228, 1147–1153. [Google Scholar] [CrossRef]
  11. Green, R.O.; Eastwood, M.L.; Sarture, C.M.; Chrien, T.G.; Aronsson, M.; Chippendale, B.J.; Williams, O. Imaging spectroscopy and the airborne visible/infrared imaging spectrometer (AVIRIS). Remote Sens. Environ. 1998, 65, 227–248. [Google Scholar] [CrossRef]
  12. Mulder, V.L.; de Bruin, S.; Weyermann, J.; Kokaly, R.F.; Schaepman, M.E. Characterizing regional soil mineral composition using spectroscopy and geostatistics. Remote Sens. Environ. 2013, 139, 415–429. [Google Scholar] [CrossRef]
  13. Cheng, J.; Xiao, Q.; Wen, J.; Tang, Y.; You, D.; Bian, Z.; Zhong, S. Review of Methods and Remote Sensing Cases Using Spectral Library. Remote Sens. Technol. Appl. 2020, 35, 267–286. [Google Scholar]
  14. Zhou, X.; Zhou, D. Review of digital ground object spectral library. Spectrosc. Spectr. Anal. 2009, 29, 1616–1622. [Google Scholar]
  15. Xie, B.S.; Zhou, S.Y.; Wu, L.X. An Integrated Mineral Spectral Library Using Shared Data for Hyperspectral Remote Sensing and Geological Mapping. Int. Arch. Photogramm. Remote Sens. Spat. Inf. Sci. 2020, 43, 69–75. [Google Scholar] [CrossRef]
  16. Leeman, V.; Dianne, G.; Earing, D.; Vincent, R.K.; Ladd, S. The NASA Earth Resources Spectral Information System: A Data Compilation; University of Michigan: Ann Arbor, MI, USA, 1971. [Google Scholar]
  17. Salisbury, J.W.; D’Aria, D.M. Emissivity of terrestrial materials in the 8–14 μm atmospheric window. Remote Sens. Environ. 1992, 42, 83–106. [Google Scholar] [CrossRef]
  18. Clark, R.N.; Swayze, G.A.; Gallagher, A.J.; King, T.V.V.; Calvin, W.M. The U.S. Geological Survey Digital Spectral Library: Version 1 (0.2 to 3.0μm) (No. 93-592); Geological Survey (US): Reston, VA, USA, 1993. [Google Scholar]
  19. Kokaly, R.F.; Clark, R.N.; Swayze, G.A.; Livo, K.E.; Hoefen, T.M.; Pearson, N.C.; Wise, R.A.; Benzel, W.M.; Low, H.A.; Driscoll, R.L.; et al. USGS Spectral Library Version 7 Data: U.S. Geological Survey Data Release; United States Geological Survey (USGS): Reston, VA, USA, 2017. [Google Scholar] [CrossRef]
  20. Gillespie, A.; Rokugawa, S.; Matsunaga, T.; Cothern, J.S.; Hook, S.; Kahle, A.B. A temperature and emissivity separation algorithm for Advanced Spaceborne Thermal Emission and Reflection Radiometer (ASTER) images. IEEE Trans. Geosci. Remote Sens. 1998, 36, 1113–1126. [Google Scholar] [CrossRef]
  21. Baldridge, A.M.; Hook, S.J.; Grove, C.I.; Rivera, G. The ASTER spectral library version 2.0. Remote Sens. Environ. 2009, 113, 711–715. [Google Scholar] [CrossRef]
  22. Zhang, B.; Wang, X.; Liu, J.; Zheng, L.; Tong, Q. Hyperspectral image processing and analysis system (HIPAS) and its applications. Photogramm. Eng. Remote Sens. 2000, 66, 605–609. [Google Scholar]
  23. Tong, Q.; Tian, G. Spectra and Analysis of Typical Earth Objects of China; Science Press: Beijing, China, 1990. [Google Scholar]
  24. Li, X.; Liu, S. Principle and Application of Remote Sensing; Science Press: Beijing, China, 2008. [Google Scholar]
  25. Su, L.; Li, X.; Wang, J.; Tang, S. Some Problems of Typical Ground Object Spectral Knowledge Base Construction and Spectral Service. Adv. Earth Sci. 2003, 2, 185–191. [Google Scholar]
  26. Zhong, S.Y.; Xiao, Q.; Wen, J.G.; Zhen, X.M.; Ma, M.G.; Qu, Y.H.; Zhao, L.J. Design and realization of ground object background spectral library for surveying and mapping. J. Remote Sens. 2020, 24, 701–716. [Google Scholar]
  27. Hueni, A.; Nieke, J.; Schopfer, J.; Kneubühler, M.; Itten, K.I. The Spectral Database SPECCHIO for Improved Long-Term Usability and Data Sharing. Comput. Geosci. 2009, 35, 557–565. [Google Scholar] [CrossRef] [Green Version]
  28. Landgrebe, D. On Information Extraction Principles for Hyperspectral Data; Purdue University: West Lafayette, IN, USA, 1997; p. 34. [Google Scholar]
  29. Kruse, F.A. Artificial Intelligence for Geologic Mapping with Imaging Spectrometers; Open File Report; 1993. Available online: https://ntrs.nasa.gov/citations/19930008790 (accessed on 2 December 2021).
  30. Kahle, A.B.; Goetz, A.F.H. A data base of geologic field spectra. In Proceedings of the 15th International symposium on Remote Sensing of Environment, Ann Arbor, MI, USA, 11 May 1981. [Google Scholar]
  31. Grove, C.I.; Hook, S.J.; Paylor II, E.D. Compilation of Laboratory Reflectance Spectra of 160 Minerals, 0.4 to 2.5 Micrometers; Jet Propulsion Laboratory, NASA: Washington, DC, USA, 1992. [Google Scholar]
  32. Peng, W.; Liu, G. Infrared Spectra of Minerals; Science Press: Beijing, China, 1982. [Google Scholar]
  33. Christensen, P.R.; Bandfield, J.L.; Hamilton, V.E.; Howard, D.A.; Lane, M.D.; Piatek, J.L.; Stefanov, W.L. A thermal emission spectral library of rock-forming minerals. J. Geophys. Res. 2000, 105, 9735–9739. [Google Scholar] [CrossRef] [Green Version]
  34. Lampinen, H.M.; Laukamp, C.; Occhipinti, S.A.; Hardy, L. Mineral Footprints of the Paleoproterozoic Sediment-Hosted Abra Pb-Zn-Cu-Au Deposit Capricorn Orogen, Western Australia. Ore Geol. Rev. 2019, 104, 436–461. [Google Scholar] [CrossRef]
  35. Pelkey, S.M.; Mustard, J.F.; Murchie, S.; Clancy, R.T.; Wolff, M.; Smith, M.; Gondet, B. CRISM multispectral summary products: Parameterizing mineral diversity on Mars from reflectance. J. Geophys. Res. Planets 2007, 112, 171–178. [Google Scholar] [CrossRef]
  36. Blanco-Cuaresma, S.; Soubiran, C.; Jofré, P.; Heiter, U. The Gaia FGK benchmark stars-High resolution spectral library. Astron. Astrophys. 2014, 566, A98. [Google Scholar] [CrossRef] [Green Version]
  37. Shanghai Institute of Organic Chemistry of CAS. Chemistry Database [DB/OL]. Available online: http://www.organchem.csdb.cn,1978-2020 (accessed on 16 December 2020).
  38. Wang, D.; Liu, S.J.; Mao, Y.C.; Wang, Y.; Li, T.Z. A method Based on Thermal Infrared Spectrum for Analysis of SiO2 Content in Anshan-Type Iron. Spectrosc. Spectr. Anal. 2016, 38, 2101–2106. [Google Scholar]
  39. Song, L.; Liu, S.J.; Yu, M.L.; Mao, Y.C.; Wu, L.X. A Classification Method Based on the Combination of Visble, Near-Infrared and Thermal Infrared Spectrum for Coal and Gangue Distinguishment. Spectrosc. Spectr. Anal. 2017, 37, 416–422. [Google Scholar]
  40. Xie, B.S.; Zhou, S.Y.; Wu, L.X.; Mao, W.F.; Wang, W. RockSL: An Integrated Rock Spectral Library for Better Global Shared Services. Big Earth Data 2021, 06. [Google Scholar] [CrossRef]
  41. Naccache, N.J.; Shinghal, R. An investigation into the skeletonization approach of Hilditch. Pattern Recognit. 1984, 17, 279–284. [Google Scholar] [CrossRef]
  42. Fu, Q.; Ni, S.; Guo, J.; Kai, L. Vectorization of Raster Data and Solving of it’s Problems. Geo Inf. Sci. 2004, 3, 8–11. [Google Scholar]
  43. Fan, J. Study on Construction and Implementation of Typical Ground Object Spectrum Database in Yanzhou Mining Area; Shandong University of Science and Technology: Qingdao, China, 2011. [Google Scholar]
  44. Mcglone, J.C.; Shufelt, J.A. Projective and Object Space Geometry for Monocular Building Extraction; Carnegie Mellon University: Pittsburgh, PA, USA, 1994. [Google Scholar]
  45. Kruse, F.A.; Lefkoff, A.B.; Boardman, J.W.; Heidebrecht, K.B.; Shapiro, A.T.; Barloon, P.J.; Goetz, A.F.H. The Spectral Image Processing System (SIPS) Software for Integrated Analysis of AVIRIS Data; Summaries of the 4th Annual JPL Airborne Geoscience Workshop; Pasadena JPL Pub: Pasadena, CA, USA, 1992; pp. 23–25. [Google Scholar]
  46. Pu, R.; Gong, P. Hyperspectral Remote Sensing and its Application; Higher Education Press: Beijing, China, 2000. [Google Scholar]
  47. Su, H.; Du, P.; Sheng, Y. Study on feature extraction and experiment of hyperspectral data. Remote Sens. Technol. Appl. 2008, 4, 288–293. [Google Scholar]
  48. Clark, R.N.; King, T.V. Automatic Continuum Analysis of Reflectance Spectra; NASA: Washington, DC, USA, 1987. [Google Scholar]
  49. Wang, J.; Zhen, L.; Tong, Q. The Spectral Absorption Identification Model and Mineral Mapping by Imaging Spectrometer Data. Remote Sens. Environ. China 1996, 1, 20–31. [Google Scholar]
  50. Jia, X.; Richards, A.J. Binary coding of imaging spectrometry data for fast Spectral matching and classification. Remote Sens. Environ. 1993, 43, 47–53. [Google Scholar] [CrossRef]
  51. Noronha, S.; Nevatia, R. Detection and Modeling of Buildings from Multiple Aerial Images. IEEE Trans. Pattern Anal. Mach. Intell. 2001, 23, 501–518. [Google Scholar] [CrossRef]
Figure 1. Timeline of mineralogical spectral libraries. The spectral libraries currently used to build RockSL were selected by the blue box.
Minerals 12 00118 g001
Figure 2. Wavelength range of the shared spectral libraries.
Minerals 12 00118 g002
Figure 3. Methodological sequence for the development of the Rock Spectral Library (RockSL) using sampling data and the requirement of contribution data.
Minerals 12 00118 g003
Figure 4. Workflow of RockSL research.
Minerals 12 00118 g004
Figure 5. Process diagram of the custom spectral classifier.
Minerals 12 00118 g005
Figure 6. Operating mechanism of spectral matching.
Minerals 12 00118 g006
Figure 7. Data analysis of RockSL. The target curve is displayed with yellow colour, the envelope of the spectrum is shown with blue colour and the continuum removed (CR) spectra using the convex hull algorithm is shown with orange colour.
Minerals 12 00118 g007
Figure 8. Mineral retrieve of the operating system (search example: cuprite). (a) The retrieval interface of the spectral information; (b) the retrieval interface of the mineral attribute shows the attribute information and mineral image (cuprite, downloaded from an open website).
Minerals 12 00118 g008
Figure 9. Experimental sample and analysis operation. (a) 102F Fourier Transform Infrared spectrometer for spectral testing, (b) the spectral data (8–14 μm) measured by the spectrometer and the curve after removing the envelope, (c) Axioskop40 microscope, (d) the identification result indicates the mineral component of plagioclase (PI), K-feldspar (Kfs), biotite (Bt), chlorite (Chl), and epidote (Ep).
Minerals 12 00118 g009
Figure 10. Identification of unknown rock and its composition by the RockSL. (a) The spectral curve of the monzonite (No. 3286) matched well with the spectra of the specimen. (b) Mineral curves of albite (No. 2069) and biotite (No. 4289) matched well with the spectra of the specimen.
Minerals 12 00118 g010
Figure 11. Identification of an unknown rock sample and its composition using the RockSL. The comparison between the sample spectrum and the reference spectrum, in which the monzonite spectrum and the sample spectrum roughly coincide (left). The sample spectrum and reference spectra after removing the envelope to highlight the absorption characteristics, and the positions of absorption peaks overlap (right).
Minerals 12 00118 g011
Table 1. Key measurement information of the shared libraries integrated in RockSL.
Spectral LibraryWavelength RangeParticle SizeInstrumentStorage FormatSpectra AmountData Resource
USGS [19] 0.2–200 μmμm levelBeckman 5270, ASD, Nicolet, AVIRIS etc.text files and related information2468 Laboratory and Field and Airborne
JPL [30]0.4–2.5 μm<45 μm,
45–125 μm,
125–500 μm
Beckman UV5240Spectrum.txt and ancillary.txt3104Laboratory
JHU [17]0.4–14 μm
2.08–25 μm
μm level/Spectrum.txt and ancillary.txt3104 Laboratory
PDS [35]0.3–26.0 μmμm level Tab file826 Laboratory
ASU [33]5.0–45 μm710–1000 μmBeckman, ASD,HDF/text file150 Laboratory
MIS Atlas [38]0.25–5.0 μm//images583 Laboratory
Publisher’s Note: MDPI stays neutral with regard to jurisdictional claims in published maps and institutional affiliations.

