
Mineralogy of Miocene Petrified Wood from Central Washington State, USA


Abstract
:1. Introduction
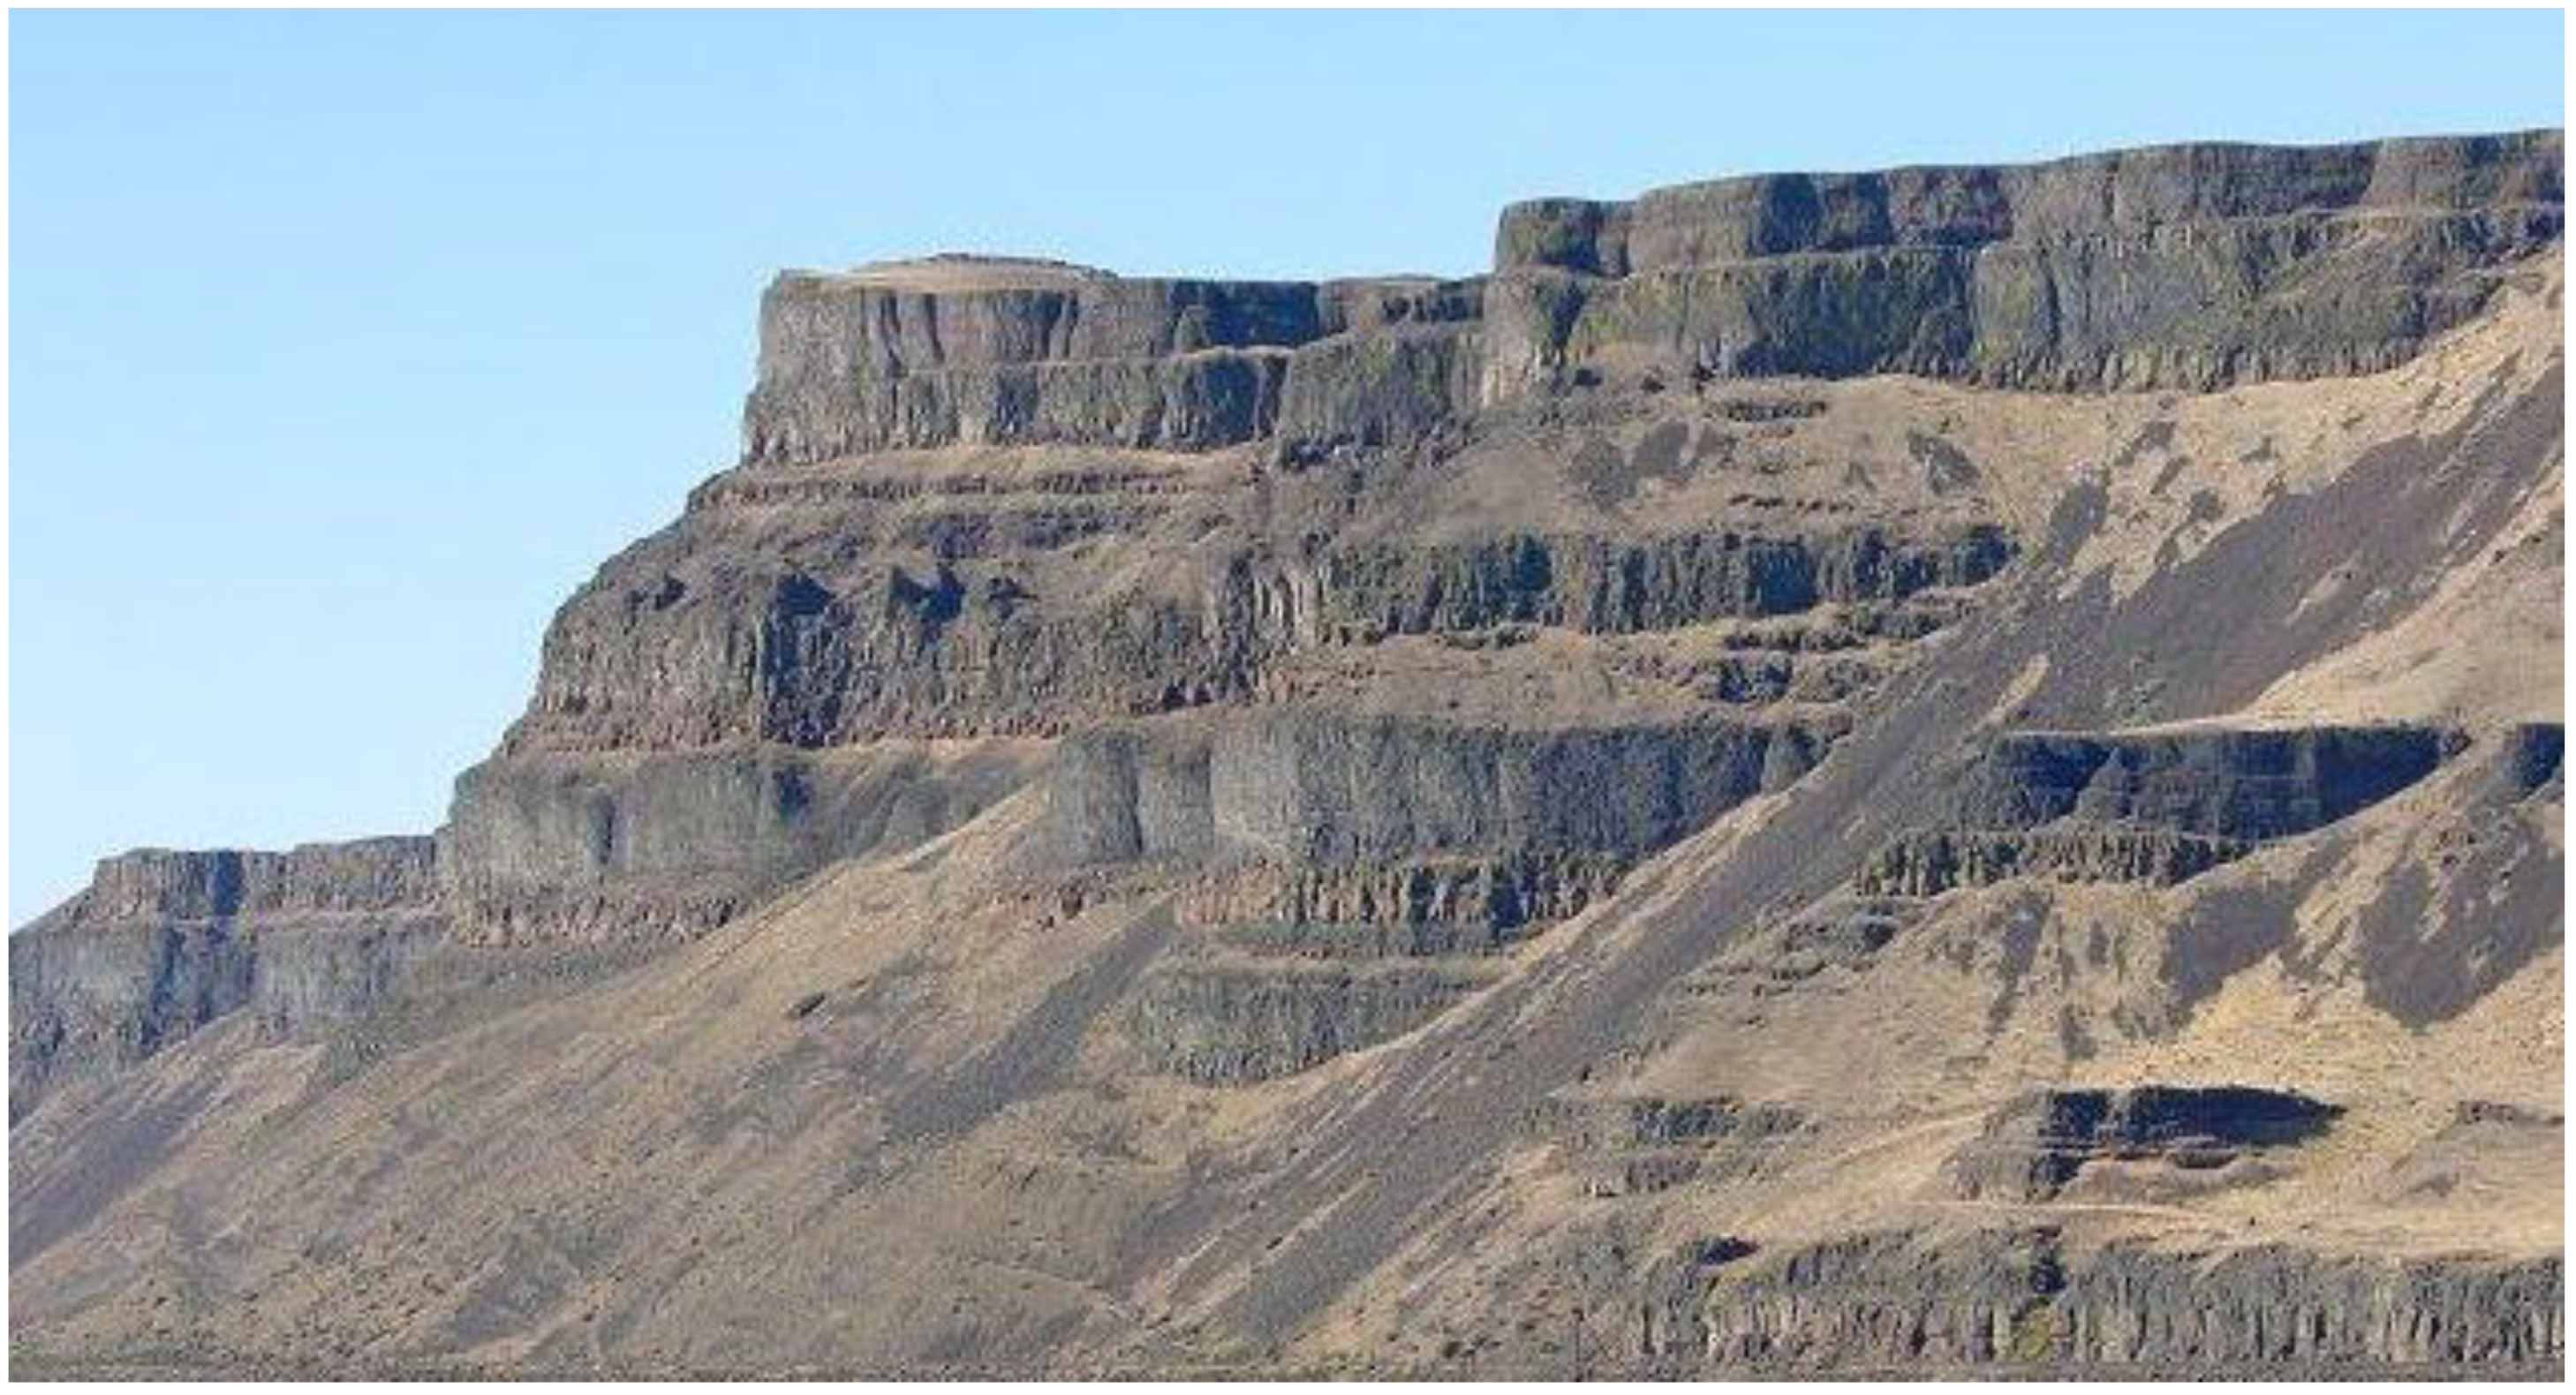
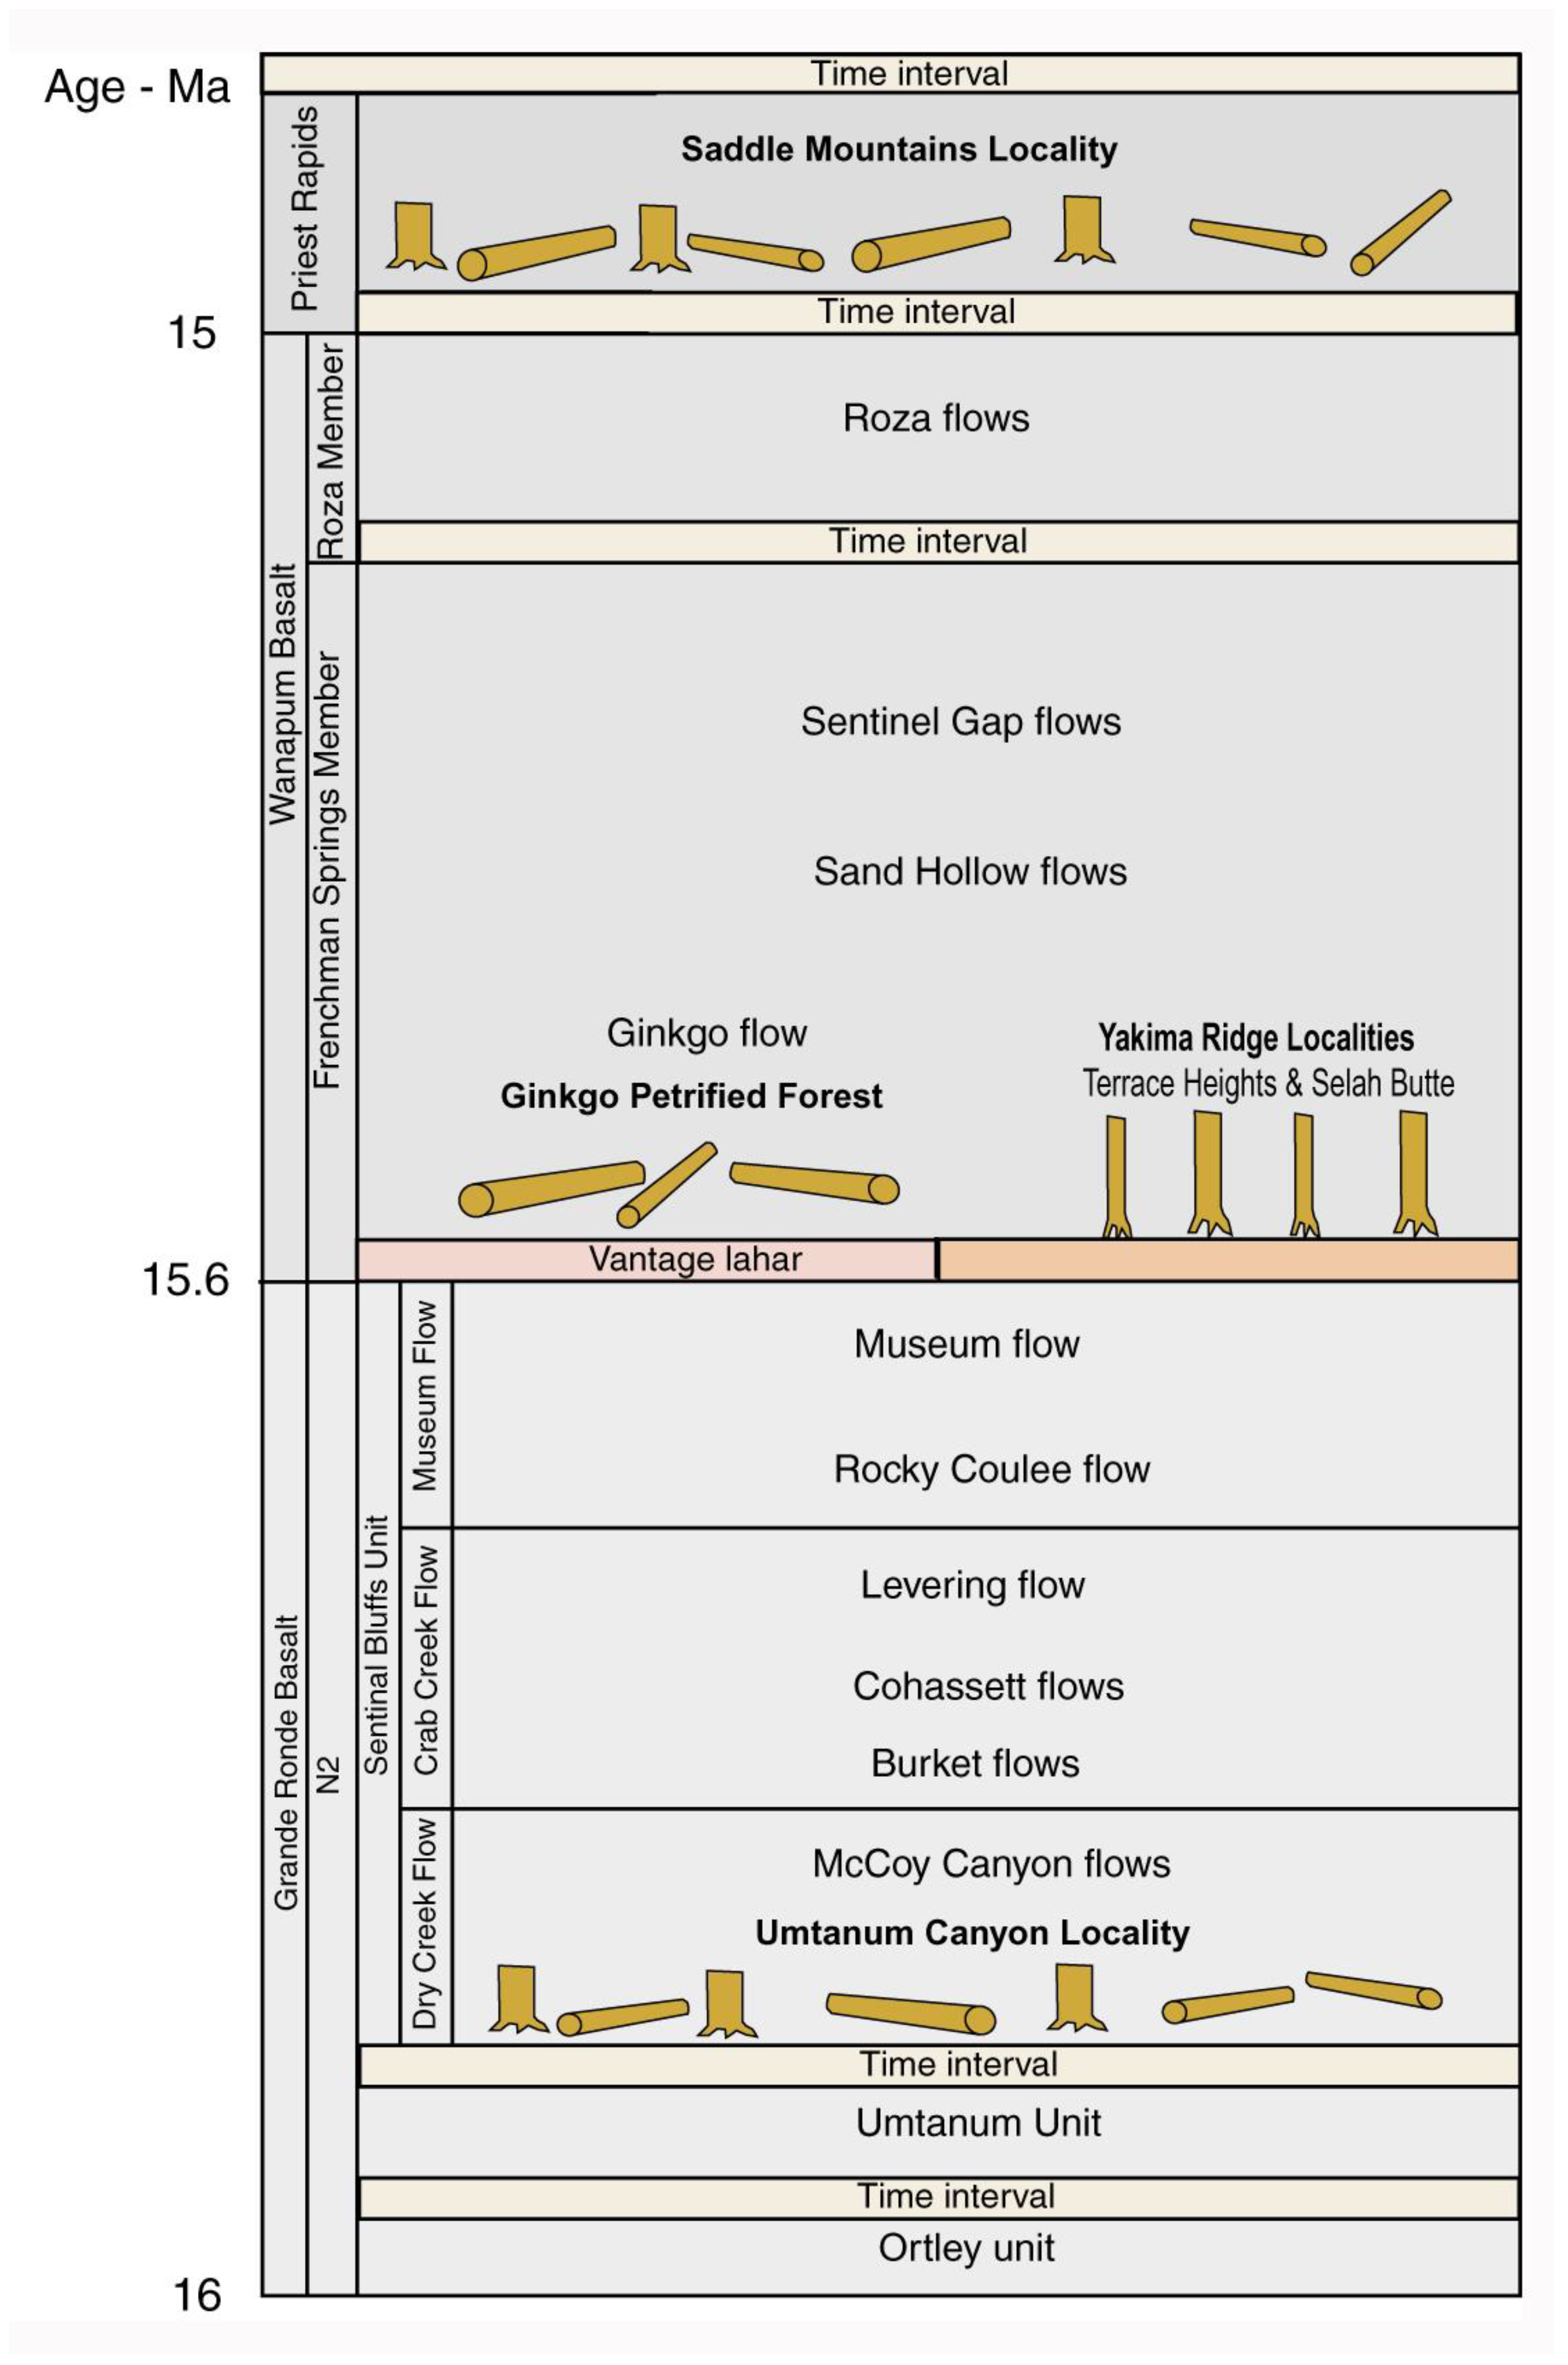
2. Geologic Setting
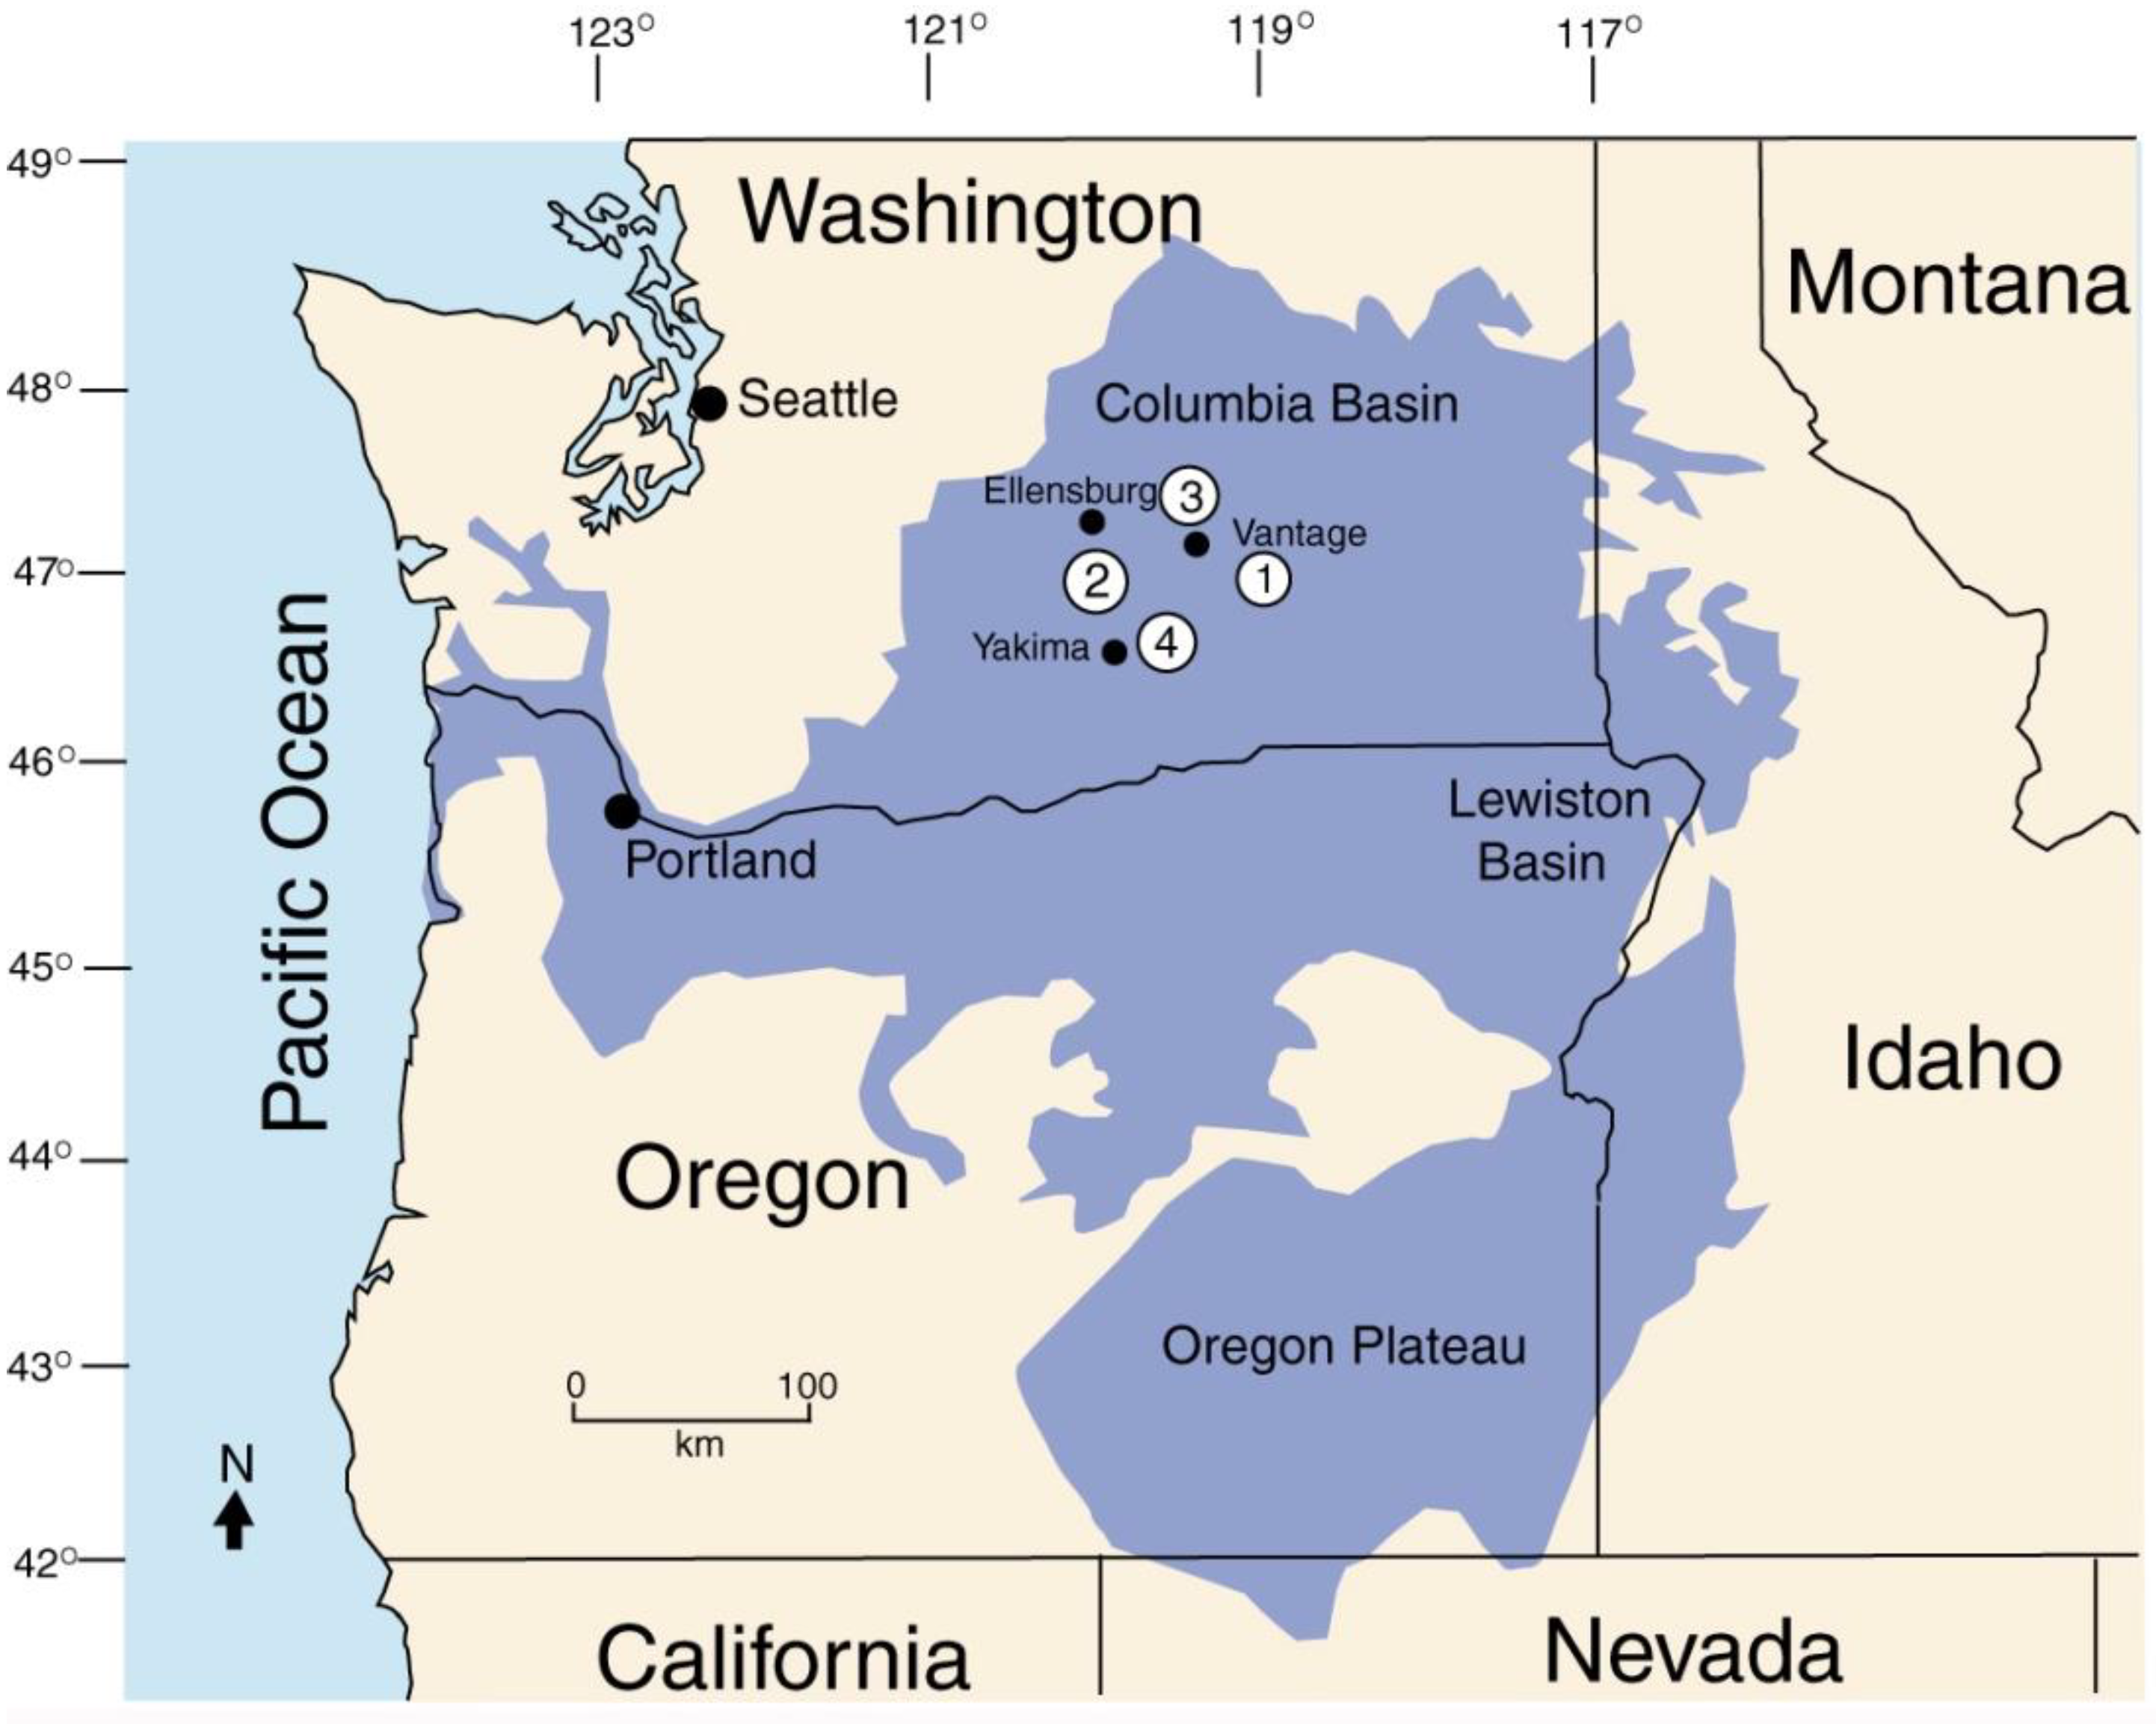
3. Locations Used in This Study
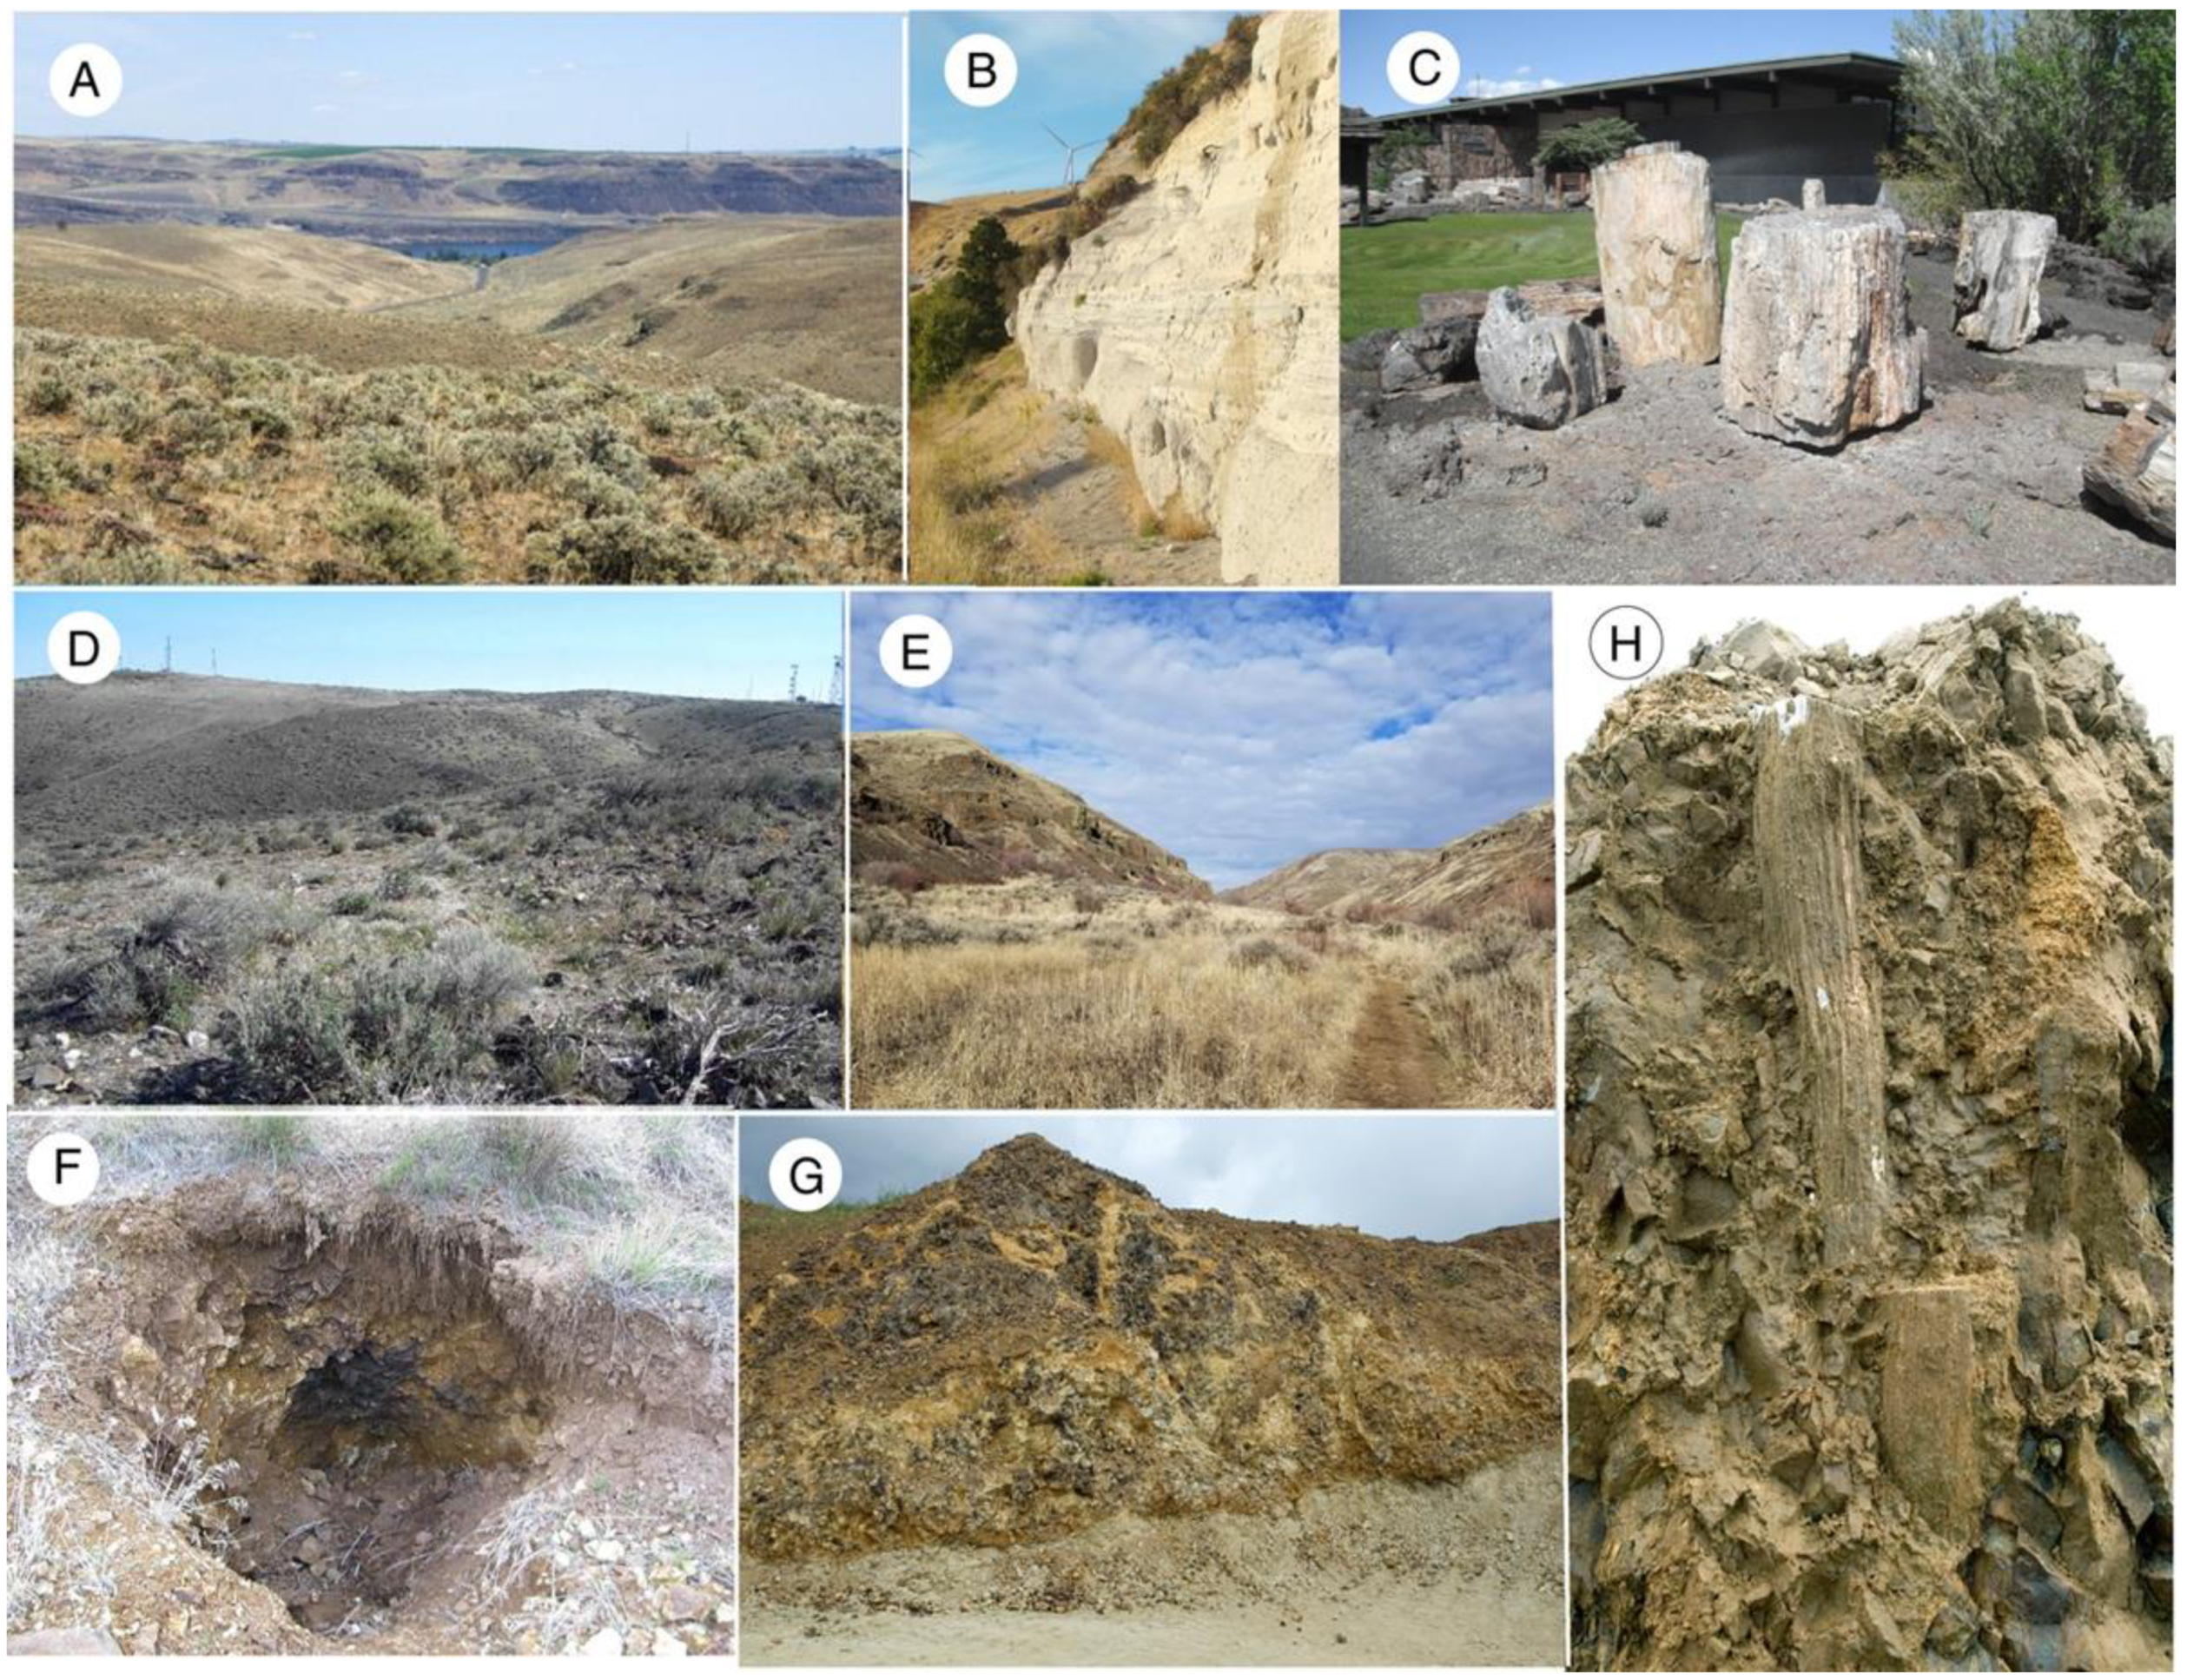
3.1. Ginkgo Petrified Forest
3.2. Saddle Mountain Fossil Locality
3.3. Umtanum Canyon Fossil Locality
3.4. Yakima Ridge Fossil Forest
4. Methods and Materials
5. Results
5.1. Silica Mineralogy
5.2. Compositional Heterogeneity
5.3. Possible Evidence of Diagenetic Mineral Transformation
6. Discussion
6.1. Source of Groundwater
6.2. Why Is the Mineralogy So Complicated?
Author Contributions
Funding
Data Availability Statement
Acknowledgments
Conflicts of Interest
Appendix A
| GINKGO PETRIFIED FOREST—VANTAGE, WA | ||||||||
| Sample | Density g/cm3 | XRD | Thin Section | Repository | ||||
| Opal-CT | Quartz | Opal-A | Opal-CT | Chalcedony | Quartz | |||
| V1 | 2.29 | + | + | + | + | Beck specimen #353 | ||
| V2 | 2.25 | + | − | + | Beck specimen #354 | |||
| V3 | 2.49 | + | + | Beck specimen #408 | ||||
| V4 | 2.06 | + | + | Beck specimen #421 | ||||
| V5 | 2.05 | + | + | − | Beck specimen #423 | |||
| V6 | 2.49 | + | + | Beck specimen #428 | ||||
| V7 | 2.50 | + | + | Beck specimen #431 | ||||
| V8 | 2.40 | + | + | − | + | − | Beck specimen #438 | |
| V9 | 2.22 | + | + | + | Beck specimen #470 | |||
| V10 | 2.06 | − | + | Beck specimen #477 | ||||
| V11 | 2.23 | + | + | + | Beck specimen #478 | |||
| V12 | 2.29 | + | + | + | + | − | Beck specimen #498 | |
| V13 | 1.94 | - | + | Beck specimen #518 | ||||
| V14 | 2.12 | − | + | − | Beck specimen #569 | |||
| V15 | 2.35 | + | + | Beck specimen #582 | ||||
| UMTANUM LOCALITY & YAKIMA CANYON OUTLIERS | ||||||||
| Sample | Density g/cm3 | XRD | Thin Section | Repository | ||||
| Opal-CT | Quartz | Opal-A | Opal-CT | Chalcedony | Quartz | |||
| U1 | 1.99 | + | + | - | Beck specimen #313 | |||
| U2 | 2.05 | + | − | + | + | Beck specimen #321 | ||
| U3 | 2.18 | + | + | + | + | Beck specimen #322 | ||
| U4 | 2.09 | + | + | + | Beck specimen #329 | |||
| U5 | 2.07 | + | − | + | − | Beck specimen #512 | ||
| U6 | 2.41 | + | + | Beck specimen #540 | ||||
| U7 | 2.03 | + | + | Beck specimen #574 | ||||
| U8 | 2.07 | + | − | + | + | − | WWU specimen | |
| YC-1 | 2.53 | + | + | WWU specimen | ||||
| YC-2 | 2.06 | + | + | − | WWU specimen | |||
| YC-3 | 2.34 | + | + | + | + | WWU specimen | ||
| YC-4 | 2.36 | + | + | + | + | WWU specimen | ||
| YC-5 | 2.57 | + | + | WWU specimen | ||||
| YC-6 | 2.17 | + | + | − | WWU specimen | |||
| YC-7 | 2.04 | + | − | WWU specimen | ||||
| SADDLE MOUNTAINS LOCALITY | ||||||||
| Sample | Density g/cm3 | XRD | Thin Sections | Repository | ||||
| Opal-CT | Quartz | Opal-A | Opal-CT | Chalcedony | Quartz | |||
| SM-1 | 2.26 | + | + | + | + | + | WWU specimen | |
| SM-2 | 2.52 | + | + | + | WWU specimen | |||
| SM-3 | 2.55 | + | + | WWU specimen | ||||
| SM-4 | 2.17 | + | - | + | + | − | WWU specimen | |
| SM-5 | 2.41 | + | + | + | + | WWU specimen | ||
| SM-6 | 2.45 | + | + | WWU specimen | ||||
| SM-7 | 2.64 | + | + | WWU specimen | ||||
| SM-8 | 2.24 | + | − | + | + | WWU specimen | ||
| SM-9 | 2.22 | − | + | + | − | WWU specimen | ||
| SM-10 | 2.32 | + | + | + | + | WWU specimen | ||
| SM-11 | 2.25 | + | + | + | + | WWU specimen | ||
| SM-12 | 2.55 | + | + | WWU specimen | ||||
| SM-13 | 2.19 | + | − | + | − | WWU specimen | ||
| SM-14 | 2.58 | + | + | WWU specimen | ||||
| YAKIMA RIDGE: TERRACE HEIGHTS LOCALITY | ||||||||
| Sample | Density g/cm3 | XRD | Thin Sections | Repository | ||||
| Opal-CT | Quartz | Opal-A | Opal-CT | Chalcedony | Quartz | |||
| TH-1 | 2.06 | + | + | + | + | + | WWU specimen | |
| TH-2 | 2.55 | + | + | + | WWU specimen | |||
| TH-4 | 2.49 | + | + | + | + | WWU specimen | ||
| TH-5 | 2.54 | + | + | WWU specimen | ||||
| TH-6 | 2.53 | + | − | + | + | WWU specimen | ||
| TH-7 | 2.23 | + | + | + | + | + | WWU specimen | |
| TH-8 | 2.15 | + | + | WWU specimen | ||||
| TH-9 | 2.31 | + | + | + | + | + | WWU specimen | |
| TH-10 | 2.27 | + | − | + | + | WWU specimen | ||
| YAKIMA RIDGE: SELAH BUTTE LOCALITY | ||||||||
| Sample | Density g/cm3 | XRD | Thin Sections | Repository | ||||
| Opal-CT | Quartz | Opal-A | Opal-CT | Chalcedony | Quartz | |||
| SB-1 | 2.44 | + | − | + | WWU specimen | |||
| SB-2 | 2.04 | + | + | − | + | WWU specimen | ||
| SB-3 | 2.20 | + | − | + | + | − | WWU specimen | |
| SB-4 | 2.08 | + | − | + | + | − | WWU specimen | |
| SB-5 | 1.98 | + | − | + | − | WWU specimen | ||
| SB-6 | 2.20 | + | + | + | + | + | WWU specimen | |
| SB-7 | 1.99 | + | − | + | + | WWU specimen | ||
| SB-8 | 2.15 | + | − | + | + | − | WWU specimen | |
| SB-9 | 2.51 | + | − | + | + | WWU specimen | ||
References
- Buurman, P. Mineralization of fossil wood. Scr. Geol. 1972, 12, 1–43. [Google Scholar]
- Stein, C.L. Silica recrystallization in petrified wood. J. Sediment. Petrol. 1982, 52, 1277–1282. [Google Scholar]
- Scurfield, G.; Segnit, E.R. Petrifaction of wood by silicaminerals. Sediment. Geol. 1984, 149, 149–167. [Google Scholar] [CrossRef]
- Mustoe, G.E. Mineralogy and geochemistry of late Eocene silicified wood from Florissant Fossil Beds National Monument, Colorado. In Paleontology of the Upper Eocene Florissant Formation, Colorado, Geological Society of America Special Paper435; Meyer, H.W., Smith, D.M., Eds.; Geological Society of America: Boulder, CO, USA, 2008; pp. 127–140. [Google Scholar]
- Mustoe, G.E. Late Tertiary wood from Nevada, USA: Evidence of multiple silicification pathways. Geosciences 2015, 5, 286–309. [Google Scholar] [CrossRef] [Green Version]
- Mustoe, G.E. Uranium mineralization of fossil wood. Geosciences 2019, 9, 133. [Google Scholar] [CrossRef] [Green Version]
- Mustoe, G.E. Mineralogy of non-silicified wood. Geosciences 2018, 8, 85. [Google Scholar] [CrossRef] [Green Version]
- Mustoe, G.E.; Abbassi, N.; Hosseini, A.; Mndjzadeh, Y. Neogene tree trunk fossils from the Meshgin Shar area, northwest Iran. Geosciences 2019, 10, 283. [Google Scholar] [CrossRef]
- Mustoe, G.E. New discovery of Neogene fossil forests in Guatemala. Geosciences 2020, 10, 49. [Google Scholar] [CrossRef] [Green Version]
- Mustoe, G.E.; Viney, M. Mineralogy of Paleocene petrified wood from Cherokee Ranch Fossil Forest, central Colorado, USA. Geosciences 2017, 7, 23. [Google Scholar] [CrossRef] [Green Version]
- Dietrich, D.; Lampke, T.; Röβler, R. A microstructure study on silicified wood from the Permian Petrified Forest of Chemnitz. Paläontologsche Z. 2013, 87, 397–407. [Google Scholar] [CrossRef]
- Viney, M.; Dietrich, D.; Mustoe, G.; Link, P.; Lampke, T.; Götze, J.; Röβler, R. Multi-stage silicification of Pliocene wood: Re-examination of an 1895 discovery from Idaho, USA. Geosciences 2016, 6, 21. [Google Scholar] [CrossRef] [Green Version]
- Trümper, J.; Röβler, R.S. Götze Deciphering silicification pathways of fossil forests: Case studies from the late Paleozoic of central Europe. Minerals 2018, 8, 432. [Google Scholar] [CrossRef] [Green Version]
- Trümper, S.; Götze, J.; Röβler, R. Siliceous petrifactions in the Permian of the Parnaiba Basin, central-north Brazil: Sedimentary environment and fossilization pathways. In BrazilianPaleofloras: From Paleozoic to Holocene; Iannuzzi, R., Röβler, R., Kunzann, L., Eds.; Springer Nature: London, UK, 2020; pp. 1–45. [Google Scholar]
- Liesegang, M.; Gee, C.T. Silica entry and accumulation in standing trees in a hot-spring environment: Cellular pathways, rapid pace and fossilization potential. Palaeontology 2020, 63, 651–660. [Google Scholar] [CrossRef]
- Menci, V.; Matysová, P.; Sakala, J. Silicifieid wood from the Czech part of the Intra Sudetic Basin (Late Pennsylvanian, Bohemian Massif, Czech Republic: Systematic, silicification and palaeoenvironment. NeuesJahrb. Geol. Paläontologie-Abh. 2009, 252, 269–288. [Google Scholar]
- Furuno, T.; Watanabe, T.; Suzuki, N.; Goto, T.; Yokoyama, K. Microstrucure and silica mineralization in the formation of silicified woods. I, Species identification of silicified wood and observations with a scanning electron microscope. MokuzaiGakkaishi 1986, 32, 387–400. [Google Scholar]
- Furuno, T.; Watanabe, T.; Suzuki, N.; Goto, T.; Yokoyama, K. Microstructure and silica mineralization in the formation of silicified woods II. Distribution of organic carbon and formation of quartz in the structure of silicified woods. MokuzaiGakkaishi 1986, 32, 575–593. [Google Scholar]
- Akahane, H.; Furuno, T.; Miyajima, H.; Yoshikawa, T.; Yamamoto, S. Rapid wood silicification in hot spring water: An explanation of silicification of wood in the Earth’s history. Sediment. Geol. 2004, 169, 219–228. [Google Scholar] [CrossRef]
- Mustoe, G.E. Wood petrifaction: A new view of permineralization and replacement. Geosciences 2017, 7, 119. [Google Scholar] [CrossRef] [Green Version]
- Mustoe, G.E. Washington’s fossil forests. Wash. Geol. 2001, 29, 10–21. [Google Scholar]
- Camp, V.E. Mid-Miocene propagation of the Yellowstone mantle plume head beneath the Columbia River basalt source region. Geology 1995, 23, 435–438. [Google Scholar] [CrossRef]
- Camp, V.E. Origin of Columbia River Basalt: Passive Rise of Shallow Mantle, or Active Upwelling of a Deep-Mantle Plume? Geological Society of America: Boulder, CO, USA, 2013; pp. 181–199. [Google Scholar]
- Camp, V.E.; Hanan, B.B. A plume-triggered delamination origin for the Columbia River Basalt Group. Geosphere 2008, 4, 480–495. [Google Scholar] [CrossRef]
- Coble, M.A.; Mahood, G.A. Initial impingement of the Yellowstone plume located by widespread silicic volcanism contemporaneous with Columbia River flood basalts. Geology 2012, 40, 655–658. [Google Scholar] [CrossRef]
- Reidel, S.P.; Camp, V.E.; Tolan, T.L.; Martin, B.S. The Columbia River flood basalt province: Stratigraphy, areal extent, volume, and physical volcanology. In The Columbia River Basalt Province; Reidel, S.P., Camp, V.E., Ross, M.E., Wolff, J.A., Martin, B.S., Tolan, T., Wells, R.E.W., Eds.; Geological Society of America: Boulder, CO, USA, 2013; pp. 1–44. [Google Scholar]
- Reidel, S.P.; Hooper, P.R. Volcanism and Tectonism in the Columbia River Flood Basalt Province; Geological Society of America: Boulder, CO, USA, 1989; p. 386. [Google Scholar]
- Reidel, S.P. The Columbia River Basalt Group: A flood basalt province in the Pacific Northwest, USA. Geosci. Can. 2015, 42, 151–168. [Google Scholar] [CrossRef] [Green Version]
- Mustoe, G.E.; Leopold, E.B. Paleobotanical evidence for the post-Miocene uplift of the Cascade Range. Can. J. Earth Sci. 2014, 51, 809–824. [Google Scholar] [CrossRef]
- Orsen, M.J. Biostratigraphy of Columbia River Basalt Group petrified forests, Paper 226-13, Geological Society of America Seattle Annual Meeting, 2–5 November 2003. Geol. Soc. Am. Abstr. Programs 2003, 35, 55. [Google Scholar]
- Brockman, C.F. The Story of the Petrified Forest. Ginkgo State Park, Washington; Washington State Parks and Recreation Commission: Olympia, WA, USA, 1984. [Google Scholar]
- Russell, I.C. A Geological Reconnaissance of Central Washington; U.S. Geological Survey: Washington, DC, USA, 1893; p. 108. [Google Scholar]
- Beck, G.F. Ancient forest trees of the sagebrush area in central Washington. J. For. 1945, 43, 334–338. [Google Scholar]
- Beck, G.F. The quest for the sacred Ginkgo. Wash. Hist. Q. 1935, 26, 3–9. [Google Scholar]
- Tate, C. Ginkgo Petrified Forest State Park. The Online Encyclopedia of Washington State History. History Link. Available online: https//historylink.orh/File/7396 (accessed on 1 August 2021).
- Beck, G.F. Fossil wood of the far West, Part 5. Northwest Miner. News 1956, 3, 19–22. [Google Scholar]
- Tolan, T.L.; Reidel, S.P.; Fecht, K.R. The unusual occurrence of fossil logs within a middle Miocene flood basalt pillow lava complex—An examination of geologic events and processes that created the “Vantage Forest” of central Washington (abstract). EOS Am. Geophys. Union Trans. 1991, 72, 602. [Google Scholar]
- Orsen, M. Ginkgo Petrified Forest; Ginkgo Gem Shop: Vantage, WA, USA, 2007; p. 26. [Google Scholar]
- Dillhoff, T.A. Fossil Forests of Eastern Washington. Available online: https://www.evolvingearth.org/research/fossil-woods-eastern-washington/ (accessed on 17 October 2021).
- Beck, G.F. Fossil bearing basalts. Northwest Sci. 1935, 9, 4–7. [Google Scholar]
- Beck, G.F. Squaw Creek petrified forest of central Washington. In Fossil Woods of the Far West; Informal Publication of Central Washington State University: Ellensburg, WA, USA, 1942; Volume 2, pp. 1–10. [Google Scholar]
- Beck, G.F. Tertiary coniferous woods of western North America. Northwest. Sci. 1945, 19, 67–69. [Google Scholar]
- Prakash, U. Miocene fossil woods from the Columbia Basalts of Central Washington, III. Palaeoontographica Suppl. B 1968, 122, 181–200. [Google Scholar]
- Scott, R.A.; Barghoorn, E.S.; Prakash, U. Wood of Ginkgo in the Tertiary of western North America. Am. J. Bot. 1961, 49, 1095–1101. [Google Scholar] [CrossRef]
- Prakash, U.; Barghoorn, E.S. Miocene fossil woods from the Columbia basalts of central Washington. J. Arnold Arbor. 1961, 42, 165–203. [Google Scholar] [CrossRef]
- Prakash, U.; Barghoorn, E.S. Miocene fossil woods from the Columbia basalts of central Washington II. J. Arnold Arbor. 1961, 42, 347–362. [Google Scholar] [CrossRef]
- Wheeler, E.A.; Dillhoff, T.A. The Middle Miocene wood flora of Vantage, Washington, USA. IAWA J. Suppl. 7 2009, 106. Available online: https://iawa-website.org/uploads/soft/download/iawa_j_supplements/IAWA%20J.%20Suppl.7.%20Miocene%20Wood%20Flora%20Vantage.pdf (accessed on 1 August 2021).
- Reidel, S.P. The Saddle Mountains—The evolution of an anticline in the Yakima fold belt. Am. J. Sci. 1984, 284, 942–978. [Google Scholar] [CrossRef]
- Reidel, S.P. Geologic Map of the Saddle Mountains, South-Central Washington; Washington Division of Geology and Earth Resources Geologic MapGM-38: Olympia, DC, USA, 1998; p. 26. [Google Scholar]
- 7.5′ Beverly Quadrangle Topo Map; U.S. Geological Survey: Washington, DC, USA, 1965.
- Dillhoff, T.A. A Miocene Forest Assemblage from the Columbia River Basalts of Washington State, USA, Botanical Society of America Botany 2006 Conference, California State University, Chico, CA, USA, Abstract 444. Available online: http://www.2006.botanyconference.org/engine/search/index.php?func=detail&aid=444/ (accessed on 16 October 2021).
- Mapes, L.V. Rare Surprise for Yakima Man: A Forest of Stone. Seattle Times, 4 May 2007. Available online: https://www.seattletimes.com/seattle-news/rare-surprise-for-yakima-man-a-forest-of-stone/ (accessed on 10 August 2021).
- Tizon, T.A. A Buried Treasure of Trees. Los Angeles Times, 28 June 2007. Available online: https://www.latimes.com/archives/la-xpm-2007-jun-28-na-petrifiedtrees28-story.html/ (accessed on 10 August 2021).
- Dillhoff, T.A. Miocene Forest Assemblage in the Columbia River Basalts. Available online: https://www.evolvingearth.org/research/miocene-forest-assemblage-columbia-river-basalts/ (accessed on 8 December 2021).
- Mustoe, G.E. Density and loss on ignition as indicators of the fossilization of silicified wood. IAWA J. 2016, 37, 98–111. [Google Scholar] [CrossRef]
- Jones, J.B.; Segnit, E.R. The nature of opal. I. Nomenclature and constituent phases. J. Geol. Soc. Aust. 1971, 18, 57–68. [Google Scholar] [CrossRef]
- Flörke, O.W.; Graetsch, H.; Röller, M.B.; Wirth, R. Nomenclature and micro- and non-crystalline silica minerals, based on structure and microstructure. NeuesJahrb. Mineral. Abh. 1991, 163, 19–42. [Google Scholar]
- Curtis, N.J.; Gascooke, J.R.; Johnston, M.R.; Pring, A. A review of the classification of opal with reference to recent new localities. Minerals 2019, 9, 299. [Google Scholar] [CrossRef] [Green Version]
- Liesegang, N.; Milke, R. Australian sedimentary opal-A and its associated minerals: Implications for natural silica sphere formation. Am. Mineral. 2014, 99, 1488–1499. [Google Scholar] [CrossRef]
- Flörke, O.W.; Flörke, U.; Giese, U. Moganite: A new crystalline silica mineral. N. Jb. Mineral. Abh. 1976, 149, 325–326. [Google Scholar]
- Heaney, P.J.; Veblen, D.R.; Post, J.E. Structural disparities between chalcedony and macrocrystalline quartz. Am. Miner. 1994, 79, 452–460. [Google Scholar]
- Parthasarathy, G.; Kunwar, A.C.; Srinivasan, R. Occurrence of moganite-rich chalcedony in Deccan flood basalts, Killari, Maharashtra, India. Eur. J. Miner. 2001, 13, 127–134. [Google Scholar] [CrossRef]
- Hesse, R. Diagenesis #13. Origin of chert: Diagenesis of biogenic siliceous sediments. Geosci. Can. 1988, 15, 171–192. [Google Scholar]
- Leo, R.F.; Barghoorn, E.S. Silicificiation of wood. Harv. Bot. Mus. Leafl. 1973, 25, 1–47. [Google Scholar]
- Wang, Y.; Xu, H.; Bryan, C. Formation of Petrified Woods: An Organic Molecule-Templated Silica Mineral Precipitation in Nature, Geological Society of America 2001 Annual Meeting, Boston, MA, USA, 1–10 November 2001, USA, Abstracts with Programs, 2001, 33. Available online: https://gsa.confex.com/gsa/2001AM/webprogram/Paper26122.html (accessed on 17 October 2021).
- Lynne, B.Y.; Campbell, K.A.; Bryony, J.J.; Browne, P.R.L.; Moore, J. Tracking crystallinity in siliceous hot-spring deposits. Am. J. Sci. 2007, 307, 612–641. [Google Scholar] [CrossRef]
- Williams, L.A.; Parks, G.A.; Crerar, D.A. Silica diagenesis, I. Solubility controls. J. Sediment. Petrol. 1985, 55, 301–311. [Google Scholar]
- Williams, L.A.; Parks, G.A.; Crerar, D.A. Silica diagenesis, II General Mechanisms. J. Sediment. Petrol. 1985, 55, 312–321. [Google Scholar]
- Liesegang, M.; Tomaschek, F. Tracing the continental diagenetic loop of the opal-A to opal-CT transformation with X-ray diffraction. Sediment. Geol. 2020, 398, 105603. [Google Scholar] [CrossRef]
- Ballhaus, C.; Gee, C.T.; Bockrath, C.; Greef, K.; Mansfeldt, T.; Rhede, D. The silicification of trees in volcanic ash—An experimental study. Geochim.Cosmochim. Acta 2012, 84, 62–74. [Google Scholar] [CrossRef]
- Läbe, S.; Gee, C.T.; Ballhaus, C.; Nagel., T. Experimetal silicification of the tree fern Dicksonia Antarctica at high temperature with silica-enriched H2O vapor. Palaios 2012, 27, 835–841. [Google Scholar] [CrossRef]
- Gee, C.T.; Liesegang, M. Chapter 6. Experimental silicification of wood in lab and field: Pivitol studies and open questions. In Fossilization: Understanding the Material Nature of Ancient Plants and Animals in the Paleontological Record; Gee, C.T., McCoy, V.E., Sander, P.M., Eds.; Johns Hopkins University: Baltimore, MD, USA, 2021; pp. 139–158. [Google Scholar]
- Liesegang, M.; Tomaschek, F.; Götze, J. The structure and chemistry of silica in mineralized wood: Techniques and analysis. In Fossilization: Understanding the Material Nature of Ancient Plants and Animals in the Paleontological Record; Gee, C.T., McCoy, V.E., Sander, P.M., Eds.; Johns Hopkins University: Baltimore, MD, USA, 2021; pp. 159–186. [Google Scholar]
- Saminpanya, S.; Sutherland, F.L. Silica phase transformations during diagenesis within petrified woods found in fluvial deposits from Thailand-Myanmar. Sediment. Geol. 2012, 290, 15–26. [Google Scholar] [CrossRef]
- Mitzutani, S. Silica minerals in the early stages of diagenesis. Sedimentology 1970, 15, 419–436. [Google Scholar] [CrossRef]
- Hooper, P.R.; Reidel, S.P.; Brown, C.J.; Holden, G.S.; Kleck, W.D.; Sundstrom, C.E.; Taylor, T.L. Major Element Analysis of the Columbia River Basin; Washington State University: Cheney, WA, USA, 1984; p. 59. [Google Scholar]
- Murata, K.J. Volcanic ash as a source of silica for the silicification of wood. Am. J. Sci. 1950, 238, 586–596. [Google Scholar] [CrossRef]
- Matysová, P.; Röβler, R.; Götze, J.; Leichmann, L.; Forbes, C.; Taylor, E.I.; Sakala, L.; Grygar, T. Alluvial andvolcanic pathways to silicified plant stems (Upper Carboniferous-Triassic) and their taphonomic and palaeoenvironmental meaning. Palaeogeogr. Palaeoclimatol. Palaeoecol. 2010, 292, 127–143. [Google Scholar] [CrossRef]
- Segnit, E.R.; Stevens, T.J.; Jones, J.B. The role of water in opal. J. Geol. Soc. Aust. 2007, 12, 211–226. [Google Scholar] [CrossRef]
- Murata, K.J.; Nakata, J.K. Cristobalitic stage in the diagenesis of diatomaceous shale. Science 1974, 414, 567–568. [Google Scholar] [CrossRef]
- Mitzutani, S. Progressive ordering of cristobalite in early stages of diagenesis. Contrib. Mineral. Petrol. 1977, 61, 129–140. [Google Scholar] [CrossRef]
- Kastner, M.; Keene, J.B.; Gieskes, J.M. Diagenesis of siliceous oozes-1. Chemical controls on the rate of opal-A to opal-CT transitions—An experimental study. Geochim. Cosmochim. Acta 1977, 41, 1041–1059. [Google Scholar] [CrossRef]
- Hein, J.R.; Yeh, H.W.; Barron, J.A. Eocene diatom chert from Adak Island, Alaska. J. Sediment. Petrol. 1990, 60, 250–257. [Google Scholar]
- Mustoe, G.E. Diatomaceous origin of siliceous shale in Eocene lakebeds of central British Columbia. Can. J. Earth Sci. 2005, 42, 231–241. [Google Scholar] [CrossRef]


Publisher’s Note: MDPI stays neutral with regard to jurisdictional claims in published maps and institutional affiliations. |
© 2022 by the authors. Licensee MDPI, Basel, Switzerland. This article is an open access article distributed under the terms and conditions of the Creative Commons Attribution (CC BY) license (https://creativecommons.org/licenses/by/4.0/).
Share and Cite
Mustoe, G.E.; Dillhoff, T.A. Mineralogy of Miocene Petrified Wood from Central Washington State, USA. Minerals 2022, 12, 131. https://doi.org/10.3390/min12020131
Mustoe GE, Dillhoff TA. Mineralogy of Miocene Petrified Wood from Central Washington State, USA. Minerals. 2022; 12(2):131. https://doi.org/10.3390/min12020131
Chicago/Turabian StyleMustoe, George E., and Thomas A. Dillhoff. 2022. "Mineralogy of Miocene Petrified Wood from Central Washington State, USA" Minerals 12, no. 2: 131. https://doi.org/10.3390/min12020131