
Pore Structure Evolution and Seepage Characteristics in Unclassified Tailing Thickening Process

 , ,
, ,
Abstract
:1. Introduction
2. Materials and Methods
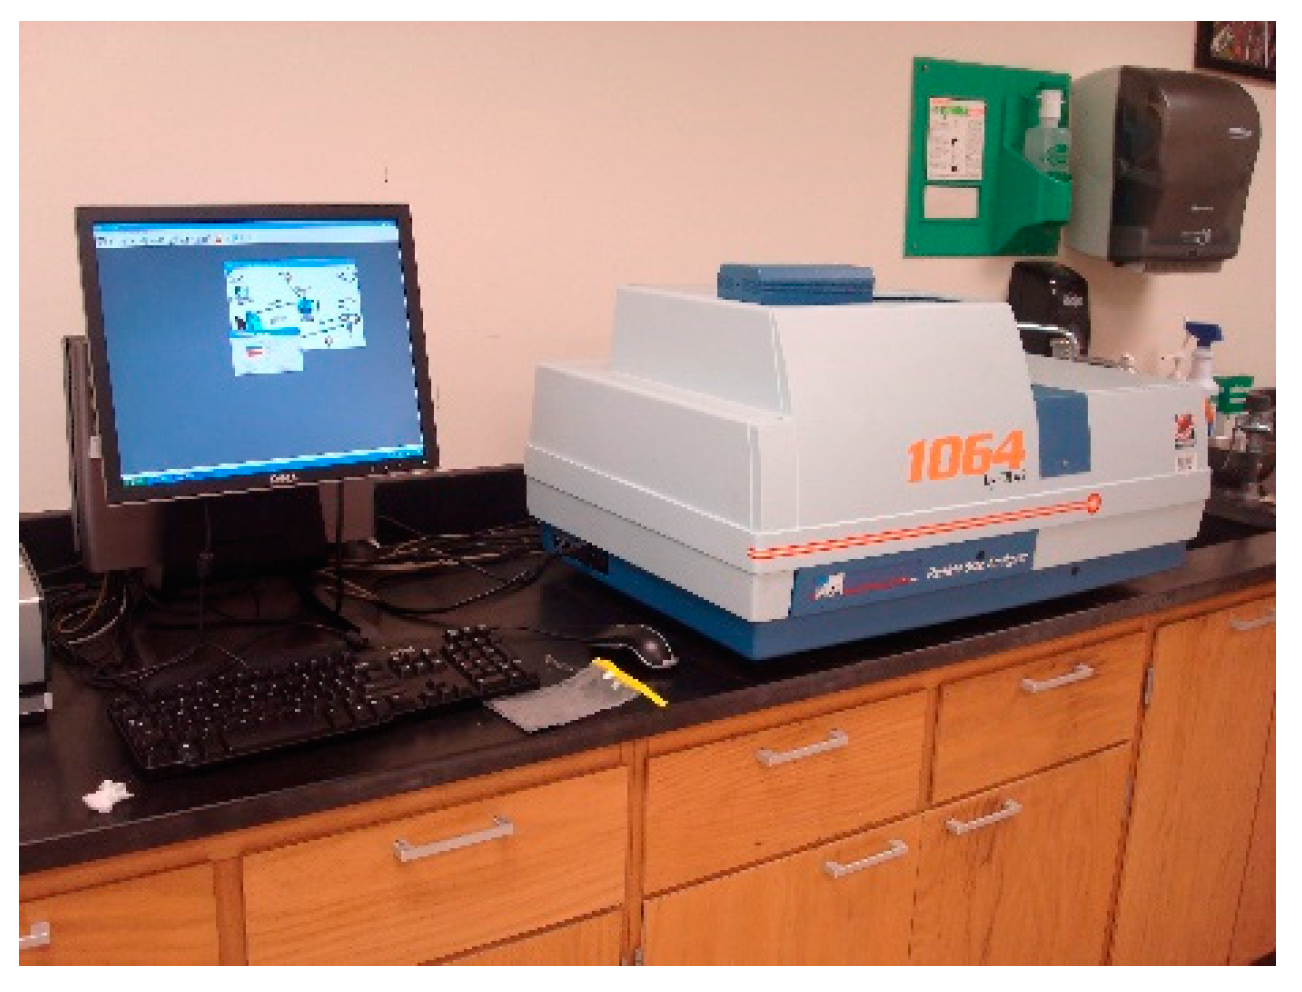
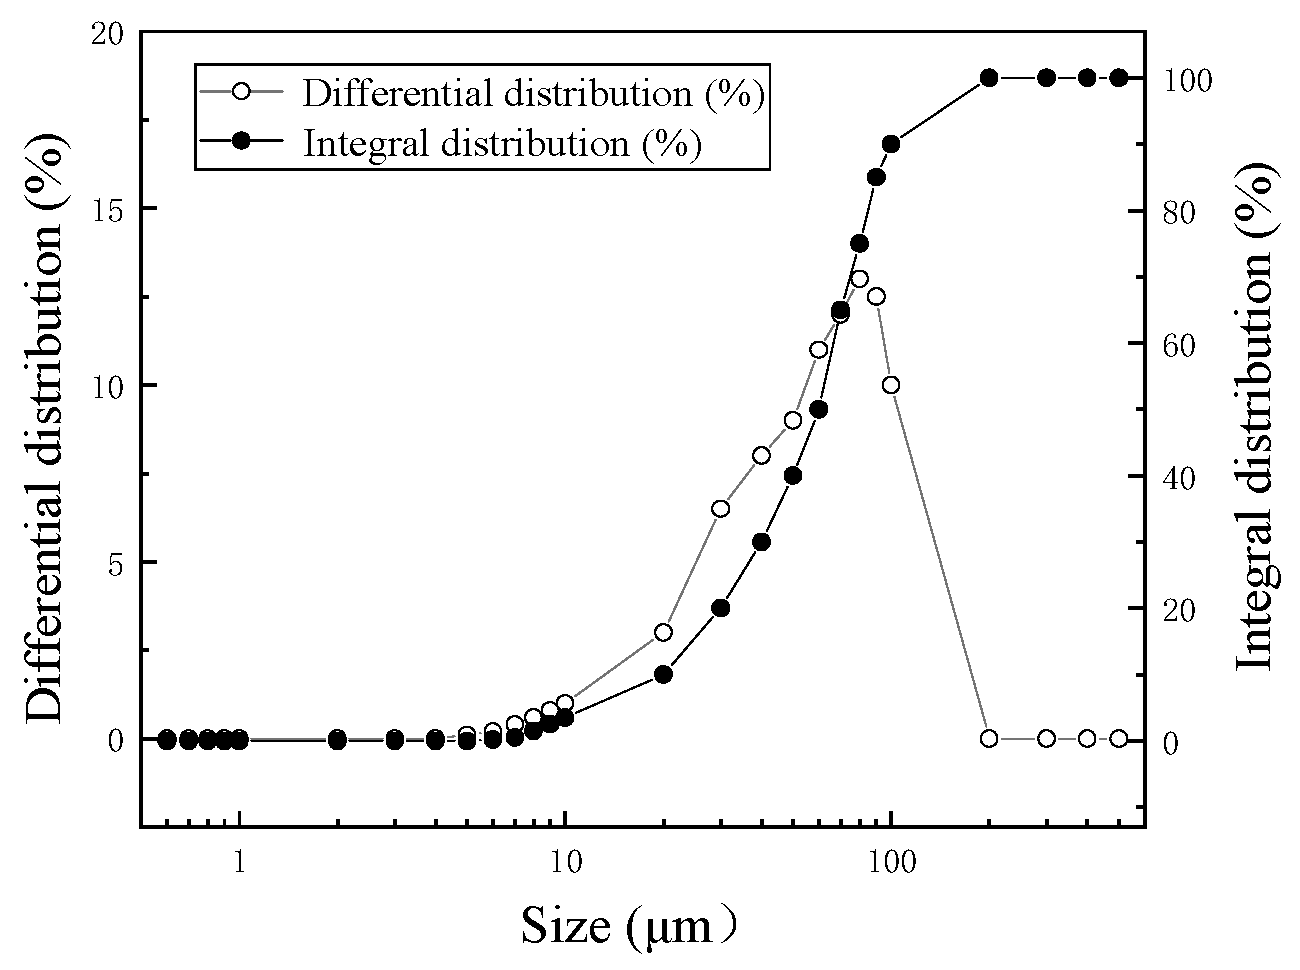
2.1. Materials
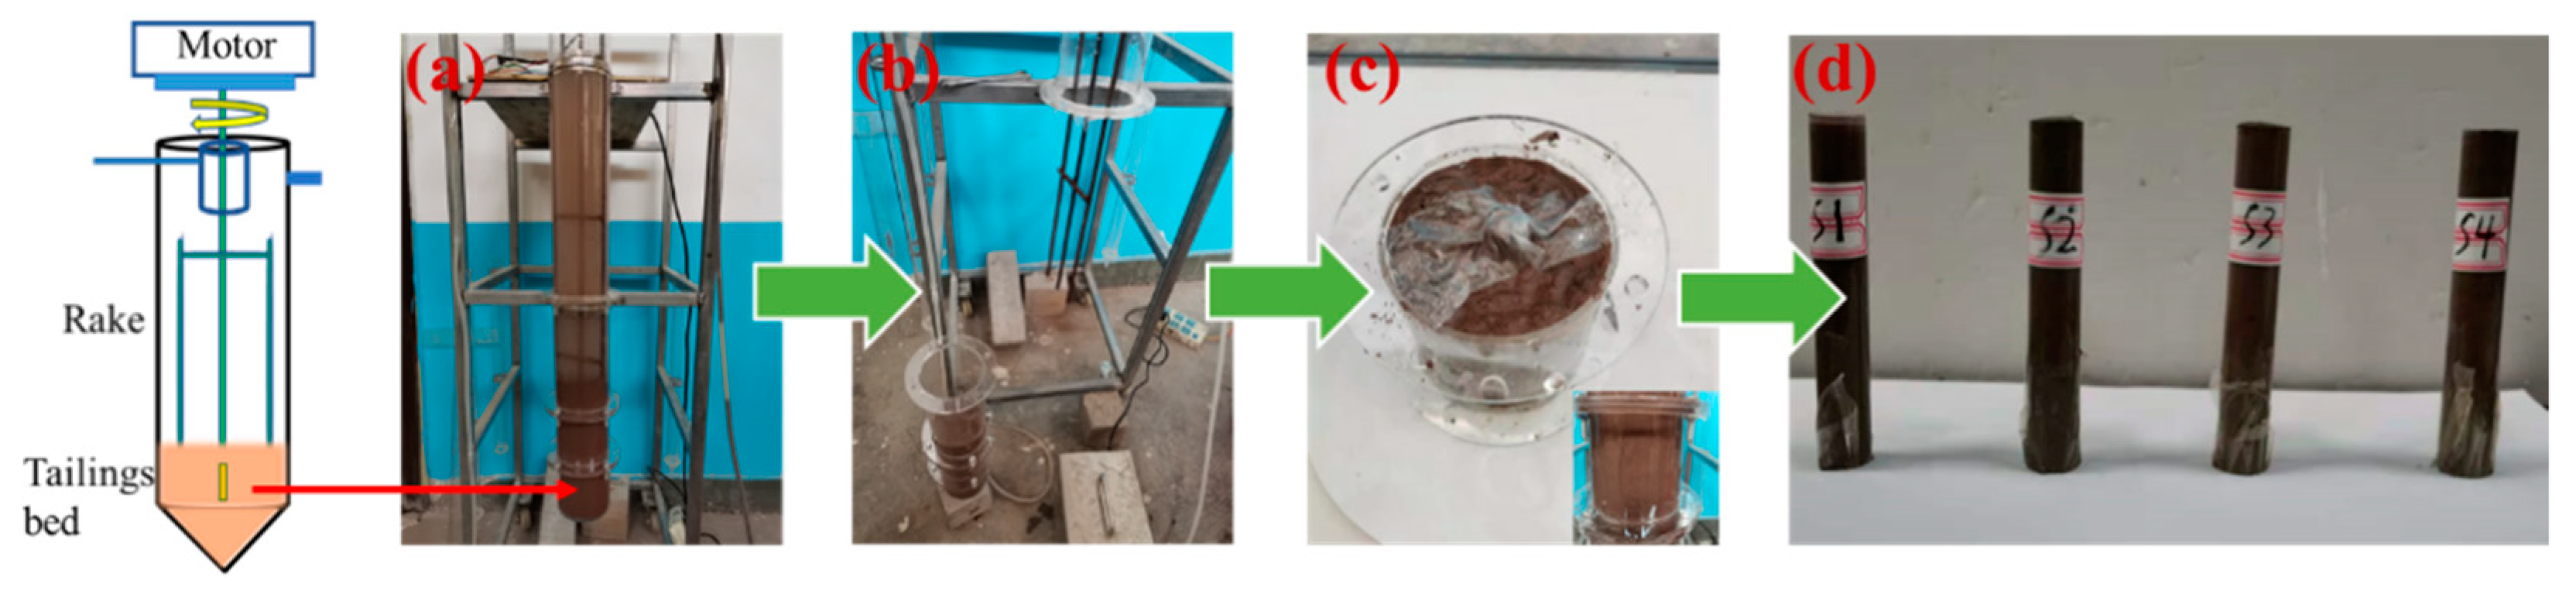
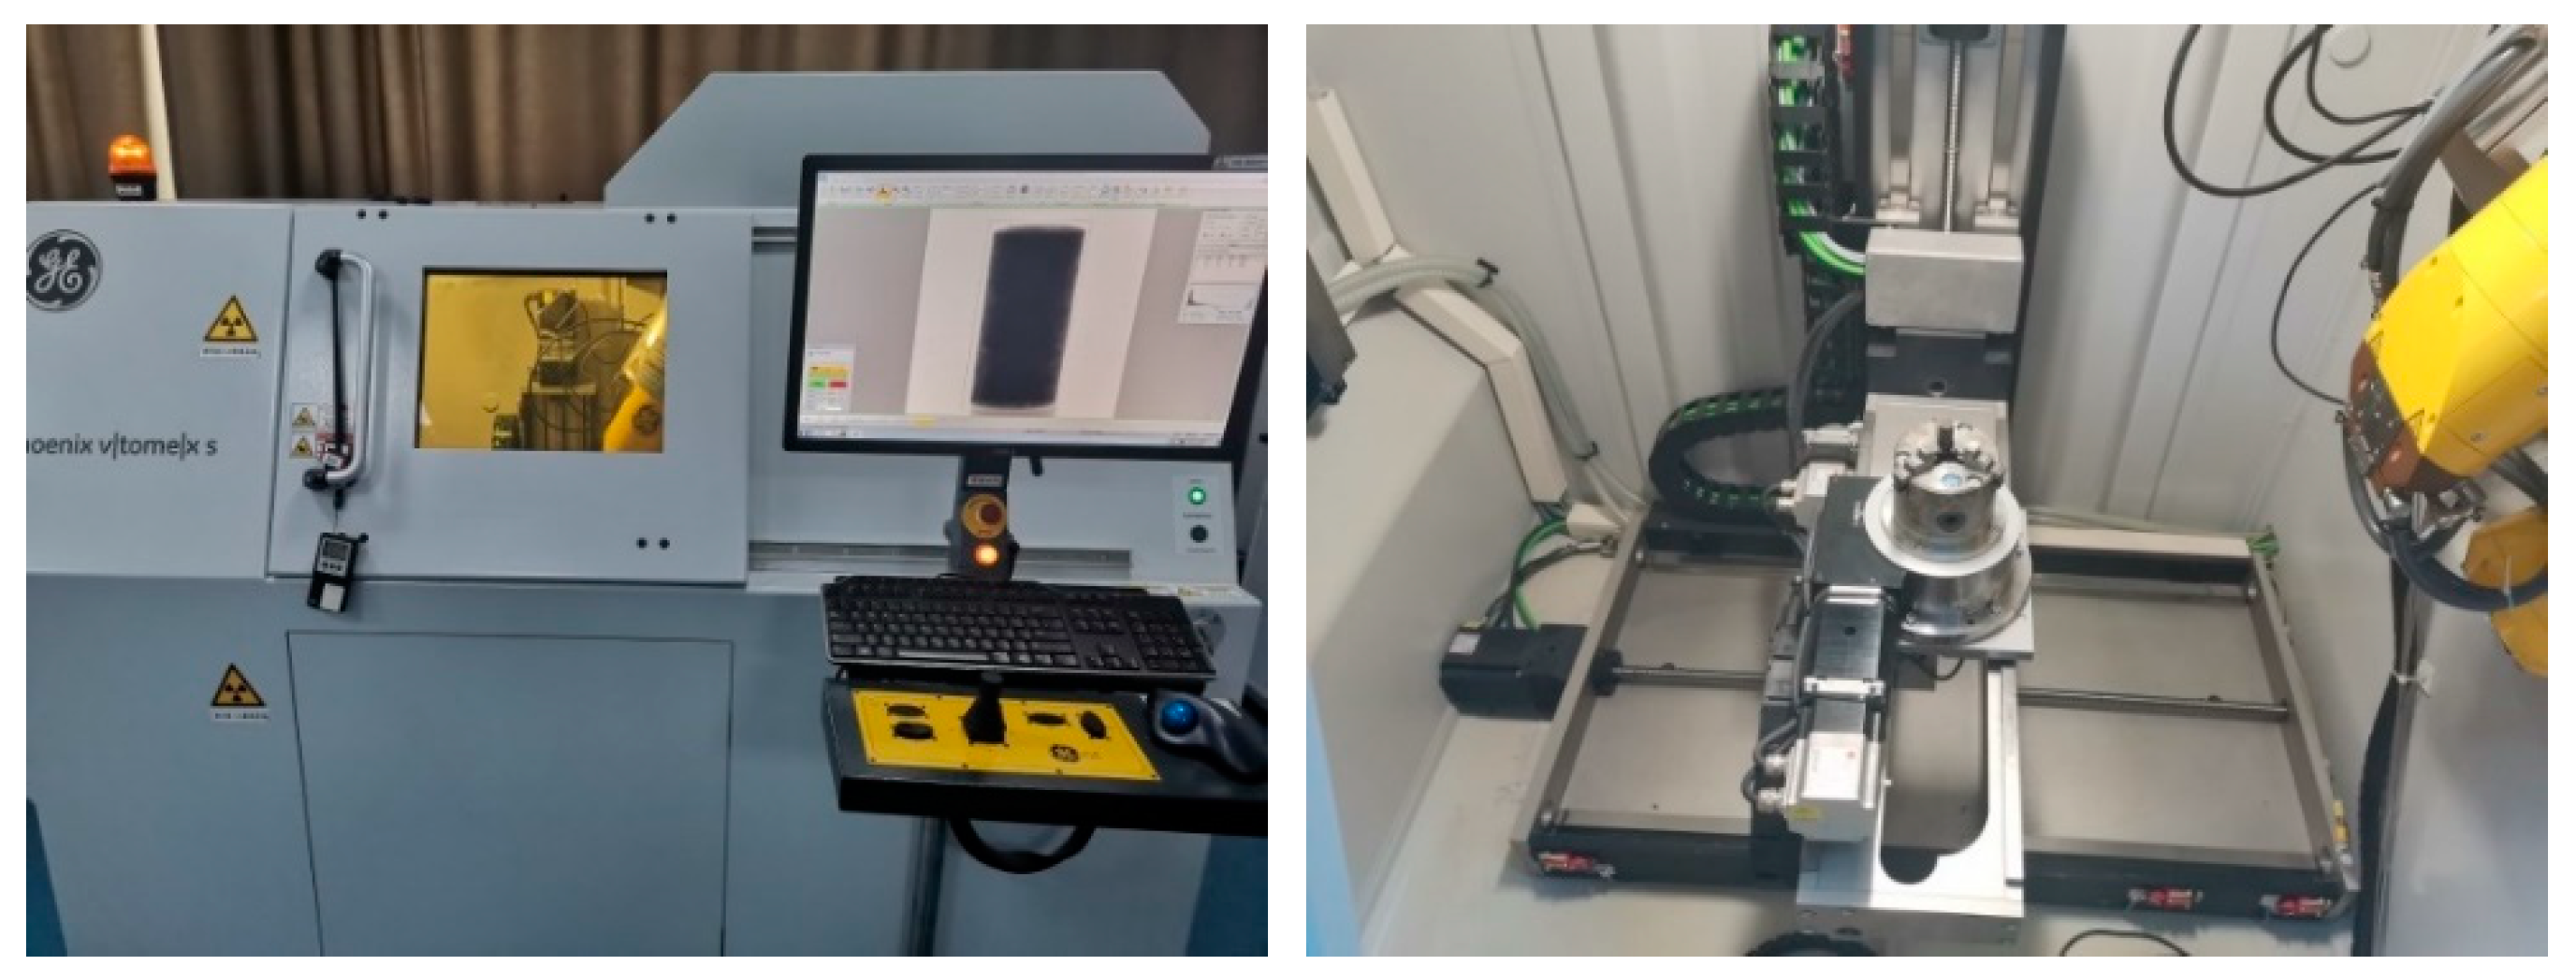
2.2. Methods
3. Results and Discussion
3.1. Spatial Topological Structure of Pores in the Thickening Process
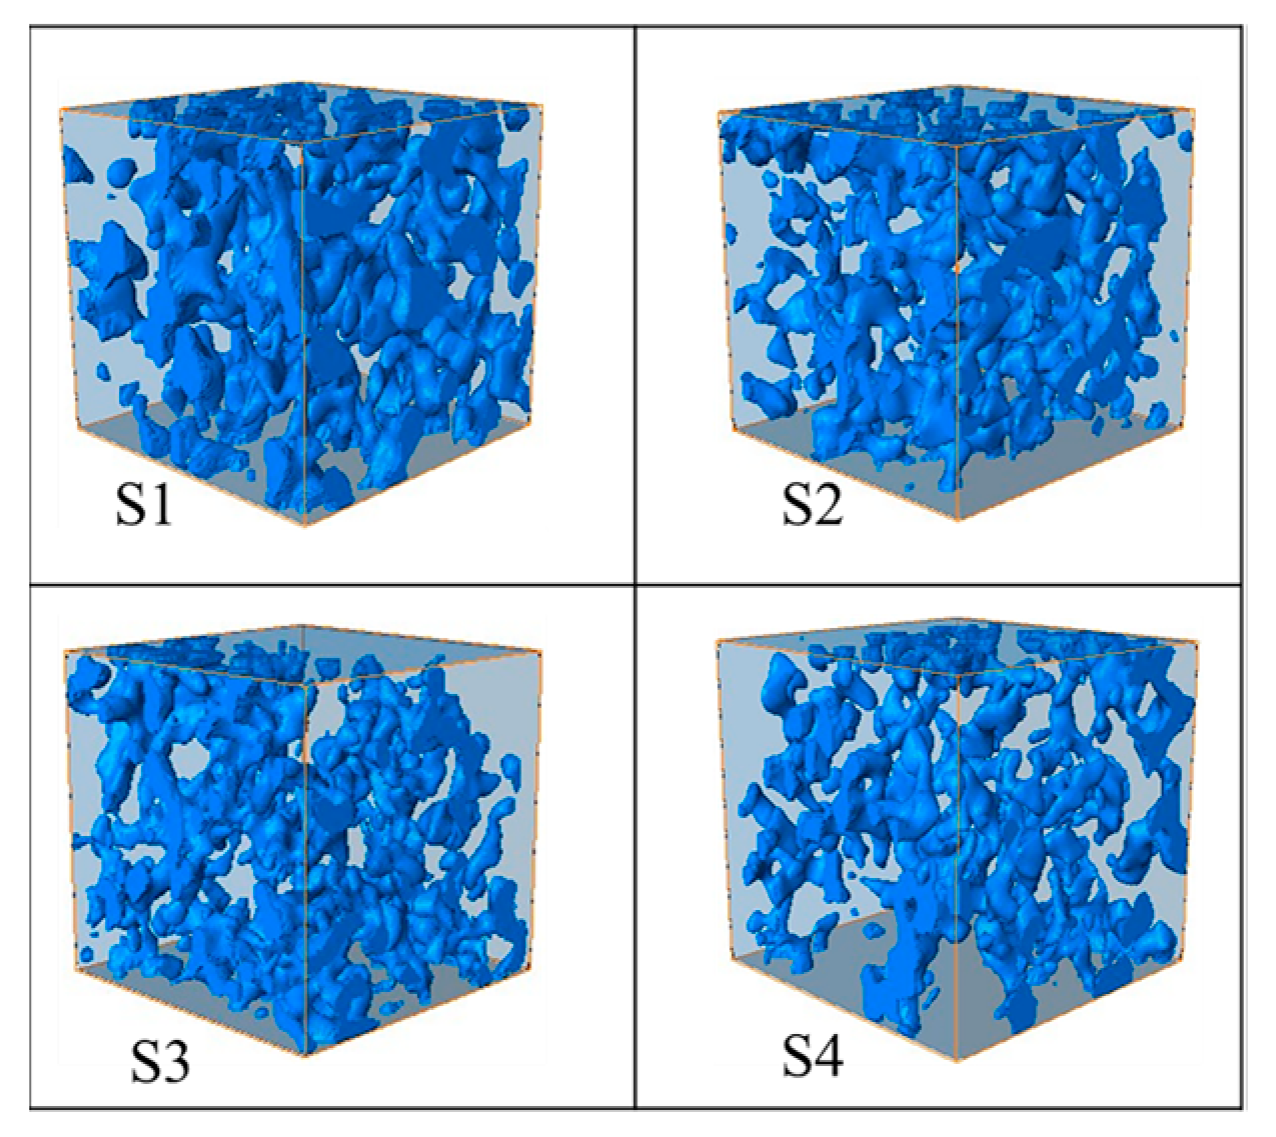
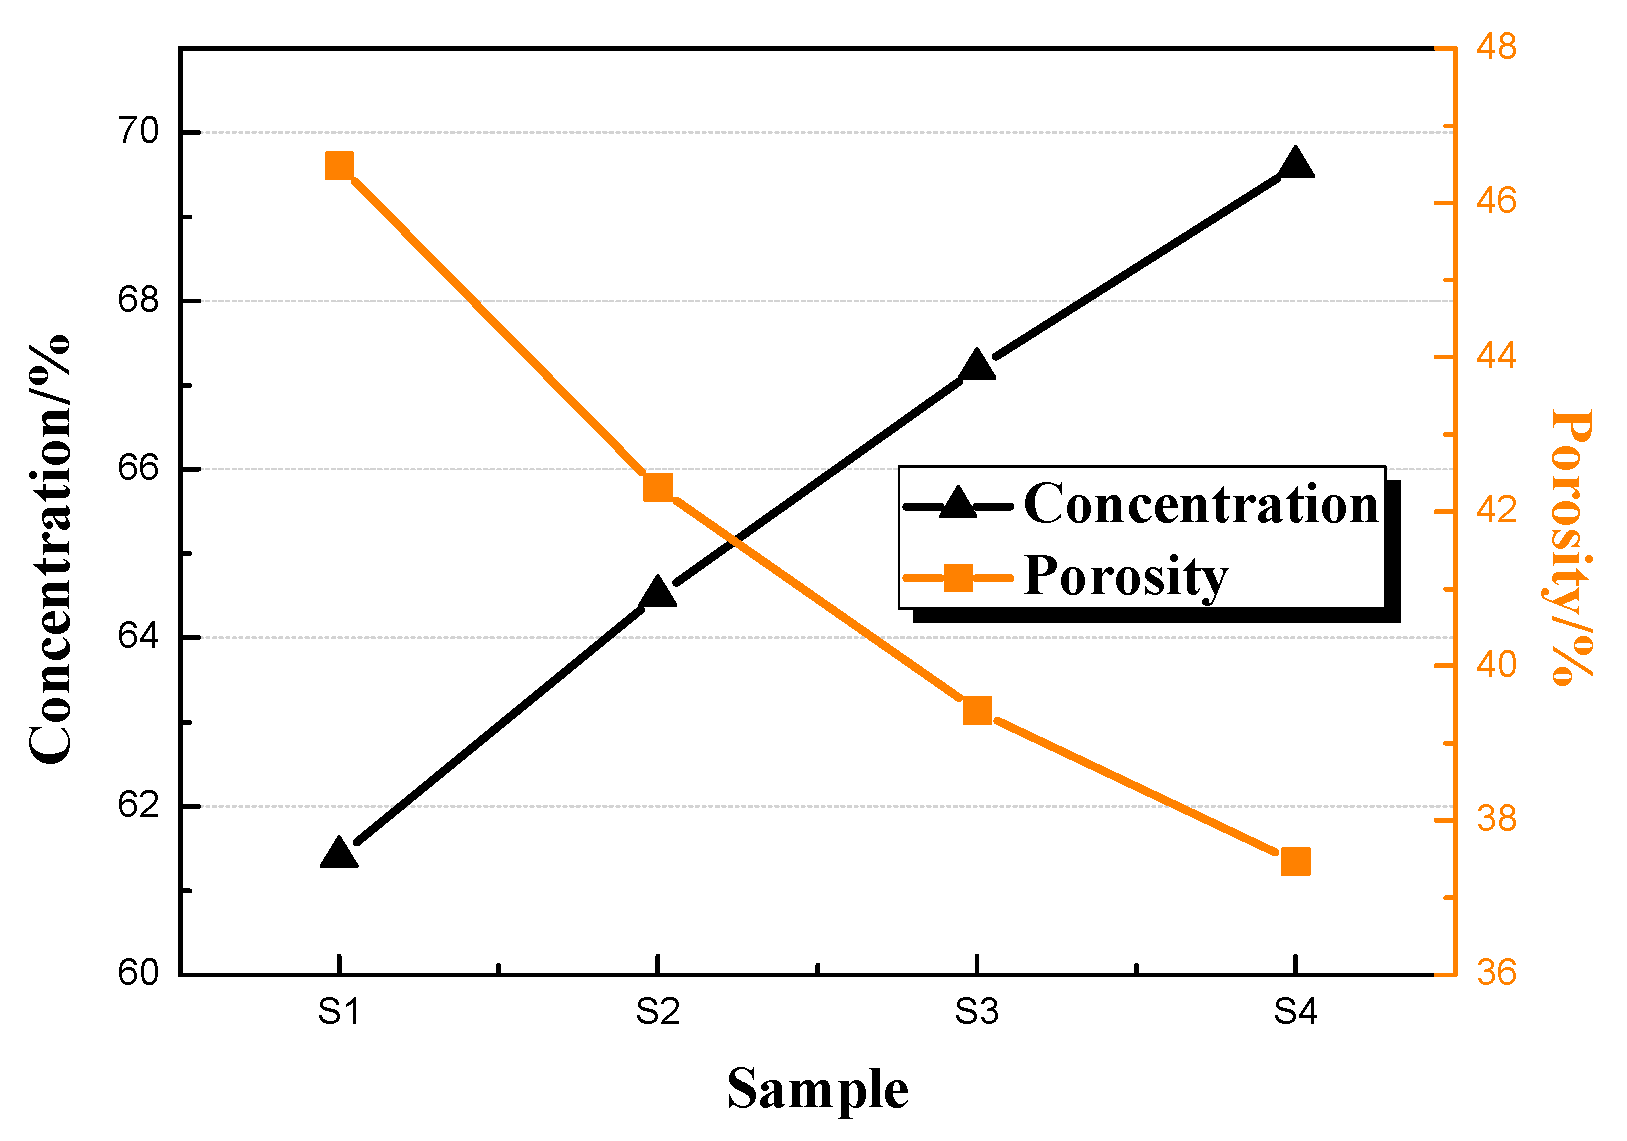
3.1.1. Porosity
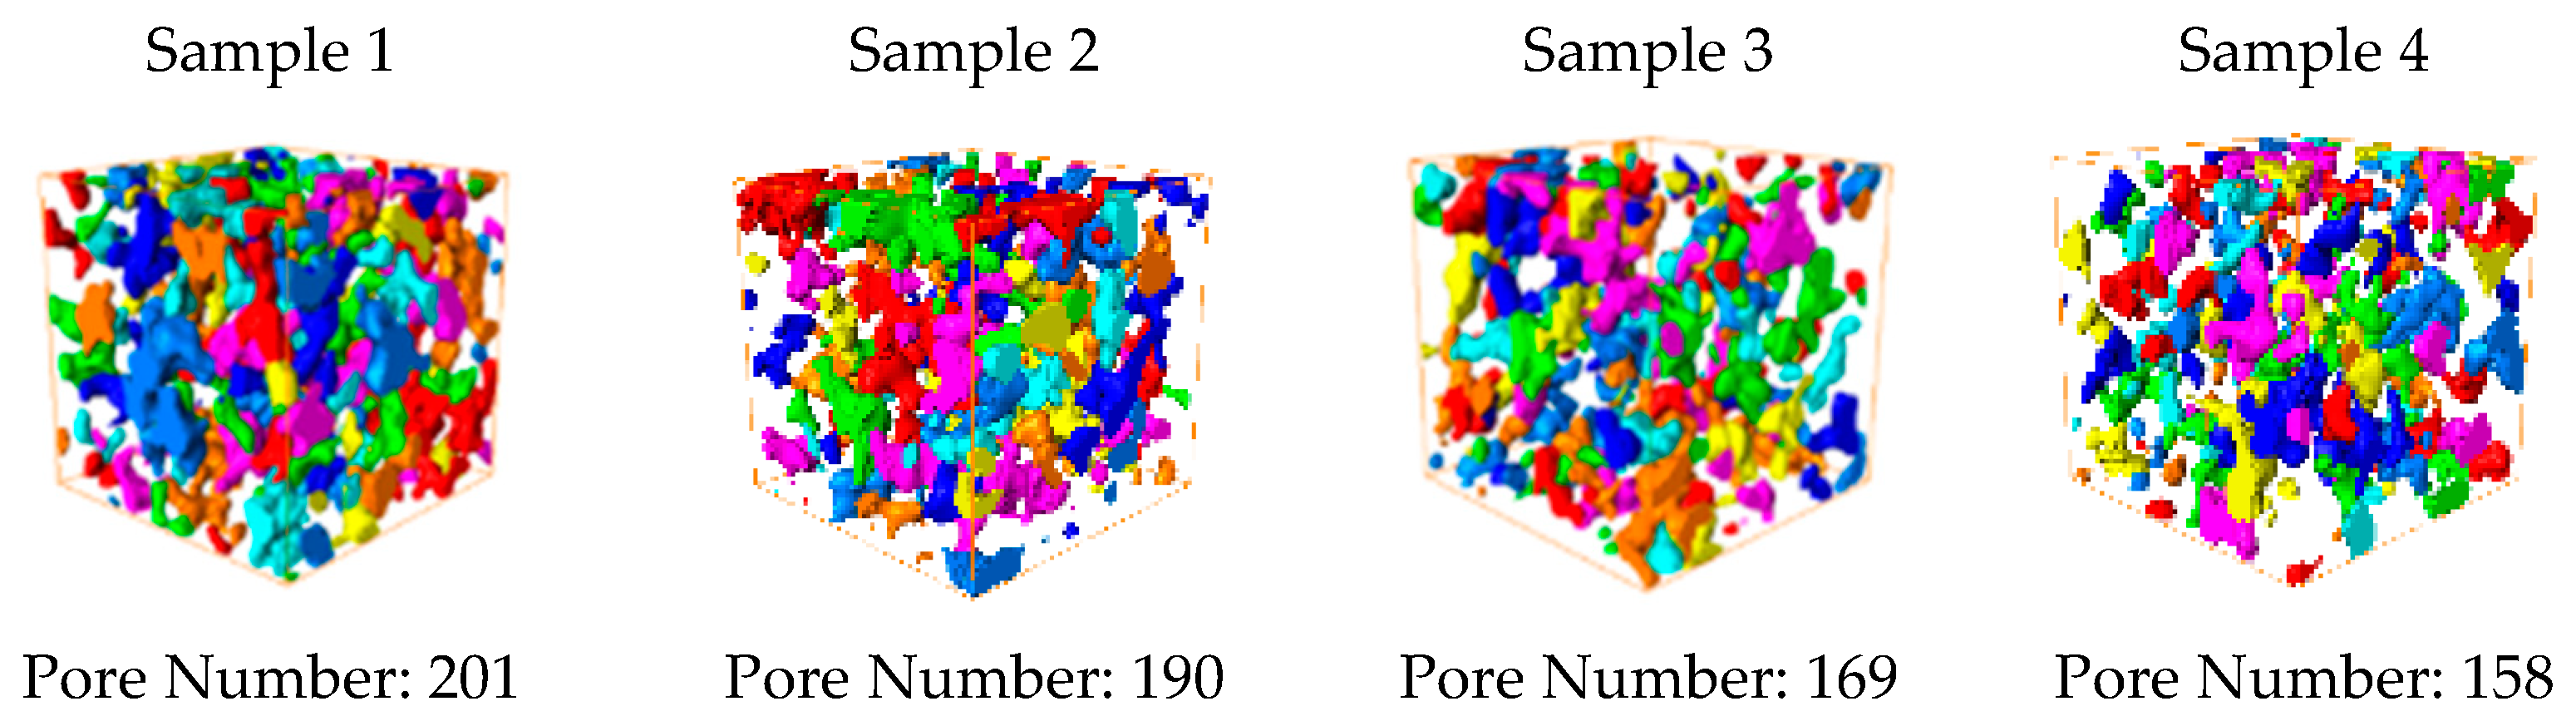
3.1.2. Pore distribution
3.2. Property Analysis of PNMs
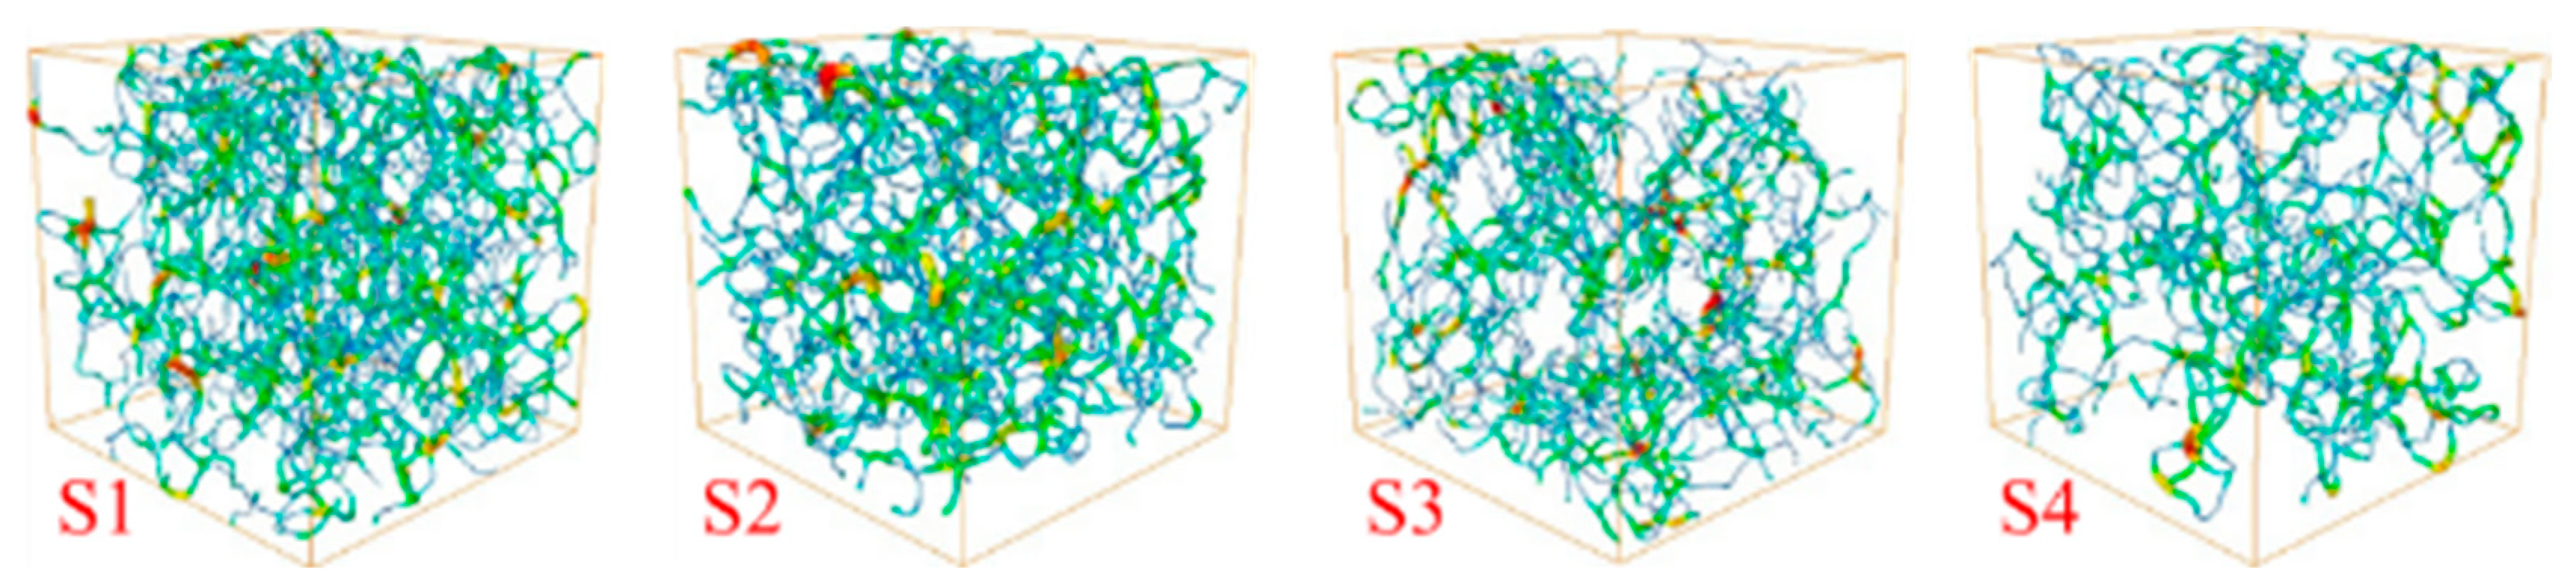
3.3. Formation and Distribution of Water-Conducting Channels in the Thickening Process
4. Conclusions
- (1)
- The porosity of S1 without shear action was the maximum (46.48%) and it declined to 37.46% by 19.21% after the shear action was completed. The substantial drop of porosity mainly occurred from Stage II to Stage III. The moisture was drained upward along the channels formed in this stage. The tailings filled the pores downward and the underflow concentration was increased. The tailing flocs were displaced under the original circumstance of loose arrangement because of the shear action and then rearranged under the actions of gravity and mud layer pressure. The flocs were deformed and compacted to form a high-concentration underflow. The original macropores were extruded, deformed and segmented to form many micropores. Thus, the number of pores increased and the total porosity was reduced, accompanied by the runoff of overflow water.
- (2)
- In the corresponding PNMs, the balls in Stage I were large, whereas the sticks were small. The moisture was mainly stored in the former and water-conducting channels were formed in Stage II. The average coordination number of S2 was the maximum; with the best connectivity, the average stick radius was the maximum and many water-conducting channels were formed in Stage II. The shear force changed the network structure of flocs. Under the external shear force, large balls could easily evolve into several small balls to form isolated pores. In this case, the balls mainly stored water, whereas the sticks exerted the water-conducting effect. This finding indicates that under the shear action, the pores became loose, with poor connectivity and declining porosity.
- (3)
- In the seepage pore skeleton extraction model, the tortuosity of S2 declined by 0.75% compared with that of S1 under the non-shear state. The channel buckling degree of S2 was small and the average diameter of the channels at this moment was the maximum relative to the other three samples. The simulated flow lines of the seepage path in the thickening process showed that from Stage I to Stage II, the flow lines were densely distributed and concentrated at the upper-middle part of the sample. Moreover, few thin and short flow lines existed, manifesting a good seepage effect. The maximum flow velocity inside the pores was 1.537 μm/s, which was 5.49% higher than that under the nonshear state, mainly because the radius of the connected pores was enlarged by the bottom-up agglomeration of the wrapped macropore structures.
Author Contributions
Funding
Institutional Review Board Statement
Informed Consent Statement
Data Availability Statement
Conflicts of Interest
References
- Xiao, W.; Chen, W.Q.; Deng, X.Y. Coupling and coordination of coal mining intensity and social-ecological resilience in China. Ecol. Indic. 2021, 131, 108167. [Google Scholar] [CrossRef]
- Ma, Q.; Wu, J.G.; He, C.Y.; Fang, X.N. The speed, scale, and environmental and economic impacts of surface coal mining in the Mongolian Plateau. Resour. Conserv. Recycl. 2021, 173, 105730. [Google Scholar] [CrossRef]
- Worlanyo, A.S.; Li, J.F. Evaluating the environmental and economic impact of mining for post-mined land restoration and land-use: A review. J. Environ. Manag. 2020, 279, 111623. [Google Scholar] [CrossRef] [PubMed]
- Xi, Z.; Tang, S.; Wang, J. Pore structure and fractal characteristics of Niutitang shale from China. Minerals 2018, 8, 163. [Google Scholar] [CrossRef] [Green Version]
- Dong, L.J.; Tong, X.J.; Li, X.B. Some developments and new insights of environmental problems and deep mining strategy for cleaner production in mines. J. Clean. Prod. 2019, 210, 1562–1578. [Google Scholar] [CrossRef]
- Yari, M.; Bagherpour, R. Investigating an innovative model for dimensional sedimentary rocks characterization using acoustic frequencies analysis during drilling. Rud.-Geološko Naft. Zb. 2018, 33, 17–25. [Google Scholar] [CrossRef] [Green Version]
- Hu, Z.; Lu, S.; Klaver, J. An Integrated Imaging Study of the Pore Structure of the Cobourg Limestone—A Potential Nuclear Waste Host Rock in Canada. Minerals 2021, 11, 1042. [Google Scholar] [CrossRef]
- Qi, C.C.; Andy, F. Cemented paste backfill for mineral tailings management: Review and future perspectives. Miner. Eng. 2019, 144, 106025. [Google Scholar] [CrossRef]
- Yin, S.H.; Shao, Y.J.; Wu, A.X.; Wang, H.J.; Liu, X.H.; Wang, Y. A systematic review of paste technology in metal mines for cleaner production in China. J. Clean. Prod. 2020, 247, 126855. [Google Scholar] [CrossRef]
- Mamghaderi, H.; Aghababaei, S.; Gharabaghi, M.; Noaparast, M.; Albijanic, B.; Rezaei, A. Investigation on the effects of chemical pretreatment on the iron ore tailing dewatering. Colloids Surf. A 2021, 625, 126855. [Google Scholar] [CrossRef]
- Jiao, H.Z.; Wu, Y.C.; Wang, H.; Chen, X.M.; Li, Z.; Wang, Y.F.; Zhang, B.Y.; Liu, J.H. Micro-scale mechanism of sealed water seepage and thickening from tailings bed in rake shearing thickener. Miner. Eng. 2021, 173, 107043. [Google Scholar] [CrossRef]
- Toprak, N.A.; Altun, O. Considering hydrocyclone operation for tailings dewatering purpose and its effects on product specifications of paste backfill operations. Miner. Eng. 2021, 173, 107176. [Google Scholar] [CrossRef]
- Leidiane, G.R.; Roberta, S.O.; Thiago, N.P.; Luciana, S.S.; Elizabete, F.L.; Diógenes, R.L.; Elliott, A.; João, B.P. Using acrylamide/propylene oxide copolymers to dewater and densify mature fine tailings. Miner. Eng. 2016, 95, 29–39. [Google Scholar] [CrossRef]
- Krishna, R.S.; Quezada, G.R.; Sahu, J.K.; Sadangi, J.K. Rheological characterization and performance of flocculants in iron ore tailings management. Mater. Today Proc. 2021, 43, 2888–2894. [Google Scholar] [CrossRef]
- Zhu, Y.L.; Chae, M.; Wang, J.; Adhikari, B.; Mussone, P.; Bressler, D.C. Biowaste-based biodegradable flocculants for clean and sustainable tailings management in industrial mining and mineral processing. J. Clean. Prod. 2021, 323, 129195. [Google Scholar] [CrossRef]
- Yang, Y.; Wu, A.X.; Bern, K.; Wang, H.J. Effect of primary flocculant type on a two-step flocculation process on iron ore fine tailings under alkaline environment. Miner. Eng. 2019, 132, 14–21. [Google Scholar] [CrossRef]
- Rostami, N.Z.; Soares, J.B. Flocculation and dewatering of oil sands tailings with a novel functionalized polyolefin flocculant. Sep. Purif. Technol. 2021, 274, 119018. [Google Scholar] [CrossRef]
- Chen, Q.; Tao, Y.; Zhang, Q.; Qi, C. The rheological, mechanical and heavy metal leaching properties of cemented paste backfill under the influence of anionic polyacrylamide. Chemosphere 2022, 286, 131630. [Google Scholar] [CrossRef] [PubMed]
- Zhang, Q.; Li, Y.; Chen, Q. Effects of temperatures and pH values on rheological properties of cemented paste backfill. J. Cent. South Univ. 2021, 28, 1707–1723. [Google Scholar] [CrossRef]
- Ravi, N.; Farid, V.G.; Sean, S.R. Effect of shear on the yield stress and aggregate structure of flocculant-dosed, concentrated kaolinite suspensions. Miner. Eng. 2018, 123, 95–103. [Google Scholar] [CrossRef]
- Spehar, R.; Kiviti, M.A.; Fawell, P. Aggregate densification in the thickening of flocculated suspensions in an un-networked bed. Chem. Eng. Sci. 2015, 122, 585–595. [Google Scholar] [CrossRef]
- Li, S.; Wang, X.M.; Zhang, Q.L. Dynamic experiments on flocculation and sedimentation of argillized ultrafine tailings using fly-ash-based magnetic coagulant. Trans. Nonferr. Met. Soc. China 2016, 26, 1975–1984. [Google Scholar] [CrossRef]
- Xu, W.; Cao, P.; Tian, M. Strength Development and Microstructure Evolution of Cemented Tailings Backfill Containing Different Binder Types and Contents. Minerals 2018, 8, 167. [Google Scholar] [CrossRef] [Green Version]
- Deng, H.W.; Liu, Y.; Zhang, W.Y.; Yu, S.T.; Tian, G.L. Study on the Strength Evolution Characteristics of Cemented Tailings Backfill from the Perspective of Porosity. Minerals 2021, 11, 82. [Google Scholar] [CrossRef]
- Deng, H.W.; Duan, T.L.; Tian, G.L.; Liu, Y.; Zhang, W.Y. Research on Strength Prediction Model and Microscopic Analysis of Mechanical Characteristics of Cemented Tailings Backfill under Fractal Theory. Minerals 2021, 11, 886. [Google Scholar] [CrossRef]
- Salam, A.M.; Rmeci, B.; Simms, P.H. Determination of optimum polymer dosage for dewatering of oil sands tailings using torque rheology. J. Pet. Sci. Eng. 2020, 197, 107986. [Google Scholar] [CrossRef]
- Jiao, H.Z.; Chen, W.L.; Wu, A.X.; Yu, Y.; Ruan, Z.; Honaker, R.; Chen, X.; Yu, J. Flocculated unclassified tailings settling efficiency improvement by particle collision optimization in the feedwell. Int. J. Miner. Metall. Mater. 2021, 29. [Google Scholar] [CrossRef]
- Shriful, I.; David, J.W.; Marcelo, L.S.; Zhang, C.M. Settling, consolidation and shear strength behaviour of coal tailings slurry. Int. J. Min. Sci. Technol. 2020, 30, 849–857. [Google Scholar] [CrossRef]
- Rozalina, S.; Dimitrova, E.K. Factors affecting the shear strength of mine tailings/clay mixtures with varying clay content and clay mineralogy. Eng. Geol. 2012, 125, 11–25. [Google Scholar] [CrossRef]
- Yin, G.Z.; Zhang, Q.G.; Wang, W.S.; Chen, Y.L.; Geng, W.L.; Liu, H.R. Experimental study on the mechanism effect of seepage on microstructure of tailings. Saf. Sci. 2012, 50, 792–796. [Google Scholar] [CrossRef]
- Tian, J.; Ni, L.; Song, T.; Olson, J.; Zhao, J. An overview of operating parameters and conditions in hydrocyclones for enhanced separations. Sep. Purif. Technol. 2018, 206, 268–285. [Google Scholar] [CrossRef]
- Zhai, D.; Feng, B.; Guo, Y.T.; Zhou, X.T.; Wang, T.; Wang, H.H. Settling behavior of tungsten tailings using serpentine as flocculant. Sep. Purif. Technol. 2019, 224, 304–307. [Google Scholar] [CrossRef]
- Chen, F.B.; Xu, B.; Jiao, H.Z.; Chen, X.M.; Shi, Y.L.; Wang, J.X.; Li, Z. Triaxial mechanical properties and microstructure visualization of BFRC. Constr. Build. Mater. 2021, 278, 122275. [Google Scholar] [CrossRef]
- Jiao, H.; Wang, S.; Wu, A.; Shen, H.; Wang, J. Cementitious property of NaAlO2-activated Ge slag as cement supplement. Int. J. Miner. Metall. Mater. 2019, 26, 1594–1603. [Google Scholar] [CrossRef]
- Li, X.; Yang, S.; Wang, Y.; Nie, W.; Liu, Z. Macro-micro response characteristics of surrounding rock and overlying strata towards the transition from open-pit to underground mining. Geofluids 2021, 2021, 5582218. [Google Scholar] [CrossRef]
- Jiao, H.Z.; Wang, S.F.; Yang, Y.X.; Chen, X.M. Water recovery improvement by shearing of gravity-thickened tailings for cemented paste backfill. J. Clean. Prod. 2020, 245, 118882. [Google Scholar] [CrossRef]
- Dwari, R.K.; Angadi, S.I.; Tripathy, S.K. Studies on flocculation characteristics of chromite’s ore process tailing: Effect of flocculants ionicity and molecular mass. Colloids Surf. A 2018, 537, 467–477. [Google Scholar] [CrossRef]
- Bruna, C.T.; Sílvia, C.A. Performances of two flocculants and their mixtures for red mud dewatering and disposal based on mineral paste production. J. Clean. Prod. 2020, 257, 120534. [Google Scholar] [CrossRef]
- Pavičić, I.; Briševac, Z.; Vrbaški, A. Geometric and fractal characterization of pore systems in the Upper Triassic dolomites based on image processing techniques (example from Žumberak Mts, NW Croatia). Sustainability 2021, 13, 7668. [Google Scholar] [CrossRef]
- Wang, H.W.; Chao, L.; Wei, X.F.; Li, J.L.; Ji, C.; Wang, B.Z.; Qi, X.W.; Hu, P.C.; Ying, Y.F.; Tian, M.Q. Design of SiO2-TiO2-PAM composite flocculant with self-degrading characteristics and optimization of the flocculation process using a combination of central composite design and response surface methodology. Colloids Surf. A 2019, 583, 123982. [Google Scholar] [CrossRef]
- Cao, S.; Yilmaz, E.; Yin, Z.Y.; Xue, G.L.; Song, W.D.; Sun, L.J. CT scanning of internal crack mechanism and strength behavior of cement-fiber-tailings matrix composites. Cem. Concr. Compos. 2021, 116, 103865. [Google Scholar] [CrossRef]
- Shi, X.H.; Pan, J.N.; Pang, L.L. 3D microfracture network and seepage characteristics of low-volatility bituminous coal based on nano-CT. J. Nat. Gas Sci. Eng. 2020, 83, 103556. [Google Scholar] [CrossRef]
- Wei, C.; Derek, B.A.; Zhang, Y.H. Shear behavior of ultrafine magnetite tailings subjected to freeze-thaw cycles. Int. J. Min. Sci. Technol. 2019, 29, 608–615. [Google Scholar] [CrossRef]


| Material | Proportion | Loose Bulk Density (t·m−3) | Specific Surface Area (m2) | Dense Bulk Density (t·m−3) | Porosity (%) | Natural Repose Angle (°) |
|---|---|---|---|---|---|---|
| Tailings | 2.992 | 1.392 | 300–500 | 1.955 | 34.66 | 42.997 |
| Factors | Unit | 1 | 2 | 3 |
|---|---|---|---|---|
| solid flux | th−1 m−2 | 0.1 | 0.2 | 0.3 |
| stirring rate | Rpm | 0 | 0.1 | 0.2 |
| feeding concentration | % | 5 | 10 | 15 |
| bed height | cm | 10 | 20 | 30 |
| Parameters | S1 | S2 | S3 | S4 | |
|---|---|---|---|---|---|
| Model size/mm | 2 × 2 × 2 | ||||
| Shearing time/min | 0 | 10 | 30 | 60 | |
| Model porosity | 0.363 | 0.334 | 0.253 | 0.191 | |
| Number of spheres | 1328 | 1227 | 1094 | 202 | |
| Number of throats | 523 | 480 | 364 | 343 | |
| Ball radius /μm | Minimum | 0.83 | 0.76 | 0.51 | 0.29 |
| Maximum | 118.59 | 114.73 | 105.83 | 94.61 | |
| Average | 76.81 | 73.16 | 68.54 | 66.25 | |
| Throat radius /μm | Minimum | 0.92 | 0.90 | 0.55 | 0.24 |
| Maximum | 94.72 | 87.59 | 86.48 | 83.71 | |
| Average | 28.63 | 31.38 | 25.07 | 20.81 | |
| Pore throat coordination number | Minimum | 2 | 1 | 1 | 1 |
| Maximum | 34 | 34 | 31 | 24 | |
| Average | 10.82 | 11.06 | 9.15 | 7.38 | |
| Hole throat radius ratio μm/μm | Minimum | 1 | 1 | 1 | 1 |
| Maximum | 23.15 | 2.92 | 3.68 | 3.75 | |
| Average | 2.68 | 2.33 | 2.73 | 3.18 | |
| Pore shape factor | Minimum | 0.0078 | 0.0076 | 0.0065 | 0.0058 |
| Maximum | 0.054 | 0.063 | 0.057 | 0.044 | |
| Average | 0.028 | 0.027 | 0.025 | 0.023 | |
| Throat shape factor | Minimum | 0.0041 | 0.0036 | 0.0021 | 0.0019 |
| Maximum | 0.06 | 006 | 0.05 | 0.05 | |
| Average | 0.032 | 0.029 | 0.023 | 0.021 | |
| Parameters | S1 | S2 | S3 | S4 |
|---|---|---|---|---|
| Number of channel nodes | 438 | 459 | 357 | 322 |
| Channel volume fraction % | 32.26 | 28.35 | 18.49 | 13.16 |
| Channel tortuosity μm/μm | 1.813 | 1.677 | 1.984 | 2.240 |
| Average channel diameter μm | 45.73 | 51.34 | 40.18 | 31.56 |
Publisher’s Note: MDPI stays neutral with regard to jurisdictional claims in published maps and institutional affiliations. |
© 2022 by the authors. Licensee MDPI, Basel, Switzerland. This article is an open access article distributed under the terms and conditions of the Creative Commons Attribution (CC BY) license (https://creativecommons.org/licenses/by/4.0/).
Share and Cite
Jiao, H.; Zhang, W.; Yang, Y.; Yang, L.; Hu, K.; Yu, J. Pore Structure Evolution and Seepage Characteristics in Unclassified Tailing Thickening Process. Minerals 2022, 12, 164. https://doi.org/10.3390/min12020164
Jiao H, Zhang W, Yang Y, Yang L, Hu K, Yu J. Pore Structure Evolution and Seepage Characteristics in Unclassified Tailing Thickening Process. Minerals. 2022; 12(2):164. https://doi.org/10.3390/min12020164
Chicago/Turabian StyleJiao, Huazhe, Wenxiang Zhang, Yixuan Yang, Liuhua Yang, Kaijian Hu, and Jianxin Yu. 2022. "Pore Structure Evolution and Seepage Characteristics in Unclassified Tailing Thickening Process" Minerals 12, no. 2: 164. https://doi.org/10.3390/min12020164