Article

The Potential Health Costs of PM10 Impacts on a Gold Mine Village, during Company Liquidation: An Analysis of 2013–2017

1
Department of Mining Engineering and Mine Surveying, University of Johannesburg, Doornfontein 2028, South Africa
2
School of Geography, Archaeology and Environmental Studies, University of the Witwatersrand, Braamfontein 2050, South Africa
*
Author to whom correspondence should be addressed.
Minerals 2022, 12(2), 169; https://doi.org/10.3390/min12020169
Submission received: 11 November 2021 / Revised: 6 January 2022 / Accepted: 12 January 2022 / Published: 28 January 2022

Abstract

:
Windblown dust from tailings storage facilities (TSFs), particularly in towns with liquidated mining companies, exacerbate air pollution. Companies of suddenly closed mine operations evade the responsibility of environmental and socio-economic care required by law. It is common for suddenly closed mines to have poorly rehabilitated TSFs which become a significant source of pollution by dust for the surrounding communities. There is strong evidence that acute exposure to high levels of air pollutants causes significant mortality and morbidity. However, very few studies have estimated the externalities of PM10 emanating from gold TSFs especially when a mine closes suddenly owing to company liquidation. By exploring the externalities of PM10 arising from wind erosion of suspended particulate matter from TSFs, this study fills an existing gap in the literature. A ‘bottom-up’ approach was implemented in this study following the External Energy (ExternE) project, and a gold mine operation that was liquidated between 2013 and 2017, was used as the case study. In this study, the externality of PM10 estimated was the cost of illness focusing specifically on respiratory-related illnesses. The results showed that the estimated cost of illness associated with PM10 inhalation was a total of R 5,560,022 including assessments of both neighboring Wedela and the Gold mine village based on the threshold concentration set by the South African National Ambient Air Quality Standards (NAAQS) guideline and R 66,092,760 when considering the Fund for Research into Industrial Development Growth Equity (FRIDGE), Airshed and Infotox. Thus, it was concluded that air pollution by windblown dust from partially rehabilitated TSFs has the potential to significantly affect surrounding mining communities’ socio-economic status through poor health and the costs thereof.

1. Introduction

Gold mining in South Africa established other mining sectors in the country. Since 1886, gold mining has contributed significantly to employment and the general economic development of the country [1]. Studies have shown that gold extraction and processing can significantly degrade the natural environment and, with that has the potential to negatively affect human health [2]. Gold production, although a key to the mining sector in the country, has caused harm to a wide range of receptors such as negatively impacting surrounding communities, affecting natural ecosystems, and damaging building materials. Mine exploration, mining, transportation, and closure are all stages in the mining cycle where these impacts can arise. In each stage, there are externalities accompanying these impacts. An externality is defined as an uncompensated side effect of one agent’s action that directly affects the welfare of another agent [3]. When the social or economic activities of one group of persons have an impact on another group and when that impact is not fully accounted, or compensated for, by the first group an externality arises. Since the writings of Marshall in 1890 and Pigou in 1920, externalities have been regarded as a guiding principle for economists to use when analyzing pollution challenges for practical decision-making [3]. Market prices do not reflect externalities, so there is a difference between the social and private cost of producing gold. For this reason, internalizing externalities into private costs is necessary to “get the price right” and to create market-based incentives for environmentally friendly gold production. Toward this end, decision-makers should strive to internalize the external cost of an activity in the private production cost of a mine before it shuts down, using cost-benefit analysis. When dealing with challenges pertaining to mine closure effects, the literature has been biased toward investigating environmental aspects with a lack of consideration for socio-economic aspects, such as estimating the external costs mining impacts to society. The study of externalities is thus important to assist in filling the gap of quantifying the socio-economic impacts through estimating external costs of environmental degradation to surrounding communities.
In general, changes in ambient air pollution levels can be statistically correlated with observed changes in morbidity (illness) and mortality (death) in a population [4,5]. Based on regression analysis, coefficients are estimated that are multiplied by changes in ambient pollution concentrations and the exposed population.
The External Cost of Energy (ExternE) methodology has been used to assess externalities associated with electricity production from various fuels and technologies over the last three decades, including: Hohmeyer [6,7], Ottinger [8], Pearce et al. [9], Friedrich and Voss [10], Oak Ridge National Laboratory (ORNL) and Resources for the Future (RfF) [11], Kovacevic et al. [12], Fouquet et al. [13] and of course the ExternE project series (Commission of the European Communities (CEC), [14,15]. Most of these studies have been critically surveyed by the Office of Technology Assessment (OTA) [16], Lee [17], Stirling [18], Schleisner [19], Sundqvist [20,21], Sundqvist and Söderholm [22], Krewitt [23], Kim [24], Burtraw et al. [25] and others. Most of these studies only address the externalities generated by power plants, rather than tailings storage facilities (TSF). To fill this gap, this study analyzes the externalities of gold mine TSFs resulting from emissions of suspended particulate matter.
Gold extraction has been studied for its health effects, but little is known about its social and welfare effects on people in developing nations, especially when a mine operation is suddenly closed [26,27,28]. An analysis of public and private healthcare costs (both preventive and curative) related to exposure to gold-mining dust in this study seeks to fill this gap. This paper aims to assess the external cost of dust emanating from gold TSFs during the liquidation period of a mining company, where no rehabilitation of TSFs was undertaken.
This study aims to contribute to the current literature gap by focusing on quantifying the potential costs of inhaling dust from TSFs owing to a suddenly closed mine. The study also plans to recommend mitigation strategies for the prevention of negative impacts that result from unplanned mine closure and help sustain mineral benefits beyond the mine life. This article shows a detailed method and procedure of how to quantify the external cost of dust deposition after a mining operation has suddenly closed. This provides an estimate of the potential cost to the community owing to PM10 inhalation.

1.1. Wind Erosion of Tailings Storage Facilities Material (Wind-Blown Dust)

There are various sources of dust that result from mining, including ventilation shafts, drilling and blasting of overburden, loading and transport operations, processing and handling waste disposal, and wind erosion of exposed areas and tailings storage facilities. This study focuses on the external costs of the wind-blown dust from various partially rehabilitated tailings storage facilities in and around a gold mine village.
Windblown dust from tailings storage facilities is known to pose several health, environment, and economic risks. Dust is sometimes simply a nuisance and deteriorates the surrounding environment for communities. The particle size and composition of dust determine the extent and severity of these effects. Dust composition can have an impact upon soil chemistry, the health of plants nearby, and building materials [29,30,31]. Furthermore, dust can cause diseases, such as silicosis, asbestosis, pneumoconiosis, cancer, and asthma, depending on its chemical content [32].
In the Witwatersrand Basin where this study is conducted, gold mining is known to release toxic chemicals such as mercury, uranium, cyanide, and arsenic into the surrounding environment, which can cause health issues for workers and residents [33,34,35,36,37]. In the West Witwatersrand Basin, sedimentary rocks contain gold-bearing conglomerates composed of quartz, uranite, chromite, pyrite, and rutile among other minor minerals [37,38,39,40]. Quartz occurrence in the dust from Witwatersrand gold tailings storage facilities has been indicated in several studies [38,39,40]. When quartz is inhaled from the dust, it has the potential to cause lung diseases by destroying lung tissue causing silicosis, tubersilicosis, bronchitis, and/or emphysema [41]. Fresh silica in the dust can be deposited in the lungs, can damage lung tissue, and can cause scarring. The diseases related to the inhalation of crystalline silica (quartz), may typically take over a decade of dust exposure to be detected in humans [42]. When lung disease has progressed far enough, it may be noticed due to common symptoms such as coughing, wheezing and shortness of breath. Naicker et al. [1] and the American Thoracic Society (ATS) [43] argue that the inhalation of mine dust containing silica poses health risks to populations living nearby (<500 m) TSFs. Furthermore, occupational morbidity associated with human exposure to radiation or use of contaminated water sources within a mine is a significant cause of noticeable mortality among miners. The decay of uranium to numerous gases found in TSFs provides a constant supply and source of radiation. Mining communities encroaching gold and uranium TSFs are exposed the most to radiation. Radiation is also known to affect fertility and post-natal viability [44].
Besides the chemical composition, dust particle size is also an important parameter to consider. The aerodynamic diameter of particles describes their size as the diameter of a hypothetical sphere with the same terminal velocity in calm air as the particle in question regardless of its geometric size, shape, or density [32]. It is especially important to consider particle size as it can have a significant impact on human health. The size of airborne particles determines where they are most likely to be deposited in the human respiratory tract [45]. Particles of smaller sizes are more likely to be hazardous to health.
Fine particles are more hazardous than coarse particles as larger size particles are less respirable and do not penetrate deep into the lungs. Depending on the size fraction, some dust particles enter the atmosphere in the short-term (i.e., particulate sizes between 20–70 µm) and others in the long-term (i.e., particulate sizes < 20 µm) [46]. There is evidence that short-term exposure to particulate matter, even at low concentrations, can cause negative health effects. Particulate matter exposure over long periods of time is linked to chronic effects, such as bronchitis, lung damage, and mortality [47]. Short-term exposure to PM10 has been well-documented as having adverse effects on respiratory health, cardiovascular morbidity, such as aggravation of asthma, and hospitalization. The presence of elevated ambient PM10 levels is associated with increased total mortality, cardiovascular mortality, and respiratory mortality as well as hospital admissions [48,49]. Furthermore, PM10 exposure in the long-term may result in mortality from cardiovascular and respiratory diseases and lung cancer [49]. PM10 is a type of dust with an aerodynamic diameter less than 10 µm that penetrates deep into the respiratory system and lung. The coarse portion can trigger high inflammation responses than the fine fraction. However, the fine fraction can evoke greater cytotoxicity [50]. PM10 is considered a useful indicator of the impact of various sources of outdoor air pollution on human health, and thus is assessed in this study. Epidemiological studies have shown that exposure to PM10 has negative health effects [51,52,53]. PM10 resulting from TSF in the Wits Basin contains silica and heavy metals which pose human health threats [54,55,56]. Previous studies confirm that tailings dust in the Witwatersrand region is associated with increased hospital admissions, emergency room visits, cardiovascular diseases, increased mortality, and respiratory ailments [10]. In earlier studies, the occurrence of heavy metals in small size fraction is also reported to be prevalent in the area [57]. In South Africa, StatisticsSA [58] estimates that 14,356 premature deaths in 2012 were due to acute lower respiratory illness (ALRI), COPD, lung cancer, ischemic heart disease, and IQ loss.

1.2. Particulate Matter and Ambient Air Quality Standards

In South Africa, to manage and monitor air quality, the then Department of Environment and Tourism promulgated the National Environmental Management Air Quality Act 39 of 2004 (NEMAQA). Standards such as the National Dust Control Regulation (NDCR) and National Ambient Air Quality Standard (NAAQS) accompany this act [59,60]. Currently, particulate air pollution standards and limits are based on two categories: PM10 and PM2.5. PM10 category involves larger particles less than 10 μm in size up to 2.5 μm. This fraction involves fine particles less than 2.5 microns and may be referred to as either primary (that is, directly emitted into the atmosphere) or secondary (created by chemical reactions in the atmosphere). The threshold values for PM10 are summarized in Table 1 as per NAAQS and according to the FRIDGE [61] study. The threshold values are assumed to be the concentration above which the impacts are estimated.

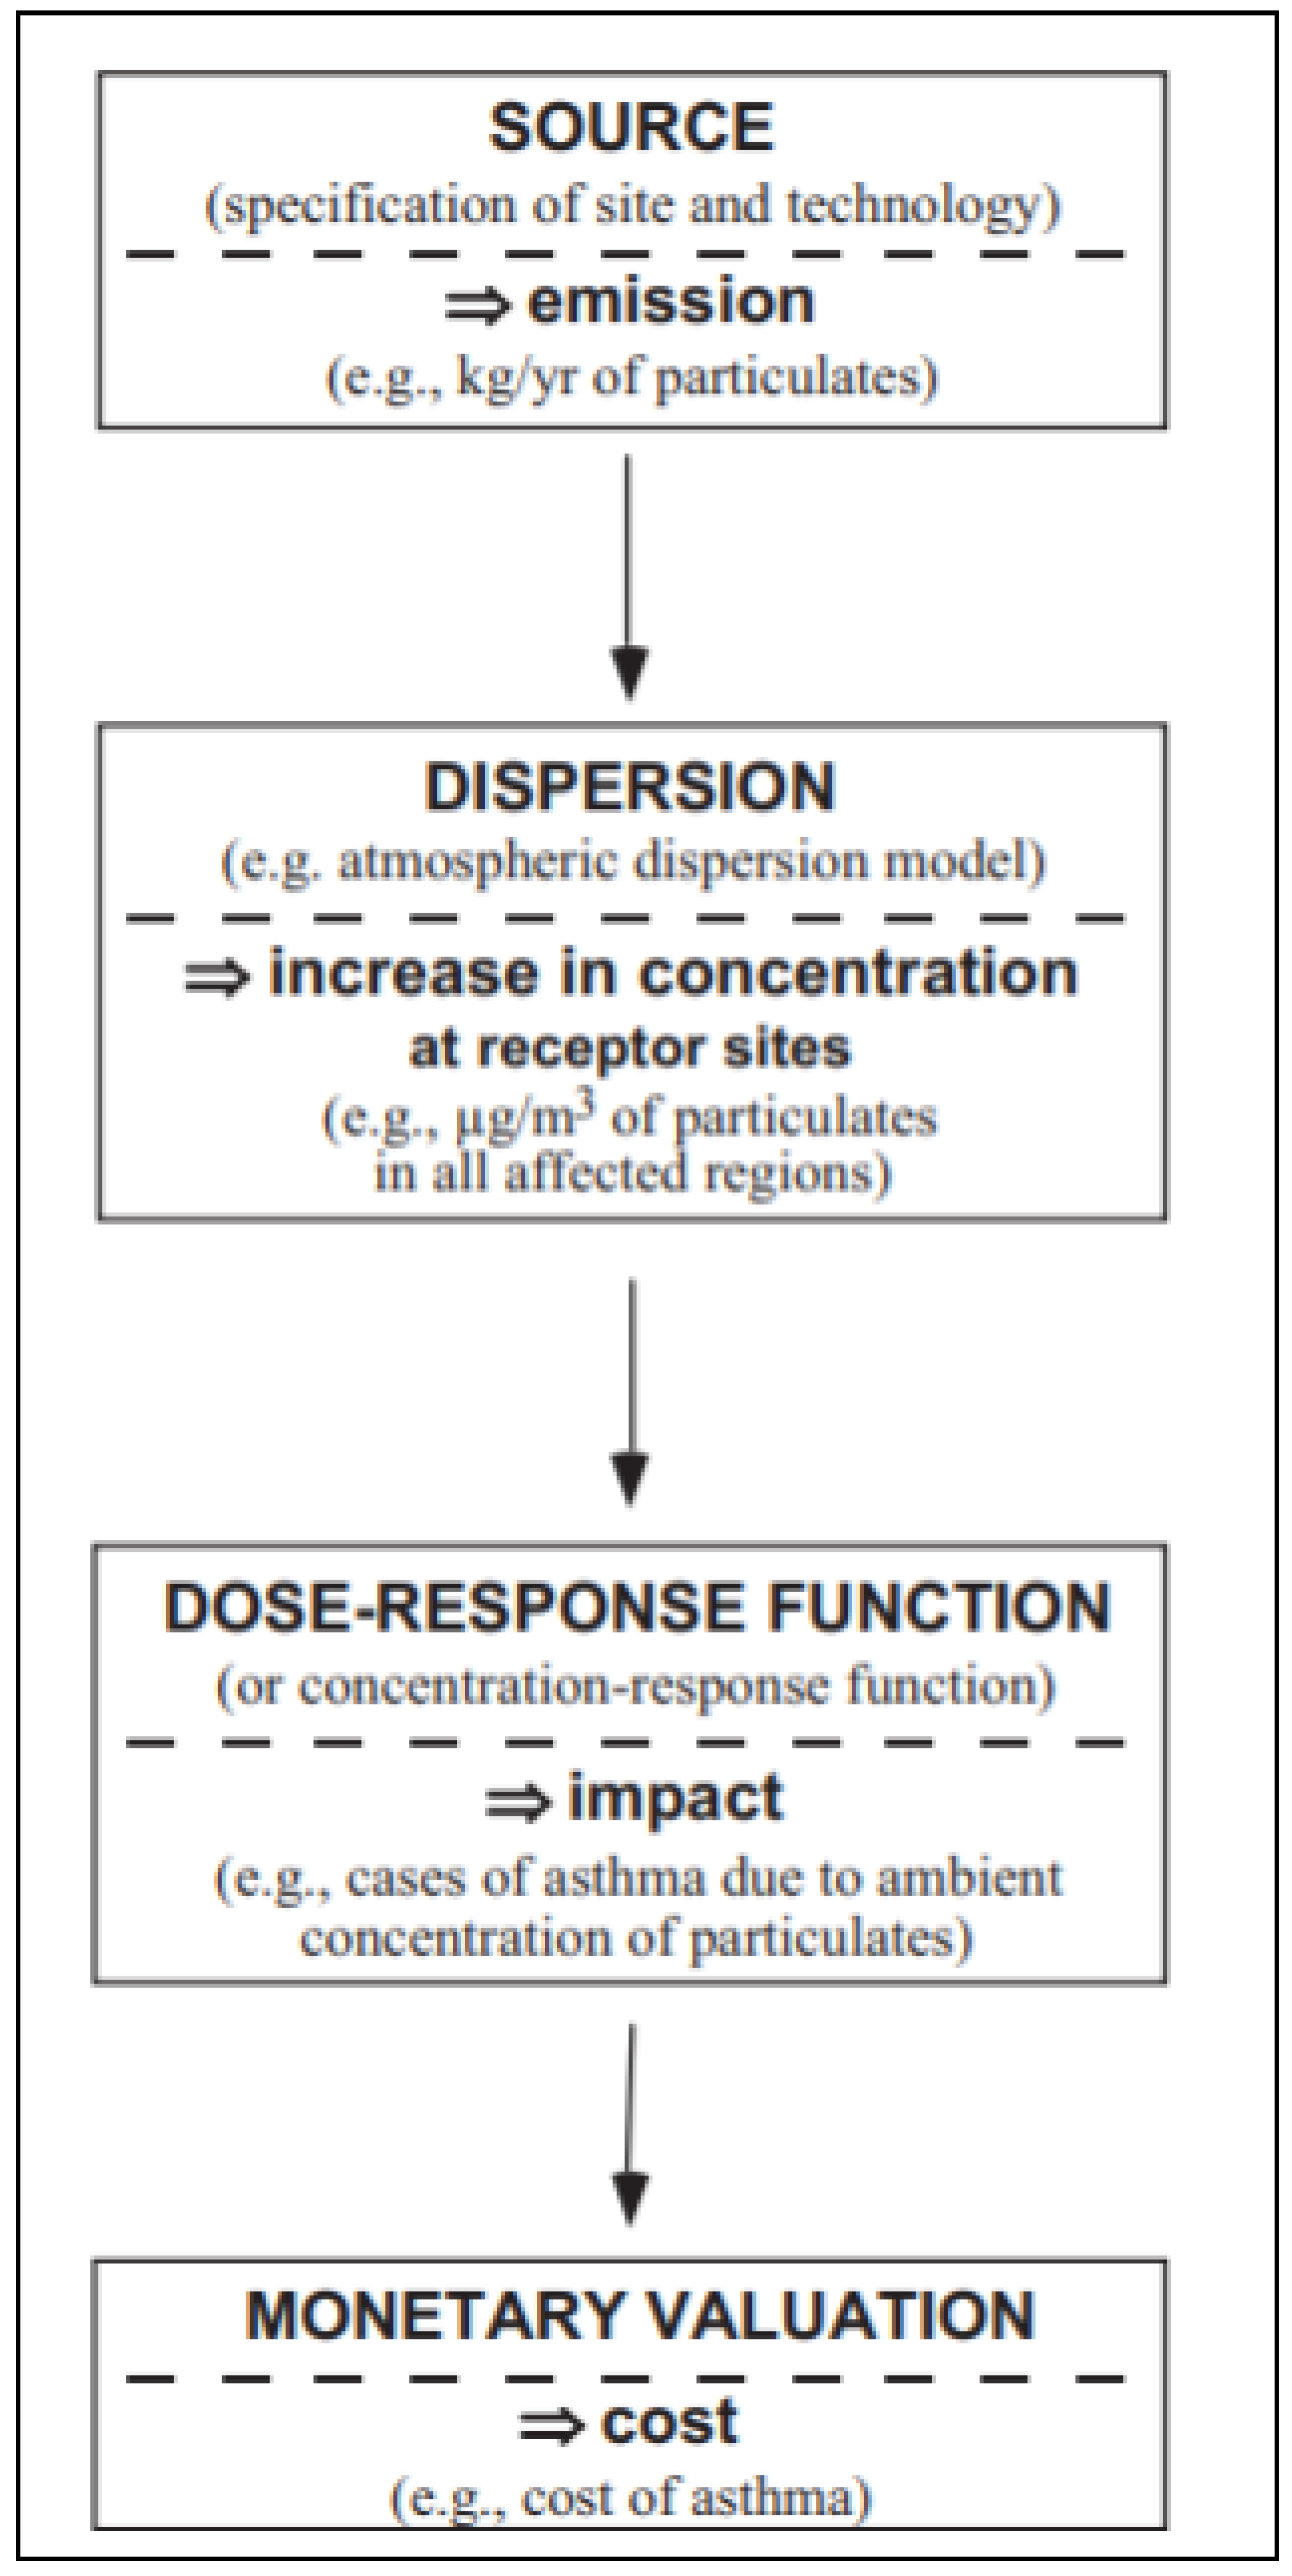
1.3. External Costs in Mining

In the mining context, external costs are covered as abatement costs, where specific elements such as CO2, SO2 and NOx are regulated to not exceed certain limits as per NAAQS. Other elements such as heavy metals do not form part of the NAAQS and therefore bear no abatement costs. Environmental impact mitigation is part of the abetment costs. In the mining sector, abatement costs are governed by the regulation for financial provision where funds need to be set aside to address all resultant and recurring pollution. Other scholars argue that using the abatement cost approach in dealing with mining externalities is flawed since it does not account for unregulated pollutants [25]. Some studies suggest a bottom-up damage-cost approach to estimating externalities posed by mining-related pollution [62]. Using a bottom-up approach, damages from the source are identified and quantified in terms of physical and monetary terms, using impact pathways and damage functions. The Impact Pathways Approach (IPA) has been adopted in this study and is discussed in the methodological approach section.
The monetary evaluation of PM10 health risks involves converting non-market goods into monetary units and is a tool used in policymaking [63]. In environmental management and socially sustainable development, economic loss evaluation is a helpful tool. Therefore, for South Africa to implement the “Polluters Pay Principle”, in sudden mine closure the focus should be on health effects of PM10 during mining company liquidations. It is important to then conduct the losses evaluation due to PM10 health risks to hold the “polluters” accountable. A city in Malaysia suffered losses of around 1.1–1.7 million USD annually due to haze and high particulate matter concentration [64,65]. In 2009, PM10 was evaluated in China and was found to contribute 1%–5% health economic loss [66,67,68]. The external cost of PM10 emissions in Greece is estimated to be between EUR 3.6–14.1 million per year, based on damages to human health. Other studies which assess the economic health risks evaluation of particulate matter include the CEC [14,69,70,71,72,73,74]. Mining related studies that address the issue of external costs include “Externalities from extraction of aggregates regulation by tax or land-use controls” by [75] and “Model for assessing health damage from air pollution in quarrying area a case study at Tan Uyen quarry” by [76] among others. The study by Bui et al. [76] conducted in a Vietnam quarry suggest that dust exposure has an estimated damage to human health of about 9643 billion dong a year, equivalent to 15.03 million USD.

2. Materials and Methods

To understand the economic impacts on the surrounding affected community, through exposure of the nearby TSFs, this study had to valuate and place a monetary value from the environmental impacts. This study adopted the bottom-up approach for the potential economic health risks evaluation of particulate matter in the gold mine village. The approach followed the “ExternE-Methodology”, which calculates environmental external costs as was developed during the “ExternE project-series”, of Impact-Pathway-Approach. The Impact-Pathway-Approach is guided by the following three primary principles, which are transparency, comprehensiveness, and consistency. The secondary principles of the methodology include the following:
  • ExternE’s first principle is to employ quantitative figures and procedures in the assessment or weighting of impacts. Only quantitative algorithms can guarantee transparency and reproducibility.
  • Secondly, monetary units are used to convert impacts into money. To internalize external effects with taxes, it is also important to express these effects in monetary terms.
  • Impacts are evaluated based on (measured) preferences of the affected population.
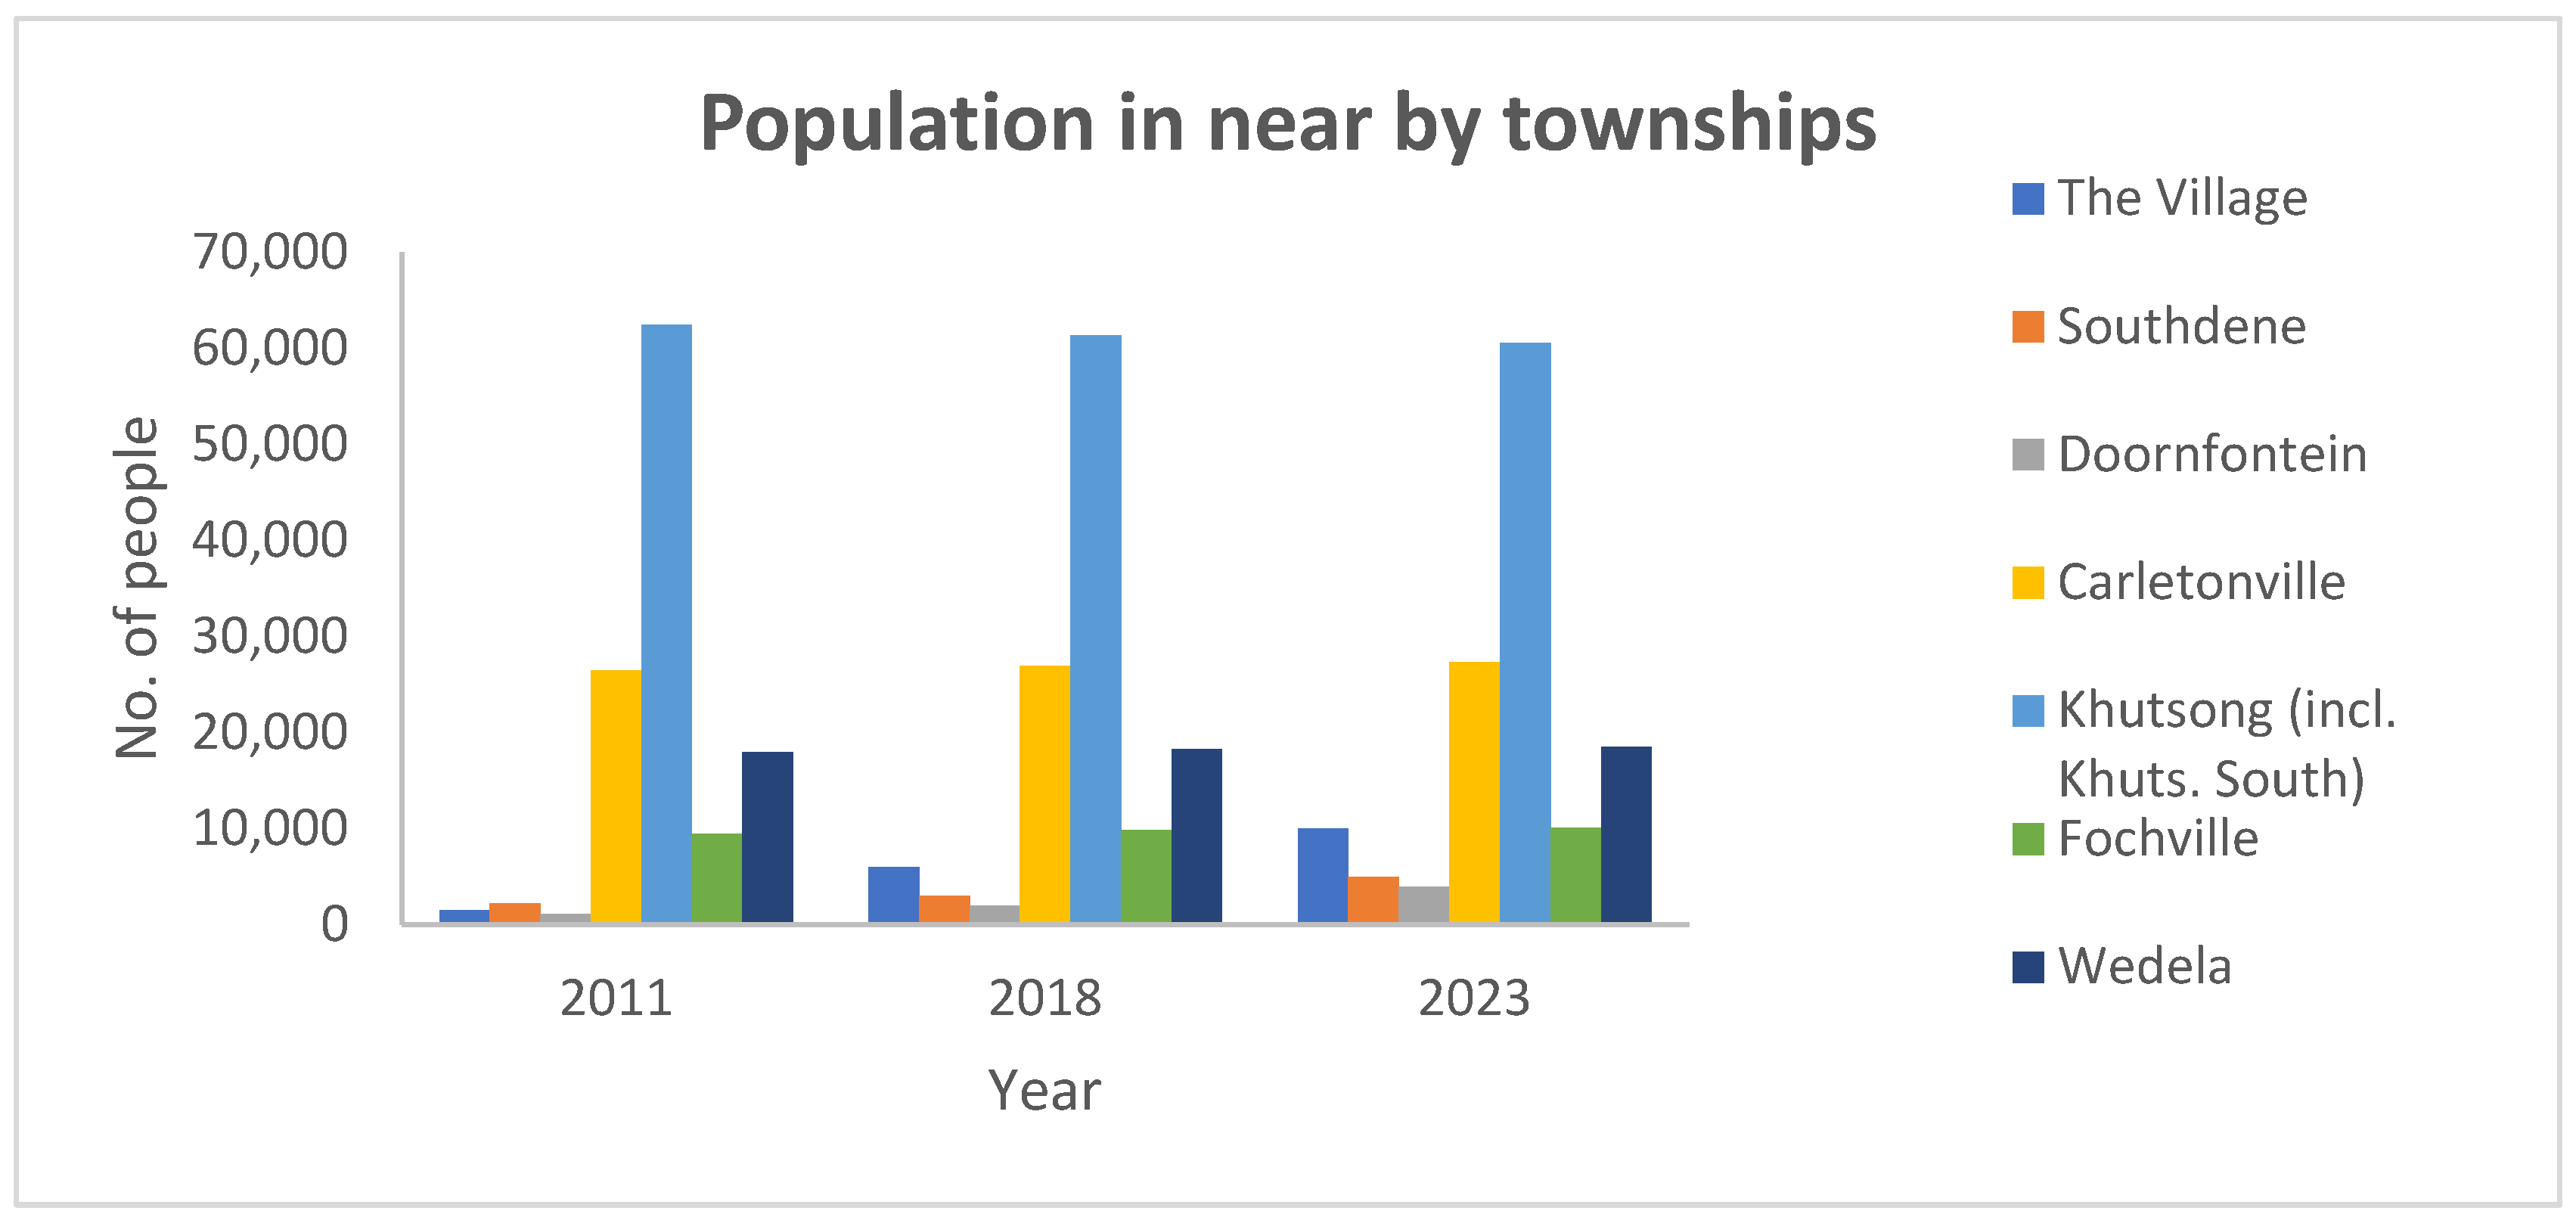
  • To get meaningful results, the affected population must be interviewed. People interviewed must understand the change in utility that occurs as a result of the impact being assessed. It is important to value a damage, not a pressure or effect. In this study, the population was interviewed in 2017 to investigate their perception of the dust impacts in the area. The population size details were also verified and confirmed during the household survey process.
  • The methodology should therefore be able to calculate site- and time-dependent external costs. To fully appreciate site, time, and technology dependence, a detailed bottom-up calculation is required. Calculating average or aggregate external costs can then be determined depending on the question at hand [62]. In this study, the period considered was 2013 to 2017 which coincides with the mining company liquidation period. The external costs calculated were the aggregate external costs of this period.
The IPA is not only applied to air pollution impact assessments, but also in global warming impacts, accidents, energy security, employment, and depletion of non-renewable resources. In the case of air pollutants, the IPA determines the quantity of emissions from a defined source. After that it uses dispersion models and exposure-response functions to determine the marginal damages caused by the emissions [40]. In this study, the AERMOD dispersion model was used to simulate and estimate the spatial distribution of the PM10 as discussed in Mpanza et al. [77]. Multiplying marginal damages by their estimated monetary value is the final step. As a result, health and environmental effects can be quantified in monetary terms in four steps (see Figure 1).
Particulate matter levels used for calculating health effects are the same as those used for SO2, NOx, and O3. The procedure followed in this study is explained as follows.
  • AERMOD model simulations were run, and the assessment of ambient exposure of the population to particulate matter was based on these simulations.
  • An assessment of the exposure to background PM concentration was conducted (below which there is thought to be no harmful health effects).
  • An estimate was made of the number of people exposed to particulate matter.
  • An estimate of the health effect is based on its incidence (for example, the potential underlying morbidity of the population).
  • The exposure-response functions related to PM10 of the selected health effects were analyzed and used. A population is exposed to an air pollutant and the resulting health effect is determined by epidemiological studies (European Environmental Agency).
  • The calculations of the health impacts for each health outcome were conducted (based on the exposed population).
  • The burden of disease was calculated using the cost of illness algorithms.
The ExternE approach has many uncertainties in the estimates derived from scientific issues, such as dose-response functions and monetary values on morbidity and mortality. As a result, the estimates commonly show wide disparities, and a hypothesis is advanced about the usefulness of derived recommendations for policy [13]. As part of this study, the Cost of Illness (COI) is considered, which includes lost productivity and medical costs [78]. Loss of wages and direct medical expenses are included in this measure. However, it does not account for discomfort and pain, among other factors. COI (damage function) produces estimates of how a particular pollutant (e.g., PM10) will affect human health (dose-response function) and then links these health outcomes with the cost of illness.

2.1. Dispersion Modeling

For the assessment of dust deposition and its impacts on the gold mine village community, the AERMOD dispersion model (AERMOD Version 09292, Lakes Environmental, ON, Canada) was used. The AERMOD model was chosen because it is a recommended model for sophisticated, near-source applications on all terrain types (where near-source is defined as being less than 50 km from the source).
Atmospheric models are used to describe physical and chemical processes taking place in the atmosphere, and to determine spatial and temporal distribution of air pollutants. When it comes to assessing the dispersion of inert pollutants, Gaussian models are used most often, especially for regulatory purposes [55]. This model is characterized by its simplicity and the low amount of data import requirements. Gaussian-plume formula is derived under “steady-state” conditions, assuming uniform emission rates and weather conditions throughout the domain of modeling. The Gaussian model is based on Lagrange’s concept of a particular mass of air moving with the wind [55]. Variables related to flow are defined for the piece of air and expressed as functions of time. In this study, the AERMOD model was used to simulate the dust dispersion from the surrounding gold TSFs and is fully discussed in Mpanza et al. [77]. The AERMOD model predicts dust diffusion characteristics of TSFs pollution and provides the spatial distribution of dust in the mining area. The input parameters for the AERMOD model include source data, meteorological data (pre-processed by AERMET model), terrain data and data on the nature of the receptor grid. There are assumptions made when using this model to make the simulation valid such as:
  • assuming emissions to be constant and uniform,
  • the wind direction and speed to be constant,
  • downwind diffusion to be negligible compared to vertical and crosswind diffusion,
  • the terrain is relatively flat i.e., no crosswind barriers, no deposition or absorption of the pollutant,
  • the vertical and crosswind diffusion of the pollutant follow a Gaussian distribution, while the shape of the plume can be represented by an expanding cone, and the turbulence of the plume is homogeneous.

2.1.1. Data Acquisition

In preparation for dispersion modeling a collection of 32 tailings material samples from eight surrounding tailings storage facilities labelled in Figure 2 was undertaken. The tailings material formed part of the source data which included all TSFs that occur within a 10 km radius from the gold mine village. Chemical analysis and particle size distribution was conducted on the source sample data. The particle size analysis from the surface material defines surface roughness, together with moisture content, clay content, silt content, particle density and bulk density, which are required inputs in the Airborne Dust Dispersion Model Area Sources (ADDAS) (1995, Marticorena and Bergametti, France) for emissions quantification.
To characterize the meteorological setting of the area, data from AngloGold Ashanti meteorological station (Mponeng Plant Station) was used, consisting of wind speed, precipitation, relative humidity, and wind direction. The meteorological data covered the period of mining company liquidation, which began in 2012 and continued until 2017. 2012 marks the year just before the gold mining company was placed under liquidation in 2013. Hourly data of the period was obtained, and input files were generated using the AIRMET pre-processor (Breeze v7.9.0.3, US EPA 18081) for the dispersion simulations.

2.1.2. Data Analysis

To characterize each TSF, the particle size distribution, moisture content, clay content, silt content, particle density and bulk density were analyses as agents of particle entrainment, transport, and deposition from the surface material. The particle size distribution was undertaken on the surface material using the Malvern Master Sizer system.
The emissions were quantified based on the in-house Airshed Planning Professionals ADDAS model. The underlying principles and mathematics behind the model was explained in detail in 1995, in the work by Marticorena and Bergametti [77].

2.1.3. Model Validation

The AERMOD model accuracy to predict pollutant concentrations has been documented to be within 20% for ground level emissions at distances less than 1 km. To validate the model the measured dust fallout data were used to compare with the dispersion simulations [77]. The simulations only include emissions associated and near the gold mine village ward 5 and ward 27. The vegetated area and rock dumps were excluded from the assessment as they were assumed not to contribute to the windblown dust owing to the immovable large particle size material of the dumps. The study relied also on aerial photographs of the area as part of source data characterization. The TSFs were the only source considered in the modelling process and therefore other sources adding to the ground level concentrations were not factored in the modelling. All data the input data used in this study are available upon request to the corresponding author.
Figure 2 shows simulated annual PM10 concentration in the study area where a maximum of 39.2 µg/m3 was observed with no clear exceedance of the annual PM10 NAAQS while the daily average standard was exceeded reaching a maximum of 80 µg/m3. It was concluded in the study that most impacts of PM10 were encountered in the short-term when NAAQS is exceeded [77]. TSF1 and TSF6 were simulated to be the most significant sources of PM10 and thus have the potential to trigger respiratory illness hospital admissions, asthma attacks and restricted activity days.

2.2. Health Impact Assessment

In this study, an assessment of the human health impact was conducted in the Merafong municipality which includes townships such as Carletonville, Khutsong, Wedela, Blybank, the gold mine village, Doornfontein, and Fochville, to name a few. The townships affected by dust from the TSFs considered in this study are shown in Figure 2. The townships were chosen to form part of the study, as they are near the dust generating TSFs in the area. The population sizes of all the affected towns are summarized in Figure 3 for the study period 2013–2017. The population size data were provided by the Merafong Municipality in 2018 [79].
The Gold Mine Village (the Village) had approximately 6000 people residing in the area during the time the gold mining company was liquidated (2013–2017). The population figures were confirmed by the study conducted by Mpanza et al. [80] and the Lawyers for Human Rights [81] where a survey was conducted, investigating the perceived impacts of dust, where the number of people residing in the village was investigated. The health threats are the focus of the assessment because no significant impacts were observed on vegetation from the vegetation indices analysis study conducted in 2017 (i.e., preliminary data). The vegetation showed no stress since the dust deposition on leaves was simulated as an experiment (for 1 month October 2017) and was not a natural occurrence. This means prior to the simulation the dust that had been deposited on the plant leaves naturally had no significant impacts on the leaves. The possibilities could be that the dust particles on the leaves were washed away by rain before they could settle for longer periods on the leaves to have impacts. The other possibility could be that the dust particles deposited were of a larger size and had no significant influence on the leaf surface. It is known that dust of smaller particles even at low concentration has greater shading effect on plant leaves. Furthermore, the study site is relatively dry with low moisture, it is possible therefore that the toxicants in the dust did not dissolve to affect the plant tissue.
It is assumed that the persons residing at locations shown in Figure 2 inhaled pollutant concentrations predicted for a particular location. The study presents health impacts for the Village and Wedela since both these townships were severely affected by the dust as shown by the AERMOD simulations.
The assessment of the cost of illness was based on the PM10 concentration as simulated in the study by Mpanza et al. [77] see Figure 2. The potential health endpoints evaluated include hospital admissions owing to respiratory diseases, asthma attacks and restricted activity days. During a study by Lawyers for Human Rights [81] and Mpanza et al. [80], residents of gold mine villages consistently mentioned suffering respiratory illnesses during high dust storms and avoided going outdoors. The study focuses on morbidity only because there are ethical objections to assessing a person’s worth in monetary terms. Furthermore, in household health survey conducted in 2018, the local medical doctors and clinic staff agreed that there was no clear association of death’s causes and dust from TSFs [80]. Based on these reasons, mortality health assessment and economic valuation were not considered in this study.

2.2.1. Dose-Response Function

The World Health Organization [47] endorses the application of dose-response models for suspended particulate matter with linear relationships between levels and health effects. The effect of pollution on specific health outcomes is measured by dose-response relationships. To translate changes in air quality to changes in health, dose-response functions play a crucial role in linking exposures to air pollutants and health outcomes. Due to the absence of locally researched relationships, international dose-response functions that were most applicable to South Africa were used. This study cited dose-response functions from various epidemiological and economic literature to estimate the health impacts (see Table 2).
To determine impact, these functions were applied by multiplying with the exposure (population × pollutant concentration) as shown in Equations (1) and (2). The numbers of hospital admissions related to respiratory ill-health, cardiovascular symptoms, etc. were taken as the impact indicators. Other health endpoints were also considered and included restricted activity days (RAD) and asthma attacks (all considered health endpoints are summarized in Table 2). The WHO [83] suggests analyzing the short-term effects on cardiovascular, and hospital admissions for all ages. In addition, the WHO recommends that children under 18 years of age have their bronchitis symptoms analyzed, as well as adults older than 30 years of age with chronic bronchitis, asthma attacks for all ages, and adults with restricted activity days. Restricted activity days was quantified by investigating the extent of absenteeism due to inhalation-related illnesses [84]. Van Horen [72] and FRIDGE [61] use linear exposure-response functions, while Ostro [4] uses exponential functions.
Multiple studies also examined the effects of short-term exposure to PM10 on hospital counts [85,86]. There was a statistically significant association between PM10 and daily admissions to the hospital for cardiovascular disease (ICD9 codes 390 and 429) in eight USA cities between 1988 and 1990, for instance [84]. In this study, the short-term impacts of PM10 are considered, since the dispersion modelling simulation revealed that the average annual PM10 in the study area was within the NAAQS and only the average daily PM10 exceeded the NAAQS [77]. Applying dose-response functions to people requires information about their density and proximity to the source pollutant (Equations (1) and (2)).
E x p o s u r e = p o p   s i z e   ×   Δ X
I = E R F × E x p o s u r e
where: I is the health impact or endpoint. ERF is the exposure-response function. pop size is the total population size exposed; and Δ X is the change in PM10 concentration (µg/m3) due to the source of concern.
World Health Organization developed a procedure in 2000 for the assessment of airborne dust health impacts. The WHO approach assumed a linear relationship between health endpoints and the change in PM10 and PM2.5. In the linear model, PM10 is correlated with various health endpoints such as cough, bronchodilators, and symptom exacerbation [47]. The WHO procedure was adopted for this study when calculating exposure of the surrounding population. Numerous other studies confirm the linear exposure relationship between health impacts and PM10 [52,86,87,88].

2.2.2. Cost Analysis

Inhalation exposure to air pollution causes indirect and direct costs, such as healthcare costs. A cost of illness (COI) contains the loss of production caused by a possible inability to work and the cost of medical treatment. An appropriate COI identifies the “material part” of health care costs (loss of earnings, costs for medicaments, hospital spending, etc.). The purchasing of self-medication, for example, nasal sprays and cost of hospital admissions are all part of direct costs. Economic activity restrictions result in financial losses due to reduced productivity, which is an indirect cost [89]. This study assessed both direct and indirect costs but focused on expenditure due to respiratory-related illness and restricted activity days due to data availability. The costs per treatment for public and private inpatient and outpatients were considered. The University of Cape Town [90] and Scorgie et al. [91] undertook the economic valuation studies and they were used in this study as a base when estimating medical costs for each health endpoint evaluated. These studies are the only ones available for a South African context, especially related to mining. The health costs were obtained from Medscheme (a private medical aid scheme) since they were not available directly from the National Department of Health South Africa. The health costs from Medscheme were comprehensive, all-inclusive and were assumed representative of the general health cost.
Based on 2004 estimates, public costs of treatment per inpatient were R 16,618.35 (as opposed to R 23,740.50 for private services). Costs were given as R 1353.69 per outpatient consultation (as compared with equivalent private costs of R 1933.85) [61]. These costs are said to increase by 10% annually, which means that for this study period 2013–2017, the costs should have increased by 112%, which were duly adjusted for this study by this amount for the period under consideration. In Beijing, China, the medical costs of health endpoints were estimated in 2013 to be USD 2761.04 for hospitalization, USD 372.36 for asthma attacks, USD 528.08 for acute bronchitis and USD 59.82 for outpatient visits [92].
A cost of illness is calculated based on the morbidity and economic costs associated with a particular disease. Cost-of-illness approaches are ideal for calculating the costs of short-term diseases. Equation (3) calculates the economic costs of each health endpoint (cost of illness).
D i s e a s e   L o s s   D L = M C i × T i × P i
where: MCi is the medical cost per case in a certain disease, Ti refers to the time away from work due to a certain disease in South Africa.
Approximately 4.37 days of hospitalization or rest are required for respiratory diseases. Pi is the population that has a certain illness. The average length of stay given for admission to a respiratory hospital is 8.8 days [93]; 10.6 in a study in Beijing, China [92].
The cost per illness data are not readily available and thus the cost per illness was taken from the FRDGE [61] study and the Western Cape Government Department of Health [92].

3. Results and Discussions

Using the Impact Pathway Approach proposed by the ExternE project, this study assessed the possible morbidity effect of particulate matter (PM10) in the surrounding mining communities. The impacts were estimated as a total increase in respiratory illness, asthma attacks and restricted activity days. A study by Zhou et al. [94] showed that a change in PM10 increased the risks of cardiovascular and respiratory illnesses. In relevant policy-making procedures, it is helpful to be aware of the relationship between exposure to air pollution and health endpoints [95]. Table 3 summarizes the health impacts for each health endpoint assessed in this study.
It can be observed that in Table 3 only the short-term is considered, this is because the annual concentrations are below the threshold concentrations throughout the modelled data. It is assumed that no health effects from long-term PM exposures were encountered in the study area when considering the NAAQS guideline. The AERMOD simulations showed that average annual PM10 concentrations were below the NAAQS, while the average daily PM10 concentration exceeds the NAAQS [78]. It should be noted that the dispersion modelling considered the worst case, meaning the highest dust storms within the study period from 2013 to 2017, from the surrounding TSFs, the cost of illness was therefore calculated from these simulation results. According to residents of the gold mine village, dust effects occur predominantly during windy seasons (roughly July to October) and not throughout the year, therefore short-term effects were considered. A study estimated the costs to human health of the surrounding townships based on the daily PM10 concentrations. Taking into consideration the population sizes as well as the dose-response functions and the unit cost per health endpoint as listed in Table 4.
In the gold mine village, it was estimated that residents would collectively lose about R 75,804 annually owing to potential asthma treatment costs during the mining company liquidation period when using the NAAQS guideline and R 833,847 when considering counterfactual concentration suggested by FRIDGE [61]. In Wedela, it was estimated that R 1,152,541 on average per year would be lost due to asthma treatments when using the NAAQS guideline and R 3,457,624 when considering the counterfactual concentration values suggested by FRIDGE [61] study. For potential respiratory illness for private inpatients approximately a total of R 9012 to treat such illness could be spent at the Gold Mine Village while the public inpatients could spend a total R 6309 to treat respiratory illness. In Wedela, as expected much higher costs were estimated, where potential respiratory illness for private inpatients would spend approximately R 137,017 to treat such illness while the public inpatients would spend R 95,918 in total. The RAD accounted for a potential loss of R 3742 at the Gold Mine Village and R 4,053,399 in Wedela. The cost associated with the RAD for Wedela is significantly higher because this township is on the downwind side of most of the TSFs in the study area and had the highest exceedances of PM10 in the short-term.
In both locations, potential asthma treatment, followed by respiratory illness, accounted for most of the economic losses. The gold mine village had lower economic costs when compared to Wedela, as observed that PM10 concentrations exceedances far superseded that of the Village. International studies were considered for comparison of economic cost see Table 5. It is important to note that economics of morbidity changes are very country-specific [4]. The studies cited are from Jarkata Indonesia, United States of America, Dixon et al. [89,96], Beijing China Yin et al. [93].

Uncertaities in the Estimates

It should be noted in this study that the air pollutant concentrations predicted from TSFs were within the margins of the accuracy of AERMOD that has ±50% to 200% uncertainty [55]. There are several disadvantages of using air quality models for health impact assessment, including the fact that simulated concentrations may not be accurate, and the resolution of the air quality model may not correspond to actual exposure levels. In the same vein, modelled concentrations may not follow the method or spatial resolution of exposure characterization in epidemiologic studies that yield concentration-response functions.
It is assumed that dose-response functions are valid at any level of exposure. In general, there are no relevant baseline health data in most settings, so conducting morbidity studies relies on extrapolating data from other areas, which increases uncertainty. In this study, various dose-response functions were cited from other studies, some of which do not honor the South African conditions. For example, the dose-response functions from Ostro [4,5] were calculated for conditions suitable to Jakarta Indonesia.
As demonstrated by the independent effects detected for near TSF pollution, health impact assessments based on PMs as the sole indicator of short-term exposure underestimate the cost of air pollution. Adding other pollutants to the rest of the total PM burden, such as NOx, may, however, result in double counting of effects [97].
Increasing ambient levels of a pollutant correlates with health effects according to epidemiological studies. In this study, PM10 is considered in the short-term period (daily effects). Other pollutants were not considered in this study, which might under-represent the cost of illness due to air pollution, by dust from gold TSFs. It is difficult to determine which pollutant contributes more to an outcome because of the co-linearity between pollutants, Krewski et al. [97].

4. Conclusions

The health impact assessment was based on the dispersion model assumptions and the details of the modeling are from Mpanza et al. [77]. Mine village residents are predicted to suffer significant health impacts due to high levels of air pollution in some areas especially during the windy season. The direct health costs associated with respiratory-related illness owing to PM10 exposures from surrounding TSFs were estimated at R 5,560,022 combining both Wedela and the Village estimates when considering the NAAQS and R 66,092,760 when considering the counterfactual concentration as suggested by FRIDGE [61]. Respiratory hospital admissions, asthma attacks, and restricted activity days were some of the potential health effects evaluated. The TSFs were identified as the main source of dust exposure to the surrounding mining communities in the study area. TSF1 and TSF6 were simulated to be the most significant sources of PM10 and thus have the potential to trigger respiratory illness hospital admissions, asthma attacks and restricted activity days.
It seems evident from the findings that rehabilitation interventions targeting the identified risk zones would likely lead to a reduction in respiratory hospital admissions and asthma attacks in the short-term. This paper demonstrated how a dose response-function approach can be used to cost health risks associated with PM10 inhalation exposures. An assessment of health risks posed by partially rehabilitated TSFs, especially during sudden mine closure resulting from mining company liquidation, can be performed using this approach. The approach thus can assist in implementing the “polluter pays principle” in a fair and equitable way, therefore quantifying the social costs to nearby communities that are often not measured.
During the company liquidation period 2013–2017, no interventions were undertaken to offset the dust deposition impacts in the area. The gold mining company had ceased to exist, and the state had not issued any closure certificate as stipulated by the law. The Department of Mineral Resources and Energy could not step in to undertake environmental rehabilitation and thus the dust became an issue for the surrounding communities. The state must find new strategies to take immediate action to combat environmental degradation to prevent the community from incurring costs owing to PM10 inhalation exposures especially when mining operations are closed suddenly. Studies by Scorgie et al. [98] detail out specific strategies to reduce emissions and improve health conditions for the surrounding community.

Author Contributions

The research was conceptualized by M.M.; methodology, by M.M. and R.M.; analysis, by M.M. and E.A.; investigation, by M.M.; resources, by R.M.; data curation, by M.M.; writing—original draft, by M.M.; supervision, by E.A. and R.M. All authors have read and agreed to the published version of the manuscript.

Funding

This research received no external funding.

Data Availability Statement

The data used in this study is in the corresponding author’s private database and can be made available upon request by emailing the author using the email provided.

Acknowledgments

The authors are grateful for the guidance provided by the Airshed Planning Professionals (Pty), Midrand, South Africa.

Conflicts of Interest

The authors declare no conflict of interest.

References

  1. Naicker, K.; Cukrowska, E.; McCarthy, T.S. Acid Mine drainage arising from gold mining activity in Johannesburg, South Africa and environs. Environ. Pollut. 2003, 122, 29–40. [Google Scholar] [CrossRef]
  2. Saldarriaga-Isaza, A.; Villegas-Palacio, C.; Arango, S. The public good dilemma of a non-renewable common resource: A look at the facts of artisanal gold mining Resour. Policy 2013, 38, 224–232. [Google Scholar] [CrossRef]
  3. Freeman, M. The Measurement of Environment and Resource Values: Theory and Methods, 2nd ed.; Resources for the Future: Washington, DC, USA, 2003. [Google Scholar]
  4. Ostro, B. Estimating the Health Effects of Air Pollution: A Method with an Application to Jakarta, Policy Research Working Paper 1301; World Bank Policy Research Department: Washington, DC, USA, 1994. [Google Scholar]
  5. Ostro, B. Outdoor Air Pollution: Assessing the Environmental Burden of Disease at National and Local Levels. In Environmental Burden of Disease Series No. 5; World Health Organization: Geneva, Switzerland, 2004. [Google Scholar]
  6. Hohmeyer, O. Social Costs of Energy Consumption; Springer: Berlin, Germany, 1988. [Google Scholar]
  7. Hohmeyer, O. The social costs of electricity-renewables versus fossil and nuclear energy. Int. J. Sol. Energy 1992, 11, 231–250. [Google Scholar] [CrossRef]
  8. Ottinger, R.L.; Wooley, D.R.; Robinsson, N.A.; Hodas, D.R.; Babb, S.E. Environmental Costs of Electricity; Oceana Publications, Inc.: New York, NY, USA, 1991. [Google Scholar]
  9. Pearce, D.; Bann, C.; Georgiou, S. The Social Cost of Fuel Cycles, Report to the UK Department of Trade and Industry; HMSO: London, UK, 1992. [Google Scholar]
  10. Friedrich, R.; Voss, A. External costs of electricity generation. Energy Policy 1993, 21, 114–122. [Google Scholar] [CrossRef] [Green Version]
  11. McGraw-Hill Utility Data Institute. Oak Ridge National Laboratory (ORNL) and Resources for the Future (RfR) External Costs and Benefits of Fuel Cycle, Reports 2–8; McGraw-Hill Utility Data Institute: Washington, DC, USA, 1994–1998. [Google Scholar]
  12. Kovacevic, T.; Tomsic, Z.; Debrecin, Z. External costs of electricity: From air emissions to health damage. In Proceedings of the 12th Regional Central European Conference IUPPA and Fourth International Conference on Environmental Impact Assessment, Prague, Czech Republic, 11–14 September 2000; Section C. pp. 317–573. [Google Scholar]
  13. Fouquet, R.; Slade, R.; Karakoussis, V.; Gross, R.; Bauen, A.; Anderson, D. External Costs and Environmental Policy in the United Kingdom and the European Union, Occasional Paper 3; Imperial College Centre for Energy Policy and Technology: London, UK, 2001. [Google Scholar]
  14. Commission of the European Communities (CEC), The European Commission, 1995–2000. Luxembourg: Office for Official Publications of the European Communities, 1995. Available online: https://www.referenceforbusiness.com/encyclopedia/Clo-Con/Commission-of-the-European-Communities.html#ixzz76jOj7RXN (accessed on 6 May 2021).
  15. Commission of the European Communities (CEC). The European Commission. Brussels: Commission of the European Communities, 1999. Available online: https://www.referenceforbusiness.com/encyclopedia/Clo-Con/Commission-of-the-European-Communities.html#ixzz76jPXae4P (accessed on 6 May 2021).
  16. Office of Technology Assessment (OTA), Annual Report to the Congress: Fiscal Year 1993. Federation of American Scientists. Available online: https://ota.fas.org/otareports/year/1994a/ (accessed on 2 June 2021).
  17. Lee, R. Externalities Studies: Why Are the Numbers Different. In Social Costs and Sustainability: Valuation and implementation in the Energy and Transport Sector, Proceeding of the International Conference, Ladenburg, Germany, 27–30 May 1995; Hohmeyer, O., Ottinger, R.L., Rennings, K., Eds.; Springer: Berlin, Germany, 1997. [Google Scholar]
  18. Stirling, A. Valuing the environmental impacts of electricity production: A critical review of some “first-generation” studies. Energy Source 1998, 20, 267–300. [Google Scholar] [CrossRef]
  19. Schleisner, L. Comparison of methodologies for externality assessment. Energy Policy 2000, 28, 1127–1136. [Google Scholar] [CrossRef]
  20. Sundqvist, T. Electricity Externality Studies-Do the Numbers Make Sense? Licentiate Thesis, Lulea University of Technology, Lulea, Sweden, 2000. [Google Scholar]
  21. Sundqvist, T. Regulating Externalities in the Power Sector: Some Lessons from Previous Valuation Studies. Miner. Energy-Raw Mater. Rep. 2001, 16, 14–31. [Google Scholar] [CrossRef]
  22. Sundqvist, T.; Söderholm, P. Valuing the environmental impacts of electricity generation: A critical survey. J. Energy Lit. 2002, 2, 3–41. [Google Scholar]
  23. Krewitt, W. External costs of energy—Do the answers match the questions? Looking back at 10 Years of ExternE. Energy Policy 2002, 30, 839–848. [Google Scholar] [CrossRef]
  24. Kim, S.H. Evaluation of negative environmental impacts of electricity generation: Neoclassical and institutional approaches. Energy Policy 2006, 35, 413–423. [Google Scholar] [CrossRef]
  25. Burtraw, D.; Krupnick, A. The True Cost of Electric Power: An Inventory of Methodologies to Support Future Decision-making in Comparing the Cost and Competitiveness of Electricity Generation Technologies; Summary of Policymakers; Resources for the Future: Washington, DC, USA, 2012. [Google Scholar]
  26. Graaf Zivin, J.S.; Neidell, M.J. Environment, health and human capita. J. Econ. Lit. 2013, 51, 689–730. [Google Scholar] [CrossRef]
  27. Currie, I.; De Waal, J. The Bill of Rights Handbook. In Environment, 5th ed.; Juta & Company Ltd.: Cape Town, South Africa, 2005; pp. 521–530. [Google Scholar]
  28. Maseki, J.H. Risk Assessment of Inhaled and Ingested Airborne Particles in the Vicinity of Gold Mine Tailings: Case Study of the Witwatersrand Basin. Master’s Thesis, University of Johannesburg, Johannesburg, South Africa, 2013. [Google Scholar]
  29. Farmer, A.M. The effects of dust on vegetation—A review. Environ. Pollut. 1993, 79, 63–75. [Google Scholar] [CrossRef]
  30. Grantz, D.A.; Garner, J.H.B.; Johnson, D.W. Ecological effects of particulate matter. Environ. Int. 2003, 29, 213–239. [Google Scholar] [CrossRef]
  31. Martinez-Ramirez, S.; Thompson, G.E. Dry and wet deposition studies of the degradation of cement mortars. Mater. Constr. 1998, 48, 15–31. [Google Scholar]
  32. Petavratzi, E.; Kingman, L.; Lowndes, S. Particulates from mining operations: A review of sources, effects and regulations. Miner. Eng. 2005, 18, 1183–1199. [Google Scholar] [CrossRef]
  33. Mergler, D.; Anderson, H.A.; Chan, I.H.M.; Mhaffey, K.R.; Murray, M.; Sakamoto, M.; Stern, A.H. Methylmercury exposure and health effects in humans: A worldwide concern. AMBIO 2007, 36, 3–11. [Google Scholar] [CrossRef]
  34. Annegarn, H.J.; Surridge, A.D.; Hlapolosa, H.S.P.; Swanepoel, D.J.D.E.V.; Horne, A.R. Review of 10 years of environmental dust monitoring at Crown Mines. J. Mine Vent. Soc. S. Afr. 1991, 44, 46–50. [Google Scholar]
  35. Coetzee, H. Radiometric Surveying in the Vicinity of Witwatersrand Gold Mine. In Mine Closure 2008; Fourie, A.B., Tibbet, M., Weiersbye, I.M., Dye, P.J., Eds.; Australian Centre for Geomachanics: Perth, Australia, 2008; pp. 617–629. [Google Scholar]
  36. Amegbey, N.A.; Adimado, A.A. Incidents of cyanide spillage in Ghana. Miner. Process. Ext. Metall. 2003, 112, 126–130. [Google Scholar] [CrossRef]
  37. Adei, D.; Addei, I.; Kwadjosse, H.A. Study of the effects of mining activities on the health status of people: A case study. Res. J. Appl. Sci. Eng.Technol. 2011, 3, 99–104. [Google Scholar]
  38. Annegarn, H.J.; Grant, M.R. Direct Source Apportionment of Particulate Pollution within a Township, Final Report submitted to the Department of Minerals and Energy, Low Smoke Coal Programme; University of Witwatersrand: Johannesburg, South Africa, 1999. [Google Scholar]
  39. Annegarn, H.J.; Grant, M.R.; Kneen, M.A.; Scorgie, Y. Direct Source Apportionment of Particulate Pollution within a Township, Report for the Department of Minerals and Energy, Low Smoke Coal Programme; Report No. DME/2/DME-99; University of Witwatersrand: Johannesburg, South Africa, 1999. [Google Scholar]
  40. Bickel, P.; Friedrich, R. (Eds.) ExternE-Externalities of Energy: Methodology Update. EUR 21951; European Commission, Directorate–General for Research Sustainable Energy Systems: Luxembourg, 2005. [Google Scholar]
  41. Hnizdo, E.; Murray, J. Risk of pulmonary tuberculosis relative to silicosis and exposure to silica dust in South African gold miners. Occup. Environ. Med. 1998, 55, 496–502. [Google Scholar] [CrossRef] [Green Version]
  42. Dockery, D.W.; Pope, C.A. Acute Respiratory Effects of Particulate Air Pollution. Annu. Rev. Public Health 1994, 15, 107–132. [Google Scholar] [CrossRef]
  43. American Thoracic Society (ATS). Adverse effects of crystalline silica exposure: American Thoracic Society Committee of the Scientific Assembly on Environmental Occupational Health. Am. J. Res. Critic. Care Med. 1997, 155, 761–765. [Google Scholar] [CrossRef]
  44. Makgae, M. Key Areas in Waste Management: A South African Perspective; INTECH Open Access Publisher: London, UK, 2011. [Google Scholar]
  45. Wright, C.; Oosthuizen, R. PM2.5 as an Emerging Priority Pollutant in South Africa-Impacts on Human Health; Department of Environmental Affairs Directorate Information Management: Pretoria, South Africa, 2010.
  46. Kok, J.F.; Parteli, E.J.R.; Michaels, T.I.; Bou Karam, D. The physics of wind-blown sand and dust. Rep. Prog. Phys. 2012, 75, 106901. [Google Scholar] [CrossRef] [Green Version]
  47. World Health Organization (WHO). Guidelines for Air Quality; World Health Organisation: Geneva, Switzerland, 2000. [Google Scholar]
  48. Jeong, S.J. The Impact of Air Pollution on Human Health in Suwon City. Asian J. Atmos. Environ. 2013, 7, 227–233. [Google Scholar] [CrossRef] [Green Version]
  49. World Health Organization (WHO). Health Risks of Air Pollution in Europe—HRAPIE Project Recommendations for Concentration–Response Functions for Cost–Benefit Analysis of Particulate Matter, Ozone and Nitrogen Dioxide; World Health Organization Regional Office for Europe: Copenhagen, Denmark, 2013. [Google Scholar]
  50. Happo, M.; Markkanen, A.; Markkanen, P.; Jalava, P.; Kuuspalo, K.; Leskinen, A.; Sippula, O.; Lehtinen, K.; Jokiniemi, J.; Hirvonen, M.R. Seasonal variation in the toxicological properties of size-segregated indoor and outdoor air particulate matter. Toxicol. In Vitro 2013, 27, 1550–1561. [Google Scholar] [CrossRef]
  51. Laden, F.; Schwartz, J.; Speizer, F.E.; Dockery, D.W. Reduction in fine particulate air pollution and mortality—Extended follow-up of the Harvard six cities study. Am. J. Respir. Crit. Care Med. 2006, 173, 667–672. [Google Scholar] [CrossRef]
  52. Dockery, D.W.C.A.; Pope, X.; Xiping, J.; Spengler, J.; Ware, M.F.; Ferris, B.; Speizer, F. An Association between Air Pollution and Mortality in Six US Cities. N. Engl. J. Med. 1993, 329, 1753–1759. [Google Scholar] [CrossRef] [Green Version]
  53. Pope, C.A.; Thun, M.J.; Namboodiri, M.M.; Dockery, D.W.; Evans, J.S.; Speizer, F.E.; Heath, C.W., Jr. Particulate air pollution as a predictor of mortality in a prospective study of US adults. Am. J. Respir. Crit. Care Med. 1995, 151, 669–674. [Google Scholar] [CrossRef]
  54. Maseki, J.; Annegarn, H. Health risk posed by enriched heavy metals (As, Cd, and Cr) in airborne particles from Witwatersrand gold tailings. J. S. Afr. Inst. Min. Met. 2017, 117, 663–669. [Google Scholar] [CrossRef]
  55. Ojelede, M.E.; Annegarn, H.J.; Kneen, M.A. Evaluation of aeolian emissions from gold mine tailings on the Witwatersrand. Aeol. Res. 2012, 3, 477–486. [Google Scholar] [CrossRef]
  56. Oguntoke, O.; Ojelede, E.M.; Annegarn, J.H. Frequency of mine dust episodes and the influence of meteorological parameters in the Witwatersrand area, South Africa. Int. J. Atmos. Sci. 2013, 2013, 128463. [Google Scholar] [CrossRef] [Green Version]
  57. Kneen, M.A.; Ojelede, M.E.; Annegarn, J.H. Housing and population sprawl near tailings storage facilities in the Witwatersrand: 1952 to current. S. Afr. J. Sci. 2015, 111, 11–12. [Google Scholar] [CrossRef]
  58. Statistics South Africa, Mid-Year Population Estimates. Statistical Release P0302, 2014. Available online: https://www.statssa.gov.za/publications/P0302/P03022014.pdf (accessed on 10 June 2021).
  59. Republic of South Africa. National Environmental Management: Air Quality Act No. 39 of 2004: Draft National Dust Control Regulations, Government Gazette No.35931; Republic of South Africa: Cape Town, South Africa, 7 December 2012. [Google Scholar]
  60. Republic of South Africa. National Environmental Management: Air Quality Act No. 39 of 2004: National Ambient Air Quality Standard, Government Gazette Vol 486 No.35463; Republic of South Africa: Cape Town, South Africa, 24 December 2009. [Google Scholar]
  61. FRIDGE. Bentley West Management Consultants (Pty) Ltd. and Airshed Planning Professionals (Pty) Ltd. 2004: Study to Examine the Potential Socio-Economic Impact of Measures to Reduce Air Pollution from Combustion; Final Report 2004 for the Fund for Research into Industrial; Development Growth and Equity (FRIDGE), NEDLAC Trade and Industry Chamber: Johannesburg, South Africa, 2004. [Google Scholar]
  62. Papagiannis, A.; Roussos, D.; Menegaki, M.; Damigos, D. Externalities from lignite mining-related dust emissions. Energy Policy 2014, 74, 414–442. [Google Scholar] [CrossRef]
  63. Pizzol, M.; Weidema, B.; Brandão, M.; Osset, P. Monetary valuation in life cycle assessment: A review. J. Clean. Prod. 2015, 86, 170–179. [Google Scholar] [CrossRef]
  64. Othman, J.; Sahani, M.; Mahmud, M.; Sheikh Ahmad, M.K. Transboundary smoke haze pollution in Malaysia: Inpatient health impacts and economic valuation. Environ. Pollut. 2014, 189, 194–201. [Google Scholar] [CrossRef] [PubMed]
  65. Gao, J.; Tian, H.; Cheng, K.; Lu, L.; Zheng, M.; Wang, S.; Hao, J.; Wang, K.; Hua, S.; Zhu, C. The variation of chemical characteristics of PM2.5 and PM10 and formation causes during two haze pollution events in urban Beijing, China. Atmos. Environ. 2015, 107, 1–8. [Google Scholar] [CrossRef]
  66. Hou, Q.; An, X.; Wang, Y.; Tao, Y.; Sun, Z. An assessment of China’s PM10-related health economic losses in 2009. Sci. Total Environ. 2012, 435–436, 61–65. [Google Scholar] [CrossRef]
  67. Kan, H.; Chen, B. Particulate air pollution in urban areas of Shanghai, China: Health-based economic assessment. Sci. Total Environ. 2004, 322, 71–79. [Google Scholar] [CrossRef]
  68. Zhang, D.; Aunan, K.; Martin Seip, H.; Larssen, S.; Liu, J.; Zhang, D. The assessment of health damage caused by air pollution and its implication for policy making in Taiyuan, Shanxi, China. Energy Policy 2010, 38, 491–502. [Google Scholar] [CrossRef] [Green Version]
  69. Van Horen, C. Counting the Social Costs: Electricity and Externalities in South Africa; Juta Academic: Cape Town, South Africa, 1997. [Google Scholar]
  70. Kunzli, N.; Kaiser, R.; Medina, S. Public Health impact of outdoor and traffic-related air pollution: A European assessment. Lancet 2001, 356, 795–801. [Google Scholar] [CrossRef]
  71. Nelson, C.D. The Public Health Impacts of Particulate Emissions from Coal-fired Power Plants in Minnesota. Master’s Thesis, Faculty of the Graduate School, University of Minnesota, Saint Anthony Falls, MN, USA, October 2000. [Google Scholar]
  72. Holland, M.; Watkiss, P. BeTa-Benefits Table Database: Estimates of the Marginal External Costs of Air Pollution in Europe. Created for European Commission DG Environment by Netcen; European Commission DG Environment: Copenhagen, Denmark, 2002. [Google Scholar]
  73. World Bank and International Finance Corporation, It’s Not over When it’s Over: Mine Closure around the World. 2002. Available online: http://siteresources.worldbank.org/INTOGMC/Resources/notoverwhenover.pdf (accessed on 10 May 2020).
  74. Wang, X.; Mauzerall, D.L. Evaluating impacts of air pollution in China on public health: Implications for future air pollution and energy policies. Atmos. Environ. 2006, 40, 1706–1721. [Google Scholar] [CrossRef]
  75. Willis, K.G.; Garrod, G.D. Externalities from extraction of aggregates regulation by tax or land-use controls. Resour. Policy 1999, 25, 77–86. [Google Scholar] [CrossRef]
  76. Bui, L.T.; Nguyen, P.H.; Nguyen, D.C.M. Model for assessing health damage from air pollution in quarrying area e case study at Tan Uyen quarry. Ho Chi Minh megapolis, Vietnam. Heliyon 2020, 6, e05045. [Google Scholar] [CrossRef]
  77. Mpanza, M.; Adam, E.; Moolla, R. Dust Deposition Impacts at a Liquidated Gold Mine Village: Gauteng Province in South Africa. Int. J. Environ. Res. Public Health 2020, 17, 4929. [Google Scholar] [CrossRef]
  78. Quah, E.; Boon, T.L. The economic cost of particulate air pollution on health in Singapore. J. Asian Econ. 2003, 14, 73–90. [Google Scholar] [CrossRef]
  79. Blyvoor Gold Capital. Environmental Management Programme Report for the Blyvooruitzicht and Doornfontein Mine. EMP Rep. 2018, unpublished. [Google Scholar]
  80. Mpanza, M.; Adam, E.; Moolla, R. Perceptions of external costs of dust fallout from gold mine tailings: West Wits Basin. Clean Air J. 2020, 30, 52–63. [Google Scholar] [CrossRef]
  81. Lawyers for Human Rights (LHR). Blyvooruitzicht Mine Village: The Human Toll of State and Corporate Abdication of Responsibility in South Africa. 2017. Available online: http://www.lhr.org.za/ (accessed on 3 April 2021).
  82. Maddison, D.A. Meta-Analysis of Air Pollution Epidemiological Studies; Centre for Social and Economic Research on the Global Environment: London, UK; University College London: London, UK; University of East Anglia: Norwich, UK, 1997. [Google Scholar]
  83. World Health Organization (WHO). Review of Evidence on Health of Air Pollution-REVIHAAP Project Technical Report; World Health Organization: Bonn, Germany, 2013; Available online: www.euro.eho.int/_data/assets/pdf_file/0004/193108/REVIHAAP-Final-technical-report-final-version.pdf (accessed on 10 June 2021).
  84. Rowe, R.D.; Lang, C.M.; Chesnut, L.G.; Latimer, D.A.; Rae, D.; Bernow, S.M.; White, D.E. New York State Environmental Externalities Cost Study; Empire State Electric Energy Research Corporation: New York, NY, USA, 1996. [Google Scholar]
  85. Schwartz, J.; Slater, D.; Larson, T.; Pierson, W.; Koening, J. Particulate air pollution and hospital emergency room visits for asthma in Seattle. Am. Rev. Respir. Dis. 1993, 174, 826–883. [Google Scholar] [CrossRef]
  86. Schwartz, J.; Zanobette, A.; Bateson, T. Revised Analysis of the National Morbidity, Mortality and Air Pollution Study: Morbidity and Mortality among Elderly Residents of Cities with Daily PM Measurements; Health Effects Institute: Baltimore, MD, USA, 2005. [Google Scholar]
  87. Xu, Z.; Yu, D.; Jing, L.; Xu, X. Air pollution and daily mortality in Shenyang, China. Arch. Environ. Health Int. J. 2000, 55, 115–120. [Google Scholar] [CrossRef]
  88. Pope, C.A. Synoptic weather modeling and estimates of the exposure-response relationship between daily mortality and particulate air pollution. Environ. Health Perspect. 1996, 104, 414–420. [Google Scholar] [CrossRef]
  89. Dixon, J.A.; Scura, L.F.; Carpenter, R.A.; Sherman, P.B. Economic Analysis of Environmental Impacts, New Edition; Earthscan Publications Ltd.: London, UK, 2013. [Google Scholar]
  90. University of Cape Town. Socio-Economic Impact of Air pollution Reduction Meausres Task 5b, Socio-economic Impacts Associated with Prioritised Options, Report Compiled in Collaboration with Bentley West Management Consultants on Behalf of National Economic Development and Labour Council (NEDLAC) under the Fund for Research into Industrial Growth and Equity (FRIDGE); University of Cape Town: Cape Town, South Africa, 2004. [Google Scholar]
  91. Scorgie, Y.; Burger, L.W.; Annegarn, H.J. Socio-Economic Impact of Air Pollution Reduction Measures—Task 2: Establishment of Source Inventories, and Task 3: Identification and Prioritisation of Technology Options; Report compiled on behalf of NEDLAC under the Fund for Research into Industrial Growth and Equity; Airshed Planning Professionals: Midrand, South Africa, 25 June 2003. [Google Scholar]
  92. Western Cape Government: Department of Health. Western Cape Government Hospital Tariffs: UPFS Fee Schedule for Full Paying Patients (Externally Funded, Foreigners, RGP and Patients with Private Doctor Incl). Available online: https://www.westerncape.gov.za/assets/departments/health/annexure_a3_externally_funded_april_2014.pdf (accessed on 10 June 2021).
  93. Yin, H.; Xu, L.; Cai, Y. Monetary Valuation of PM10-Related Health Risks in Beijing China: The Necessity for PM10 Pollution Indemnity. Int. J. Environ. Res. Public Health 2015, 12, 1660–4601. [Google Scholar] [CrossRef] [Green Version]
  94. Zhou, M.; Liu, Y.; Wang, I.; Kuang, X.; Xu, X.; Kan, H. Particulate air pollution and mortality in a cohort of Chinese men. Environ. Pollut. 2014, 186, 1–6. [Google Scholar] [CrossRef] [PubMed]
  95. Khaniabadi, Y.O.; Daryanoosh, S.M.; Amrane, A.; Polosa, R.; Hopke, P.K.; Goudarzi, G.; Mohammadi, M.J.; Sicard, P.; Armin, H. Impact of Middle Eastern Dust storms on human health. Atmos. Poll. Res. 2017, 8, 606–613. [Google Scholar] [CrossRef]
  96. Nurmagambetov, T.; Kuwahara, R.; Garbe, P. The Economic Burden of Asthma in the United States, 2008–2013; Division of Environmental Hazards and Health Effects, National Center for Environmental Health, Centers for Disease Control and Prevention: Atlanta, GA, USA, 2013. Available online: https://pubmed.ncbi.nlm.nih.gov/29323930/ (accessed on 21 July 2021). [CrossRef]
  97. Krewski, D.; Burnett, R.T.; Goldberg, M.S.; Hoover, K.; Siemiatycki, J.; Abrahamowicz, M.; White, W.H. Health Effects Institute Reanalysis of the Havard Six Cities Study and the American Cancer Society Study of Particulate Air Pollution and Mortality; A special Report of the Institute’s Particle Epidemiology Reanalysis Project; Health Effects Institute: Cambridge, MA, USA; North Andover, MA, USA, 2000. [Google Scholar]
  98. Scorgie, Y.; Paterson, G.; Burger, L.W.; Annergarn, H.J.; Kneen, M.A. Socio-Economic Impact of Air Pollution Reduction Measures-Task 4a Supplementary Report: Quantification of Health Report: Quantification of Health Risks and Associated Costs Due to Fuel Burning Source Groups, Report Compiled on behalf of National Economic Development and Labour Council (NEDLAC) under the Fund For Research into Industrial Growth and Equity (FRIDGE); Airshed Planning Professionals Pty Ltd.: Midrand, South Africa, 2004. [Google Scholar]
Figure 1. An illustration of the main steps of the impact pathways methodology applied to the consequences of air pollutant emissions. Each step is analyzed with detailed process models. Reproduced with permission from (Bickel, P.; Friendrich, R.), ExternE-externalities of energy-methodology 2005 update; published by (European Commission, Directorate-General for Research Sustainable Energy Systems, Luxembourg), (2005) [62].
Minerals 12 00169 g001
Figure 2. Simulated highest annual PM10 (a) and highest daily PM10 (b) concentration due to all simulated sources [77].
Minerals 12 00169 g002
Figure 3. Population size data as provided by the Merafong Municipality [79].
Minerals 12 00169 g003
Table 1. National Ambient Air Quality Standards PM10 µg/m3. Reproduced with permission from Republic of South African Government, National Environmental Management: Air Quality Act No. 39 of 2004: National Ambient Air Quality Standard, Government Gazette Vol 486 No.35463, published by (South African Government, Cape Town), (2004) [60].
SourceDaily Average (µg/m3)Annual Average (%)
South Africa7540
WHO5020
FRIDGE2515
Table 2. Morbidity dose-response functions used to quantify inhalation exposures per person to change in PM10 (µg/m3).
Health EffectFunctionPopulation SectorSource
Respiratory hospital admissions-daily exposures1.2 × 10−5
1.39 × 10⁻⁵
All personsOstro [4]
FRIDGE [61]
Respiratory symptoms1.83 × 101All personsOstro [4]
Restricted activity days (RAD)-annual average5.75 × 10−2AdultsOstro [4]
Restricted activity days (RAD)-daily exposures1.60 × 10−4AdultsRowe et al. [3]
Asthma attacks6.5 × 10−3AsthmaticsMaddison [82]
Cardiovascular hospital admissions-daily exposures1.01 × 10−7All personsDockery et al. [2]
Table 3. Health impacts as calculated for each health endpoint per area.
Health End PointPeriodHealth Impact WedelaHealth Impact Gold Mine Village
Respiratory hospital adminShort-term5.470.36
Cardiovascular hospital adminShort-term0.0460.0030
Restricted activity days (RAD)Short-term734.8
Asthma attacksShort-term29619.5
Respiratory symptomsShort-term83,470549
Table 4. Burden of disease owing to change in PM10.
Health EndpointGold Mine VillageGold Mine VillageWedelaWedela
Cost (R) and ($) with impact daily 75 µg/m3 (NAAQS)Cost (R) and ($) with impact daily 25 µg/m3 (FRIDGE)Cost (R) and ($) with impact daily 75 µg/m3 (NAAQS)Cost (R) and ($) with impact 25 µg/m3 (FRIDGE)
Asthma treatmentR 75,804
$939,534
1,195,909.753
R 833,847
$10,334,917
R 1,152,541
$14,284,893
R 3,457,624
$4,285,469
Respiratory illness private inpatient clientsR 9012
$111,697
R 99,130
$1,228,643
R 137,017
$1,698,224
R 411,051
$5,094,673
Respiratory illness public inpatient clientsR 6309
$78,195
R 69,395
$860,100
R 95,918
$1,188,833
R 287,753
$3,566,485
Respiratory illness private outpatient clientsR 954
$11,824
R 10,492
$130,041
R 14,502
$179,742
R 43,507
$539,237
Respiratory illness public outpatient clientsR 668
$8279
R 7349
$91,085
R 10,157
$125,888
R 30,472
$377,678
Restricted activity days (RAD)R 3742
$46,379
R 41,159
$510,135
R 4,053,399
$50,238,881
R 60,800,982
$753,583,179
Total (R)96,4881,061,3725,463,53465,031,388
Table 5. Health endpoints and their medical costs per case.
Health End PointCosts (R) and ($) Estimated for 2013Cost ($) from Other CountriesSource
Hospital admission (average length stay 4.37 days) privateR 23,740
$245,384
Beijing, China [89]
2705.81 (2011)
2761.04 (2012)
USA [89]
7600 (2012)
FRIDGE, [61]
Asthma treatment cost per annum (average length stay 6.9 days)R 1900
$19,638
Beijing, China [93]
346.13 (2011)
372.36 (2012)
USA [89]
3266 (2013)
FRIDGE, [61]
Respiratory illness Private inpatientsR 12,235
$126,462
USA [89]
393 (2013)
FRIDGE, [61]
Publisher’s Note: MDPI stays neutral with regard to jurisdictional claims in published maps and institutional affiliations.

