
Integrative Study Assessing Space and Time Variations with Emphasis on Rare Earth Element (REE) Distribution and Their Potential on Ashes from Commercial (Colombian) Coal


Abstract
:1. Introduction
2. Materials and Methods
2.1. Samples
2.2. Analytical Methodologies
2.2.1. Chemical Analysis
2.2.2. X-ray Diffraction (XRD)
2.2.3. Petrography
2.2.4. Scanning Electron Microscopy and Energy-Dispersive X-ray Spectroscopy (SEM/EDS)
2.2.5. Laser Diffraction
2.2.6. Physical Separations
2.2.7. REE Classification, Patterns, and Anomalies
3. Results
3.1. General Characterization
3.1.1. Feed Coals
3.1.2. Coal Combustion Ashes
3.2. Rare Earth Elements and Other Refractory Elements in Feed Coals and Respective Ashes
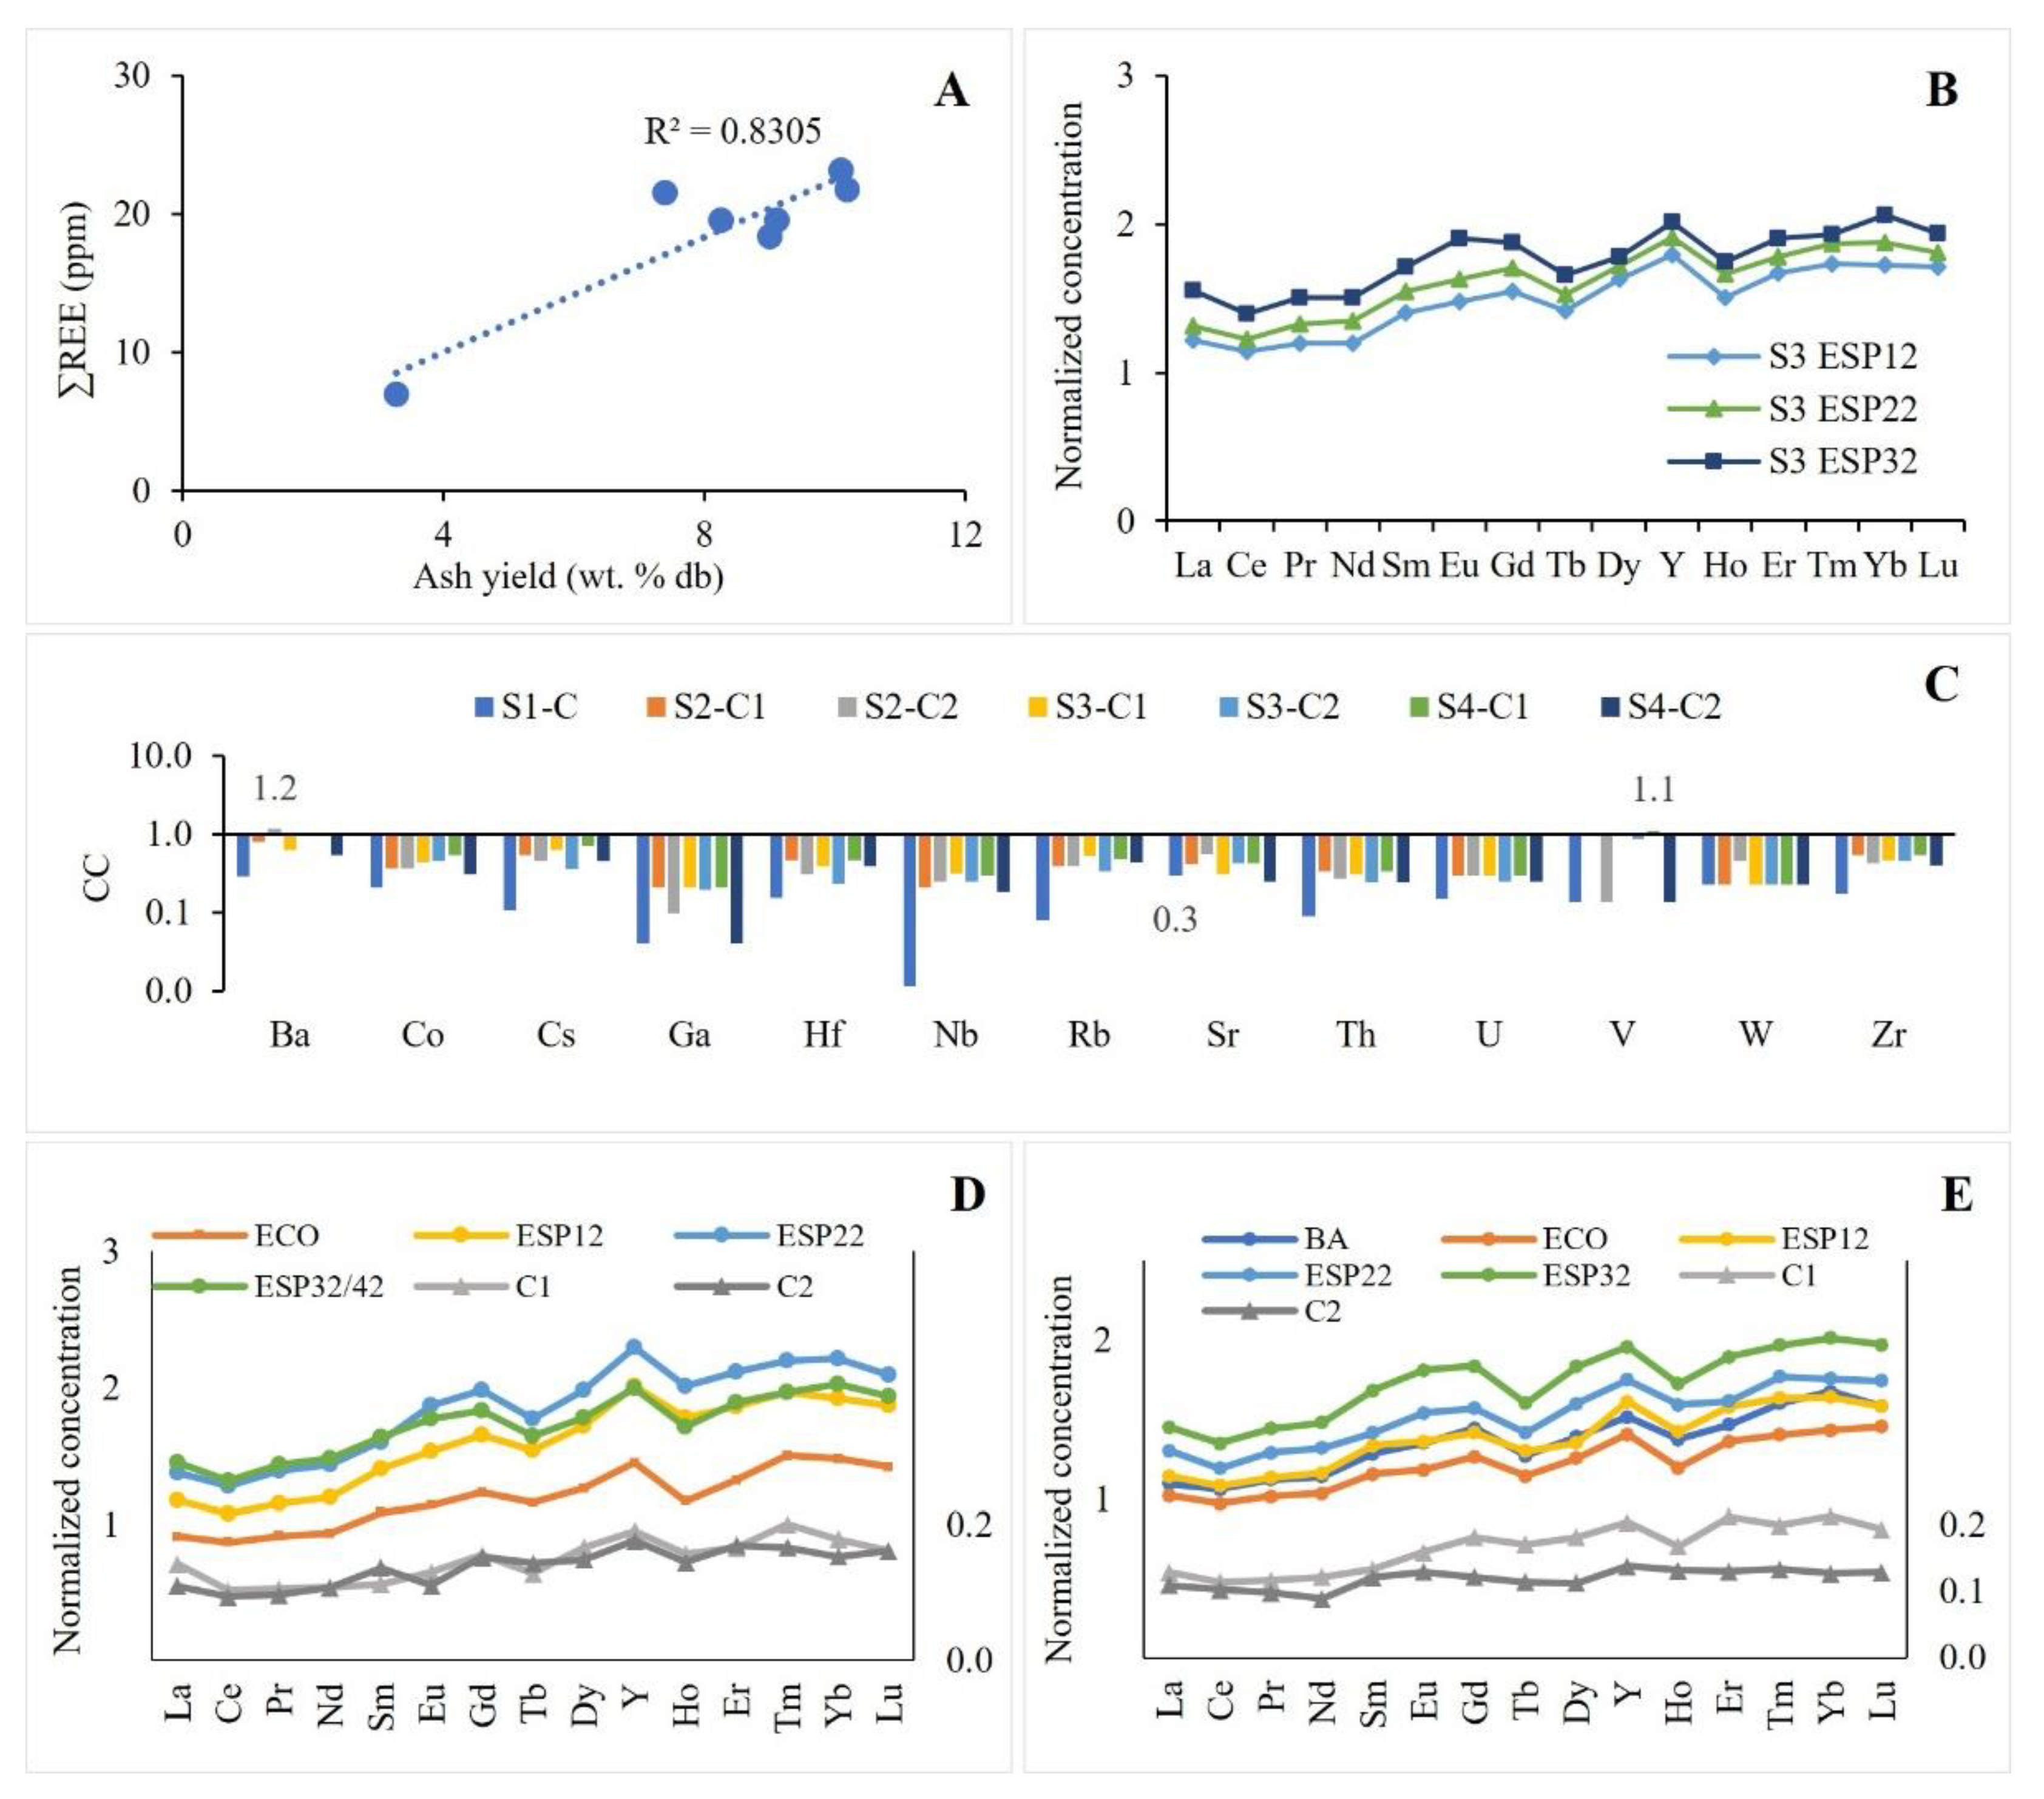
3.2.1. Contents, Distribution, and Partitioning
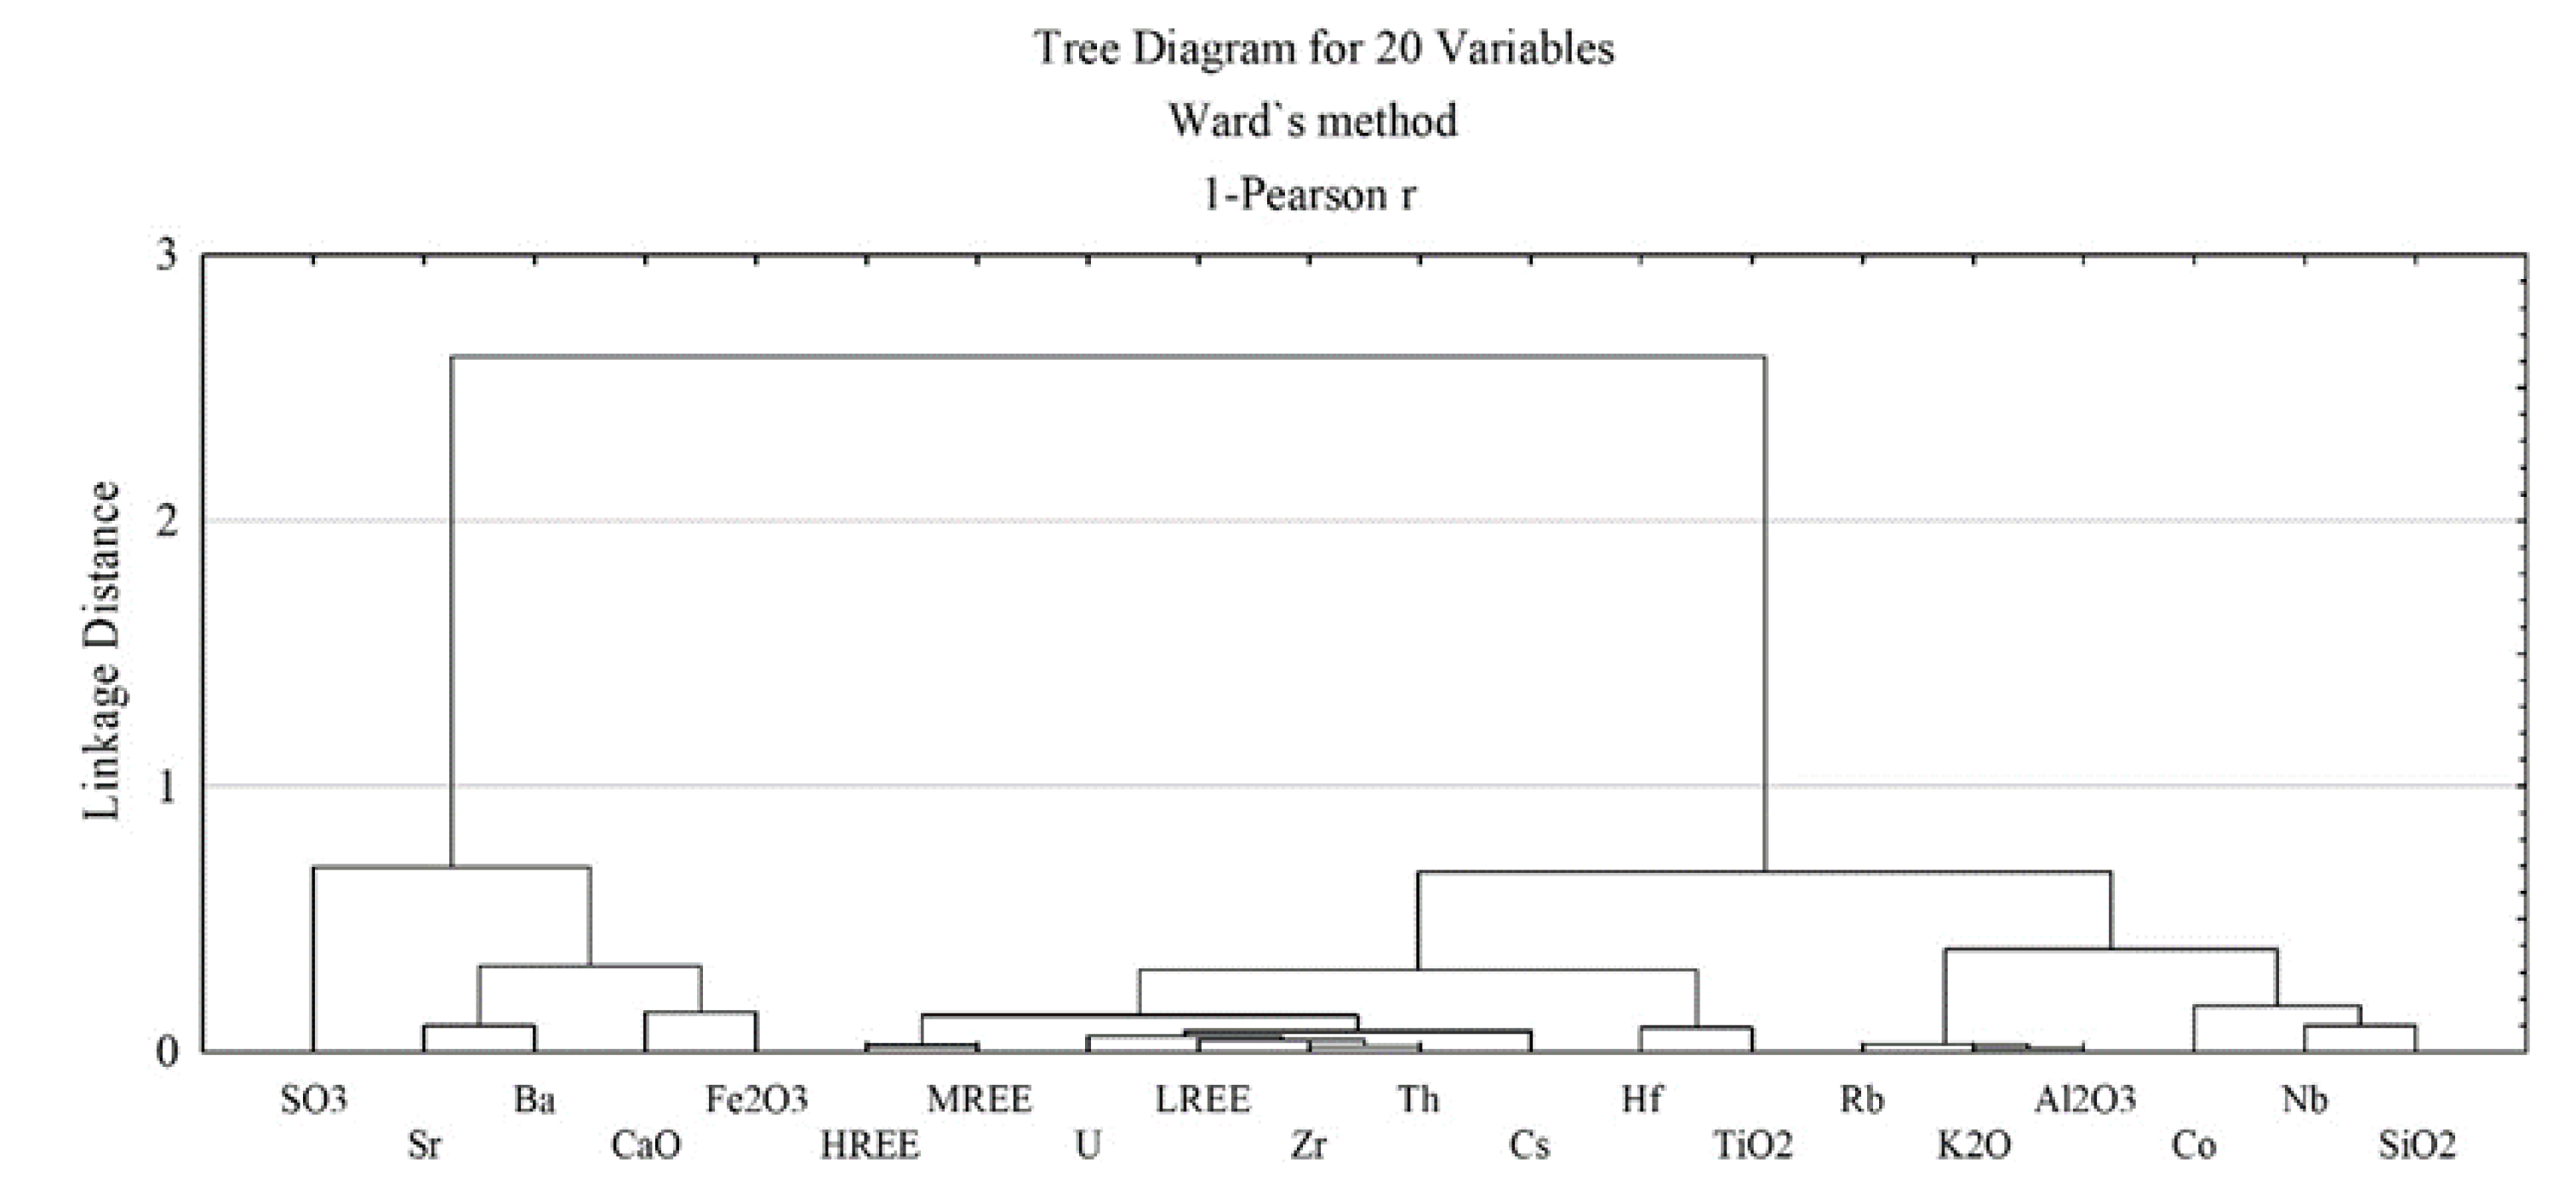
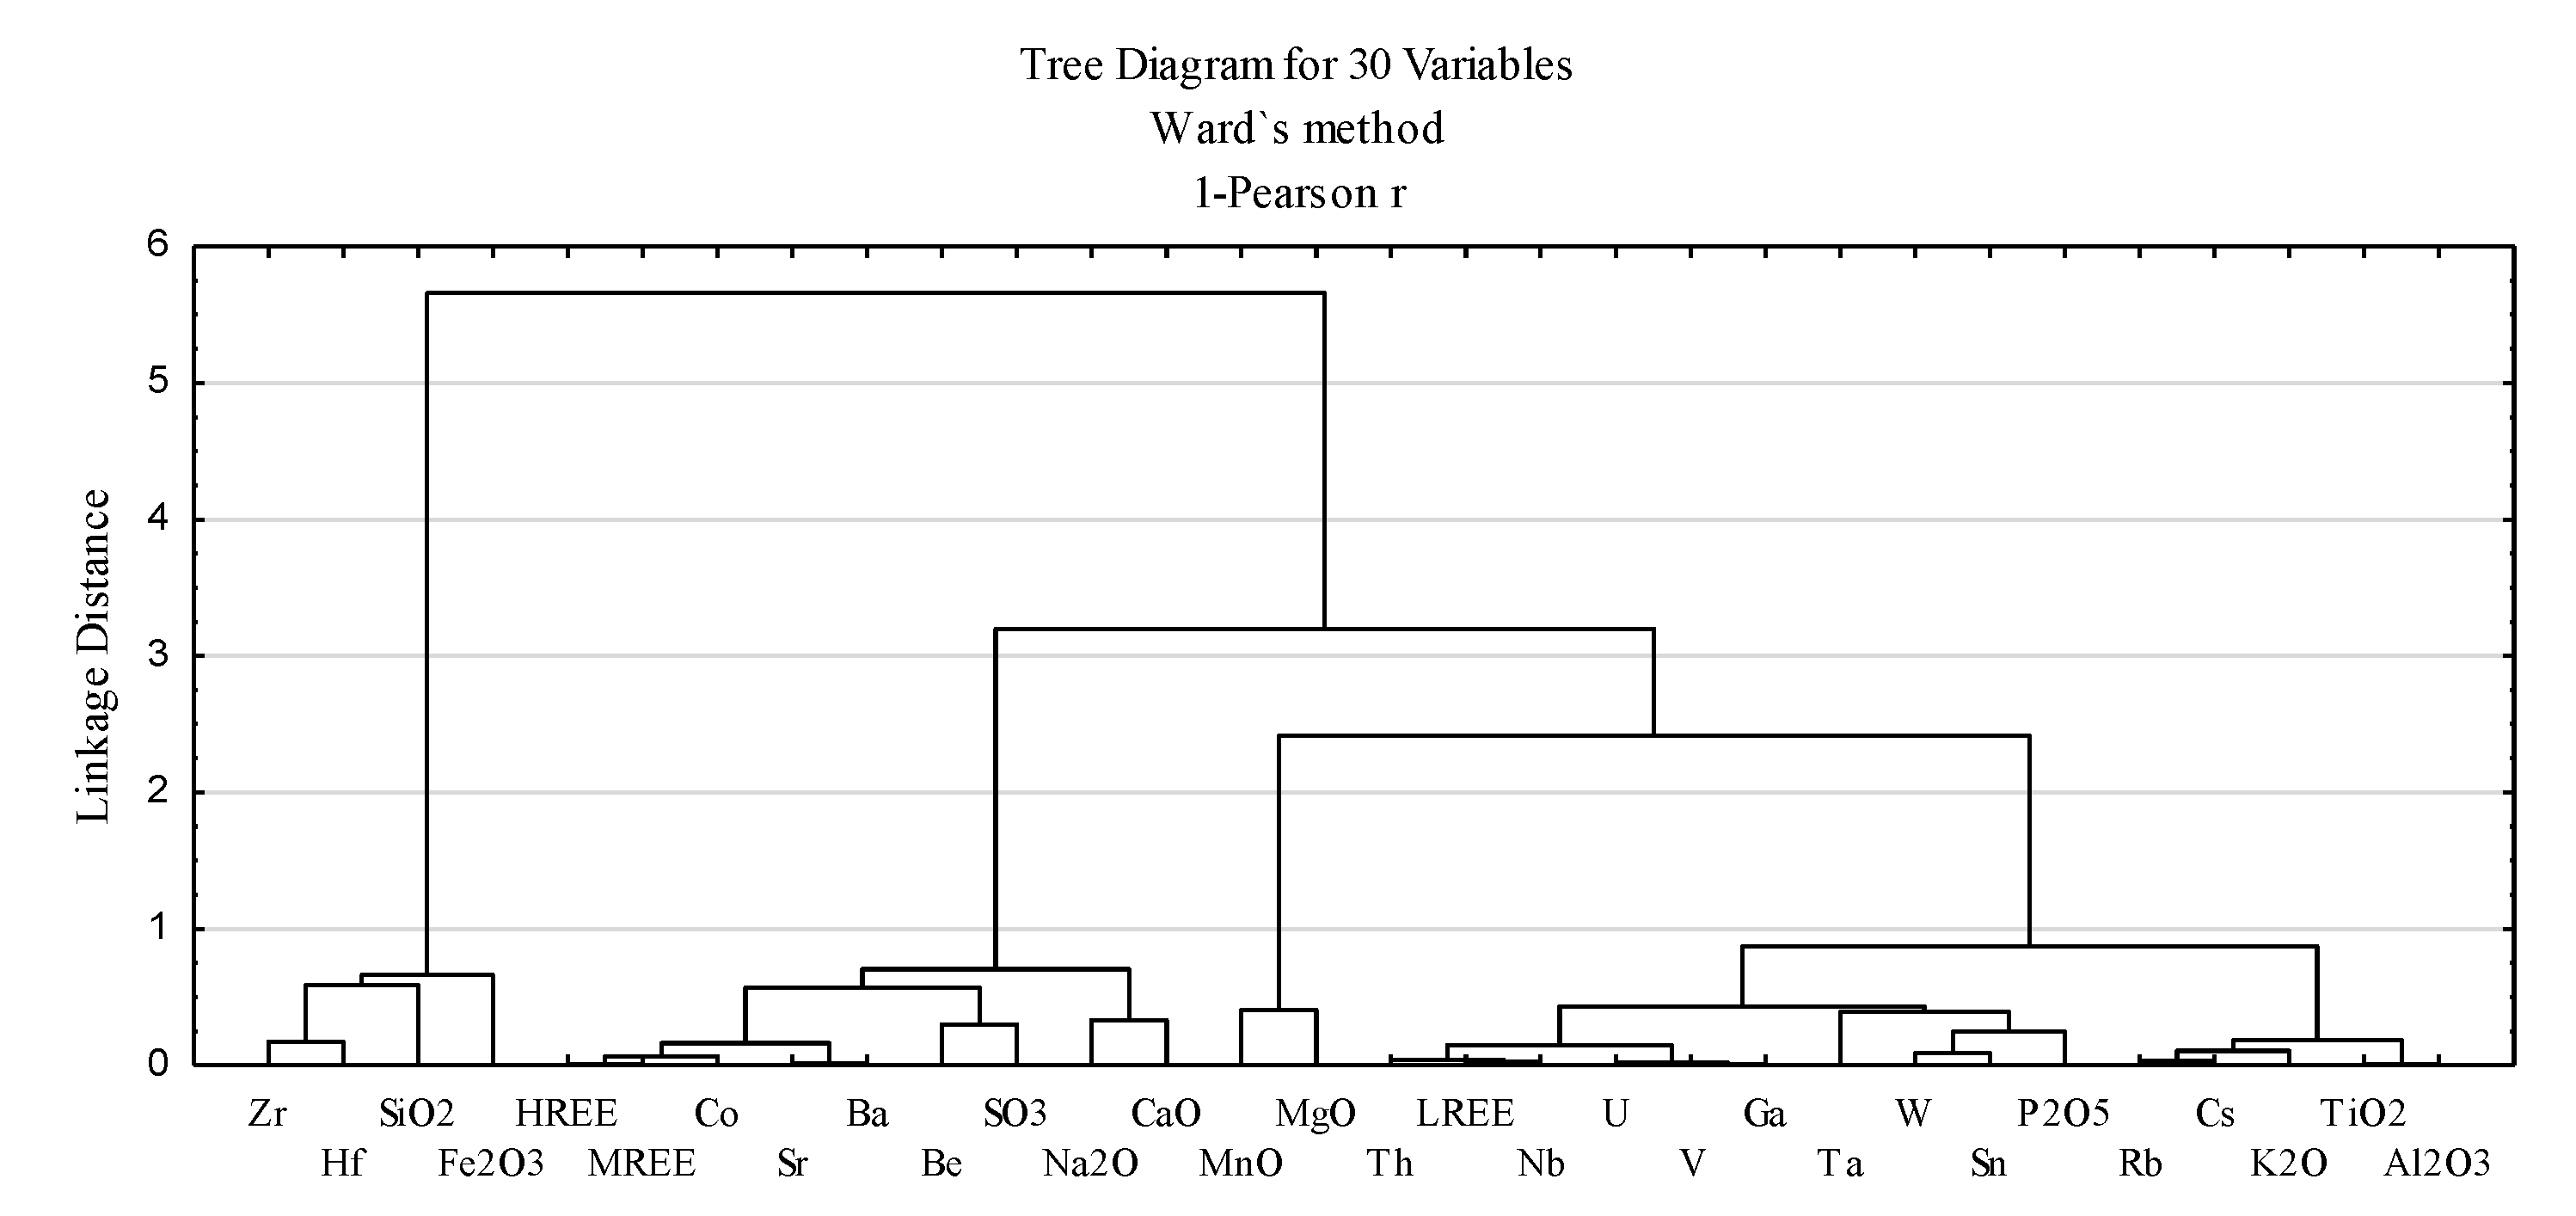
3.2.2. Geochemical Associations
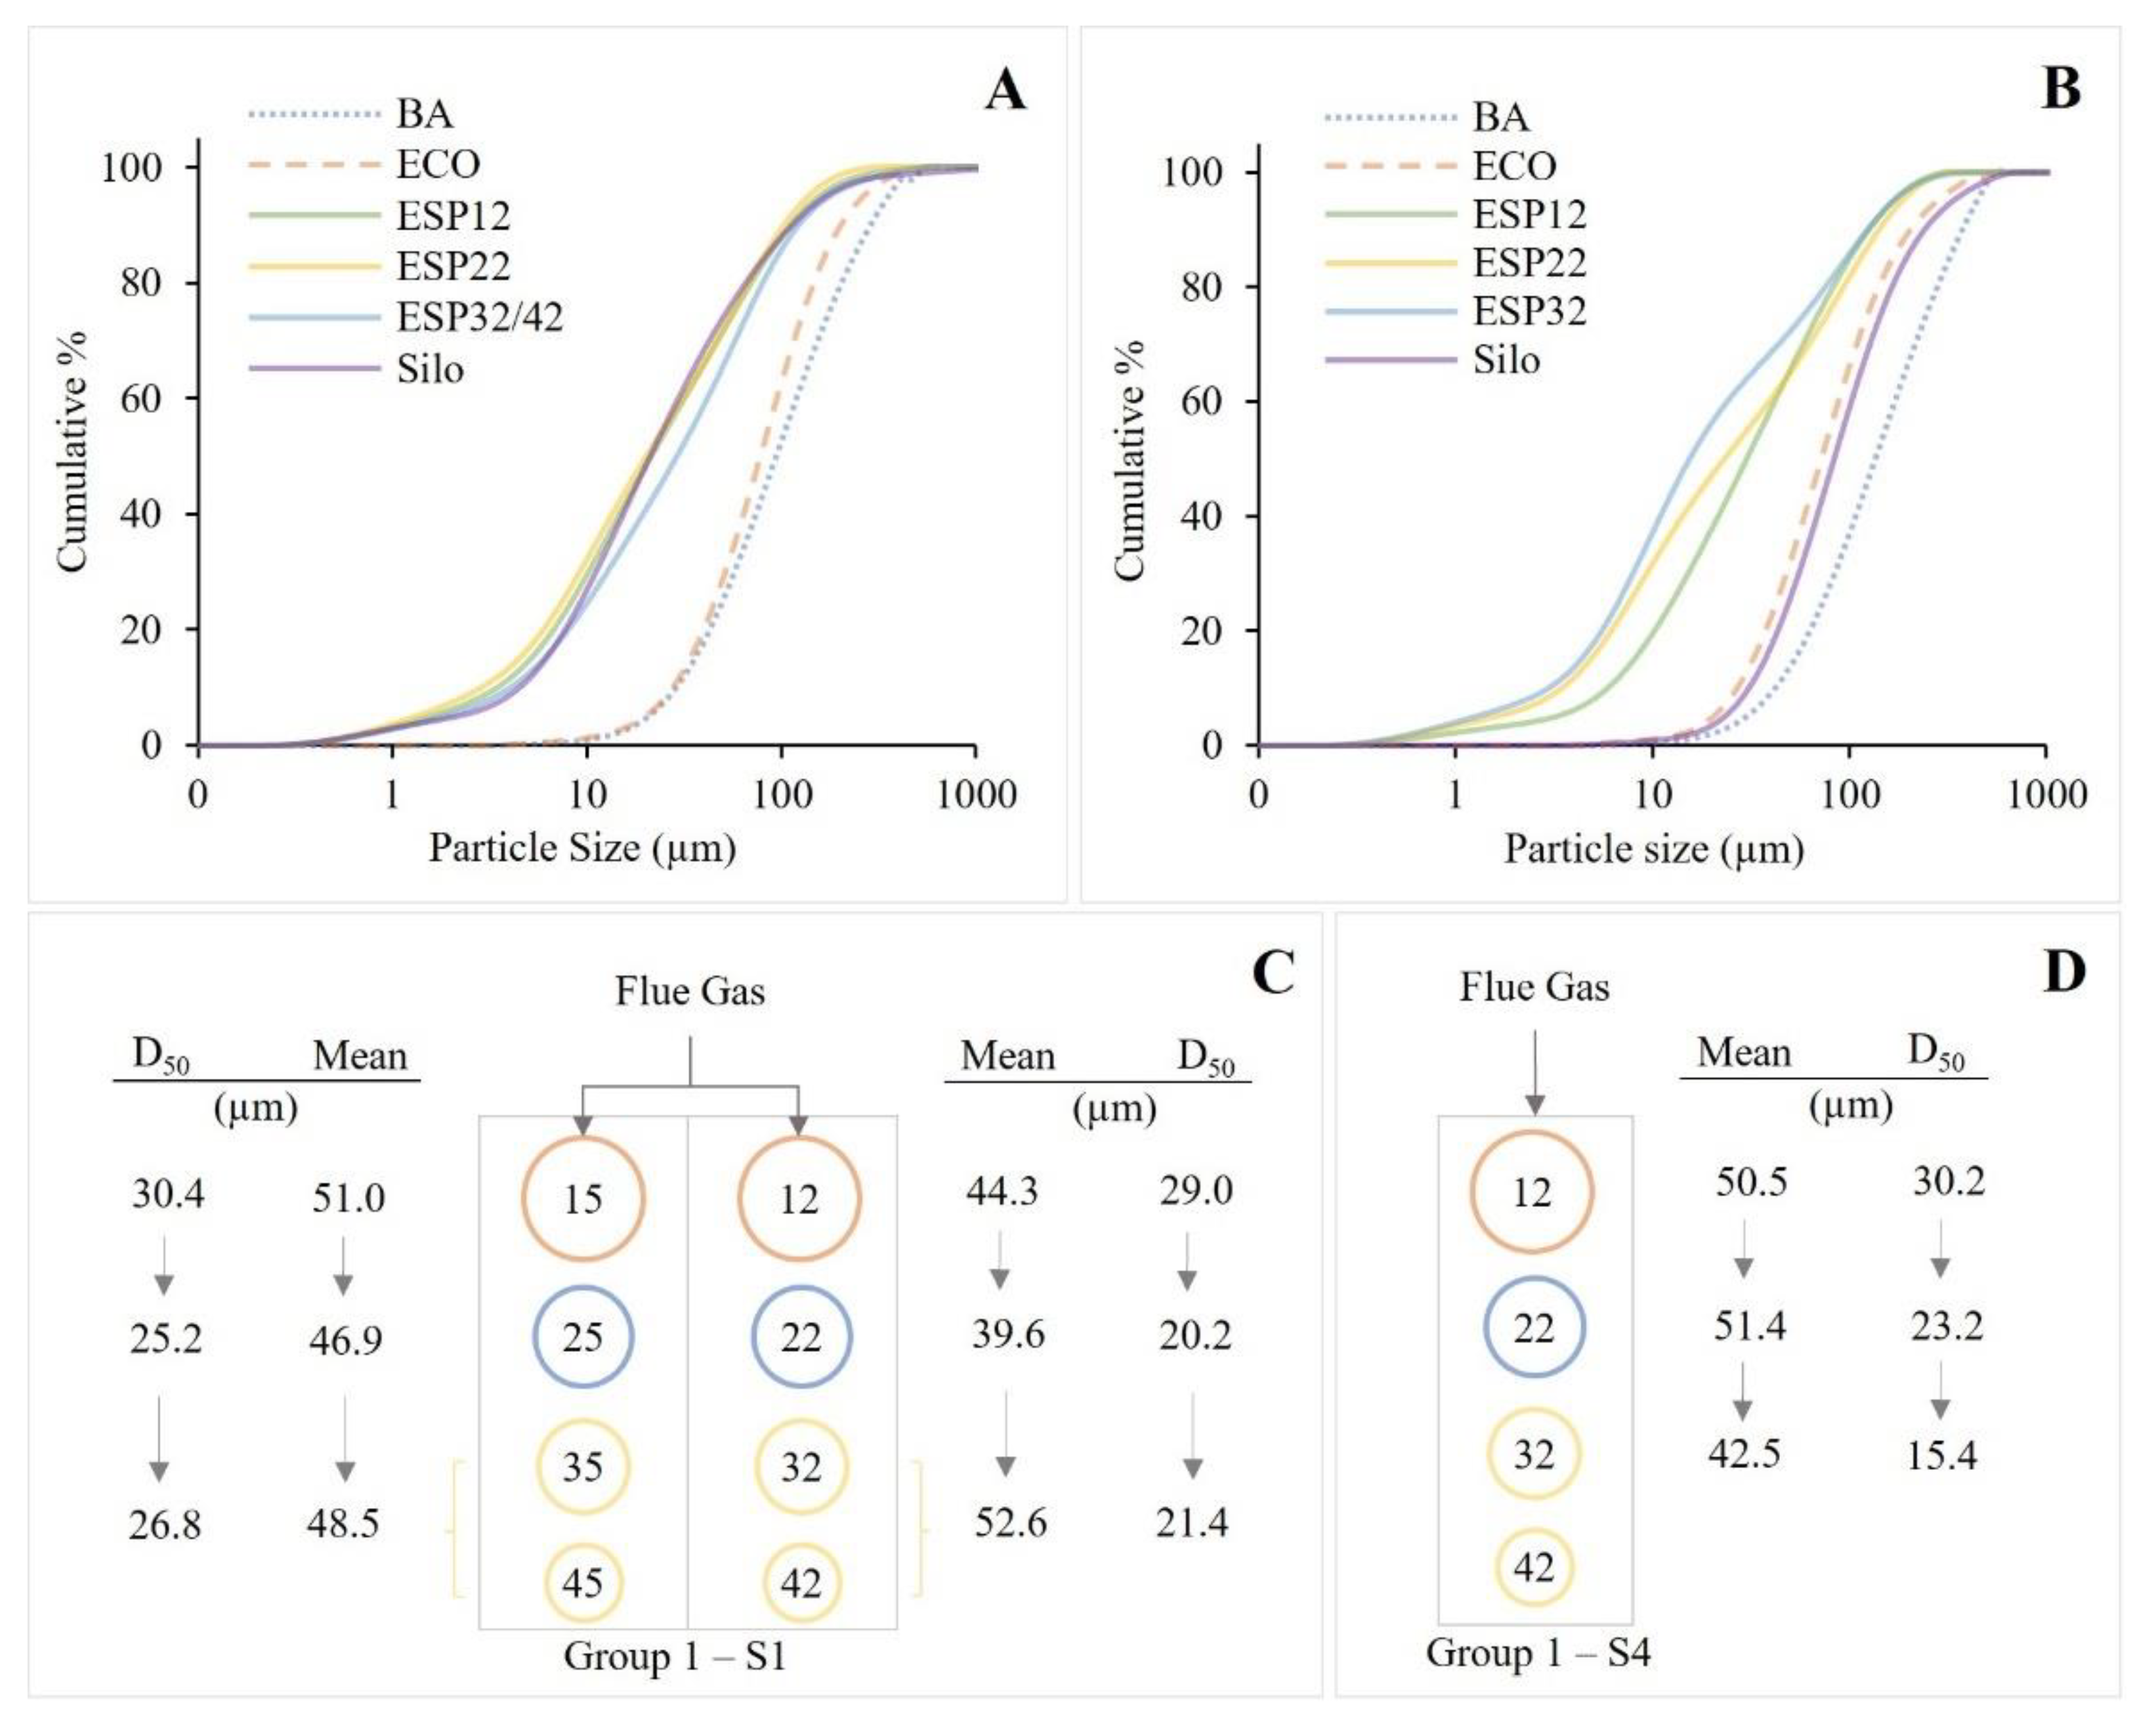
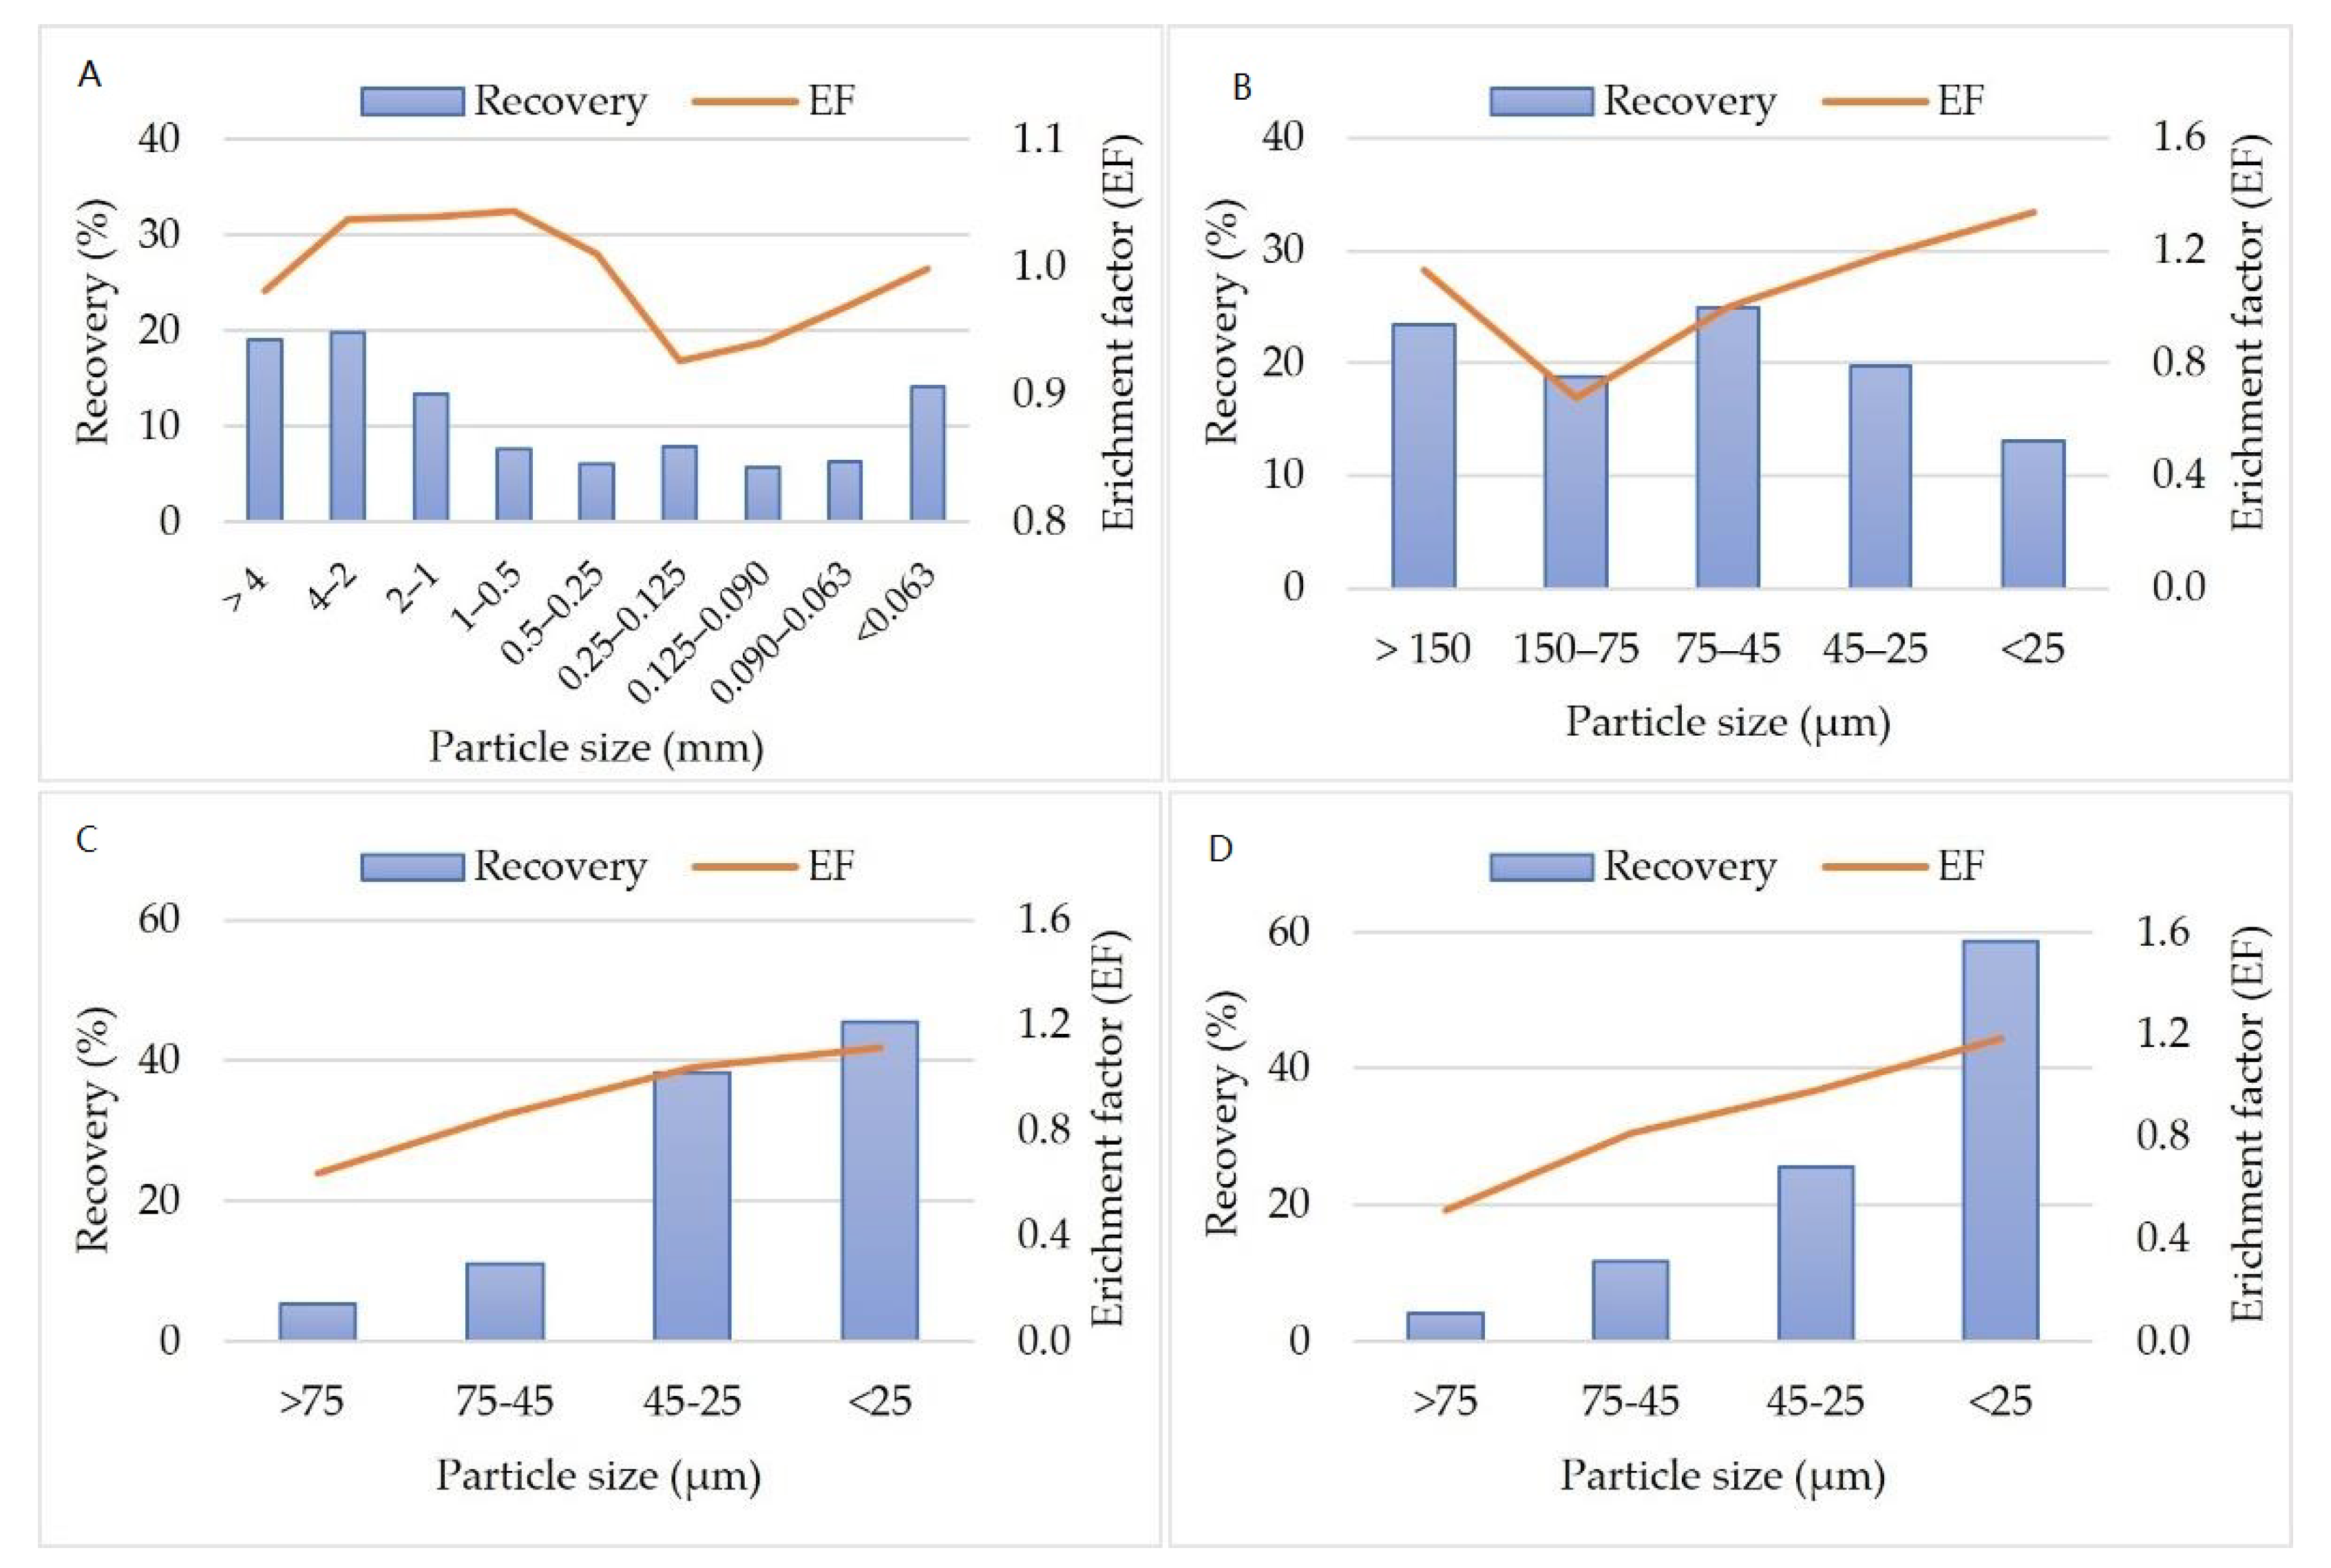
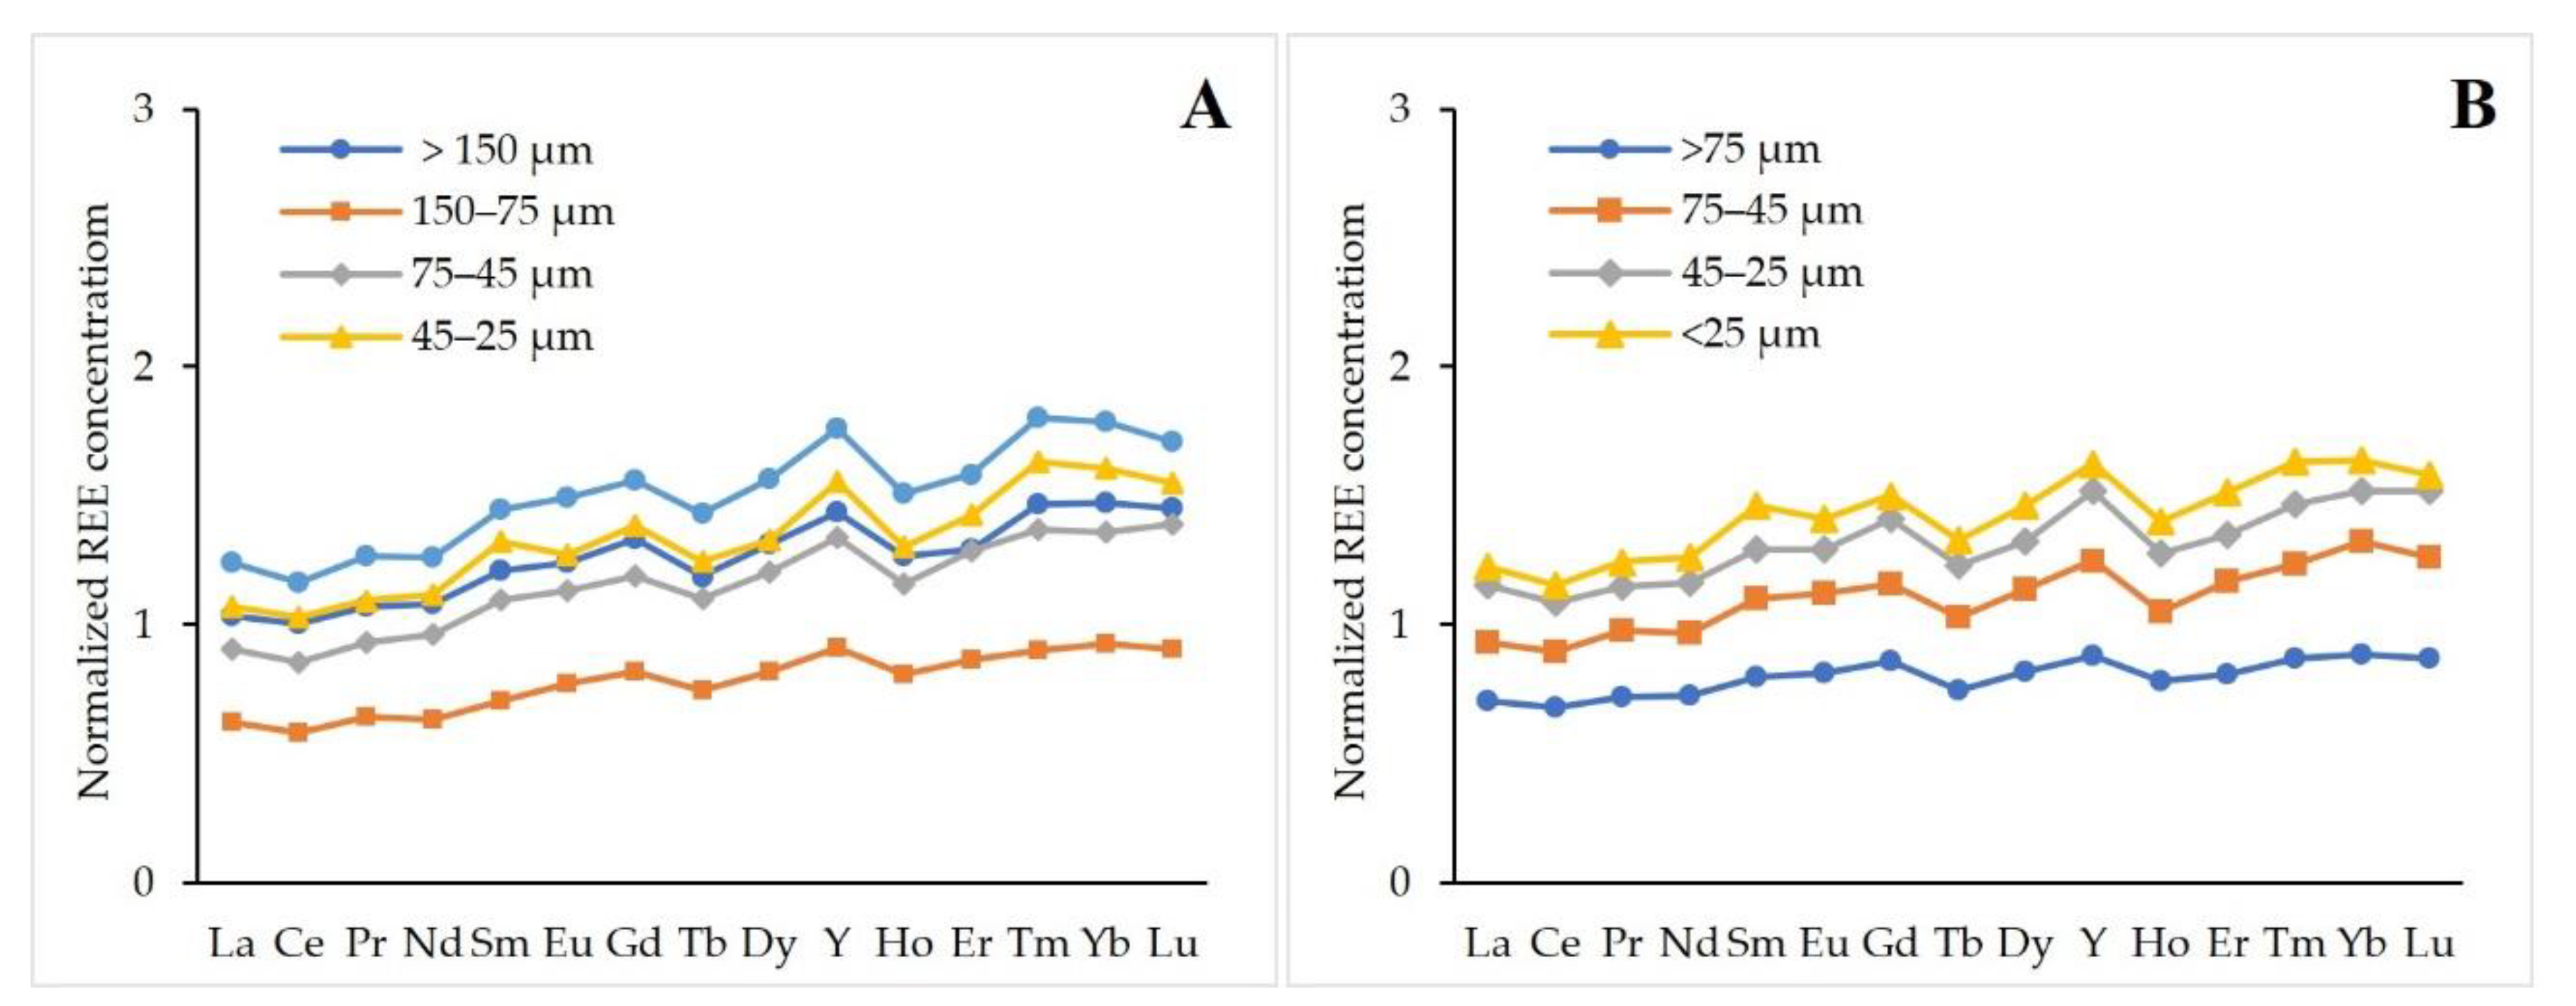
3.2.3. Particle Size and Magnetic Fractions
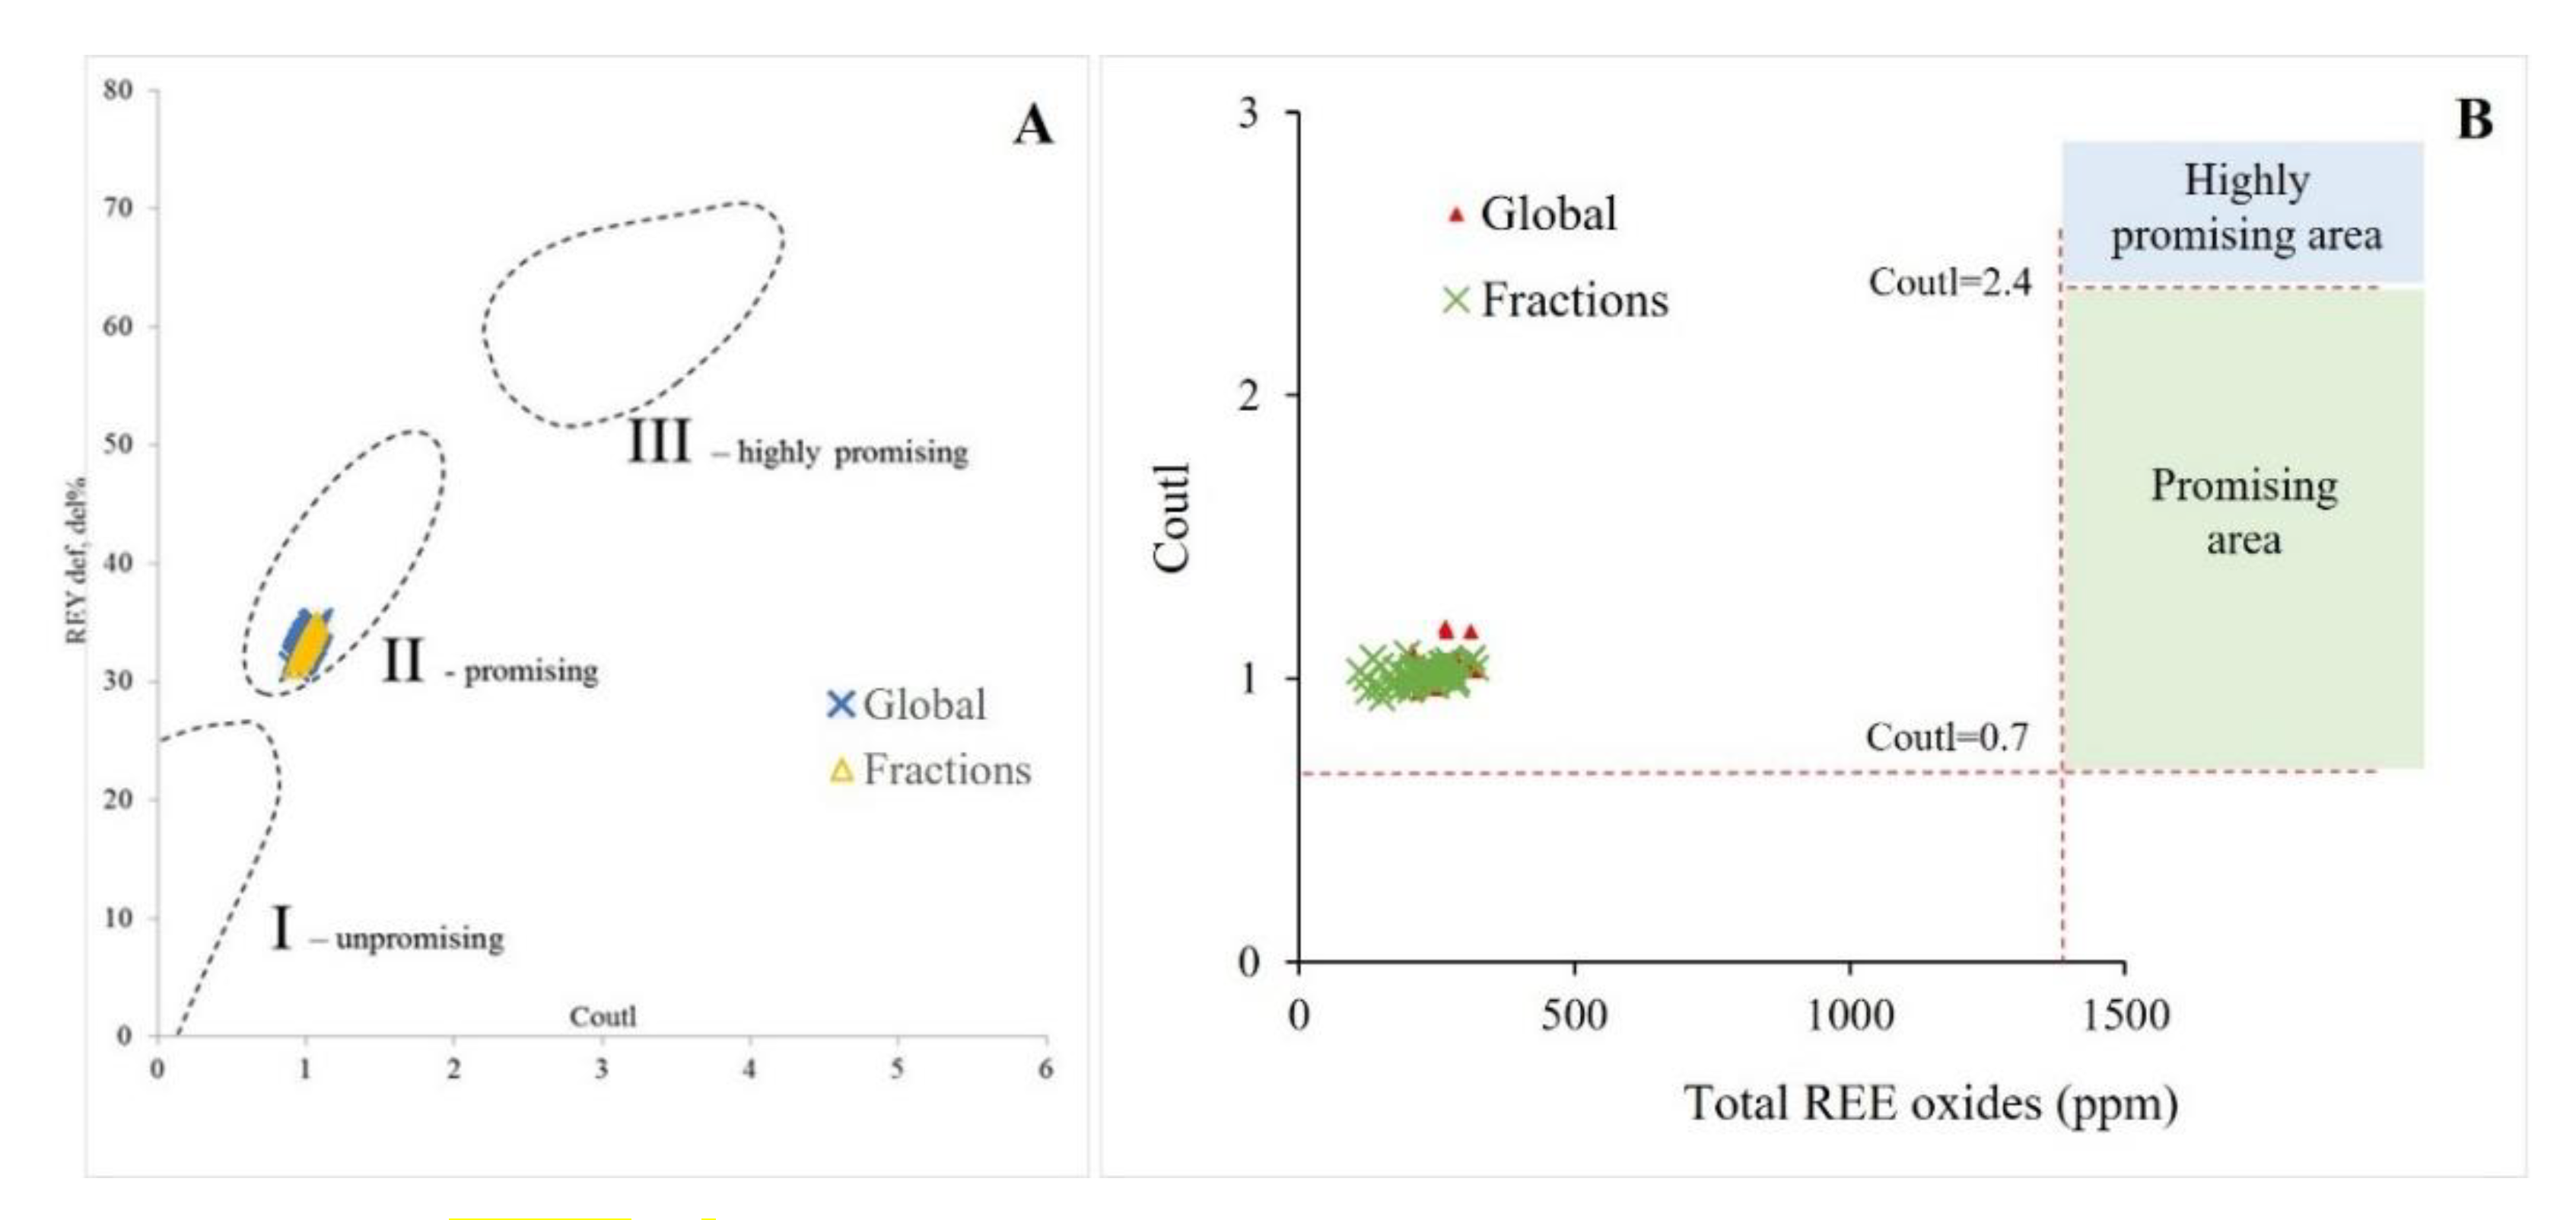
3.2.4. Preliminary Evaluation of REE Potential
4. Conclusions
Supplementary Materials
Author Contributions
Funding
Data Availability Statement
Acknowledgments
Conflicts of Interest
References
- Connelly, N.G.; Damhus, T.; Hartshorn, R.M.; Hutton, A.T. Nomenclature of Inorganic Chemistry; Royal Society of Chemistry (Great Britain); International Union of Pure and Applied Chemistry; Royal Society of Chemistry: London, UK, 2005; ISBN 978-0-85404-438-2. [Google Scholar]
- Haque, N.; Hughes, A.; Lim, S.; Vernon, C. Rare Earth Elements: Overview of Mining, Mineralogy, Uses, Sustainability and Environmental Impact. Resources 2014, 3, 614–635. [Google Scholar] [CrossRef] [Green Version]
- Silvestri, L.; Forcina, A.; Silvestri, C.; Traverso, M. Circularity Potential of Rare Earths for Sustainable Mobility: Recent Developments, Challenges and Future Prospects. J. Clean. Prod. 2021, 292, 126089. [Google Scholar] [CrossRef]
- Wang, Z.; Dai, S.; Zou, J.; French, D.; Graham, I.T. Rare Earth Elements and Yttrium in Coal Ash from the Luzhou Power Plant in Sichuan, Southwest China: Concentration, Characterization and Optimized Extraction. Int. J. Coal Geol. 2019, 203, 1–14. [Google Scholar] [CrossRef]
- European Comission (EC). Critical Raw Materials Resilience: Charting a Path towards Greater Security and Sustainability; European Comission: Brussels, Belgium, 2020. [Google Scholar]
- European Comission (EC). Tackling the Challenges in Commodity Markets and on Raw Materials; European Comission: Brussels, Belgium, 2011. [Google Scholar]
- Bauer, D.; Diamond, D.; Li, J.; Sandalow, D.; Telleen, P.; Wanner, B.U.S. Department of Energy Critical Materials Strategy; U.S. Department of Energy: Washington, DC, USA, 2010. [Google Scholar] [CrossRef] [Green Version]
- Alonso, E.; Sherman, A.M.; Wallington, T.J.; Everson, M.P.; Field, F.R.; Roth, R.; Kirchain, R.E. Evaluating Rare Earth Element Availability: A Case with Revolutionary Demand from Clean Technologies. Environ. Sci. Technol. 2012, 46, 3406–3414. [Google Scholar] [CrossRef] [PubMed]
- Tang, M.; Zhou, C.; Zhang, N.; Pan, J.; Cao, S.; Hu, T.; Ji, W.; Wen, Z.; Nie, T. Extraction of Rare Earth Elements from Coal Fly Ash by Alkali Fusion–Acid Leaching: Mechanism Analysis. Int. J. Coal Prep. Util. 2019, 1–20. [Google Scholar] [CrossRef]
- Massari, S.; Ruberti, M. Rare Earth Elements as Critical Raw Materials: Focus on International Markets and Future Strategies. Resour. Policy 2013, 38, 36–43. [Google Scholar] [CrossRef]
- Dai, S.; Finkelman, R.B. Coal as a Promising Source of Critical Elements: Progress and Future Prospects. Int. J. Coal Geol. 2018, 186, 155–164. [Google Scholar] [CrossRef]
- Franus, W.; Wiatros-Motyka, M.M.; Wdowin, M. Coal Fly Ash as a Resource for Rare Earth Elements. Environ. Sci. Pollut. Res. 2015, 22, 9464–9474. [Google Scholar] [CrossRef] [PubMed] [Green Version]
- Hower, J.C.; Dai, S.; Seredin, V.V.; Zhao, L.; Kostova, I.J.; Silva, L.F.O.; Mardon, S.M.; Gurdal, G. A Note on the Occurrence of Yttrium and Rare Earth Elements in Coal Combustion Products. Coal Combust. Gasif. Prod. 2013, 5, 39–47. [Google Scholar] [CrossRef]
- Hower, J.; Groppo, J.; Henke, K.; Hood, M.; Eble, C.; Honaker, R.; Zhang, W.; Qian, D. Notes on the Potential for the Concentration of Rare Earth Elements and Yttrium in Coal Combustion Fly Ash. Minerals 2015, 5, 356–366. [Google Scholar] [CrossRef] [Green Version]
- Hower, J.C.; Groppo, J.G.; Henke, K.R.; Graham, U.M.; Hood, M.M.; Joshi, P.; Preda, D.V. Ponded and Landfilled Fly Ash as a Source of Rare Earth Elements from a Kentucky Power Plant. Coal Combust. Gasif. Prod. 2017, 9, 1–21. [Google Scholar] [CrossRef]
- Blissett, R.S.; Smalley, N.; Rowson, N.A. An Investigation into Six Coal Fly Ashes from the United Kingdom and Poland to Evaluate Rare Earth Element Content. Fuel 2014, 119, 236–239. [Google Scholar] [CrossRef] [Green Version]
- Dai, S.; Zhao, L.; Hower, J.C.; Johnston, M.N.; Song, W.; Wang, P.; Zhang, S. Petrology, Mineralogy, and Chemistry of Size-Fractioned Fly Ash from the Jungar Power Plant, Inner Mongolia, China, with Emphasis on the Distribution of Rare Earth Elements. Energy Fuels 2014, 28, 1502–1514. [Google Scholar] [CrossRef]
- Seredin, V.V.; Dai, S. Coal Deposits as Potential Alternative Sources for Lanthanides and Yttrium. Int. J. Coal Geol. 2012, 94, 67–93. [Google Scholar] [CrossRef]
- Taggart, R.K.; Hower, J.C.; Dwyer, G.S.; Hsu-Kim, H. Trends in the Rare Earth Element Content of U.S.-Based Coal Combustion Fly Ashes. Environ. Sci. Technol. 2016, 50, 5919–5926. [Google Scholar] [CrossRef] [PubMed]
- Hood, M.M.; Taggart, R.K.; Smith, R.C.; Hsu-Kim, H.; Henke, K.R.; Graham, U.; Groppo, J.G.; Unrine, J.M.; Hower, J.C. Rare Earth Element Distribution in Fly Ash Derived from the Fire Clay Coal, Kentucky. Coal Combust. Gasif. Prod. 2017, 9, 22–33. [Google Scholar] [CrossRef]
- Rosita, W.; Bendiyasa, I.M.; Perdana, I.; Anggara, F. Sequential Particle-Size and Magnetic Separation for Enrichment of Rare-Earth Elements and Yttrium in Indonesia Coal Fly Ash. J. Environ. Chem. Eng. 2020, 8, 103575. [Google Scholar] [CrossRef]
- Lin, R.; Howard, B.H.; Roth, E.A.; Bank, T.L.; Granite, E.J.; Soong, Y. Enrichment of Rare Earth Elements from Coal and Coal By-Products by Physical Separations. Fuel 2017, 200, 506–520. [Google Scholar] [CrossRef] [Green Version]
- Liu, J.; Dai, S.; He, X.; Hower, J.C.; Sakulpitakphon, T. Size-Dependent Variations in Fly Ash Trace Element Chemistry: Examples from a Kentucky Power Plant and with Emphasis on Rare Earth Elements. Energy Fuels 2017, 31, 438–447. [Google Scholar] [CrossRef]
- Lin, R.; Stuckman, M.; Howard, B.H.; Bank, T.L.; Roth, E.A.; Macala, M.K.; Lopano, C.; Soong, Y.; Granite, E.J. Application of Sequential Extraction and Hydrothermal Treatment for Characterization and Enrichment of Rare Earth Elements from Coal Fly Ash. Fuel 2018, 232, 124–133. [Google Scholar] [CrossRef]
- Kose Mutlu, B.; Cantoni, B.; Turolla, A.; Antonelli, M.; Hsu-Kim, H.; Wiesner, M.R. Application of Nanofiltration for Rare Earth Elements Recovery from Coal Fly Ash Leachate: Performance and Cost Evaluation. Chem. Eng. J. 2018, 349, 309–317. [Google Scholar] [CrossRef]
- Pan, J.; Zhou, C.; Liu, C.; Tang, M.; Cao, S.; Hu, T.; Ji, W.; Luo, Y.; Wen, M.; Zhang, N. Modes of Occurrence of Rare Earth Elements in Coal Fly Ash: A Case Study. Energy Fuels 2018, 32, 9738–9743. [Google Scholar] [CrossRef]
- Stuckman, M.Y.; Lopano, C.L.; Granite, E.J. Distribution and Speciation of Rare Earth Elements in Coal Combustion By-Products via Synchrotron Microscopy and Spectroscopy. Int. J. Coal Geol. 2018, 195, 125–138. [Google Scholar] [CrossRef]
- Wagner, N.J.; Matiane, A. Rare Earth Elements in Select Main Karoo Basin (South Africa) Coal and Coal Ash Samples. Int. J. Coal Geol. 2018, 196, 82–92. [Google Scholar] [CrossRef]
- Thompson, R.L.; Bank, T.; Montross, S.; Roth, E.; Howard, B.; Verba, C.; Granite, E. Analysis of Rare Earth Elements in Coal Fly Ash Using Laser Ablation Inductively Coupled Plasma Mass Spectrometry and Scanning Electron Microscopy. Spectrochim. Acta Part B At. Spectrosc. 2018, 143, 1–11. [Google Scholar] [CrossRef]
- Park, S.; Kim, M.; Lim, Y.; Yu, J.; Chen, S.; Woo, S.W.; Yoon, S.; Bae, S.; Kim, H.S. Characterization of Rare Earth Elements Present in Coal Ash by Sequential Extraction. J. Hazard. Mater. 2021, 402, 123760. [Google Scholar] [CrossRef] [PubMed]
- Ketris, M.P.; Yudovich, Y.E. Estimations of Clarkes for Carbonaceous Biolithes: World Averages for Trace Element Contents in Black Shales and Coals. Int. J. Coal Geol. 2009, 78, 135–148. [Google Scholar] [CrossRef]
- Rudnick, R.L.; Gao, S. Composition of the Continental Crust. In Treatise on Geochemistry; Holland, H.D., Turekian, K.K., Eds.; Elsevier: Amsterdam, The Netherlands, 2014; pp. 1–51. ISBN 9780080983004. [Google Scholar]
- Seredin, V.V. Rare Earth Element-Bearing Coals from the Russian Far East Deposits. Int. J. Coal Geol. 1996, 30, 101–129. [Google Scholar] [CrossRef]
- Hower, J.C.; Ruppert, L.F.; Eble, C.F. Lanthanide, Yttrium, and Zirconium Anomalies in the Fire Clay Coal Bed, Eastern Kentucky. Int. J. Coal Geol. 1999, 39, 141–153. [Google Scholar] [CrossRef]
- Hower, J.C.; Eble, C.F.; Dai, S.; Belkin, H.E. Distribution of Rare Earth Elements in Eastern Kentucky Coals: Indicators of Multiple Modes of Enrichment? Int. J. Coal Geol. 2016, 160–161, 73–81. [Google Scholar] [CrossRef]
- Dai, S.; Liu, J.; Ward, C.R.; Hower, J.C.; French, D.; Jia, S.; Hood, M.M.; Garrison, T.M. Mineralogical and Geochemical Compositions of Late Permian Coals and Host Rocks from the Guxu Coalfield, Sichuan Province, China, with Emphasis on Enrichment of Rare Metals. Int. J. Coal Geol. 2016, 166, 71–95. [Google Scholar] [CrossRef]
- International Energy Agency (IEA). Coal 2020; IEA Publications: Paris, France, 2020. [Google Scholar]
- Clarke, L.B.; Sloss, L.L. Trace Elements: Emissions from Coal Combustion and Gasification; IEA Coal Research: London, UK, 1992; ISBN 9290292040. [Google Scholar]
- Meij, R. The Distribution of Trace Elements During the Combustion of Coal. In Environmental Aspects of Trace Elements in Coal. Energy & Environment; Swaine, D.J., Goodarzi, F., Eds.; Springer: Dordrecht, The Netherlands, 1995; Volume 2, pp. 111–127. ISBN 978-90-481-4606-2. [Google Scholar]
- Ratafia-Brown, J.A. Overview of Trace Element Partitioning in Flames and Furnaces of Utility Coal-Fired Boilers. Fuel Process. Technol. 1994, 39, 139–157. [Google Scholar] [CrossRef]
- Fu, B.; Hower, J.C.; Zhang, W.; Luo, G.; Hu, H.; Yao, H. A Review of Rare Earth Elements and Yttrium in Coal Ash: Content, Modes of Occurrences, Combustion Behavior, and Extraction Methods. Prog. Energy Combust. Sci. 2022, 88, 100954. [Google Scholar] [CrossRef]
- Dai, S.; Zhao, L.; Peng, S.; Chou, C.-L.; Wang, X.; Zhang, Y.; Li, D.; Sun, Y. Abundances and Distribution of Minerals and Elements in High-Alumina Coal Fly Ash from the Jungar Power Plant, Inner Mongolia, China. Int. J. Coal Geol. 2010, 81, 320–332. [Google Scholar] [CrossRef]
- Ma, Z.; Shan, X.; Cheng, F. Distribution Characteristics of Valuable Elements, Al, Li, and Ga, and Rare Earth Elements in Feed Coal, Fly Ash, and Bottom Ash from a 300 MW Circulating Fluidized Bed Boiler. ACS Omega 2019, 4, 6854–6863. [Google Scholar] [CrossRef] [PubMed]
- Wei, Q.; Song, W. Mineralogical and Chemical Characteristics of Coal Ashes from Two High-Sulfur Coal-Fired Power Plants in Wuhai, Inner Mongolia, China. Minerals 2020, 10, 323. [Google Scholar] [CrossRef] [Green Version]
- Lanzerstorfer, C. Fly Ash from Coal Combustion: Dependence of the Concentration of Various Elements on the Particle Size. Fuel 2018, 228, 263–271. [Google Scholar] [CrossRef]
- Hower, J.C.; Hood, M.M.; Taggart, R.K.; Hsu-Kim, H. Chemistry and Petrology of Paired Feed Coal and Combustion Ash from Anthracite-Burning Stoker Boilers. Fuel 2017, 199, 438–446. [Google Scholar] [CrossRef] [Green Version]
- Mardon, S.M.; Hower, J.C. Impact of Coal Properties on Coal Combustion By-Product Quality: Examples from a Kentucky Power Plant. Int. J. Coal Geol. 2004, 59, 153–169. [Google Scholar] [CrossRef]
- Hower, J.C.; Fu, B.; Dai, S. Geochemical Partitioning from Pulverized Coal to Fly Ash and Bottom Ash. Fuel 2020, 279, 118542. [Google Scholar] [CrossRef]
- Campbell, J.A.; Laul, J.C.; Nielson, K.K.; Smith, R.D. Separation and Chemical Characterization of Finely-Sized Fly-Ash Particles. Anal. Chem. 1978, 50, 1032–1040. [Google Scholar] [CrossRef]
- Seredin, V.V. A New Method for Primary Evaluation of the Outlook for Rare Earth Element Ores. Geol. Ore Depos. 2010, 52, 428–433. [Google Scholar] [CrossRef]
- Dai, S.; Xie, P.; Jia, S.; Ward, C.R.; Hower, J.C.; Yan, X.; French, D. Enrichment of U-Re-V-Cr-Se and Rare Earth Elements in the Late Permian Coals of the Moxinpo Coalfield, Chongqing, China: Genetic Implications from Geochemical and Mineralogical Data. Ore Geol. Rev. 2017, 80, 1–17. [Google Scholar] [CrossRef]
- McLellan, B.; Corder, G.; Ali, S. Sustainability of Rare Earths—An Overview of the State of Knowledge. Minerals 2013, 3, 304–317. [Google Scholar] [CrossRef]
- Harris, D.; Feuerborn, J.; Heidrich, C.; Feuerborn Kurzfassung, J. Global Aspects on Coal Combustion Products. In Proceedings of the World of Coal Ash (WOCA), St. Louis, MO, USA, 13 May 2019; Volume 10. [Google Scholar]
- ASTM D7582. Standard Test Methods for Proximate Analysis of Coal and Coke by Macro Thermogravimetric Analysis. American Society for Testing and Materials: West Conshohocken, PA, USA, 2015; p. 9. [Google Scholar]
- ASTM D5373. Standard Test Methods for Determination of Carbon, Hydrogen and Nitrogen in Analysis Samples of Coal and Carbon in Analysis Samples of Coal and Coke. American Society for Testing and Materials: West Conshohocken, PA, USA, 2016; p. 11. [Google Scholar]
- ASTM D4239. Standard Test Method for Sulfur in the Analysis Sample of Coal and Coke Using High-Temperature Tube Furnace Combustion. American Society for Testing and Materials: West Conshohocken, PA, USA, 2018; p. 8. [Google Scholar]
- ISO 11722. Solid Mineral Fuels—Hard Coal—Determination of Moisture in the General Analysis Test Sample by Drying in Nitrogen. International Organization for Standardization: Geneva, Switzerland, 2013; p. 5. [Google Scholar]
- ISO 1171. Solid Mineral Fuels—Determination of Ash. International Organization for Standardization: Geneva, Switzerland, 2010; p. 4. [Google Scholar]
- ISO 562. Hard Coal and Coke—Determination of Volatile Matter. International Organization for Standardization: Geneva, Switzerland, 2010; p. 8. [Google Scholar]
- ISO 1170. Coal and Coke—Calculation of Analyses to Different Bases. International Organization for Standardization: Geneva, Switzerland, 2013; p. 7. [Google Scholar]
- ISO 17246. Coal—Proximate Analysis. International Organization for Standardization: Geneva, Switzerland, 2005; p. 3. [Google Scholar]
- Godoy, M.L.D.P.; Godoy, J.M.; Roldao, L.A. Determination of Trace Elements in Coal and Coal Ash Samples by ICP-MS. At. Spectrosc. 2001, 22, 235–243. [Google Scholar]
- Whitty-Léveillé, L.; Drouin, E.; Constantin, M.; Bazin, C.; Larivière, D. Scandium Analysis in Silicon-Containing Minerals by Inductively Coupled Plasma Tandem Mass Spectrometry. Spectrochim. Acta Part B At. Spectrosc. 2016, 118, 112–118. [Google Scholar] [CrossRef]
- Taylor, J.C. Computer Programs for Standardless Quantitative Analysis of Minerals Using the Full Powder Diffraction Profile. Powder Diffr. 1991, 6, 2–9. [Google Scholar] [CrossRef] [Green Version]
- ISO 7404-2. Methods for the Petrographic Analysis of Coals—Part 2: Methods of Preparing Coal Samples. International Organization for Standardization: Geneva, Switzerland, 2009; p. 12. [Google Scholar]
- ISO 7404-3. Methods for the Petrographic Analysis of Coals—Part 3: Method of Determining Maceral Group Composition. International Organization for Standardization: Geneva, Switzerland, 2009; p. 7. [Google Scholar]
- ICCP (International Committee for Coal and Organic Petrology). The New Vitrinite Classification (ICCP System 1994). Fuel 1998, 77, 349–358. [Google Scholar] [CrossRef]
- ICCP (International Committee for Coal and Organic Petrology). The New Inertinite Classification (ICCP System 1994). Fuel 2001, 80, 459–471. [Google Scholar] [CrossRef]
- Pickel, W.; Kus, J.; Flores, D.; Kalaitzidis, S.; Christanis, K.; Cardott, B.J.; Misz-Kennan, M.; Rodrigues, S.; Hentschel, A.; Hamor-Vido, M.; et al. Classification of Liptinite—ICCP System 1994. Int. J. Coal Geol. 2017, 169, 40–61. [Google Scholar] [CrossRef] [Green Version]
- Sýkorová, I.; Pickel, W.; Christanis, K.; Wolf, M.; Taylor, G.H.; Flores, D. Classification of Huminite—ICCP System 1994. Int. J. Coal Geol. 2005, 62, 85–106. [Google Scholar] [CrossRef]
- Hower, J.C. Petrographic Examination of Coal-Combustion Fly Ash. Int. J. Coal Geol. 2012, 92, 90–97. [Google Scholar] [CrossRef]
- Valentim, B.; Abagiu, A.T.; Anghelescu, L.; Flores, D.; French, D.; Gonçalves, P.; Guedes, A.; Popescu, L.G.; Predeanu, G.; Ribeiro, J.; et al. Assessment of Bottom Ash Landfilled at Ceplea Valley (Romania) as a Source of Rare Earth Elements. Int. J. Coal Geol. 2019, 201, 109–126. [Google Scholar] [CrossRef]
- Valentim, B.; Hower, J.C.; Flores, D.; Guedes, A. Notes on the Efficacy of Wet versus Dry Screening of Fly Ash. Min. Metall. Explor. 2008, 25, 143–148. [Google Scholar] [CrossRef]
- Hower, J.C.; Thomas, G.A.; Palmer, J. Impact of the Conversion to Low-NOx Combustion on Ash Characteristics in a Utility Boiler Burning Western US Coal. Fuel Processing Technol. 1999, 61, 175–195. [Google Scholar] [CrossRef]
- Dai, S.; Graham, I.T.; Ward, C.R. A Review of Anomalous Rare Earth Elements and Yttrium in Coal. Int. J. Coal Geol. 2016, 159, 82–95. [Google Scholar] [CrossRef]
- Bau, M.; Dulski, P. Distribution of Yttrium and Rare-Earth Elements in the Penge and Kuruman Iron-Formations, Transvaal Supergroup, South Africa. Precambrian Res. 1996, 79, 37–55. [Google Scholar] [CrossRef]
- ISO 11760. Classification of Coals. International Organization for Standardization: Geneva, Switzerland, 2005; p. 9. [Google Scholar]
- Chou, C.-L. Sulfur in Coals: A Review of Geochemistry and Origins. Int. J. Coal Geol. 2012, 100, 1–13. [Google Scholar] [CrossRef]
- Finkelman, R.B.; Palmer, C.A.; Wang, P. Quantification of the Modes of Occurrence of 42 Elements in Coal. Int. J. Coal Geol. 2018, 185, 138–160. [Google Scholar] [CrossRef]
- van Krevelen, D.W. Coal: Typology-Physics-Chemistry-Constitution; Elsevier Science: Amsterdam, The Netherlands, 1993; p. 979. [Google Scholar]
- ASTM D388. Standard Classification of Coals by Rank. American Society for Testing and Materials: West Conshohocken, PA, USA, 1999; p. 8. [Google Scholar]
- Speight, J.G. Handbook of Coal Analysis, 2nd ed.; Vitha, M.F., Ed.; John Wiley & Sons Inc.: Hoboken, NJ, USA, 2015; ISBN 9781119037699. [Google Scholar]
- Valentim, B.; Lemos de Sousa, M.J.; Abelha, P.; Boavida, D.; Gulyurtlu, I. The Identification of Unusual Microscopic Features in Coal and Their Derived Chars: Influence on Coal Fluidized Bed Combustion. Int. J. Coal Geol. 2006, 67, 202–211. [Google Scholar] [CrossRef] [Green Version]
- Valentim, B.; Hower, J.C.; Guedes, A.; Flores, D. Scanning Electron Microscopy And Energy-Dispersive X-Ray Spectroscopy Of Low-Sulfur Coal Fly Ash. Int. J. Energy Clean Environ. 2009, 10, 147–166. [Google Scholar] [CrossRef]
- Laskowski, J.S. Coal Flotation and Fine Coal Utilization, 1st ed.; Elsevier Science: Amsterdam, The Netherlands, 2001; Volume 14, ISBN 9780080529240. [Google Scholar]
- Yuan, Y.; Tang, S.; Zhang, S. Geochemical and Mineralogical Characteristics of the Middle Jurassic Coals from the Tongjialiang Mine in the Northern Datong Coalfield, Shanxi Province, China. Minerals 2019, 9, 184. [Google Scholar] [CrossRef] [Green Version]
- Ward, C.R. Analysis, Origin and Significance of Mineral Matter in Coal: An Updated Review. Int. J. Coal Geol. 2016, 165, 1–27. [Google Scholar] [CrossRef]
- Oliveira, M.L.S.; Ward, C.R.; French, D.; Hower, J.C.; Querol, X.; Silva, L.F.O. Mineralogy and Leaching Characteristics of Beneficiated Coal Products from Santa Catarina, Brazil. Int. J. Coal Geol. 2012, 94, 314–325. [Google Scholar] [CrossRef]
- Folk, R.L.; Ward, W.C. Brazos River Bar [Texas]; a Study in the Significance of Grain Size Parameters. J. Sediment. Res. 1957, 27, 3–26. [Google Scholar] [CrossRef]
- Ahn, Y.C.; Lee, J.K. Physical, Chemical, and Electrical Analysis of Aerosol Particles Generated from Industrial Plants. J. Aerosol Sci. 2006, 37, 187–202. [Google Scholar] [CrossRef]
- Suárez-Ruiz, I.; Hower, J.C.; Thomas, G.A. Hg and Se Capture and Fly Ash Carbons from Combustion of Complex Pulverized Feed Blends Mainly of Anthracitic Coal Rank in Spanish Power Plants. Energy Fuels 2007, 21, 59–70. [Google Scholar] [CrossRef]
- Senneca, O. Burning and Physico-Chemical Characteristics of Carbon in Ash from a Coal Fired Power Plant. Fuel 2008, 87, 1207–1216. [Google Scholar] [CrossRef]
- Vassilev, S.V.; Vassileva, C.G. A New Approach for the Classification of Coal Fly Ashes Based on Their Origin, Composition, Properties, and Behaviour. Fuel 2007, 86, 1490–1512. [Google Scholar] [CrossRef]
- ASTM C618. Coal Fly Ash and Raw or Calcined Natural Pozzolan for Use in Concrete. American Society for Testing and Materials: West Conshohocken, PA, USA, 2005; p. 3. [Google Scholar]
- Matjie, R.H.; van Alphen, C.; Pistorius, P.C. Mineralogical Characterisation of Secunda Gasifier Feedstock and Coarse Ash. Miner. Eng. 2006, 19, 256–261. [Google Scholar] [CrossRef]
- Kolker, A.; Scott, C.; Hower, J.C.; Vazquez, J.A.; Lopano, C.L.; Dai, S. Distribution of Rare Earth Elements in Coal Combustion Fly Ash, Determined by SHRIMP-RG Ion Microprobe. Int. J. Coal Geol. 2017, 184, 1–10. [Google Scholar] [CrossRef]
- Valentim, B.; Białecka, B.; Gonçalves, P.; Guedes, A.; Guimarães, R.; Cruceru, M.; Całus-Moszko, J.; Popescu, L.; Predeanu, G.; Santos, A. Undifferentiated Inorganics in Coal Fly Ash and Bottom Ash: Calcispheres, Magnesiacalcispheres, and Magnesiaspheres. Minerals 2018, 8, 140. [Google Scholar] [CrossRef] [Green Version]
- Hulett, L.D.; Weinberger, A.J. Some Etching Studies of the Microstructure and Composition of Large Aluminosilicate Particles in Fly Ash from Coal-Burning Power Plants. Environ. Sci. Technol. 1980, 14, 965–970. [Google Scholar] [CrossRef] [PubMed]
- Henry, J.; Towler, M.; Stanton, K.; Querol, X.; Moreno, N. Characterisation of the Glass Fraction of a Selection of European Coal Fly Ashes. J. Chem. Technol. Biotechnol. 2004, 79, 540–546. [Google Scholar] [CrossRef]
- Valentim, B.; Guedes, A.; Flores, D.; Ward, C.R.; Hower, J.C. Variations in Fly Ash Composition with Sampling Location: Case Study from a Portuguese Power Plant. Coal Combust. Gasif. Prod. 2009, 1, 14–24. [Google Scholar] [CrossRef]
- Lauf, R.J.; Harris, L.A.; Rawlston, S.S. Pyrite Framboids as the Source of Magnetite Spheres in Fly Ash. Environ. Sci. Technol. 1982, 16, 218–220. [Google Scholar] [CrossRef]
- Sokol, E.V.; Kalugin, V.M.; Nigmatulina, E.N.; Volkova, N.I.; Frenkel, A.E.; Maksimova, N.V. Ferrospheres from Fly Ashes of Chelyabinsk Coals: Chemical Composition, Morphology and Formation Conditions. Fuel 2002, 81, 867–876. [Google Scholar] [CrossRef]
- Finkelman, R.B. Trace and Minor Elements in Coal. In Organic Geochemistry; Topics in Geobiology; Engel, M.H., Macko, S.A., Eds.; Springer: Boston, MA, USA, 1993; Volume 11, pp. 593–607. [Google Scholar]
- Dai, S.; Tian, L.; Chou, C.-L.; Zhou, Y.; Zhang, M.; Zhao, L.; Wang, J.; Yang, Z.; Cao, H.; Ren, D. Mineralogical and Compositional Characteristics of Late Permian Coals from an Area of High Lung Cancer Rate in Xuan Wei, Yunnan, China: Occurrence and Origin of Quartz and Chamosite. Int. J. Coal Geol. 2008, 76, 318–327. [Google Scholar] [CrossRef]
- Dai, S.; Seredin, V.V.; Ward, C.R.; Hower, J.C.; Xing, Y.; Zhang, W.; Song, W.; Wang, P. Enrichment of U–Se–Mo–Re–V in Coals Preserved within Marine Carbonate Successions: Geochemical and Mineralogical Data from the Late Permian Guiding Coalfield, Guizhou, China. Miner. Depos. 2015, 50, 159–186. [Google Scholar] [CrossRef]
- Clarke, L.B. The Fate of Trace Elements during Coal Combustion and Gasification: An Overview. Fuel 1993, 72, 731–736. [Google Scholar] [CrossRef]
- Liu, P.; Huang, R.; Tang, Y. Comprehensive Understandings of Rare Earth Element (REE) Speciation in Coal Fly Ashes and Implication for REE Extractability. Environ. Sci. Technol. 2019, 53, 5369–5377. [Google Scholar] [CrossRef] [PubMed]
- Eskanazy, G.; Finkelman, R.B.; Chattarjee, S. Some Considerations Concerning the Use of Correlation Coefficients and Cluster Analysis in Interpreting Coal Geochemistry Data. Int. J. Coal Geol. 2010, 83, 491–493. [Google Scholar] [CrossRef]
- Gürdal, G. Abundances and Modes of Occurrence of Trace Elements in the Çan Coals (Miocene), Çanakkale-Turkey. Int. J. Coal Geol. 2011, 87, 157–173. [Google Scholar] [CrossRef]
- Zhao, L.; Ward, C.; French, D.; Graham, I. Major and Trace Element Geochemistry of Coals and Intra-Seam Claystones from the Songzao Coalfield, SW China. Minerals 2015, 5, 870–893. [Google Scholar] [CrossRef]
- Hower, J.C.; Qian, D.; Briot, N.J.; Henke, K.R.; Hood, M.M.; Taggart, R.K.; Hsu-Kim, H. Rare Earth Element Associations in the Kentucky State University Stoker Ash. Int. J. Coal Geol. 2018, 189, 75–82. [Google Scholar] [CrossRef]
- Rollinson, H.R. Using Geochemical Data: Evaluation, Presentation, Interpretation; Routledge: Abingdon, UK, 2014. [Google Scholar] [CrossRef]
- Montross, S.N.; Verba, C.A.; Chan, H.L.; Lopano, C. Advanced Characterization of Rare Earth Element Minerals in Coal Utilization Byproducts Using Multimodal Image Analysis. Int. J. Coal Geol. 2018, 195, 362–372. [Google Scholar] [CrossRef]
- Hower, J.C.; Groppo, J.G. Rare Earth-Bearing Particles in Fly Ash Carbons: Examples from the Combustion of Eastern Kentucky Coals. Energy Geosci. 2021, 2, 90–98. [Google Scholar] [CrossRef]
- Hower, J.C.; Qian, D.; Briot, N.J.; Santillan-Jimenez, E.; Hood, M.M.; Taggart, R.K.; Hsu-Kim, H. Nano-Scale Rare Earth Distribution in Fly Ash Derived from the Combustion of the Fire Clay Coal, Kentucky. Minerals 2019, 9, 206. [Google Scholar] [CrossRef] [Green Version]
- Izquierdo, M.; Querol, X. Leaching Behaviour of Elements from Coal Combustion Fly Ash: An Overview. Int. J. Coal Geol. 2012, 94, 54–66. [Google Scholar] [CrossRef] [Green Version]
- Bartoňová, L.; Serenčíšová, J.; Čech, B. Yttrium Partitioning and Associations in Coal-Combustion Ashes Prior to and after Their Leaching in HCl. Fuel Processing Technol. 2018, 173, 205–215. [Google Scholar] [CrossRef]
- Pan, J.; Zhou, C.; Tang, M.; Cao, S.; Liu, C.; Zhang, N.; Wen, M.; Luo, Y.; Hu, T.; Ji, W. Study on the Modes of Occurrence of Rare Earth Elements in Coal Fly Ash by Statistics and a Sequential Chemical Extraction Procedure. Fuel 2019, 237, 555–565. [Google Scholar] [CrossRef]
- Taggart, R.K.; Rivera, N.A.; Levard, C.; Ambrosi, J.-P.; Borschneck, D.; Hower, J.C.; Hsu-Kim, H. Differences in Bulk and Microscale Yttrium Speciation in Coal Combustion Fly Ash. Environ. Sci. Processes Impacts 2018, 20, 1390–1403. [Google Scholar] [CrossRef] [PubMed] [Green Version]
- Finch, R.J. Structure and Chemistry of Zircon and Zircon-Group Minerals. Rev. Mineral. Geochem. 2003, 53, 1–25. [Google Scholar] [CrossRef]
- Watson, E.B.; Harrison, T.M. Zircon Saturation Revisited: Temperature and Composition Effects in a Variety of Crustal Magma Types. Earth Planet. Sci. Lett. 1983, 64, 295–304. [Google Scholar] [CrossRef]
- Nugroho, N.D.; Rosita, W.; Perdana, I.; Bendiyasa, I.M.; Mufakhir, F.R.; Astuti, W. Iron Bearing Oxide Minerals Separation from Rare Earth Elements (REE) Rich Coal Fly Ash. IOP Conf. Ser. Mater. Sci. Eng. 2019, 478, 012026. [Google Scholar] [CrossRef]
- Dapkunas, S.J.; Jillavenkatesa, A. NIST Recommended Practice Guide; National Institute of Standards and Technology: Gaithersburg, MD, USA, 2001. [Google Scholar]
- Merkus, H.G. Particle Size, Size Distributions and Shape. Part. Size Meas. 2009, 17, 13–42. [Google Scholar] [CrossRef]
- Hrnčířová, M.; Pospíšil, J.; Michalšpiláček, M.M. Size Analysis of Solid Particles Using Laser Diffraction and Sieve Analysis. Eng. Mech. 2013, 20, 309–318. [Google Scholar]
- Wills, B.A.; Napier-Munn, T. Introduction. In Wills’ Mineral Processing Technology; Butterworth-Heinemann: Oxford, UK, 2005; pp. 1–29. ISBN 978-0-08-097053-0. [Google Scholar]
- Lanzerstorfer, C. Pre-Processing of Coal Combustion Fly Ash by Classification for Enrichment of Rare Earth Elements. Energy Rep. 2018, 4, 660–663. [Google Scholar] [CrossRef]
- Hower, J.C.; Groppo, J.G.; Jewell, R.B.; Wiseman, J.D.; Duvallet, T.Y.; Oberlink, A.E.; Hopps, S.D.; Morgan, T.D.; Henke, K.R.; Joshi, P.; et al. Distribution of Rare Earth Elements in the Pilot-Scale Processing of Fly Ashes Derived from Eastern Kentucky Coals: Comparisons of the Feed and Processed Ashes. Fuel 2021, 295, 120562. [Google Scholar] [CrossRef]


| S1-C | S2-C1 | S2-C2 | S3-C1 | S3-C2 | S4-C1 | S4-C2 | Average | CV | |
|---|---|---|---|---|---|---|---|---|---|
| Proximate analysis | |||||||||
| Mad | 6.24 | 6.04 | 8.31 | 6.20 | 6.88 | 6.71 | 5.84 | 6.60 | 11.72 |
| Ad | 3.28 | 7.39 | 8.25 | 10.19 | 9.12 | 10.10 | 9.01 | 8.19 | 26.88 |
| Vdaf | 39.82 | 41.74 | 42.37 | 41.16 | 41.88 | 41.70 | 40.44 | 41.30 | 2.00 |
| FCdaf | 60.18 | 58.26 | 57.63 | 58.84 | 58.12 | 58.30 | 59.56 | 58.70 | 1.41 |
| Ultimate analysis | |||||||||
| Sd | 0.52 | 0.79 | 0.79 | 0.66 | 0.63 | 0.73 | 0.72 | 0.69 | 12.92 |
| Cdaf | 80.34 | 77.21 | 77.30 | 79.72 | 78.62 | 78.53 | 80.30 | 78.86 | 1.54 |
| Hdaf | 6.20 | 5.93 | 6.22 | 6.18 | 6.17 | 6.07 | 6.08 | 6.12 | 1.55 |
| Ndaf | 1.64 | 1.63 | 1.56 | 1.60 | 1.62 | 1.60 | 1.57 | 1.60 | 1.72 |
| Odaf | 11.28 | 14.37 | 14.06 | 11.77 | 12.90 | 12.98 | 11.25 | 12.66 | 9.32 |
| Atomic H/C | 0.92 | 0.92 | 0.96 | 0.92 | 0.93 | 0.92 | 0.90 | 0.93 | 1.78 |
| Atomic O/C | 0.11 | 0.14 | 0.14 | 0.11 | 0.12 | 0.12 | 0.11 | 0.12 | 10.87 |
| GCVd | 29.19 | 30.21 | 28.94 | 29.46 | 29.68 | 29.66 | 29.78 | 29.56 | 1.30 |
| Carbon forms | |||||||||
| Ct | 72.45 | 66.48 | 64.49 | 65.37 | 65.09 | 65.32 | 67.93 | 66.73 | 3.83 |
| Corg | 72.42 | 66.43 | 64.44 | 65.31 | 65.02 | 65.28 | 67.87 | 66.68 | 3.85 |
| CCO2 | 0.01 | 0.04 | 0.03 | 0.01 | 0.03 | 0.03 | 0.02 | 0.02 | 54.67 |
| Cgra | 0.07 | 0.02 | 0.06 | 0.15 | 0.15 | 0.05 | 0.15 | 0.09 | 55.43 |
| S1-C | S2-C1 | S2-C2 | S3-C1 | S3-C2 | S4-C1 | S4-C2 | |
|---|---|---|---|---|---|---|---|
| Vitrinite (vol. %) | 79.8 | 76.9 | 72.6 | 78.2 | 74.9 | 75.5 | 71.7 |
| Telinite | 1.8 | 2.9 | 2.6 | 1.3 | 2.6 | 1.3 | 2.5 |
| Collotelinite | 11.0 | 10.6 | 20.6 | 14.4 | 14.1 | 19.3 | 10.0 |
| Vitrodetrinite | 4.1 | 5.8 | 8.7 | 5.2 | 7.0 | 4.9 | 7.6 |
| Collodetrinite | 53.5 | 47.0 | 32.0 | 47.8 | 43.0 | 41.6 | 44.5 |
| Corpogelenite | 9.2 | 10.0 | 8.0 | 9.1 | 8.2 | 7.8 | 6.9 |
| Gelenite | 0.2 | 0.5 | 0.7 | 0.4 | 0.0 | 0.5 | 0.2 |
| Inertinite (vol. %) | 15.7 | 15.3 | 17.2 | 13.1 | 12.8 | 15.6 | 17.2 |
| Fusinite | 1.8 | 0.9 | 3.1 | 2.8 | 2.6 | 1.8 | 1.6 |
| Semifusinite | 7.5 | 3.6 | 5.2 | 3.9 | 2.9 | 5.3 | 5.1 |
| Funginite | 0.4 | 0.4 | 0.7 | 0.0 | 0.2 | 0.2 | 0.5 |
| Secretinite | 0.0 | 0.2 | 0.5 | 0.2 | 0.2 | 0.4 | 0.2 |
| Macrinite | 2.5 | 3.8 | 2.6 | 3.2 | 2.0 | 2.0 | 3.4 |
| Micrinite | 0.0 | 0.0 | 0.0 | 0.0 | 0.0 | 0.0 | 0.0 |
| Inertodetrinite | 3.5 | 6.4 | 5.2 | 3.0 | 4.9 | 6.0 | 6.4 |
| Liptinite (vol. %) | 2.9 | 4.4 | 4.0 | 3.0 | 4.8 | 2.7 | 4.0 |
| Cutinite | 0.4 | 0.5 | 1.2 | 0.9 | 0.9 | 0.5 | 0.4 |
| Suberinite | 0.0 | 0.0 | 0.0 | 0.0 | 0.0 | 0.0 | 0.0 |
| Sporinite | 0.6 | 1.3 | 0.5 | 0.9 | 1.1 | 0.7 | 0.9 |
| Resinite | 0.6 | 0.7 | 1.2 | 0.4 | 0.9 | 0.0 | 0.0 |
| Exsudatinite | 0.0 | 0.0 | 0.0 | 0.0 | 0.0 | 0.0 | 0.0 |
| Chlorophyllinite | 0.0 | 0.0 | 0.0 | 0.0 | 0.0 | 0.0 | 0.0 |
| Alginite | 0.0 | 0.0 | 0.0 | 0.0 | 0.0 | 0.0 | 0.0 |
| Liptodetrinite | 1.4 | 1.8 | 1.2 | 0.7 | 1.8 | 1.5 | 2.7 |
| Bituminite | 0.0 | 0.0 | 0.0 | 0.0 | 0.0 | 0.0 | 0.0 |
| Mineral matter (vol. %) | 1.6 | 3.5 | 5.9 | 5.8 | 7.5 | 6.2 | 7.1 |
| Total reactive macerals (vol. %) | 82.7 | 81.2 | 76.6 | 81.2 | 79.7 | 78.2 | 75.7 |
| Vitrinite reflectance | |||||||
| Mean random reflectance (Rr%) | 0.53 | 0.55 | 0.48 | 0.58 | 0.55 | 0.53 | 0.57 |
| Standard deviation | 0.06 | 0.05 | 0.04 | 0.05 | 0.05 | 0.04 | 0.07 |
| Rank category | Medium rank D | Medium rank D | Low rank A | Medium rank D | Medium rank D | Medium rank D | Medium rank D |
| S1-C | S2-C1 | S2-C2 | S3-C1 | S3-C2 | S4-C1 | S4-C2 | |
|---|---|---|---|---|---|---|---|
| Major oxides | |||||||
| SiO2 | 1.76 | 4.78 | 3.97 | 6.94 | 5.72 | 5.64 | 5.11 |
| TiO2 | <0.01 | 0.07 | 0.05 | 0.07 | 0.04 | 0.06 | 0.06 |
| Al2O3 | 0.65 | 1.5 | 1.56 | 2.21 | 1.48 | 1.83 | 1.78 |
| Fe2O3 | 0.05 | 0.53 | 1.08 | 0.71 | 0.84 | 0.56 | 0.41 |
| MnO | <0.01 | <0.01 | <0.01 | <0.01 | <0.01 | <0.01 | <0.01 |
| CaO | 0.06 | 0.11 | 0.19 | 0.13 | 0.11 | 0.14 | 0.12 |
| MgO | <0.01 | <0.01 | <0.01 | 0.01 | <0.01 | <0.01 | <0.01 |
| Na2O | <0.01 | <0.01 | 0.08 | <0.01 | <0.01 | <0.01 | <0.01 |
| K2O | 0.04 | 0.14 | 0.14 | 0.23 | 0.12 | 0.18 | 0.19 |
| P2O5 | 0.01 | <0.01 | <0.01 | 0.02 | <0.01 | <0.01 | <0.01 |
| SO3 | 0.03 | 0.41 | 0.26 | 0.08 | 0.28 | 0.08 | 0.07 |
| Cr2O3 | <0.01 | <0.01 | <0.01 | <0.01 | <0.01 | <0.01 | <0.01 |
| SiO2/Al2O3 | 2.71 | 3.19 | 2.54 | 3.14 | 3.86 | 3.08 | 2.87 |
| LOI | 97 | 91.5 | 91.7 | 88.2 | 90.8 | 90 | 91 |
| LTA mineralogy | |||||||
| Quartz (SiO2) | 31 | 35.9 | 37.7 | 30.6 | 41.6 | 38.7 | n.d. |
| Albite (NaAlSi3O8) | 0.6 | 0 | 0.8 | 1.5 | 0.2 | 0.7 | n.d. |
| Hornblende (Ca2(Mg, Fe2+)4Al(Si7AlO22)(OH,F)2) | 0.8 | 0.8 | 0.5 | 0.8 | 0.7 | 0.4 | n.d. |
| Muscovite (KAl2(AlSi3)O10(OH)2) | 4 | 9.4 | 6.3 | 8.9 | 7 | 8.4 | n.d. |
| Illite (K1.5Al4(Si6.5Al1.5)O20(OH)4) | 4.2 | 6.1 | 9.8 | 12 | 6.5 | 7.9 | n.d. |
| Kaolinite (Al2Si2O5(OH)4) | 45.5 | 27 | 22.6 | 26.9 | 27.8 | 25.6 | n.d. |
| Montmorillonite ((Na,Ca)0.33(Al,Mg)2(Si4O10)(OH)2·nH2O) | 0.3 | 0.3 | 0.3 | 0.5 | 0.2 | 0 | n.d. |
| Chlorite ((MgFeAl)6(AlSi)4O10(OH)8) | 0.3 | 1.6 | 2 | 2.3 | 2.2 | 0.3 | n.d. |
| Anatase (TiO2) | 0.3 | 1 | 0.6 | 0.6 | 0.2 | 0.7 | n.d. |
| Boehmite (Al·O·OH) | 0.2 | 0.3 | 0.4 | 0.1 | 0.1 | 0.1 | n.d. |
| Calcite (CaCO3) | 0 | 0 | 0.1 | 0 | 0 | 0 | n.d. |
| Siderite (FeCO3) | 0.3 | 0 | 0.3 | 0.7 | 0.3 | 0 | n.d. |
| Bassanite (CaSO4·0.5H2O) | 0.7 | 0.5 | 2.4 | 0.5 | 2.1 | 1.2 | n.d. |
| Gypsum (CaSO4·2H2O) | 3.4 | 2.3 | 4.4 | 3.6 | 4.3 | 3.5 | n.d. |
| Hexahydrite (MgSO4·6H2O) | 2.3 | 1.2 | 1 | 1.7 | 2.2 | 4.2 | n.d. |
| Jarosite ((K,Na)Fe3(SO4)2(OH)6) | 1.1 | 3.5 | 1.4 | 3 | 1.2 | 2.3 | n.d. |
| Alunogen (Al2(SO4)3·17H2O) | 3.3 | 8.5 | 3.3 | 4.5 | 0.6 | 4 | n.d. |
| Tschermigite (NH4Al(SO4)2·12H2O | 0 | 0.2 | 0.5 | 0 | 0.8 | 0 | n.d. |
| Apatite (Ca5F(PO4)3) | 0.6 | 0.1 | 1.2 | 0.6 | 1.2 | 0.5 | n.d. |
| Pyrite (FeS2) | 1.2 | 1.3 | 4.5 | 1.2 | 0.9 | 1.7 | n.d. |
| Campaign | Sample | Mean (µm) | D10 (µm) | D50 (µm) | D90 (µm) | D90–D10 (μm) | Span | SD (φ) | Clay vol.% (<2 µm) | Silt vol.% (2–63 µm) | Sand vol.% (63–2000 µm) |
|---|---|---|---|---|---|---|---|---|---|---|---|
| S1 | BA | 147.7 | 33.05 | 108.3 | 331.7 | 298.7 | 2.8 | 1.3 | 0.0 | 31.7 | 68.3 |
| ECO | 115.3 | 31.55 | 89.37 | 232.1 | 200.6 | 2.2 | 1.1 | 0.0 | 37.2 | 62.8 | |
| ESP12 | 44.3 | 3.5 | 21.4 | 111.2 | 107.8 | 5.0 | 2.0 | 6.7 | 73.1 | 20.3 | |
| ESP15 | 51.0 | 4.7 | 30.4 | 125.9 | 121.2 | 4.0 | 1.9 | 4.8 | 69.8 | 25.4 | |
| ESP22 | 39.6 | 2.9 | 20.2 | 103.5 | 100.6 | 5.0 | 2.0 | 8.0 | 72.6 | 19.4 | |
| ESP25 | 46.9 | 4.1 | 25.2 | 115.0 | 111.0 | 4.4 | 1.9 | 5.8 | 72.6 | 21.6 | |
| ESP32/42 | 52.6 | 4.1 | 29.0 | 122.5 | 118.4 | 4.1 | 2.0 | 5.8 | 69.8 | 24.4 | |
| ESP35/45 | 48.5 | 4.6 | 26.8 | 125.6 | 121.0 | 4.5 | 1.9 | 5.0 | 70.4 | 24.5 | |
| Silo | 51.4 | 4.5 | 21.1 | 113.6 | 109.1 | 5.2 | 1.9 | 5.1 | 76.1 | 18.9 | |
| S4 | BA | 174.0 | 42.0 | 135.5 | 375.2 | 333.3 | 2.5 | 1.2 | 0.0 | 22.9 | 77.1 |
| ECO | 112.7 | 30.9 | 82.7 | 234.7 | 203.8 | 2.5 | 1.1 | 0.0 | 40.9 | 59.1 | |
| ESP12 | 50.5 | 5.9 | 30.2 | 126.0 | 120.0 | 4.0 | 1.7 | 3.8 | 71.2 | 25.0 | |
| ESP22 | 51.4 | 3.5 | 23.2 | 141.8 | 138.3 | 6.0 | 2.1 | 6.3 | 66.1 | 27.6 | |
| ESP32 | 42.5 | 3.0 | 15.4 | 123.4 | 120.4 | 7.8 | 2.2 | 7.7 | 70.6 | 21.7 | |
| Silo | 116.0 | 31.0 | 83.7 | 240.0 | 209.1 | 2.5 | 1.2 | 0.0 | 40.5 | 59.5 |
| Campaign | Sample | Mad | Ad | St | Ct | Corg | Cgra | CCo2 |
|---|---|---|---|---|---|---|---|---|
| S1 | BA | 0.12 | 99.63 | <0.02 | 0.35 | 0.19 | 0.09 | 0.24 |
| ECO | 0.12 | 98.31 | 0.05 | 1.69 | 0.81 | 0.85 | 0.10 | |
| ESP12 | 0.27 | 94.25 | 0.13 | 5.51 | 2.75 | 2.74 | 0.09 | |
| ESP15 | 0.28 | 95.33 | 0.13 | 4.38 | 1.86 | 2.51 | <0.02 | |
| ESP22 | 0.27 | 93.67 | 0.14 | 5.92 | 2.82 | 3.09 | 0.07 | |
| ESP25 | 0.27 | 94.6 | 0.2 | 4.92 | 2.28 | 2.63 | 0.02 | |
| ESP32/42 | 0.26 | 93.45 | 0.12 | 6.17 | 2.83 | 3.31 | 0.10 | |
| ESP35/45 | 0.31 | 94.35 | 0.15 | 5.26 | 2.29 | 2.95 | 0.07 | |
| Silo | 0.17 | 95.88 | 0.13 | 3.03 | 0.97 | 2.06 | <0.02 | |
| S2 | ECO | 0.32 | 98.42 | 0.11 | 1.37 | 0.76 | 0.59 | 0.05 |
| ESP12 | 0.3 | 97.44 | 0.17 | 2.36 | 1.44 | 0.9 | 0.04 | |
| ESP22 | 0.37 | 97.1 | 0.29 | 2.3 | 1.44 | 0.85 | 0.04 | |
| ESP32/42 | 0.37 | 95.88 | 0.33 | 2.98 | 1.55 | 1.42 | 0.04 | |
| Silo | 0.25 | 97.36 | 0.22 | 2.66 | 1.79 | 0.86 | 0.06 | |
| S3 | BA | 0.08 | 99.52 | <0.02 | 0.35 | 0.29 | 0.03 | 0.1 |
| ESP12 | 0.32 | 96.15 | 0.14 | 3.46 | 1.98 | 1.47 | 0.05 | |
| ESP22 | 0.37 | 95.09 | 0.21 | 4.25 | 2.35 | 1.89 | <0.02 | |
| ESP32 | 0.59 | 95 | 0.49 | 3.43 | 1.77 | 1.66 | <0.02 | |
| Silo | 0.25 | 95.13 | 0.15 | 4.17 | 1.94 | 2.21 | 0.04 | |
| S4 | BA | 0.04 | 99.89 | <0.02 | 0.22 | 0.16 | 0.05 | 0.04 |
| ECO | 0.11 | 94.32 | 0.04 | 5.32 | 1.49 | 3.79 | 0.16 | |
| ESP12 | 0.35 | 93.26 | 0.15 | 6.32 | 2.27 | 4.02 | 0.09 | |
| ESP22 | 0.35 | 92.27 | 0.23 | 6.12 | 1.92 | 4.19 | 0.04 | |
| ESP32 | 0.48 | 93.37 | 0.4 | 5.41 | 1.83 | 3.57 | <0.02 | |
| Silo | 0.25 | 94.32 | 0.17 | 5.32 | 1.93 | 3.36 | 0.09 | |
| Minimum | 0.04 | 92.27 | <0.02 | 0.22 | 0.16 | 0.03 | <0.02 | |
| Average | 0.27 | 95.63 | 0.19 | 3.60 | 1.61 | 1.97 | 0.06 | |
| Maximum | 0.59 | 99.89 | 0.49 | 6.32 | 2.83 | 4.19 | 0.24 | |
| CV (%) | 45.60 | 2.22 | 60.51 | 52.78 | 47.10 | 64.84 | 81.63 | |
| Campaign | Sample | SiO2 | TiO2 | Al2O3 | Fe2O3 | MnO | CaO | MgO | Na2O | K2O | P2O5 | SO3 | Cr2O3 | LOI | SiO2/Al2O3 |
|---|---|---|---|---|---|---|---|---|---|---|---|---|---|---|---|
| S1 | BA | 66.07 | 0.81 | 18.28 | 7.95 | 0.08 | 1.50 | 1.87 | 1.04 | 2.11 | 0.14 | 0.03 | 0.02 | 0.10 | 3.61 |
| ECO | 67.77 | 0.66 | 15.15 | 8.13 | 0.08 | 1.81 | 1.86 | 1.10 | 1.72 | 0.13 | 0.07 | 0.02 | 1.51 | 4.47 | |
| ESP12 | 59.65 | 0.88 | 20.22 | 6.36 | 0.06 | 1.34 | 1.83 | 1.07 | 2.37 | 0.16 | 0.13 | 0.02 | 5.89 | 2.95 | |
| ESP15 | 61.27 | 0.84 | 18.71 | 7.30 | 0.07 | 1.59 | 1.97 | 1.14 | 2.13 | 0.18 | 0.15 | 0.02 | 4.63 | 3.27 | |
| ESP22 | 58.81 | 0.89 | 20.58 | 6.31 | 0.06 | 1.24 | 1.79 | 1.06 | 2.45 | 0.16 | 0.12 | 0.02 | 6.49 | 2.86 | |
| ESP25 | 58.74 | 0.88 | 20.31 | 6.55 | 0.06 | 1.61 | 1.91 | 1.14 | 2.26 | 0.18 | 0.37 | 0.02 | 5.99 | 2.89 | |
| ESP32/42 | 59.77 | 0.85 | 19.62 | 6.29 | 0.06 | 1.30 | 1.76 | 1.04 | 2.33 | 0.15 | 0.13 | 0.02 | 6.68 | 3.05 | |
| ESP35/45 | 59.23 | 0.87 | 19.91 | 6.65 | 0.07 | 1.62 | 1.93 | 1.14 | 2.26 | 0.17 | 0.15 | 0.02 | 5.96 | 2.97 | |
| Silo | 60.30 | 0.90 | 20.81 | 6.74 | 0.06 | 1.35 | 1.89 | 1.11 | 2.44 | 0.17 | 0.17 | 0.02 | 4.04 | 2.90 | |
| S2 | ECO | 68.25 | 0.67 | 15.40 | 8.42 | 0.06 | 1.49 | 1.13 | 0.73 | 1.33 | 0.11 | 0.33 | 0.27 | 1.81 | 4.43 |
| ESP12 | 62.52 | 0.84 | 19.16 | 7.89 | 0.04 | 2.02 | 1.25 | 1.33 | 1.78 | 0.13 | 0.30 | 0.02 | 2.72 | 3.26 | |
| ESP22 | 57.22 | 0.95 | 21.76 | 8.32 | 0.05 | 2.38 | 1.61 | 1.62 | 2.10 | 0.21 | 0.43 | 0.02 | 3.32 | 2.63 | |
| ESP32/42 | 56.65 | 0.98 | 22.18 | 7.62 | 0.06 | 1.88 | 1.86 | 1.43 | 2.38 | 0.23 | 0.37 | 0.02 | 4.33 | 2.55 | |
| Silo | 61.07 | 0.87 | 19.65 | 8.13 | 0.04 | 2.05 | 1.36 | 1.32 | 1.88 | 0.14 | 0.35 | 0.02 | 3.12 | 3.11 | |
| S3 | BA | 65.89 | 0.77 | 18.03 | 8.85 | 0.07 | 1.44 | 1.57 | 0.94 | 1.89 | 0.14 | 0.09 | 0.02 | 0.30 | 3.65 |
| ESP12 | 61.02 | 0.86 | 19.94 | 7.70 | 0.06 | 1.33 | 1.58 | 1.06 | 2.10 | 0.15 | 0.25 | 0.02 | 3.93 | 3.06 | |
| ESP22 | 57.20 | 0.94 | 21.63 | 7.93 | 0.06 | 1.38 | 1.78 | 1.20 | 2.31 | 0.19 | 0.30 | 0.02 | 5.05 | 2.64 | |
| ESP32 | 54.78 | 0.99 | 22.35 | 8.71 | 0.07 | 1.52 | 1.97 | 1.22 | 2.39 | 0.28 | 0.45 | 0.03 | 5.24 | 2.45 | |
| Silo | 60.91 | 0.84 | 19.66 | 7.48 | 0.06 | 1.36 | 1.60 | 1.07 | 2.08 | 0.17 | 0.18 | 0.02 | 4.56 | 3.10 | |
| S4 | BA | 66.56 | 0.79 | 17.60 | 9.01 | 0.07 | 1.56 | 1.65 | 0.94 | 1.88 | 0.10 | 0.03 | 0.02 | −0.20 | 3.78 |
| ECO | 63.11 | 0.70 | 16.23 | 8.37 | 0.07 | 1.76 | 1.63 | 0.87 | 1.70 | 0.11 | 0.05 | 0.01 | 5.38 | 3.89 | |
| ESP12 | 58.71 | 0.83 | 18.97 | 7.82 | 0.06 | 1.57 | 1.76 | 1.06 | 2.08 | 0.13 | 0.34 | 0.02 | 6.66 | 3.10 | |
| ESP22 | 54.79 | 0.90 | 20.52 | 7.92 | 0.07 | 1.60 | 1.95 | 1.16 | 2.25 | 0.17 | 0.56 | 0.02 | 8.09 | 2.67 | |
| ESP32 | 53.82 | 0.94 | 21.49 | 8.15 | 0.07 | 1.67 | 2.04 | 1.23 | 2.34 | 0.22 | 0.98 | 0.02 | 7.03 | 2.50 | |
| Silo | 58.94 | 0.85 | 19.31 | 7.84 | 0.06 | 1.62 | 1.83 | 1.06 | 2.14 | 0.14 | 0.42 | 0.02 | 5.76 | 3.05 | |
| Minimum | 53.82 | 0.66 | 15.15 | 6.29 | 0.04 | 1.24 | 1.13 | 0.73 | 1.33 | 0.10 | 0.03 | 0.01 | −0.20 | 3.55 | |
| Average | 60.52 | 0.85 | 19.50 | 7.70 | 0.06 | 1.60 | 1.74 | 1.12 | 2.11 | 0.16 | 0.27 | 0.03 | 4.34 | 3.10 | |
| Maximum | 68.25 | 0.99 | 22.35 | 9.01 | 0.08 | 2.38 | 2.04 | 1.62 | 2.45 | 0.28 | 0.98 | 0.27 | 8.09 | 3.05 | |
| CV (%) | 6.5 | 9.8 | 9.7 | 10.2 | 15.3 | 16.4 | 13.0 | 15.7 | 12.9 | 24.7 | 76.1 | 163.3 | 51.3 | 0.67 | |
| S1 | S2 | S3 | S4 | ||||||||||||||||||||||
|---|---|---|---|---|---|---|---|---|---|---|---|---|---|---|---|---|---|---|---|---|---|---|---|---|---|
| BA | ECO | ESP | Silo | ECO | ESP | Silo | BA | ESP | Silo | BA | ECO | ESP | Silo | ||||||||||||
| 12 | 15 | 22 | 25 | 32/42 | 35/45 | 12 | 22 | 32/42 | 12 | 22 | 32/42 | 12 | 22 | 32/42 | |||||||||||
| XRD (wt. %) | |||||||||||||||||||||||||
| Quartz (SiO2) | 11.5 | 24.8 | 12.5 | 16.1 | 10.3 | 12.8 | 12.5 | 13.6 | 12.3 | 21.4 | 21.9 | 11.0 | 10.1 | 20.4 | 19.5 | 16.1 | 11.1 | 6.8 | 16.7 | 8.8 | 18.0 | 12.0 | 8.1 | 7.0 | 13.5 |
| Cristobalite (SiO2) | 0.3 | 0.1 | 0.0 | 0.1 | 0.0 | 0.0 | 0.1 | 0.0 | 0.1 | 0.0 | 0.1 | 0.0 | 0.1 | 0.1 | 0.1 | 0.1 | 0.1 | 0.0 | 0.1 | 0.8 | 0.0 | 0.0 | 0.0 | 0.0 | 0.1 |
| Mullite (Al6Si2O13) | 6.6 | 8.3 | 4.7 | 5.2 | 4.4 | 5.1 | 4.6 | 5.3 | 5.1 | 6.7 | 7.5 | 4.4 | 5.2 | 6.9 | 12.5 | 5.8 | 5.2 | 4.6 | 6.6 | 6.6 | 4.6 | 4.1 | 3.1 | 3.5 | 5.8 |
| Cordierite (Mg2Al4Si5O18) | 0.2 | 0.1 | 0.2 | 0.1 | 0.1 | 0.2 | 0.0 | 0.1 | 0.1 | 0.1 | 0.3 | 0.1 | 0.1 | 0.2 | 0.1 | 0.2 | 0.1 | 0.1 | 0.1 | 0.5 | 0.2 | 0.1 | 0.1 | 0.1 | 0.1 |
| Albite (NaAlSi3O8) | 0.0 | 1.4 | 0.9 | 0.9 | 0.9 | 0.0 | 1.5 | 1.4 | 1.4 | 0.1 | 2.2 | 1.9 | 1.2 | 1.8 | 1.9 | 1.4 | 2.0 | 0.8 | 1.0 | 0.5 | 0.1 | 1.9 | 1.6 | 0.8 | 1.0 |
| Diopside ((Ca,Mg,Fe)2Si2O6)) | 0.1 | 0.7 | 0.8 | 1.3 | 0.4 | 0.0 | 0.2 | 1.2 | 1.4 | 0.3 | 0.5 | 0.8 | 1.9 | 1.1 | 0.5 | 0.3 | 0.8 | 1.3 | 0.2 | 0.0 | 0.4 | 0.5 | 0.6 | 0.7 | 0.4 |
| Calcium aluminate (Ca3Al2O6) | 0.1 | 0.5 | 0.1 | 0.0 | 0.1 | 0.1 | 0.1 | 0.0 | 0.2 | 0.0 | 0.4 | 0.5 | 0.3 | 0.2 | 0.1 | 0.3 | 0.3 | 0.3 | 0.2 | 0.1 | 0.1 | 0.2 | 0.4 | 0.3 | 0.3 |
| Rutile (TiO2) | 0.1 | 0.5 | 0.3 | 0.4 | 0.2 | 0.1 | 0.2 | 0.2 | 0.0 | 0.0 | 0.4 | 0.1 | 0.1 | 0.3 | 0.3 | 0.4 | 0.2 | 0.0 | 0.4 | 0.1 | 0.2 | 0.2 | 0.0 | 0.1 | 0.4 |
| Hematite (Fe2O3) | 0.6 | 0.6 | 0.7 | 1.0 | 0.6 | 0.7 | 0.6 | 0.9 | 0.5 | 1.4 | 0.8 | 0.5 | 0.6 | 1.8 | 2.3 | 0.7 | 0.7 | 0.5 | 0.6 | 1.1 | 1.1 | 0.6 | 0.5 | 0.4 | 0.9 |
| Maghemite (Fe2O3) | 1.0 | 1.2 | 0.2 | 0.5 | 0.4 | 1.3 | 0.4 | 0.5 | 0.5 | 2.3 | 0.0 | 0.1 | 0.3 | 0.7 | 0.7 | 0.5 | 0.5 | 0.3 | 0.3 | 2.0 | 3.2 | 0.4 | 0.3 | 0.2 | 0.5 |
| Magnetite (Fe3O4) | 0.0 | 2.0 | 0.9 | 1.5 | 0.9 | 1.1 | 1.0 | 0.0 | 0.0 | 0.5 | 2.0 | 1.7 | 0.8 | 0.2 | 0.5 | 0.8 | 0.5 | 0.8 | 1.5 | 0.1 | 0.4 | 0.6 | 0.8 | 0.7 | 1.1 |
| Magnesioferrite (MgFe2O4) | 0.0 | 0.2 | 0.4 | 0.7 | 0.0 | 0.0 | 0.0 | 1.0 | 0.5 | 0.0 | 0.2 | 0.2 | 0.0 | 0.7 | 0.0 | 0.2 | 0.3 | 0.0 | 0.2 | 0.0 | 0.0 | 0.5 | 0.0 | 0.2 | 0.3 |
| Hercynite (FeAl2O4) | 0.0 | 0.4 | 0.0 | 0.2 | 0.0 | 0.1 | 0.0 | 0.0 | 0.0 | 0.0 | 0.0 | 0.0 | 0.1 | 0.0 | 0.1 | 0.0 | 0.1 | 0.1 | 0.0 | 0.3 | 0.0 | 0.0 | 0.0 | 0.0 | 0.1 |
| Calcite (CaCO3) | 0.0 | 0.1 | 0.1 | 0.1 | 0.1 | 0.1 | 0.1 | 0.1 | 0.1 | 0.0 | 0.2 | 0.2 | 0.2 | 0.2 | 0.1 | 0.1 | 0.2 | 0.2 | 0.0 | 0.0 | 0.0 | 0.2 | 0.2 | 0.2 | 0.2 |
| Gypsum (CaSO4·2H2O) | 1.5 | 0.4 | 0.3 | 0.3 | 0.2 | 1.6 | 0.2 | 0.6 | 0.3 | 2.8 | 0.5 | 0.3 | 0.3 | 0.5 | 0.5 | 0.4 | 0.3 | 0.3 | 0.2 | 0.2 | 1.0 | 0.4 | 0.4 | 0.3 | 0.6 |
| Anhydrite (CaSO4) | 0.0 | 0.1 | 0.1 | 0.1 | 0.1 | 0.2 | 0.1 | 0.1 | 0.1 | 0.1 | 0.2 | 0.3 | 0.3 | 0.2 | 0.0 | 0.2 | 0.2 | 0.3 | 0.1 | 0.2 | 0.3 | 0.1 | 0.2 | 0.3 | 0.3 |
| Amorphous | 77.9 | 58.5 | 78.0 | 71.4 | 81.1 | 76.8 | 78.4 | 75.0 | 77.3 | 64.2 | 63.0 | 78.0 | 78.6 | 64.7 | 60.7 | 72.7 | 77.3 | 83.7 | 71.7 | 78.8 | 70.4 | 78.3 | 83.8 | 85.4 | 74.7 |
| Petrography (vol.%) | |||||||||||||||||||||||||
| Glass | 78.9 | 71.2 | 76.1 | 72.0 | 80.2 | 77.6 | 79.8 | 77.4 | 79.6 | 72.2 | 76.3 | 83.1 | 83.6 | 79.0 | 80.5 | 78.8 | 84.2 | 77.3 | 76.8 | 79.6 | 71.2 | 74.3 | 75.9 | 79.3 | 76.9 |
| Quartz | 4.8 | 14.2 | 4.0 | 7.4 | 4.2 | 4.8 | 1.5 | 4.8 | 5.4 | 12.4 | 9.5 | 4.8 | 5.7 | 8.0 | 6.5 | 9.0 | 3.4 | 1.8 | 6.0 | 5.9 | 9.0 | 5.6 | 4.7 | 4.1 | 5.5 |
| Mulllite | 8.8 | 1.5 | 0.8 | 0.6 | 1.0 | 0.8 | 1.0 | 0.4 | 0.4 | 1.2 | 0.0 | 0.2 | 0.2 | 0.0 | 5.9 | 1.0 | 0.2 | 0.0 | 0.8 | 6.3 | 0.8 | 0.6 | 0.3 | 0.5 | 0.8 |
| Anorthite | 0.0 | 0.0 | 0.0 | 0.0 | 0.0 | 0.0 | 0.0 | 0.0 | 0.0 | 0.0 | 0.0 | 0.0 | 0.0 | 0.0 | 0.0 | 0.0 | 0.0 | 0.0 | 0.0 | 0.4 | 0.0 | 0.0 | 0.0 | 0.0 | 0.0 |
| Ferrosphere | 2.6 | 3.7 | 3.2 | 2.8 | 1.6 | 1.8 | 2.2 | 1.6 | 1.6 | 3.4 | 4.4 | 2.2 | 2.9 | 4.0 | 2.5 | 2.0 | 2.2 | 4.3 | 2.4 | 2.9 | 2.6 | 3.0 | 2.1 | 2.4 | 2.5 |
| Other | 2.4 | 2.0 | 3.8 | 3.2 | 2.0 | 1.8 | 2.0 | 3.0 | 2.8 | 1.0 | 2.2 | 1.8 | 0.7 | 2.0 | 1.3 | 1.2 | 0.6 | 3.7 | 2.4 | 3.1 | 1.8 | 1.4 | 1.6 | 2.4 | 3.7 |
| Partially baked | 2.2 | 5.2 | 1.3 | 3.0 | 1.6 | 2.4 | 2.5 | 1.2 | 3.2 | 6.4 | 3.4 | 2.4 | 1.2 | 4.0 | 2.1 | 3.0 | 1.0 | 0.7 | 4.0 | 1.4 | 5.6 | 3.8 | 0.3 | 0.5 | 2.9 |
| Char | 0.0 | 2.0 | 10.8 | 11.0 | 9.0 | 10.9 | 10.6 | 11.0 | 7.0 | 2.8 | 4.2 | 5.3 | 5.5 | 3.0 | 0.0 | 4.6 | 8.0 | 11.7 | 7.2 | 0.4 | 9.0 | 11.2 | 15.3 | 10.2 | 7.8 |
| Unburned coal | 0.0 | 0.0 | 0.0 | 0.0 | 0.4 | 0.0 | 0.5 | 0.6 | 0.0 | 0.6 | 0.0 | 0.2 | 0.2 | 0.0 | 1.1 | 0.4 | 0.4 | 0.5 | 0.4 | 0.0 | 0.0 | 0.2 | 0.0 | 0.5 | 0.0 |
| Minimum | Maximum | Range | Average | Coefficient of Variation (CV) | ||
|---|---|---|---|---|---|---|
| ppm | % | |||||
| S1 | Global | 159.94 | 207.80 | 47.86 | 190.65 | 7.19 |
| ESP 12–42 | 191.14 | 194.53 | 3.39 | 193.00 | 0.73 | |
| ESP 15–45 | 178.19 | 206.85 | 28.66 | 193.14 | 0.86 | |
| S2 | Global | 169.79 | 258.46 | 88.67 | 225.19 | 14.25 |
| ESP 12–42 | 220.24 | 258.46 | 38.22 | 244.84 | 7.12 | |
| S3 | Global | 197.48 | 266.07 | 68.59 | 226.76 | 10.33 |
| ESP 12–32 | 219.08 | 266.07 | 46.99 | 240.87 | 8.03 | |
| S4 | Global | 182.33 | 257.14 | 74.81 | 214.81 | 11.02 |
| ESP 12–32 | 205.09 | 257.14 | 52.05 | 230.06 | 8.10 | |
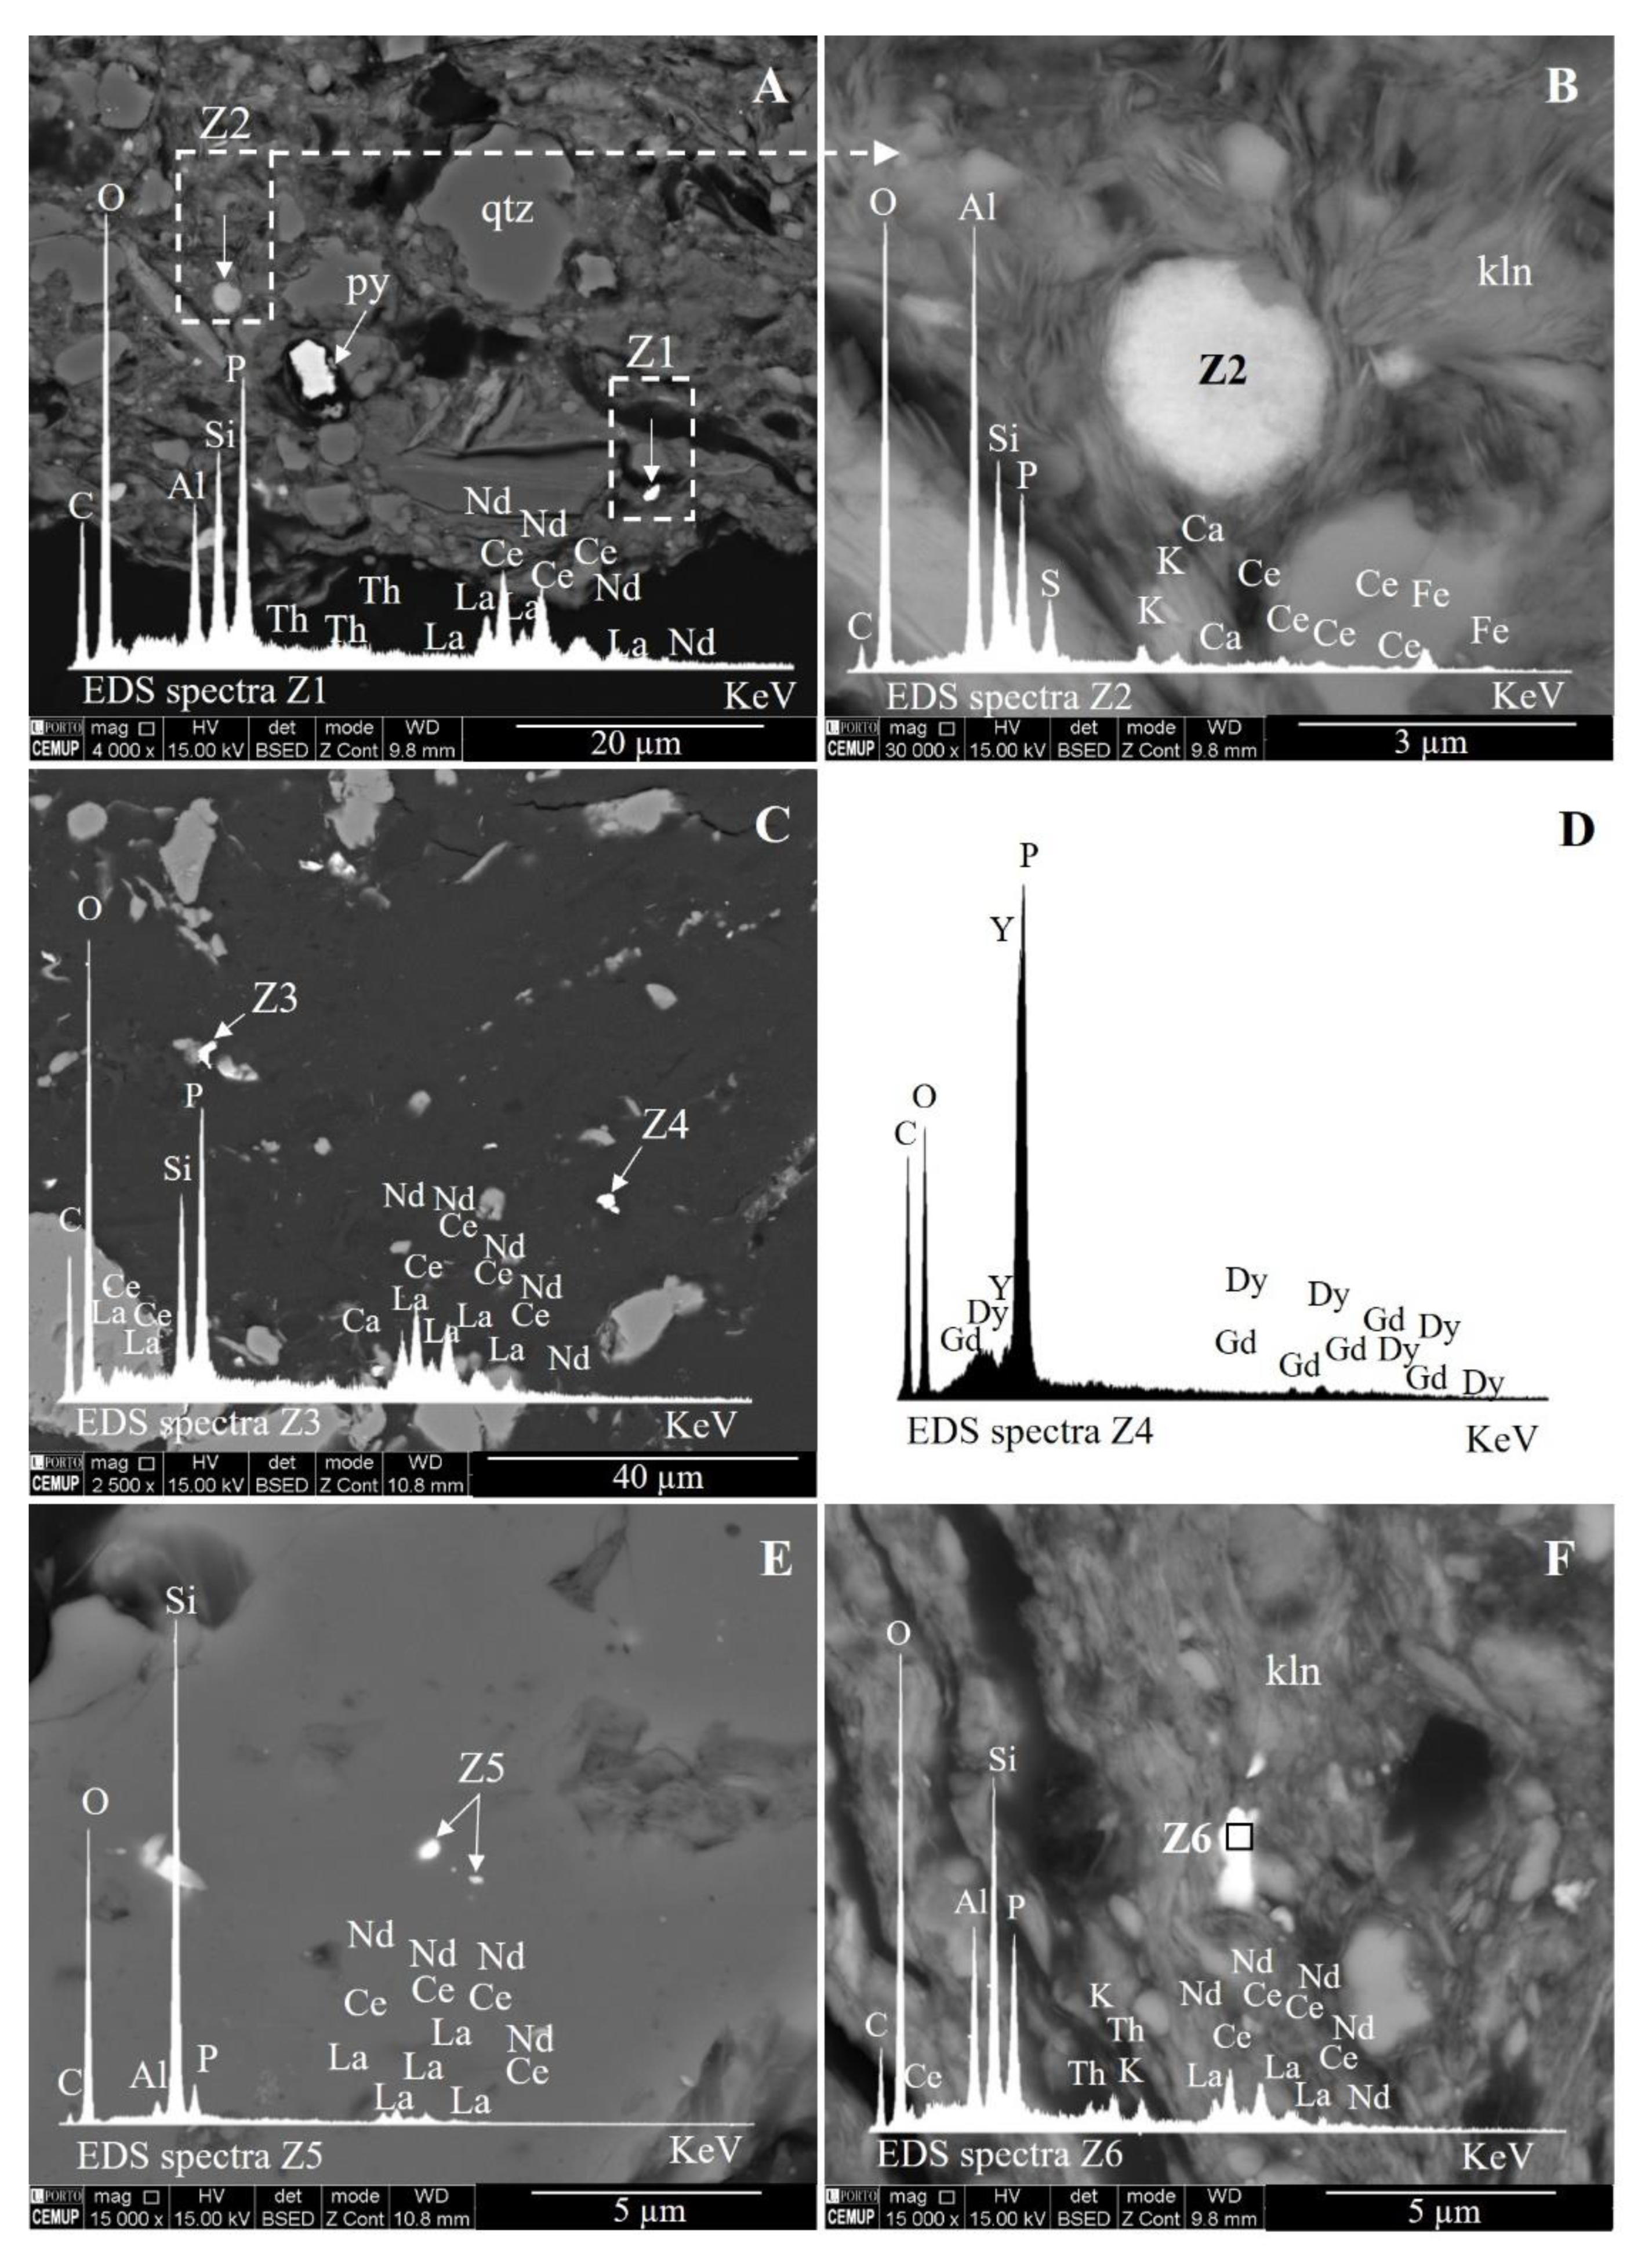
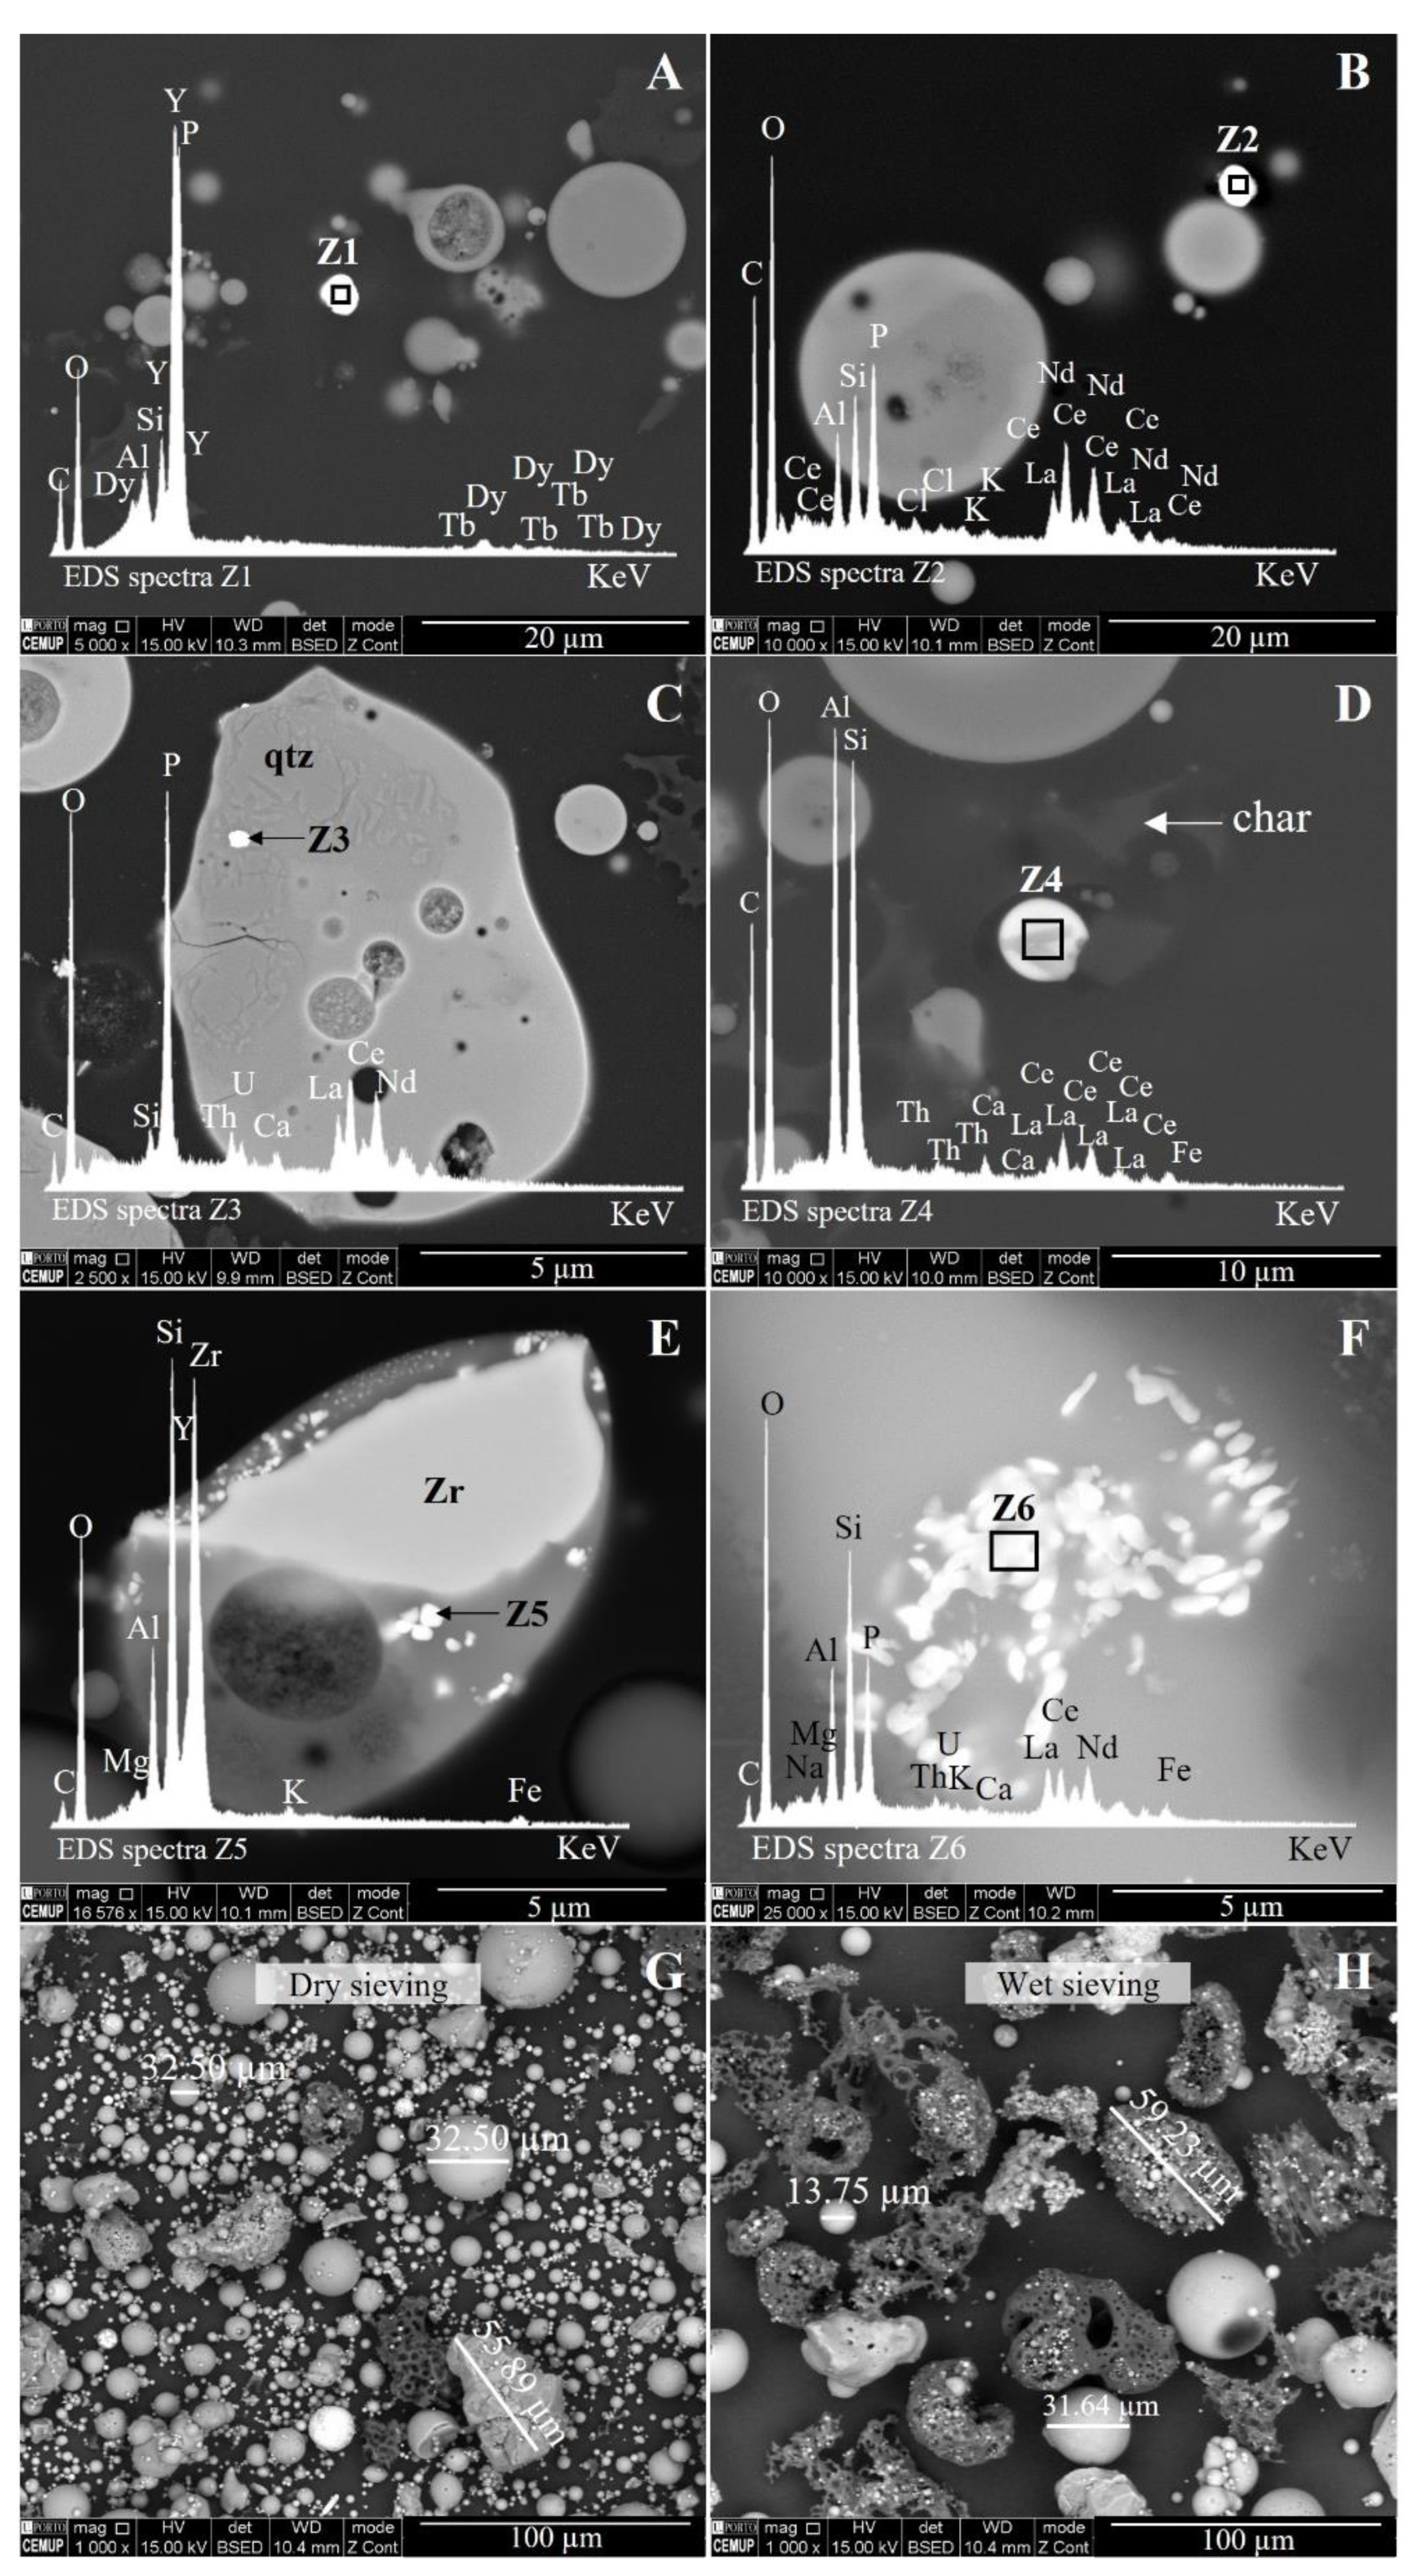
| Sample | Grains Counted | Size (µm) | Major Element (s) | REE Detected | Description |
|---|---|---|---|---|---|
| S1-BA | 1 | a 0.76 | P | Ce-La-Nd | Particles embedded in glass (Si-Al < Mg-Fe < K-Ti-Ca-Na) |
| S1-ECO | 1 | 3.07 | P | Ce-La-Nd | Spherical particle embedded in glass (Si-Al < Na-K < Fe-Mg-Ca) |
| S1-ESP 12 | 2 | 3.20 | Al-Si | Ce-La-Nd | Spherical particle retained on char pore |
| 1.55 | Si-Al | Y | Spherical discrete particle | ||
| S1-ESP 15 | 1 | 3.10 | P | Y-Tb-Dy | Rounded discrete particle |
| S1-ESP 22 | 2 | a 0.38 | Zr | Y | Particles embedded in Si-Al glass |
| 1.54 | P | Ce-La-Nd | Spherical discrete particle | ||
| S1-ESP 25 | 3 | 3.39 | P | Ce-La-Nd | Angular discrete particle |
| 2.14 | Al-Si | Ce-La-Nd | Spherical discrete particle | ||
| 2.48 | Al-Si | Ce-La-Nd | Spherical discrete particle | ||
| S1-ESP 32/42 | 5 | 2.64 | P | Ce-La | Angular discrete particle |
| 4.22 | Si-Al | Y-Dy | Spherical discrete particle | ||
| 5.01 | Si-Al | Ce-La-Nd | Spherical particle retained on char pore | ||
| 8.62 | P | Y-Dy-Er-Gd-Yb | Spherical discrete particle | ||
| 5.92 | P | Ce-La-Nd | Angular discrete particle | ||
| S1-ESP 35/45 | 1 | 6.13 | Al-Si | Ce-La-Nd | Spherical discrete particle |
| Silo | 1 | 2.89 | P | Ce-La-Nd | Spherical discrete particle |
| Total | 17 | Mean: 3.35 |
Publisher’s Note: MDPI stays neutral with regard to jurisdictional claims in published maps and institutional affiliations. |
© 2022 by the authors. Licensee MDPI, Basel, Switzerland. This article is an open access article distributed under the terms and conditions of the Creative Commons Attribution (CC BY) license (https://creativecommons.org/licenses/by/4.0/).
Share and Cite
Santos, A.C.; Guedes, A.; French, D.; Futuro, A.; Valentim, B. Integrative Study Assessing Space and Time Variations with Emphasis on Rare Earth Element (REE) Distribution and Their Potential on Ashes from Commercial (Colombian) Coal. Minerals 2022, 12, 194. https://doi.org/10.3390/min12020194
Santos AC, Guedes A, French D, Futuro A, Valentim B. Integrative Study Assessing Space and Time Variations with Emphasis on Rare Earth Element (REE) Distribution and Their Potential on Ashes from Commercial (Colombian) Coal. Minerals. 2022; 12(2):194. https://doi.org/10.3390/min12020194
Chicago/Turabian StyleSantos, Ana Cláudia, Alexandra Guedes, David French, Aurora Futuro, and Bruno Valentim. 2022. "Integrative Study Assessing Space and Time Variations with Emphasis on Rare Earth Element (REE) Distribution and Their Potential on Ashes from Commercial (Colombian) Coal" Minerals 12, no. 2: 194. https://doi.org/10.3390/min12020194