Abstract
Precise identification of material sources is of great significance to archaeological study, conservation, and restoration of stone cultural relics. The present study proposes a simple and efficient approach to identifying the material source of stone cultural relics based on portable X-ray fluorescence spectrometer (pXRF) and statistical analyses. Chemical elements of stone samples, including Ca, K, Fe, Al, Si, Cl, S, and Mg from both cultural relics and potential quarries, were first measured non-destructively using a pXRF device. Obtained chemical element data were then classified using statistical techniques (i.e., cluster analysis and principal component analysis) to match tested materials from cultural relics to the material from a quarry, thereby identifying the material source of stone cultural relics. The proposed method was applied to identify the material sources of the Jin Gang Throne Tower (JGT Tower), the stele of “Rebuilding Pu’ansi Temple” (PAS Stele), and the stele of “Renovation of Sanjinmiao Temple” (SJM Stele) in Beijing Stone Carving Art Museum. The study shows that pXRF can be used on-site for handheld, fast, inexpensive, and non-destructive measurements of the elemental composition of stone materials, being a powerful tool for identifying the material source of stone culture relics especially immovable and large-scale ones.
1. Introduction
Stone cultural relics, especially immovable ones, are important items of cultural heritage. Due to various natural forces, stone cultural relics are often subject to weathering over time; hence protection and repair measures are urgently needed. According to the principle of minimum intervention, the stones used for restoration should be the same used in cultural relics production.
Identification of the material source of stone cultural relics has been extensively dependent on ancient records. But many stone cultural relics do not have accurate records of their material sources. To resolve this conflict, many researchers have used geological methods to study the material sources of stone cultural relics and have made good progress. For example, Miller et al. [1] investigated geology indices of 172 stone carvings in Midwestern Scotland, including color, grain size, macroscopic mineralogy, textural and structural characteristics, clast distribution and composition, weathering characteristics, and magnetic susceptibility, etc., and compared these indices to corresponding indices of the outcrops or quarry rocks to determine the material source of stone carvings and the outcrops or quarries. Siegesmund et al. [2] compared the carbon-oxygen isotopic characteristics of marble used in the Jewish cemetery with that of marbles from several quarries to preliminarily screen the source. Then, by comparing the content of Mn, they determined the marble of the Jewish cemetery was from the Carrara quarry. Moon et al. [3] observed the petrological characteristics of the stone components of a city wall in Changnyeong County, South Korea as well as some nearby rocks, and determined the respective sources of the stone components of different lithologies. Lv et al. [4] studied the morphological characteristics and rock types of the bedding-stones in Liangzhu Neolithic city and investigated the lithologic features of the nearby exposures, then inferred those bedding-stones are from the hilly mountain and alluvial channels around Pingyao and Liangzhu towns.
Several researchers’ studies used the chemical element content of cultural relics and multivariate statistical methods to study their classifications or sources. For example, Sayre [5] applied multivariate statistical methods (Clustering methods, multivariate probability calculations, etc.) to analyze chemical data of Middle Eastern clay and pottery specimens, which were determined by Neutron Activation Analysis (NAA) [6,7,8]. Holmes et al. [9] used chemical data from NAA to distinguish stones from different quarries by the Marchlidean distance and the standard discriminant function and applied the methods to deduce the origin of stones for a medieval sculpture. Lizee et al. [10] performed transformation and principal component analysis on chemical data obtained from NAA of 70 ceramic archaeological samples and 5 clay samples from southern New England and divided these 75 samples into 5 groups. Baxter et al. [11] discussed a variety of multivariate statistical methods (e.g., Standard methods of multivariate analysis, Statistical modeling, etc.) and illustrated these methods in combination with Atomic Absorption Spectroscopy (AAS) data.
However, most studies using the above-mentioned geological methods require samples from the stone cultural relics for detailed petrological characteristics measurements or geochemical tests. These methods cannot be implemented when destructible samples are not available.
Proton-induced X-ray emission (PIXE) and Prompt gamma activation analysis (PAGG) are commonly used non-destructive testing techniques to characterize the chemical element composition of small-scale cultural relics such as ancient coins, ceramics, glaze, lithic ornaments, and symbolic artifacts [12,13,14]. Their results are accurate and are often combined with statistical analysis methods to group cultural relics [15,16,17,18,19,20]. However, these measurements can only be implemented in the laboratory. For many immovable and large-scale cultural relics that cannot be sampled, the chemical composition can only be determined by handheld and non-destructive equipment.
The portable X-ray fluorescence spectrometer (pXRF) devices are small in size, inexpensive, non-destructive, and rapid while maintaining reliability for analysis results. In recent years, pXRF has been widely used to measure in situ the chemical element composition of a large number of samples of various materials and/or combine statistical methods to show similarity and dissimilarity between them [21,22,23]. Hein et al. [24] tested the chemical elements of 287 ceramic fragments from Paphos of Cyprus with pXRF and grouped them by hierarchical clustering to preliminarily screen the ceramic sources. Khramchenkova et al. [25] tested the chemical elements of 20 frescoes from “The Assumption” Cathedral located in the island town of Sviyazhsk (Tatarstan Republic, Russian Federation) based on pXRF, and analyzed the mineral composition of the pigments to infer the formulas used by Russian craftsmen. Nash et al. [26] used pXRF to test the initial chemical characterization of all extant sarsen uprights and lintel stones at Stonehenge. McGarry et al. [27] tested the chemical elements of bone fragments and analyzed the element profiles of unburned and burned fragments with discriminant functions. Emmitt et al. [28] used pXRF to test the chemical elements of 23 Italian bronze armors from the pre-Roman period. Through “single point” assays and “cluster” assays, they found that bronze can be grouped by region and time based on changes in the content of some elements.
The above studies have shown the feasibility and effectiveness of matching stone relics to corresponding quarries through statistical analysis of the chemical element data measured by pXRF. However, due to the accuracy limitation of pXRF and the different applicable scopes and conditions of statistical analysis methods, a suitable unified statistical analysis method has never been determined. This has led to limitations for research on the material source of stone cultural relics using pXRF. To fill this gap, the present paper proposed a quick and non-destructive method to analyze the materials source of stone cultural relics using pXRF and statistical analysis. The method was applied to analyze the potential raw materials of the Jin Gang Throne Tower (JGT Tower) and two ancient steles in the Beijing Stone Carving Art Museum.
2. Contexts and Materials Studied
The JGT Tower is the first batch of key cultural relics under protection in China. It was built in 1403–1474 AD of the Ming Dynasty and was repaired during the Qianlong period (1735–1796 AD) of the Qing Dynasty, in the 1960s, and after the Tangshan earthquake in 1978. The JGT Tower is part of the Zhenjue Temple, with more than 200 rooms and pavilions. The Zhenjue Temple was destroyed by fire at the end of the Qing Dynasty, leaving only the JGT Tower. In 1987, the Beijing Stone Carving Art Museum was established at the original site of the Zhenjue Temple, which has more than 2600 stone cultural relics, including steles, epitaphs, statues, sutra pillars, stone carvings, and stone building components. Most of them were unearthed from the Beijing area, spanning the Eastern Han Dynasty (25–220 AD) to the Qing Dynasty (1636–1912 AD), and are important materials for studying Beijing’s history.
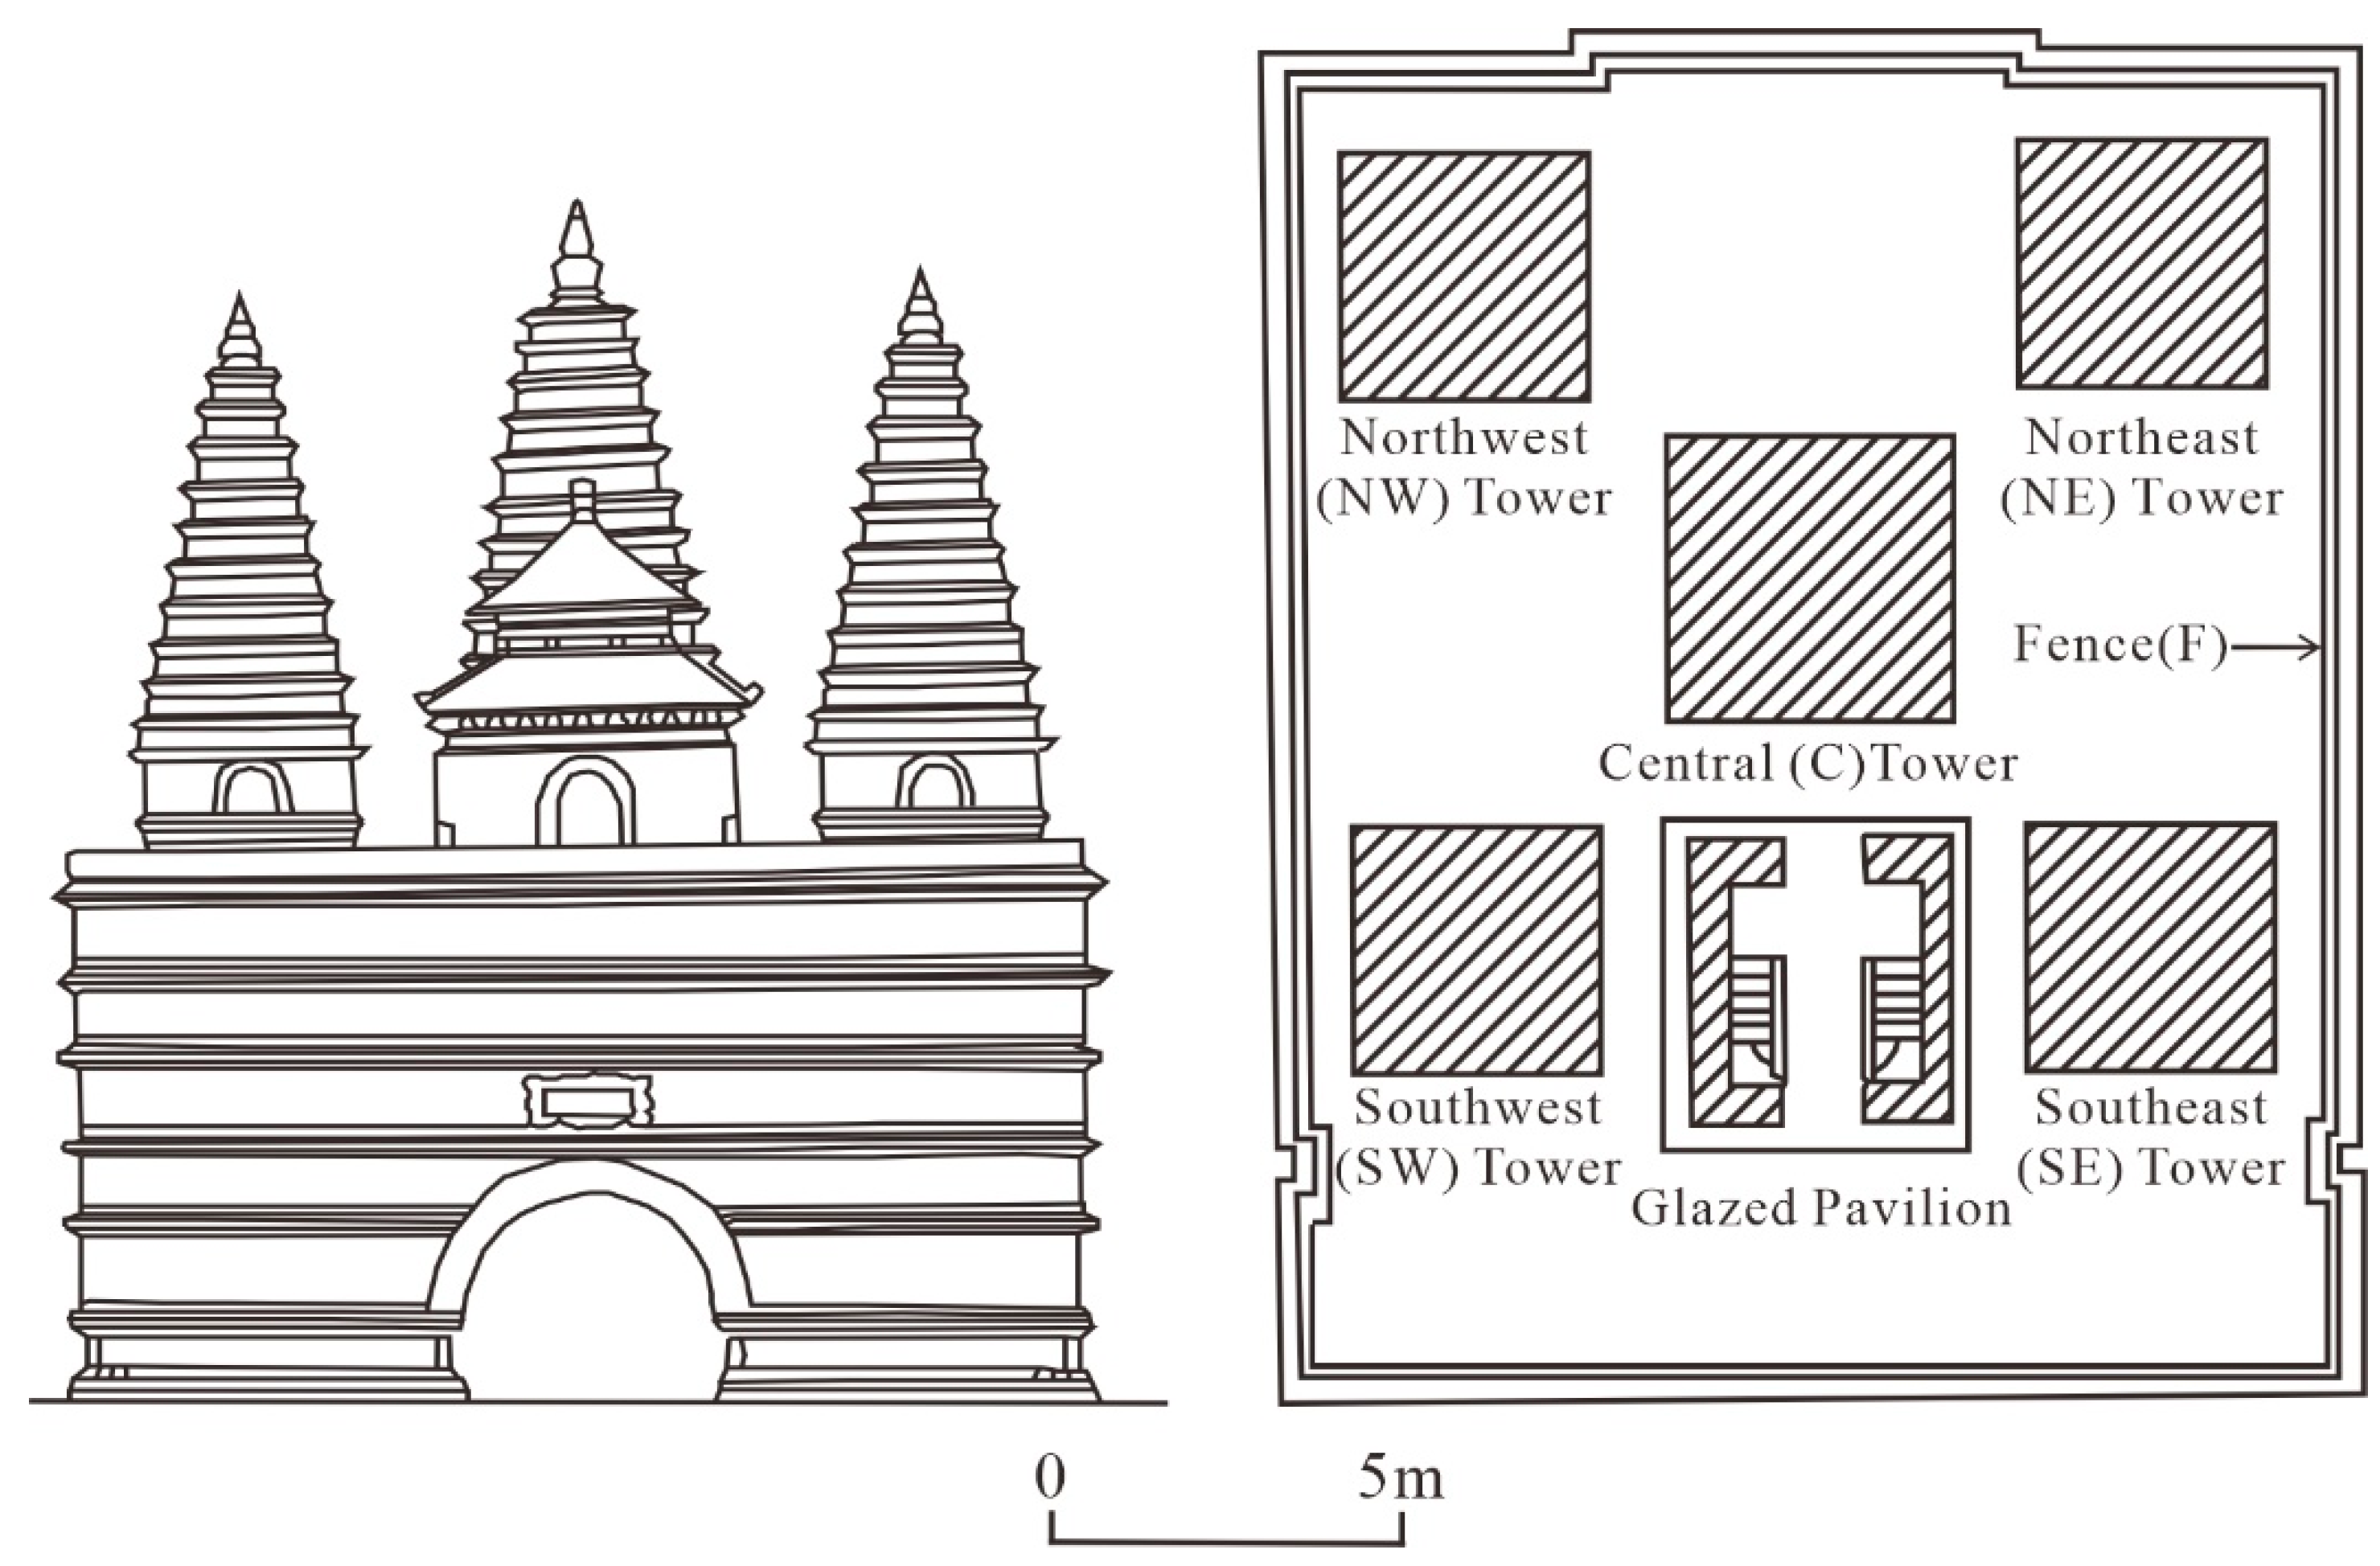
The JGT Tower consists of a pedestal, five small towers on the pedestal, fences, and a glazed pavilion ( Figure 1; Figure 2a). In this study, the five small towers are named the Northeast (NE) Tower, Northwest (NW) Tower, Central Tower, Southeast (SE) Tower, and Southwest (SW) Tower according to their locations (Figure 1). The overall length, width, and height of the JGT Tower are 18.6 m, 15.7 m, and 15.7 m, respectively. The height of the pedestal is 7.7 m, the height of Central Tower is 8 m, and the height of the other four towers is 7 m [29,30].
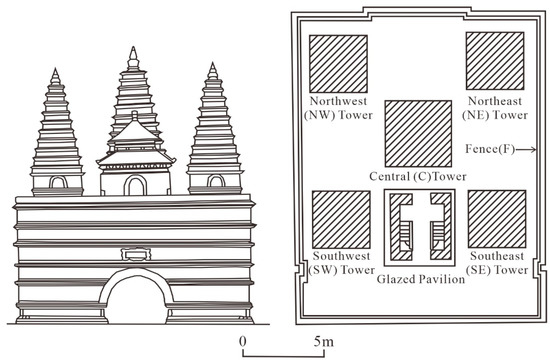
Figure 1.
South of the Jin Gang Throne Tower (JGT Tower) and layout of the five small towers and fence (redrawn from Sun [30]).
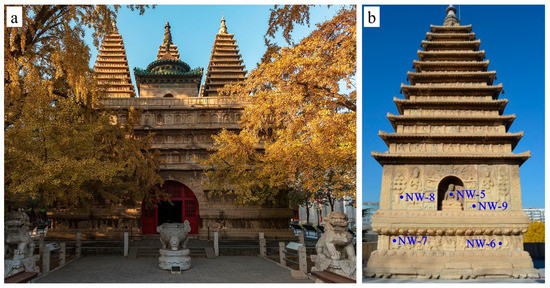
Figure 2.
The JGT Tower (a) and the south of the NW Tower (b).
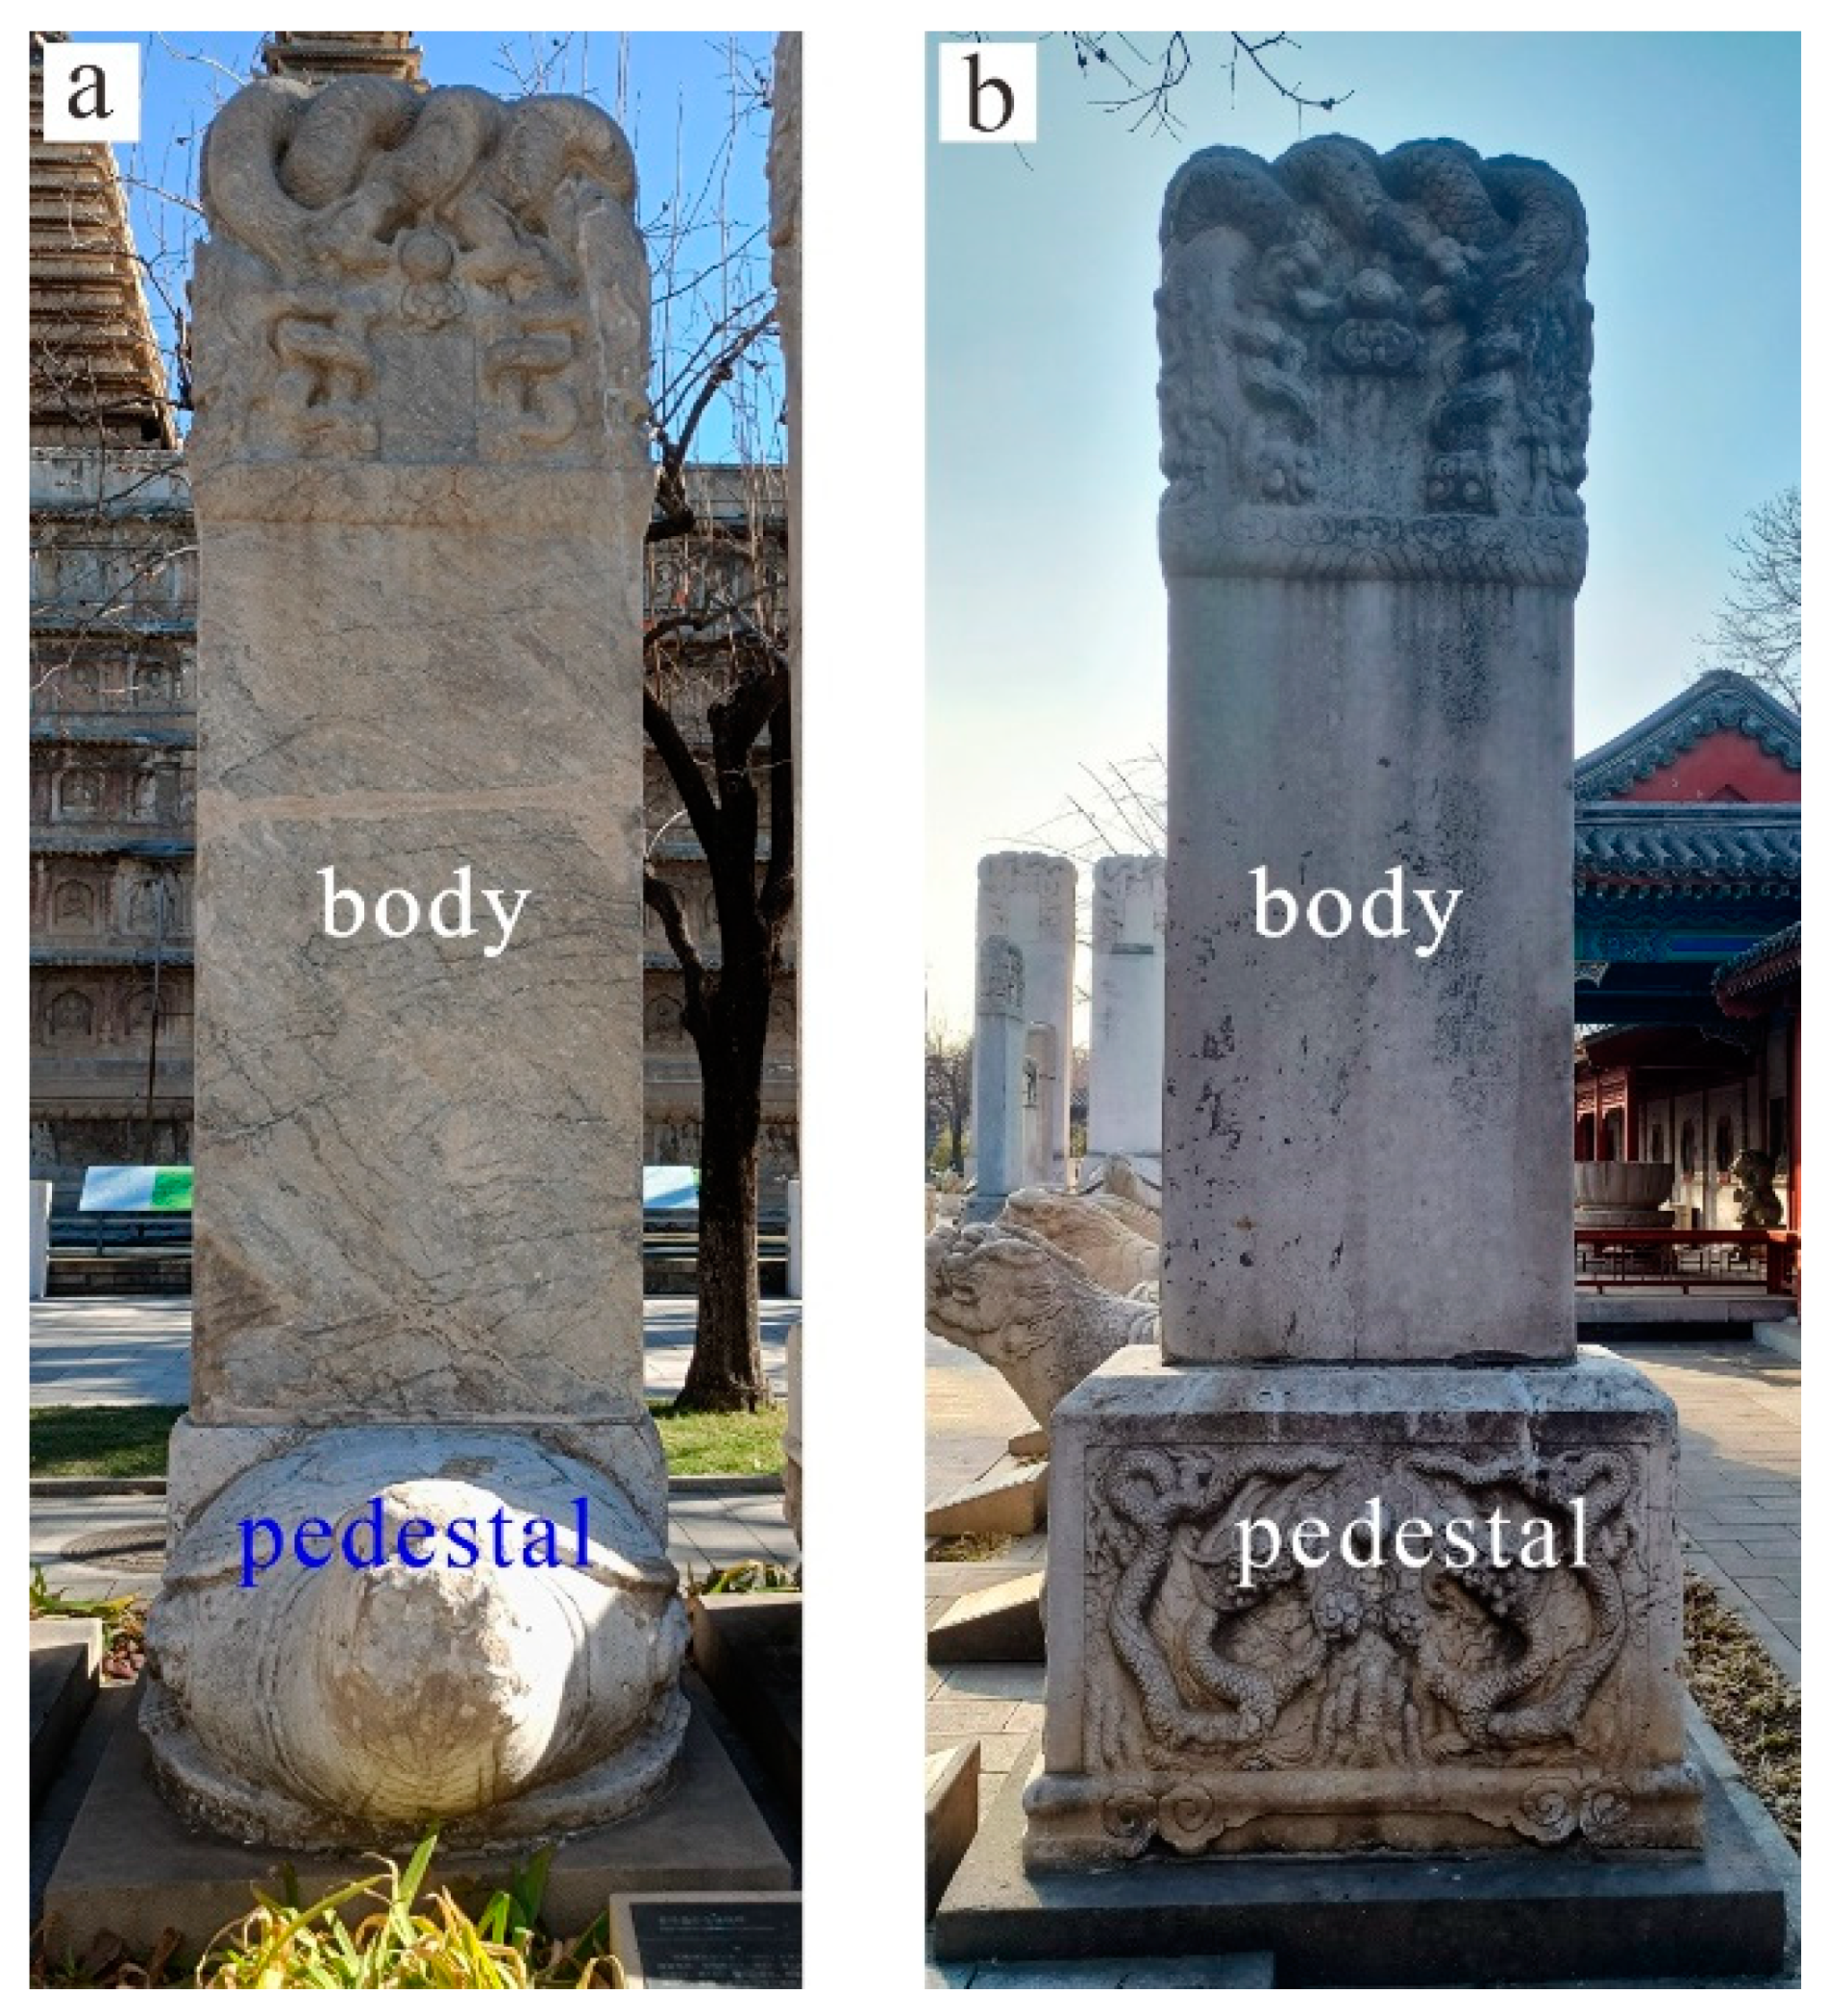
The two selected steles are the merits and virtues stele of “Rebuilding Pu’ansi Temple” (PAS Stele) and the stele of “Renovation of Sanjinmiao Temple” (SJM Stele). Table 1 and Figure 3 show their basic information.

Table 1.
Basic information of Rebuilding Pu’ansi Temple (PAS stele) and Renovation of Sanjinmiao Temple (SJM stele) in this study.

Figure 3.
Two ancient steles: PAS stele (a) and SJM stele (b).
At present, the JGT Tower is suffering from serious weathering and insufficient stability. Protection and repair plans have been formulated, in which the replacement of severely weathered stone is an option. Meanwhile, many other steles and stone carvings have been unearthed in the Beijing area. Not all stone cultural relics are recorded in historical records, and their material sources are unclear. Therefore, it is meaningful to study the potential raw material of the JGT Tower and the steles.
It is critical to determine the potential quarries that produce the raw material of the stone cultural relics based on historical records, lithology of the stone cultural relics, regional geological characteristics. Volume 3 of Fangshan county annals [31] in 1928 recorded that “Dashiwo is at the foot of Huanglong Mountain, 60 miles southwest of Fangshan, and produces greenish-white (Qingbai) marble and white (Hanbai) marble. The smaller ones are several feet, and the larger ones are tens of feet. The raw materials of the palace buildings are mostly collected here”. According to the record, the greenish-white marble and white marble cultural relics stones in Beijing were mostly quarried from the Dashiwo quarry in the Fangshan District of Beijing.
Based on a study carried out by Luo [29], the JGT Tower is a masonry structure where the internal section is made of bricks, and the external section is made of white marble. Therefore, it is preliminarily speculated that the stone used for the JGT Tower comes from the Dashiwo quarry. However, there is no research on the material source of PAS Stele nor SJM Stele, and no relevant historical records have been found. According to the description of Fangshan county annals [31] and Liu et al. [32], it is speculated that the raw materials of the two steles also come from the Dashiwo quarry.
3. Methodology
The key procedures of the method for identifying the material source of stone cultural relics are chemical element measurements using pXRF and statistical analysis of data. Specifically, (1) conduct fast and non-destructive chemical element content measurements on stone cultural relics and samples from potential quarries using pXRF; (2) apply statistical analysis methods to match the cultural relic stone and samples from a certain quarry based on the chemical element data, thereby determine the potential raw materials. When samples from cultural relics themselves are available (e.g., exfoliated materials from cultural relics), more elaborate tests (e.g., NAA and powder XRF) can be carried out in the laboratory, and statistical analysis can be performed to verify the results of pXRF analysis.
3.1. pXRF Chemical Element Measurement
A pXRF device (Niton™ XL3t, Thermo Fisher Scientific, Waltham, MA, USA) was used to test the content of 34 chemical elements in stone cultural relics and samples from quarries. The 34 chemical elements measured are Ca, K, Fe, Al, Si, Cl, S, Mg, Sr, Ba, Cr, Ti, Pb, Sn, Cd, Pd, Ag, Mo, Nb, Cr, Rb, Bi, As, Se, Au, W, Cn, Cu, Ni, Co, Mn, V, P and Bal, in which Bal represents light elements including C, H, and O. The “soil and ore” mode was used for the test; each measuring point took 70 s. The collected data were saved; only data points exceeding the limit of detection (LOD) of pXRF were saved for subsequent analyses. The LODs of various chemical elements are shown in Table 2.
Table 2.
Limit of detections (LODs) of portable X-ray fluorescence spectrometer (pXRF) for various elements (unit: ×10−6).
The greenish-white (Qingbai) marble and white (Hanbai) marbles [32,33] commonly used in Beijing’s stone cultural relics were selected as matching objects; they were all collected from the Dashiwo quarry, Fangshan District, Beijing. One measuring point on each sample was selected for the chemical element content test using pXRF, and 16 sets of data were obtained and represented by D1~D16, respectively.
Five small towers and fences from the JGT Tower (Figure 1) were used as sampling areas to study whether their stones come from the Dashiwo quarry. In each small tower, five measuring points were randomly selected on each side (Figure 2b) for chemical element content test using pXRF, and a total of 20 sets of data were obtained. Eight measuring points in the surrounding fences were selected for the pXRF test. In total, 107 sets of chemical element data from the JGT Tower were obtained (one measuring point was missed in the NW Tower). The measuring points were numbered in the form of “direction abbreviation-number”. For example, NW-1 represents the first measuring point of the NW Tower, and F-1 represents the first measuring point of the fences.
As for the two ancient steles, five measuring points were selected for chemical element measurement on the body and base parts, respectively, and 20 sets of chemical element data were obtained, which were numbered in the form of “stele-number”.
3.2. Statistical Analysis
Two statistical analysis methods, cluster analysis and principal component analysis (PCA) were used to analyze chemical element data.
3.2.1. Cluster Analysis
The cluster analysis used in this study includes Ward hierarchical clustering (WHC) and K-means clustering (KMC). WHC is based on the analysis of variance. When the classification is correct, the Sum of Squares of Deviations (SSD) within the group is relatively small, while the SSD between groups is relatively large. This method treats each sample as an independent group, then the two groups with the smallest increase in the total SSD [Equation (1)] are merged by calculating the variance between the centers of the groups until all groups are merged into one group. In practical applications, the classification effect of WHC is good, and it is widely used. Mo et al. [34] studied China’s aviation network structure using WHC and divided 29 airports and 60 routes into 4 groups and 3 levels, respectively. Liu et al. [35] measured the ion concentrations of 46 samples of groundwater and seepage in an iron mining area, and classified these samples into two major groups by WHC.
where S′ is the total SSD of k groups, k is the number of groups, Ni is the number of samples in the i-th group, Xij is the variable index vector of the j-th sample in the i-th group, and is the center of the i-th group.
KMC takes Euclidean distance [Equation (2)] as the criterion of similarity. It starts with k initial cluster centers and calculates the Euclidean distance between each sample and the k centers. Then all samples are classified into k groups according to the principle of the closest Euclidean distance, and the k cluster centers are recalculated. Through continuous iteration, the data are moved between different groups until convergence or reaching the number of iterations. Before KMC analysis, the number of clusters (i.e., K) should be determined. KMC has a small amount of calculation and high efficiency and is often applied to large datasets. Fang et al. [36] classified the Northeast China Cold Vortex activity paths into four types through KMC. Jansson et al. [37] combined principal component analysis and KMC to classify the rocks of two deposits in the Sara area of Sweden.
where dij is the Euclidean distance between two samples, and p is the p-th variable.
As mentioned above, chemical element data obtained by pXRF are sometimes higher than their LODs for some measuring points while lower for other points. In statistical analyses, the data below the LODs were regarded as missing values. As both WHC and KMC cannot analyze data with missing values, in the subsequent cluster analysis, the missing values are replaced by 1/2 of the LODs shown in Table 2.
3.2.2. Principal Component Analysis (PCA)
PCA is a commonly used method for data dimensionality reduction; it transforms many related variables into a small number of unrelated variables called principal components (PC). PCA obtains the PC scores of the samples, and then the samples can be classified according to PC scores. This method can use fewer variables to reflect the original information to the greatest extent, reduce the amount of calculation and reduce the complexity of the analysis problem. Forlay-Frick et al. [38] analyzed plate numbers and symmetry factor values of the three solutes in different systems through PCA and classified the systems. Oba et al. [39] proposed the Bayesian principal component analysis (BPCA) method, which can estimate the missing values in the data and apply them to DNA microarray data. As the chemical element data obtained by the pXRF tests contain missing values, BPCA is used to estimate the missing values and extract the PC.
3.3. Validation from Exfoliated Samples
Three exfoliated samples were collected from the JGT Tower and used for validation purposes. As the accuracy of the pXRF is lower than that of conventional powder XRF test, to verify the credibility of the statistical analysis results of the pXRF data, the chemical element of the exfoliated samples and samples of the Dashiwo quarry were tested using a PANalytical fluorescence spectrophotometer (X Pert MPD PRO, Amsterdam, The Netherlands). The tested chemical composition are major elements (Si, Ti, Al, Fe, Mn, Mg, Mg, Ca, Na, K, and P) and trace elements (Ba, Cr, Ni, Sr, V, and Cr). The loss on ignition (LOI) of each sample was determined by weighing before and after heating at 1000 °C for 4 h. Three exfoliated samples from the JGT Tower are marked as T-1, T-2, and T-3. Four samples from the Dashiwo quarry were chosen for the chemical composition test: DSW-1, DSW-2, DSW-3, and DSW-4.
After chemical element measurement, the cluster analysis and/or PCA can be performed to match the above seven samples. As the units of the major elements (wt%) and trace elements (×10−6) are inconsistent, the data should be first standardized before statistical analysis.
4. Results and Analysis
4.1. pXRF Test Results
Table 3 shows 16 sets of pXRF measurement results for 13 chemical elements in samples from the Dashiwo quarry. For all statistical analyses, data for the following 21 elements, namely, Pb, Sn, Cd, Pd, Ag, Mo, Nb, Cr, Rb, Bi, As, Se, Au, W, Cn, Cu, Ni, Co, Mn, V, and P, were omitted because that they were below their own LODs (<LOD). The chemical elements of samples are mainly Bal, Ca, Mg, and Si. Compared with other samples, the content of Si in D-13 (24.676%) is much higher, while the content of Bal, Ca, and Mg is lower. Zhang et al. [40] found that the Si content for a white marble sample from the Dashiwo quarry and for a sample from the Forbidden City was as high as 37.26% and 19.15%, respectively. Therefore, the data of D-13 is reasonable.
Table 3.
Chemical element data based on pXRF of samples from the Dashiwo quarry (unit: wt%).
Table 4 presents the 107 sets of chemical element data from the JGT Tower. To analyze the chemical element data of the samples from the Dashiwo quarry, only the data of 13 elements were retained. The elemental composition of the stone used for the five small towers and fence mainly includes Bal, Ca, Si, Fe, Al, and K, and a few measuring points also contain Mg. The content of Si or Ca at NW-10, NW-12, and SE-2 is anomalous, which most likely indicates that some materials such as stone or cement have been used to repair the JGT Tower on a small scale. Therefore, they are excluded from subsequent statistical analysis, and the remaining 104 sets of data were used.
Table 4.
Chemical element data based on pXRF of the five small towers and fences of the JGT Tower (unit: wt%).
Table 5 shows 20 sets of chemical element data of two ancient steles. The contents of the chemical elements in the body and the pedestal of the PAS stele are quite different. Compared with the pedestal, the contents of Ca, K, Fe, and Si in the body of the stele are higher, while the contents of Bal and Mg are lower. SJM stele is mainly composed of Bal, Ca, Mg, Si, and there is no difference in the content of chemical elements between its body and pedestal.
Table 5.
Chemical element data based on pXRF of PAS stele and SJM stele (unit: wt%).
4.2. JGT Tower
4.2.1. Results of Statistical Analysis
Cluster analysis (including WHC and KMC) and BPCA were applied, respectively, to match the Dashiwo quarry and JGT Tower using their chemical element data in Table 3 and Table 4.
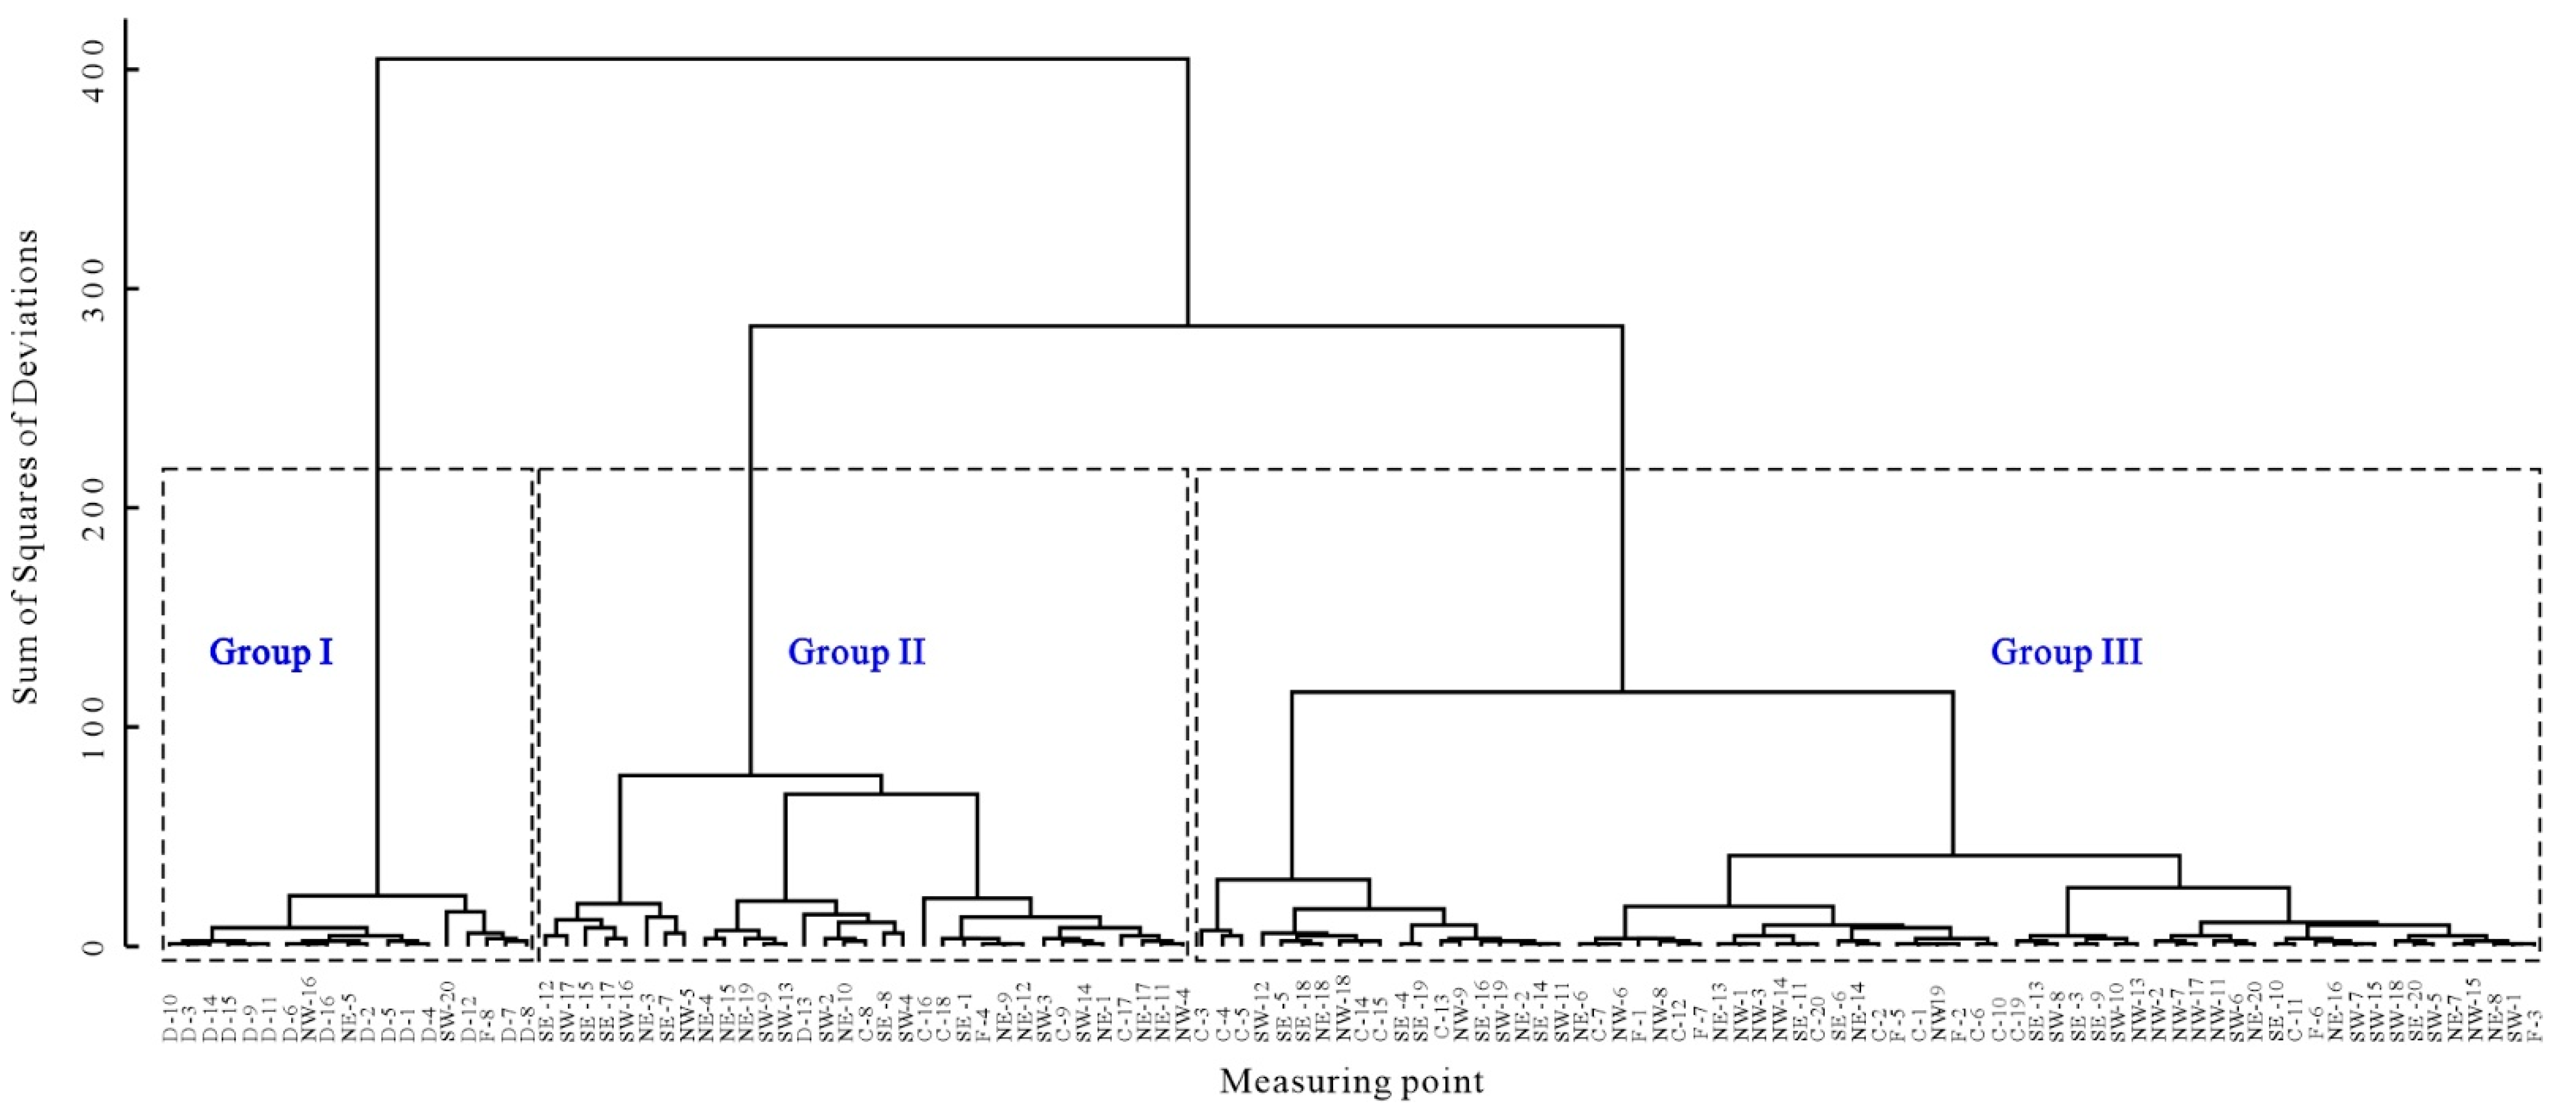
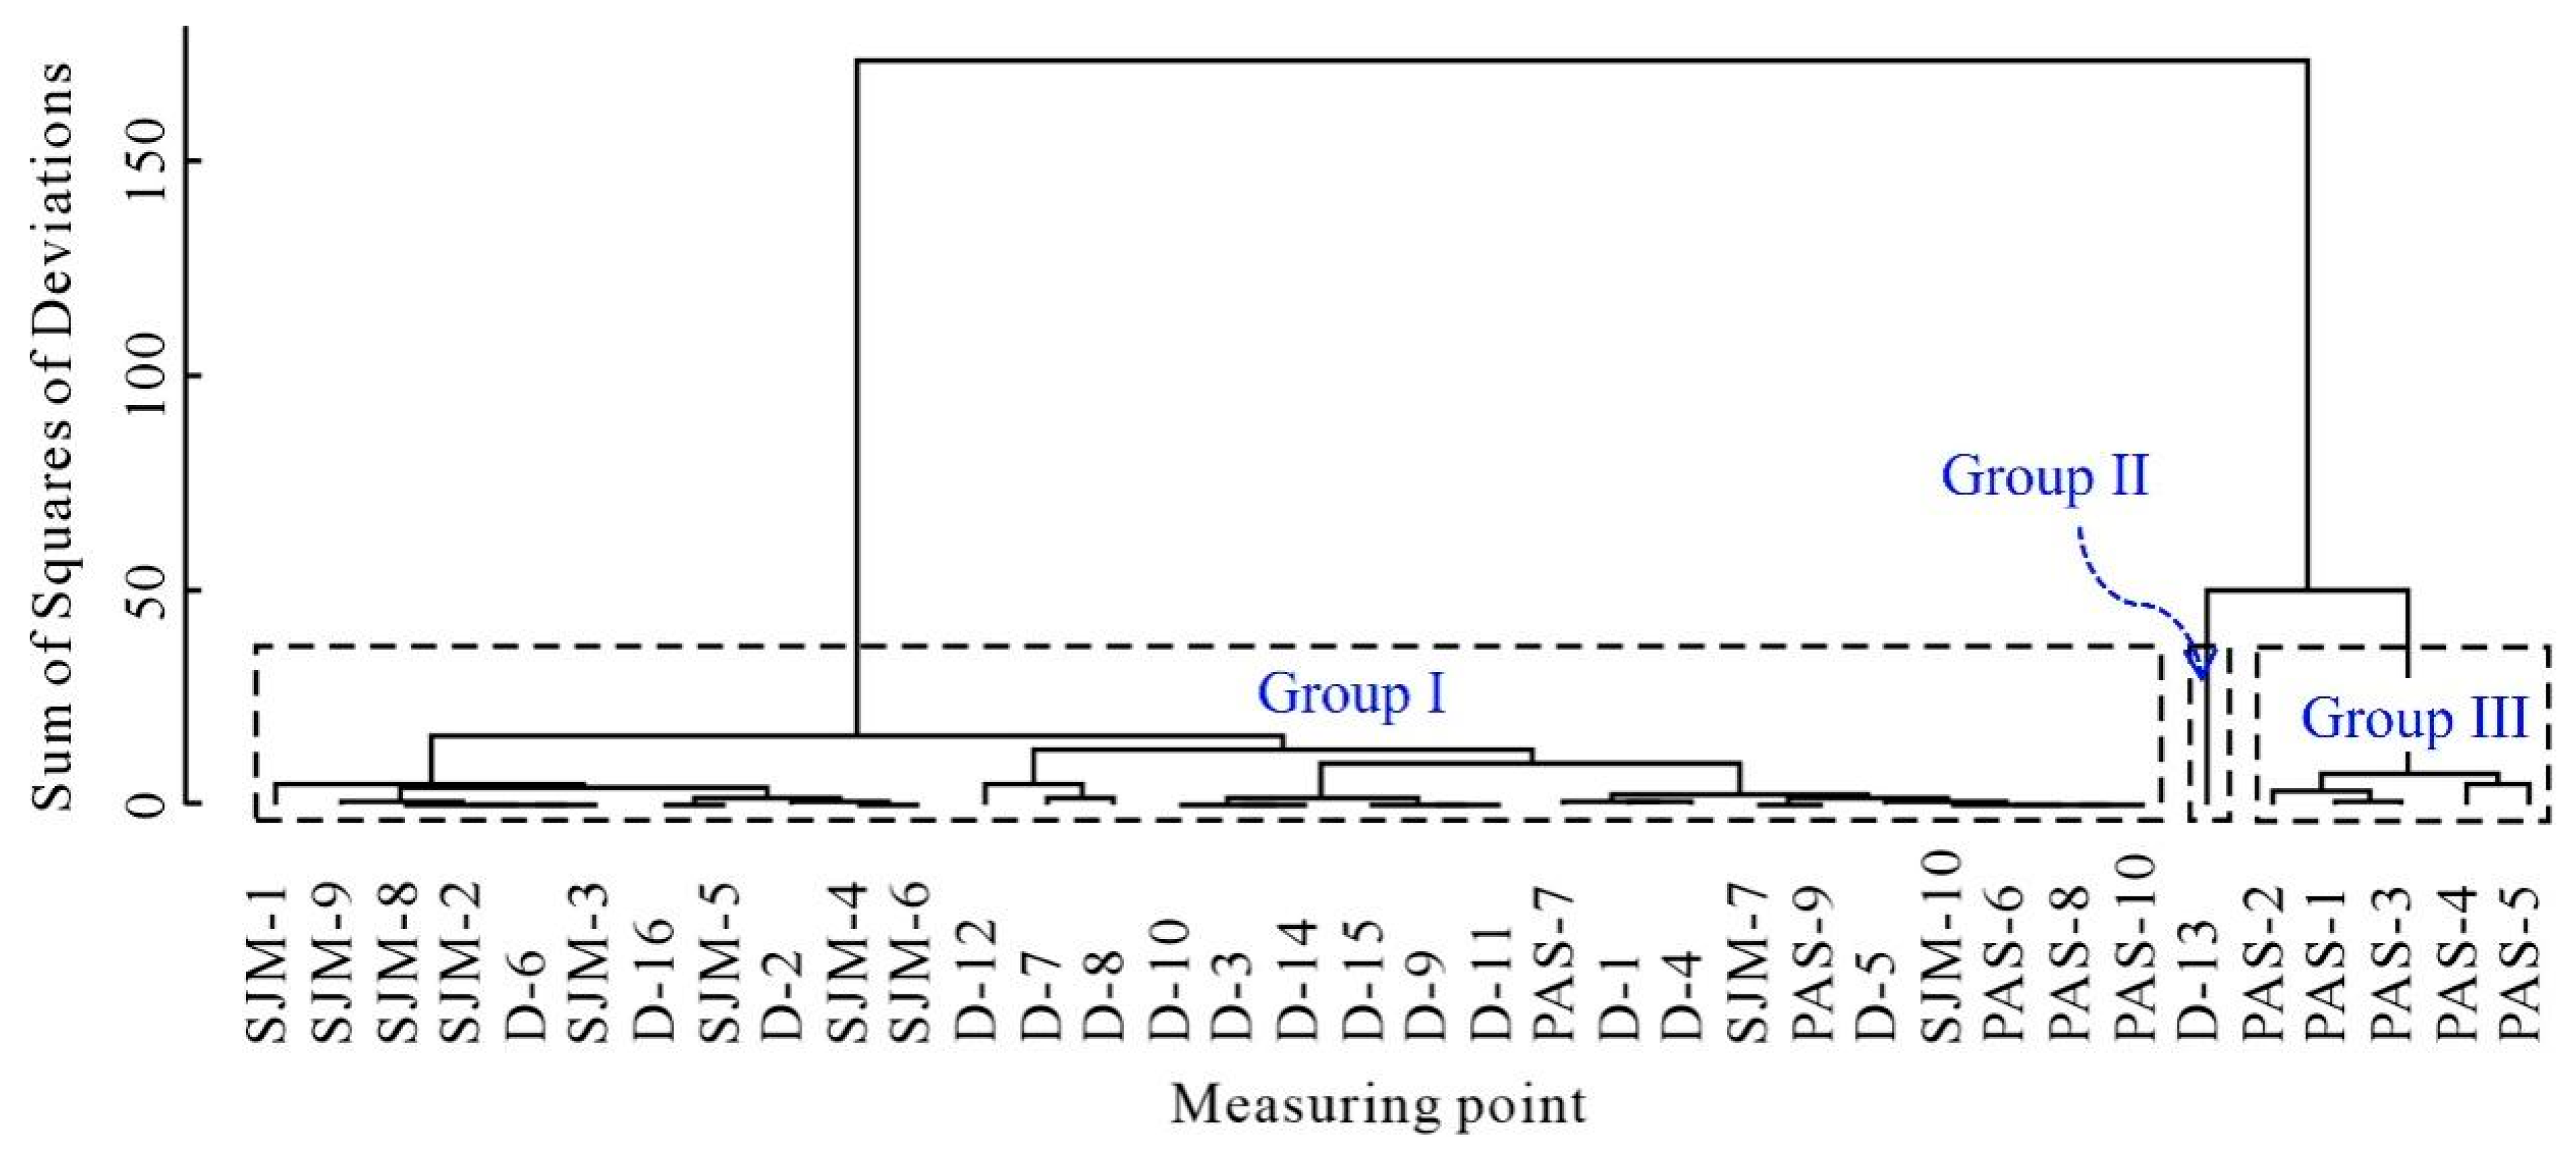
As shown in Figure 4, WHC divides the measuring points of the JGT Tower and samples from the Dashiwo quarry into three groups. Group I includes 15 measuring points of samples from the Dashiwo quarry, excluding D-13, and 4 measuring points (NW-16, NE-5, SW-20, F-8) of the JGT Tower. Group II contains D-13 and 32 measuring points of the JGT Tower, and the 68 measuring points in Group III are all from the JGT Tower.
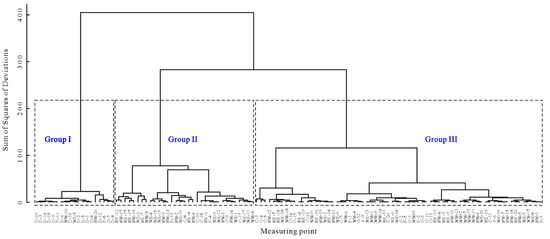
Figure 4.
Ward hierarchical clustering (WHC) dendrogram of chemical element data from the JGT Tower and samples from the Dashiwo quarry.
The centers of each group in Table 6 indicate that the 19 measuring points in Group I contain higher Bal and Mg, and lower Ca and Si; the 33 measuring points in Group II contain higher Si and S; the 68 measuring points in Group III contain higher Ca. NW-16, NE-5, and F-8 are classified into Group I due to their relatively high Bal and Mg content and low Ca content. SW-20 is classified into Group I due to its relatively high Bal content and low Ca content. D-13 is classified into Group II due to its high Si content.
Table 6.
Ward hierarchical clustering (WHC) centers of chemical element data from the JGT Tower and samples from the Dashiwo quarry (unit: wt%).
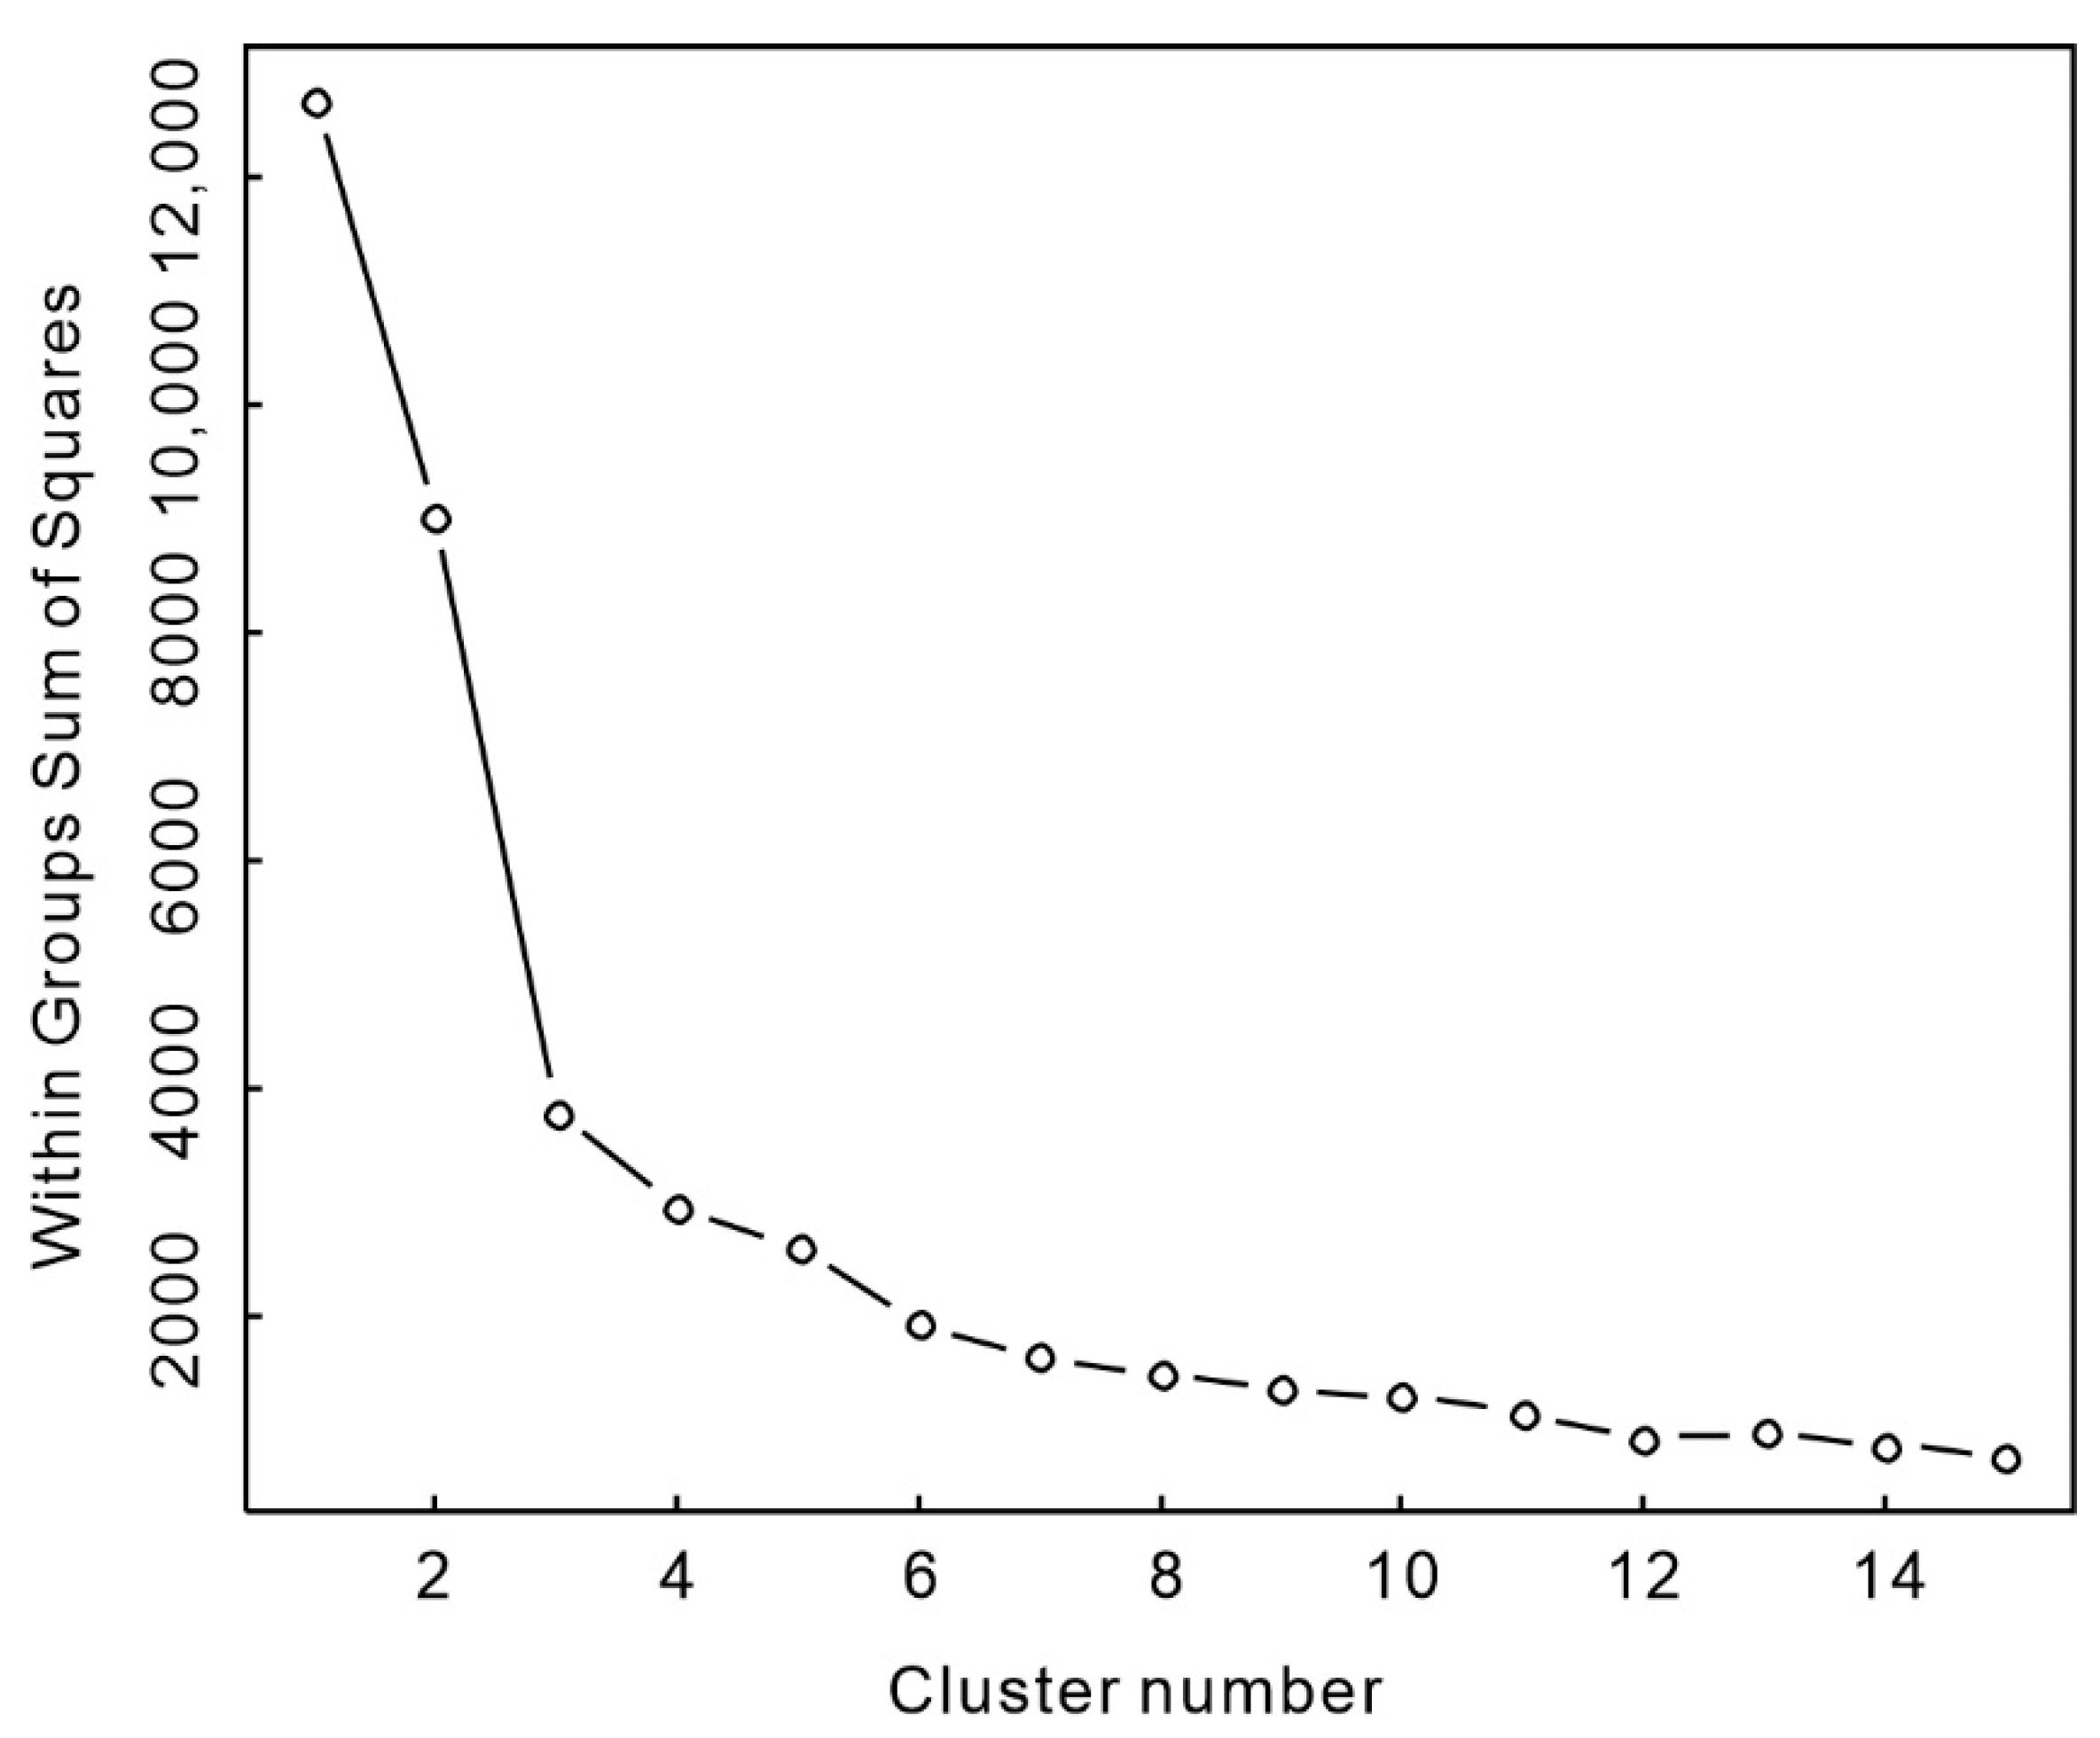
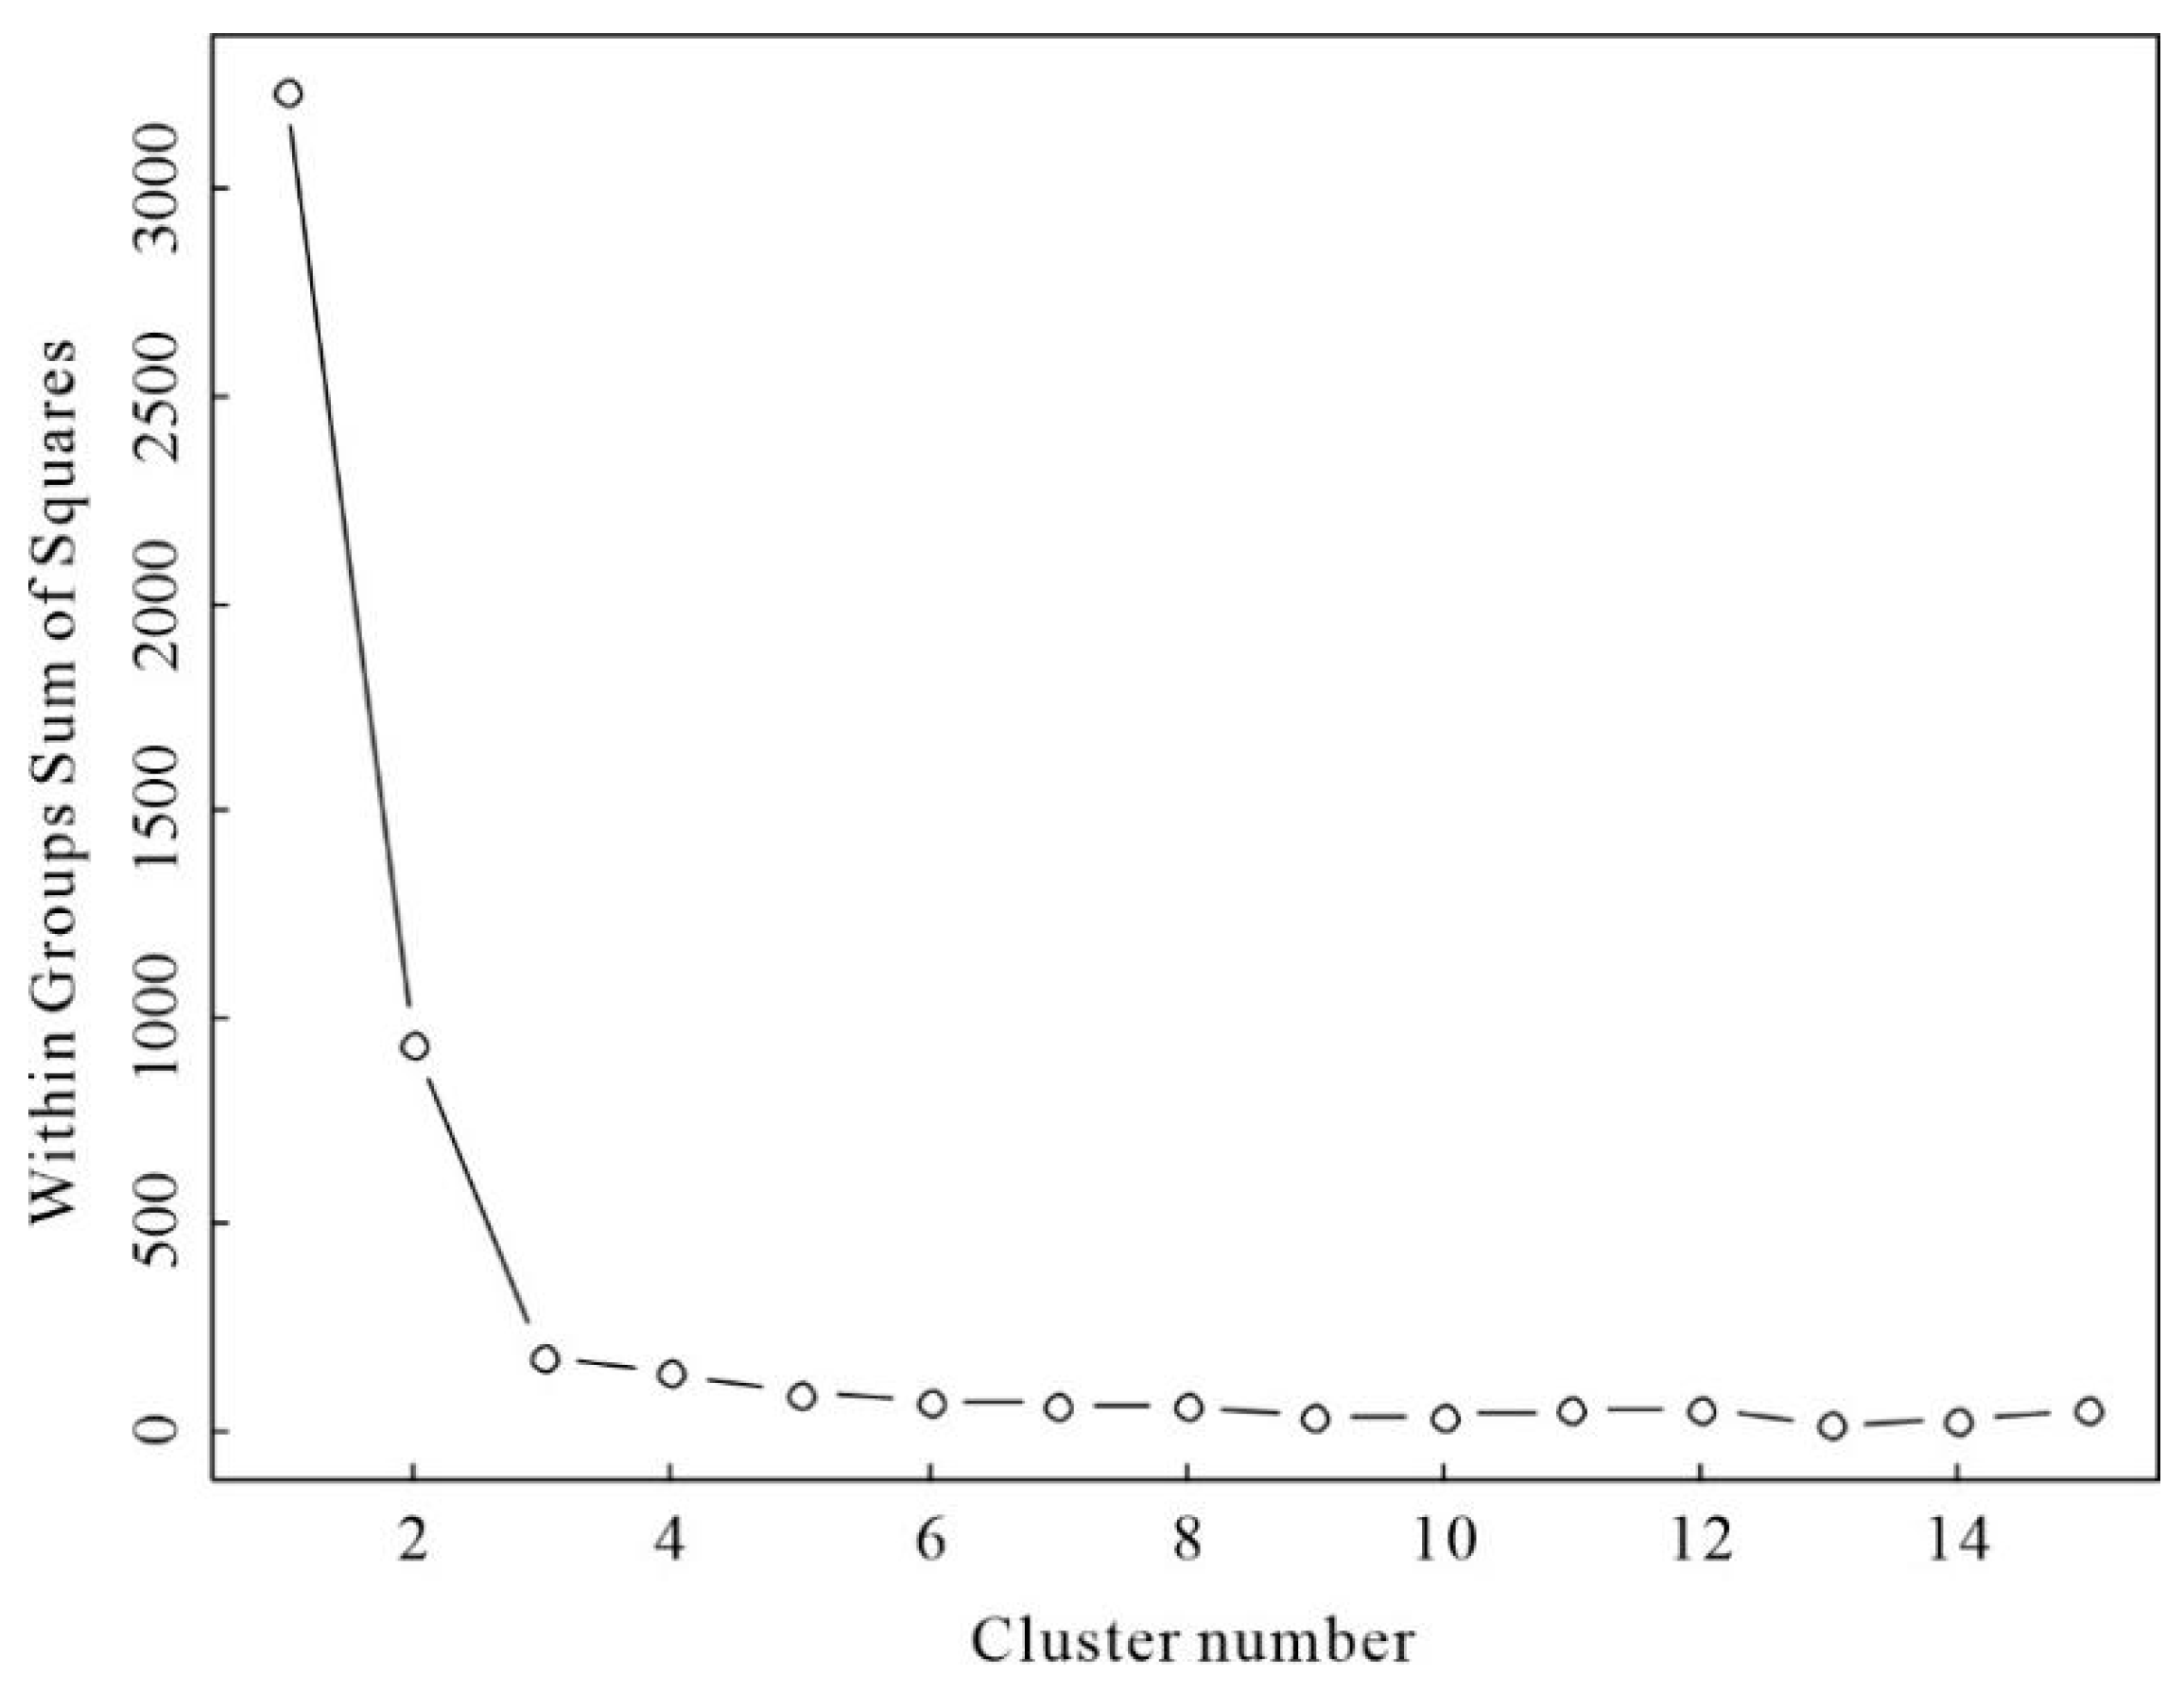
As for KMC results, first, the optimal cluster number is 3 (i.e., K = 3). As shown in Figure 5, when the cluster number is less than 3, the Within Groups Sum of Squares (WGSS) decreases rapidly. When the cluster number is greater than 3, WGSS decreases slowly. Table 7 shows the three group centers given by KMC. The 21 measuring points in Group I contain higher Bal and Mg, and lower Ca and Si. The 30 measuring points in Group II contain higher Si and S, and the 69 measuring points in Group III contain higher Ca. The group members in Table 8 show that Group I includes 15 measuring points of samples from the Dashiwo quarry excluding D-13 and 6 measuring points (NW-16, NE-5, SW-20, F-8, C-4, C-5) of the JGT Tower. Group II includes D-13 and 29 measuring points of the JGT Tower, and the 69 measuring points in Group III are all from the JGT Tower.

Figure 5.
Within Groups Sum of Squares (WGSS) with different cluster numbers of chemical element data from the JGT Tower and samples from the Dashiwo quarry.
Table 7.
K-means clustering (KMC) centers of the chemical element data from the JGT Tower and samples from the Dashiwo quarry (unit: wt%).
Table 8.
Group members of the chemical element data from the JGT Tower and samples from the Dashiwo quarry.
Due to the different principles of WHC and KMC, the group attribution of individual measuring points (i.e., F-4, C-4, C-5, NE-9, NE-10, SW-12, and SE-1) is different; the outlier is D-13. However, in general, the results of WHC and KMC are the same, indicating that the stone of the JGT Tower and samples from the Dashiwo quarry belong to different groups, thus the potential raw materials of the JGT Tower are not from the Dashiwo quarry.
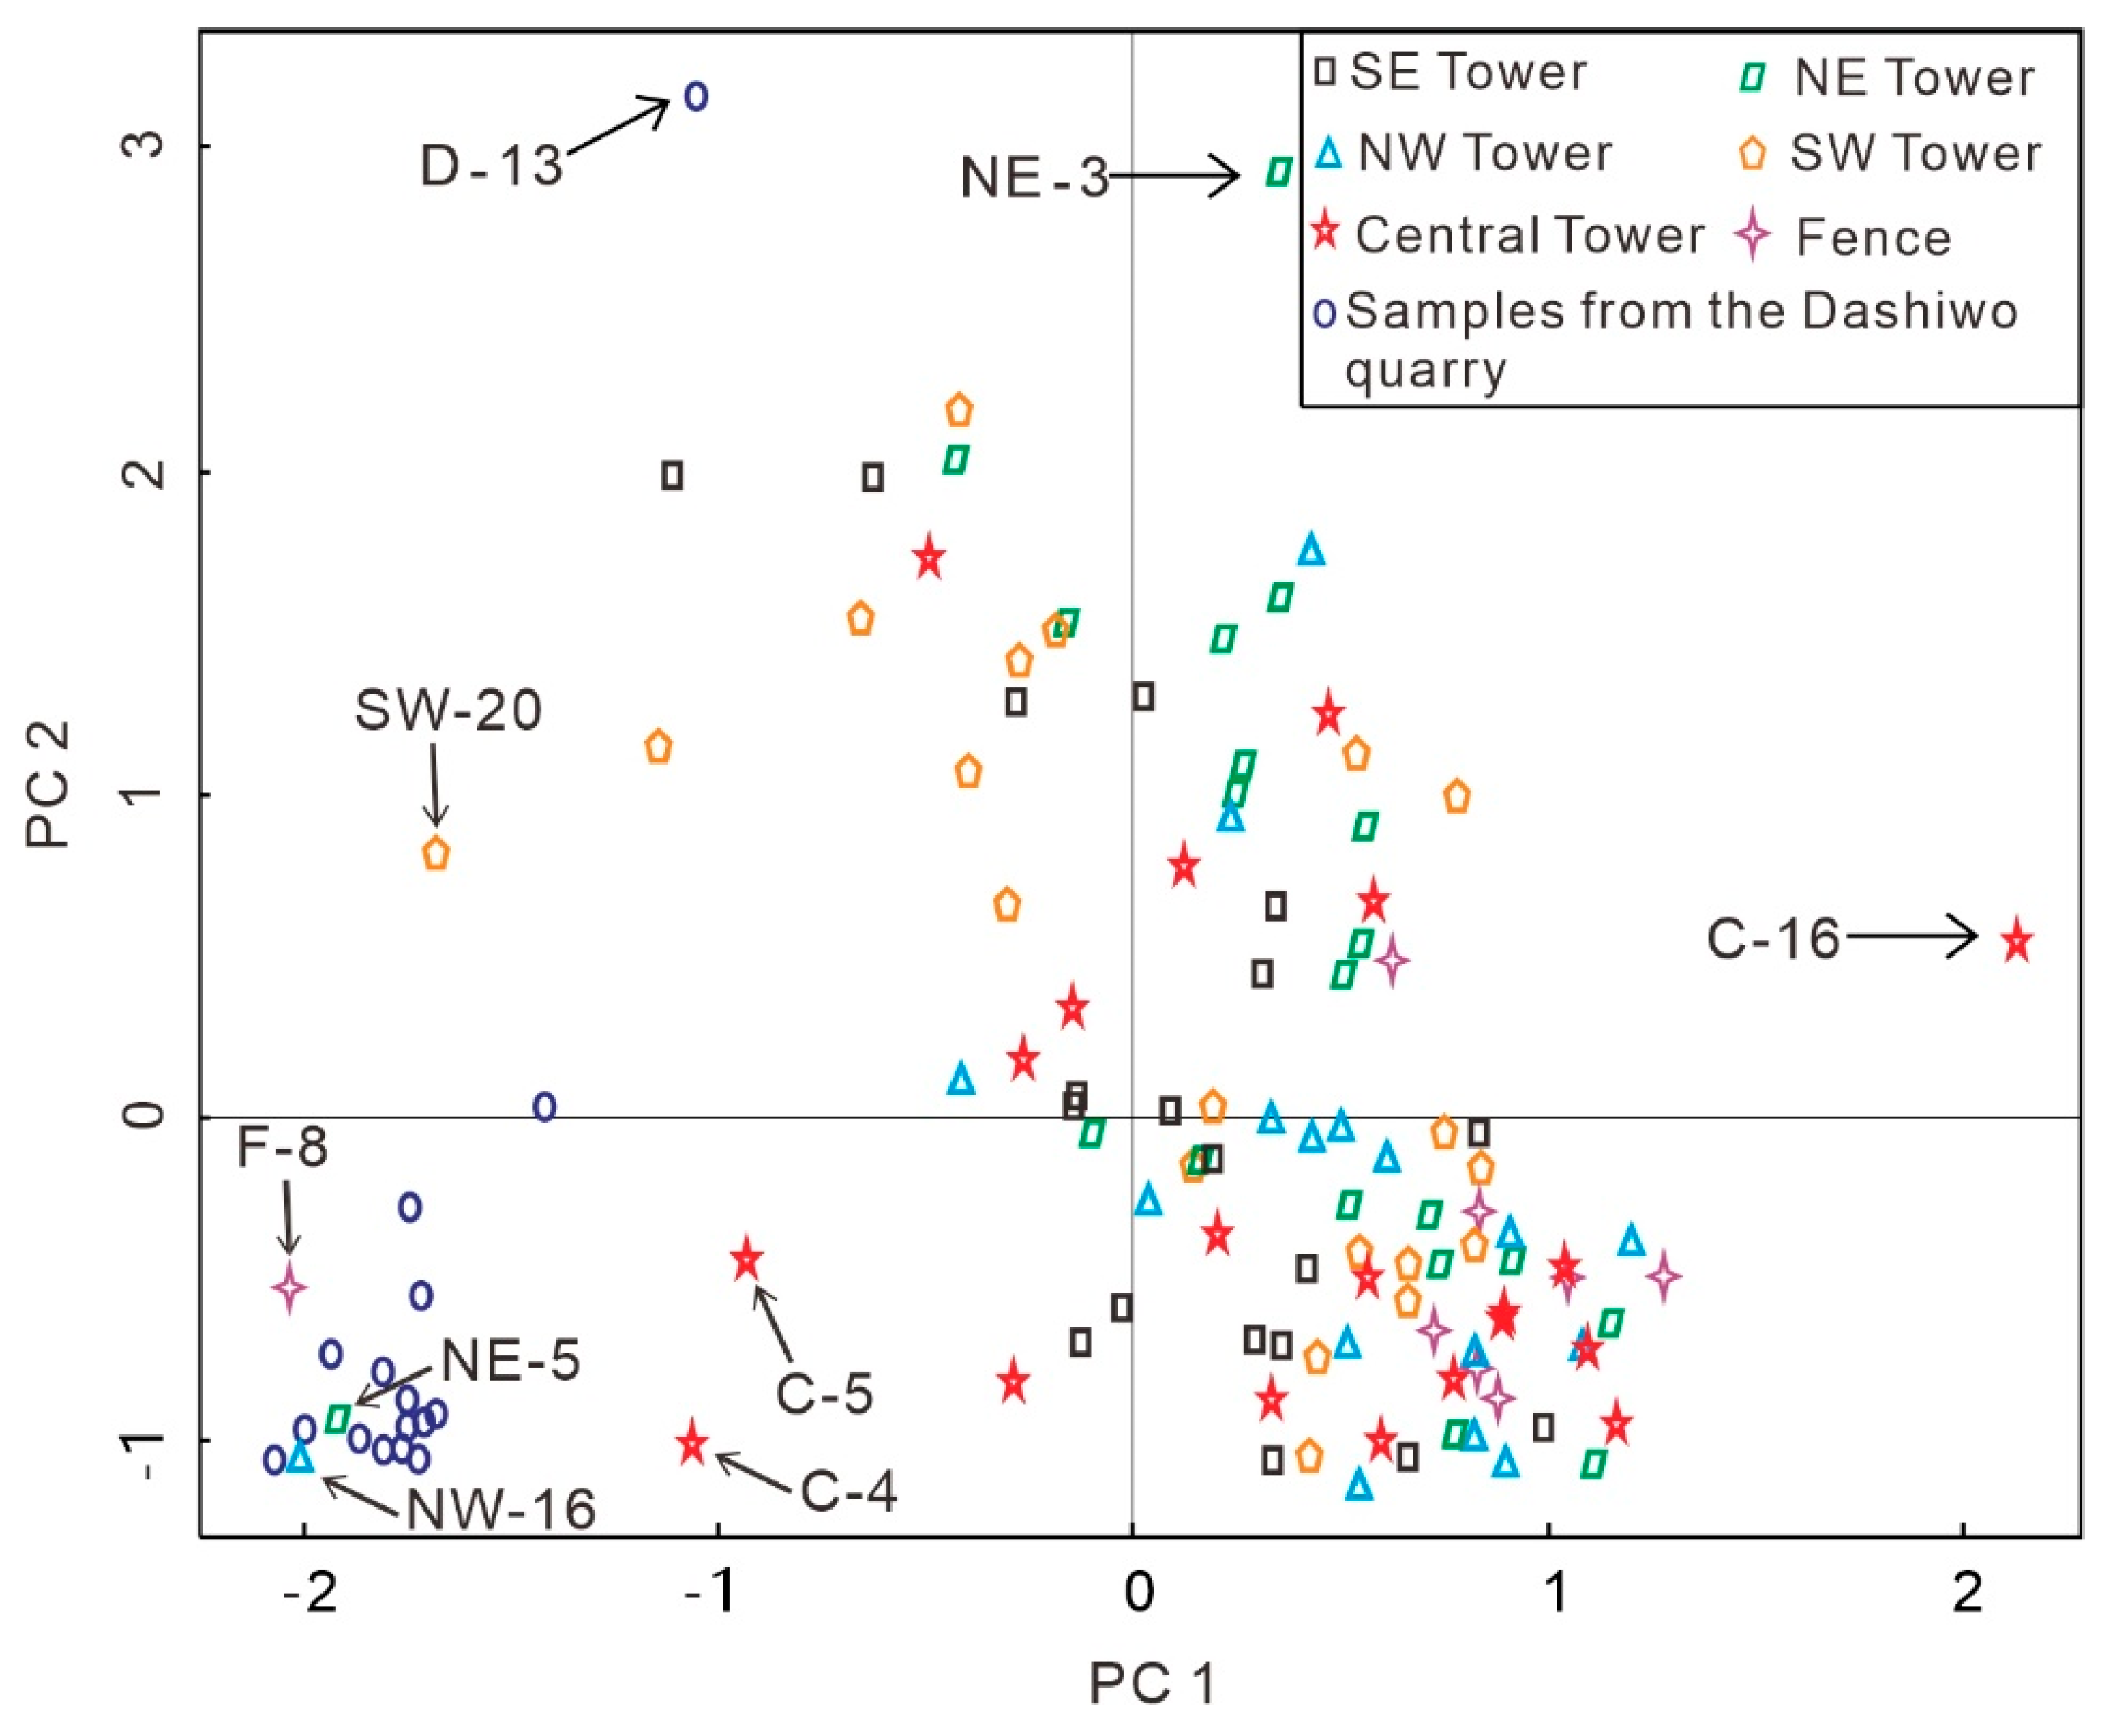
The PC were extracted from 120 sets of chemical element data from the JGT Tower (Table 4) and data of samples from the Dashiwo quarry (Table 3). The cumulative variance contribution rate of the first two principal components (PC1 and PC2) is 91.27%. According to the principle that the cumulative contribution rate of PC reached 85%, it can be considered that PC1 and PC2 contain all the information in the original data. Figure 6 is the Bayesian principal component (BPC) score diagram of 120 measuring points. Most measuring points of the JGT Tower are in the middle and lower part of the diagram. The measuring points of samples from the Dashiwo quarry (except D-13) and individual measuring points of the JGT Towers (i.e., NW-16, NE-5, and F-8) are concentrated in the bottom left of the diagram. This means that the raw material of the JGT Tower and the samples from the Dashiwo quarry can be divided into two groups, i.e., they are different.
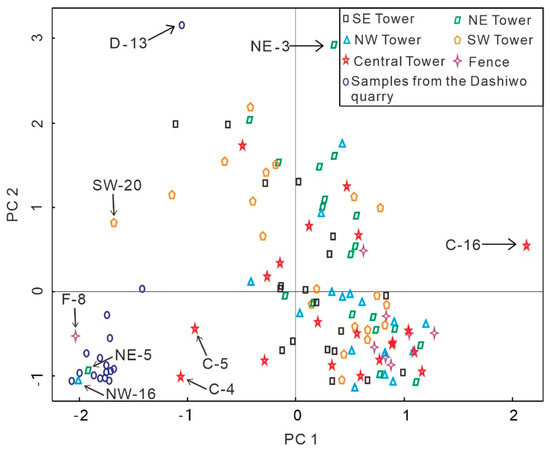
Figure 6.
Bayesian principal component (BPC) scores of chemical element data from the JGT Tower and samples from the Dashiwo quarry.
The chemical element content of NW-16, NE-5, and F-8 are very similar to the samples from the Dashiwo quarry ( Table 3 and Table 4), so they are concentrated in the same area (Figure 6). C-4, C-5, and SW-20 have the characteristics of high Bal content and low Ca content, so they are relatively close to the measuring points of samples from the Dashiwo quarry in Figure 6. C-16 is distinct due to the high content Ca and Si and the low content of Bal. NE-3 is distinct due to the high sulfur content and low content of Bal and Ca, while the high sulfur content may be caused by environmental pollution [41].
4.2.2. Potential Raw Material of the JGT Tower
Due to different principles for WHC, KMC, and BPCA, the classification of some measuring points (accounting for 5% of total measuring points) presents inconsistent attributions. In detail, both KMC and BPCA divide NW-16, NE-5, F-8, C-4, C-5, SW-20, and samples from the Dashiwo quarry into the same group, while WHC divides NW-16, NE-5, F-8, SW-20, and samples from the Dashiwo quarry into the same group. In general, excluding the above points, the statistical analyses have shown that the stone from the JGT Tower and the samples from the Dashiwo quarry do not belong to the same group, meaning the raw material of the JGT Tower is not from the Dashiwo quarry.
As for the stones of the JGT Tower itself, WHC and KMC divided the measuring points of the five small towers and fences into two groups (i.e., Group II and III in Figure 4 and Table 6, Table 7 and Table 8), which is not consistent with reality, as justified follow:
- (1)
- Both Group II and Group III contain some measuring points of the JGT Tower. The measuring points on the same side of each small tower are also divided into Group II or Group III, respectively, which means the stone of the five small towers belongs to Group II and Group III at the same time, which is self-contradictory; hence, Group II and Group III can be considered as the same group. Therefore, the chemical element data from the JGT Tower and rock samples from the Dashiwo quarry are still divided into two groups.
- (2)
- From the analytical methods, the chemical element data from the JGT Tower are divided into two groups, which is related to the value of SSD in the WHC and the value of K in KMC. From the WHC dendrogram (Figure 4), Group II and Group III can be combined into one when SSD is 300. In addition, if K is 2 in KMC, the stone from the JGT Tower will also belong to the same group.
- (3)
- From a geology perspective, this is because the stone from the JGT Tower is a geological body formed in a certain geological age, and its chemical element content itself is complex (e.g., the difference between Si, Ca, and S between measuring points). The rock mass of the Dashiwo quarry is dolomitic marble produced by the dynamic thermal metamorphism of dolomite. Some dolomitic marble contains siliceous minerals, and siliceous bands can be seen at the quarry site. Therefore, the individual measuring point of samples from the Dashiwo quarry (e.g., D-13) is classified as Group II due to the high content of Si.
4.2.3. Validation Result
The XRF results of the chemical element of the three exfoliated JGT Tower samples and four Dashiwo quarry samples are shown in Table 9. The chemical elements of exfoliated samples are mainly CaO and SiO2; the chemical elements of samples from the Dashiwao Quarry are mainly CaO and MgO. DSW-3 contains a large amount of SiO2, and its contents of CaO and MgO are lower than those of other samples from the Dashiwao Quarry. The chemical element content in Table 9 and Table 3 and Table 4 are mutually verified.
Table 9.
XRF results of major elements (unit: wt%) and trace elements (unit: ×10−6) in exfoliated samples from the JGT Tower and samples from the Dashiwao Quarry.
There are few data in Table 9, and these data do not have missing values, so only WHC is used for the statistical analysis. The dendrogram of the standardized data are shown in Figure 7. When the SSD is chosen as 6, DSW-3 alone is a group, DSW-1, DSW-2, and DSW-4 are a group, and three exfoliated samples are a group. When the SSD is chosen as 8, four samples of the Dashiwo quarry are a group, and three exfoliated samples are a group. Therefore, samples from the Dashiwo quarry and the exfoliated samples from the JGT Tower belong to different groups. This is consistent with the results of previous statistical analyses of the pXRF data.
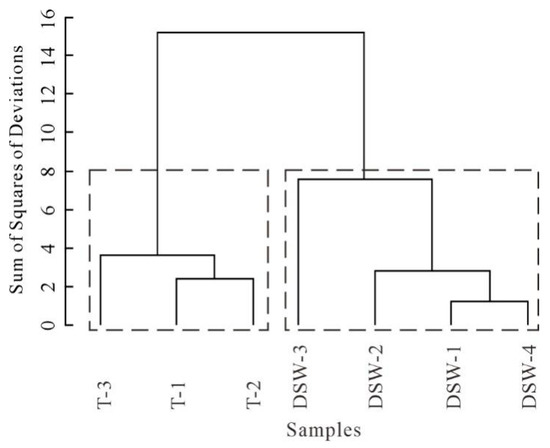
Figure 7.
WHC Dendrogram of XRF data in Table 9.
4.3. PAS Stele and SJM Stele
4.3.1. Results of Statistical Analysis
Cluster analysis (i.e., WHC and KMC) and BPCA were applied respectively to match the Dashiwo quarry and the two ancient steles using their chemical element data in Table 3 and Table 5.
Figure 8 and Table 10 are WHC dendrogram and centers of 36 sets of chemical element data of PAS stele, SJM stele, and samples from the Dashiwo quarry, respectively. Group II consists of D-13 alone because its Si content is much higher than the other two categories. The 30 measuring points of Group I include 5 measuring points of the pedestal of PAS stele, ten measuring points of SJM stele, and 15 measuring points of samples from the Dashiwao Quarry. Group III is composed of 5 measuring points of the body of the PAS stele. Compared with Group III, the content of Bal and Mg of Group I is higher, while the content of Ca and Si is lower.
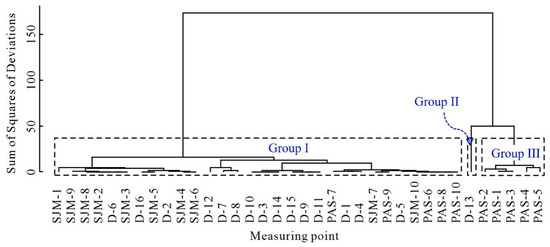
Figure 8.
WHC dendrogram of chemical element data of PSA stele, SJM stele, and samples from the Dashiwo quarry.
Table 10.
WHC centers of chemical element data of PSA stele, SJM stele, and samples from the Dashiwo quarry (unit: wt%).
Figure 9 shows that the optimal cluster number is 3 (i.e., K = 3). The result of KMC is shown in Table 11. It can be seen that the group of each measuring point in the result of KMC is consistent with the result of WHC. The group centers in the KMC results are the same as that in the WHC results (see Table 10).
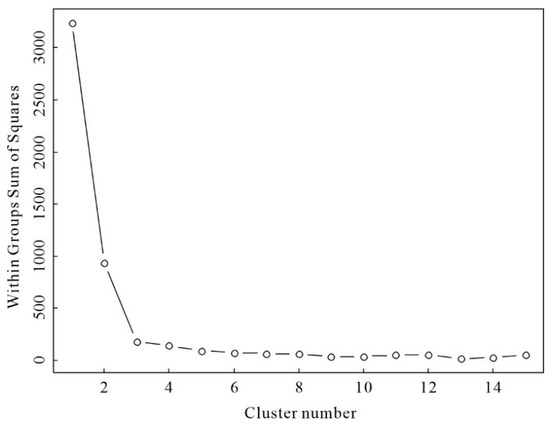
Figure 9.
WGSS under different cluster numbers of chemical element data of PSA stele, SJM stele, and samples from the Dashiwo quarry.
Table 11.
Group members of the chemical element data of PAS stele, SJM stele, and samples from the Dashiwo quarry.
The PC were extracted from the 36 sets of chemical element data of PAS stele, SJM stele (Table 5), and samples from the Dashiwo quarry (Table 3). The cumulative variance contribution rate of the first two principal components (PC1, PC2) is 99.63% (>85%). PC1 and PC2 contain almost a majority of information of the original data; thus, they are used to obtain the principal component score diagram (Figure 10).
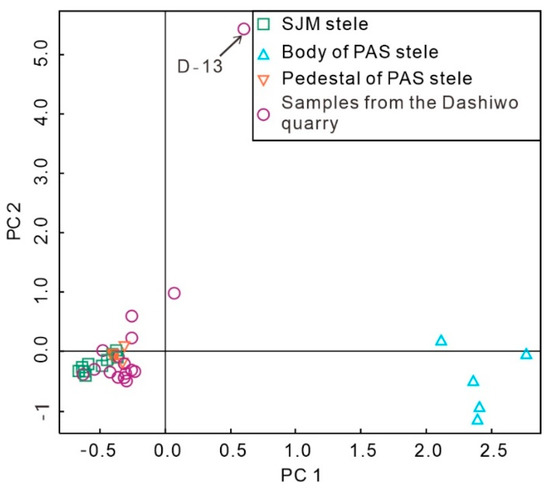
Figure 10.
BPC scores of chemical element data of PAS stele, SJM stele, and samples from the Dashiwo quarry.
Combining Figure 10 and Table 5, the 5 measuring points on the body of the PAS stele are distributed in the lower right corner of the figure due to the low content of Bal and Mg and the high content of Ca and Si. D-13 is distributed at the top of the diagram because its Si content is much higher than other measuring points. The measuring points of the pedestal of PAS stele, SJM stele, and samples from the Dashiwo quarry (except D-13) are concentrated in the lower left part of the diagram.
4.3.2. Potential Raw Material of the Two Ancient Steles
The WHC results are the same as the KMC results. Except for D-13, the stone samples from the pedestal of PAS stele and SJM stele belong to the same group as samples from the Dashiwo quarry (i.e., they are the same type). The stone for the body of PAS stele and samples from the Dashiwo quarry belong to different groups (i.e., they are not the same type).
The results obtained by BPCA and cluster analysis are completely consistent. The stones used for the pedestal of the PAS stele and SJM stele are the same type of rock as samples from the Dashiwo quarry, while the stone used for the body of the PAS stele is different from the sample from the Dashiwo quarry. This indicates that the stones used for the body and pedestal of PAS stele are from different quarries. This phenomenon also exists in another stele (the rebuilt stele of Pu’ansi Temple, RPAS stele) in the Beijing Stone Carving Art Museum. The pedestal and stones of the Dashiwo quarry are the same kinds of rock, but its body is not. Both PAS stele and RPAS stele are from Pu’ansi Temple, and they were built at the same age and had almost the same dimensions. This may be caused by the systematization or assembly-line construction at that time. The two groups of craftsmen chose different stones to manufacture the body and pedestal of steles, respectively. After the body and pedestal are finished, the body is inserted into the pedestal to form a whole stele. The dozens of other steles in the Beijing Stone Carving Art Museum do not have the phenomenon that the stones of body and pedestal are different. We can analyze the reasons for the difference between the body and pedestal of steles through further research on historical records or archaeological methods.
5. Discussion
5.1. Applicability of pXRF-Based Method
The pXRF systems can be used on-site for handheld, fast, inexpensive, and non-invasive measurements of elemental compositions of a variety of materials, including stone. So, considerably larger numbers of elemental compositions data of samples can be determined and analyzed by pXRF. The present study shows great application potential of the pXRF-based method in preliminary material source determination of stone culture relics, especially in cases where relics are immovable, large in dimension, or in quantity. Hence to facilitate effective laboratory sample selection and avoid redundant laboratory measurements [24].
After the preliminary analytical survey, the pXRF classification can be used to refine and prioritize sample selection for other more accurate and sensitive techniques, which are performed mostly from the destructible samples in the laboratory. These techniques include NAA, power XRF, inductively coupled plasma-mass spectrometry (ICP-MS), isotopic analysis, minor and trace element measurement, microscopic observation of thin slices, and so on.
The JGT Tower, PAS Stele, and SJM Stele investigated in the present study were initially constructed in Chinese Royal temples. Due to quality control requirements, as well as the difficulty and high cost of transportation, royal constructions in ancient China were government-led projects, and only materials from quarries of the best quality were used [32]. Hence, the only potential quarry examined in this pioneering study was the Dashiwo quarry, which was the most likely raw material source for stone relics in Beijing, including the Forbidden City, as indicated by the historical records. However, other ancient quarries with compositions similar to that of the Dashiwo quarry cannot be ruled out. So the further work is to find more potential quarries and measure their elemental compositions. For quarries with similar compositions and cannot be discriminated only by pXRF, the above-mentioned accurate lab-based techniques (e.g., minor and trace elements) could be applied for further distinguish, as long as the exfoliated samples of the stone relics to be studied are accessible.
Moreover, the cluster analysis and BPCA have no limitation in the number of samples or measured data points. The present method is suitable for matching n (n ≥ 1) objects of stone cultural relics to m (m ≥ 1) potential ancient quarries. Following this logic, it can be considered to build a database and gradually input elemental composition data of materials from both the cultural relics and quarries to do material source matching; more input data result in higher reliability. After finding all ancient quarries in a given region (e.g., in the Beijing area) and inputting corresponding elemental composition data of the materials, researchers can promptly determine the material sources of hundreds of thousands of cultural relics in this region based on the database and pXRF. The study results can be used in future projects for guiding the potential raw material selection for the relics restoration.
5.2. Combined Application of Cluster Analysis and BPCA
The present method for raw material identification is inexpensive, highly efficient, and above all applicable to immovable cultural heritage, and is suitable for preliminary and extensive analytical surveys. However, the chemical element data measured by pXRF are relatively less accurate than lab-based methods, and the method cannot yet specify the quantity and location of measuring points. To reduce the possible error and improve the accuracy, this study proposes the combined application of cluster analysis and BPCA for comprehensive analysis.
When the statistical analysis results are consistent, the results are credible; otherwise, increase the number of measuring points until the results are consistent. It can be seen from the above two examples that the greater the number of measurement points, the better the credibility of the results of these two statistical analysis methods. To ensure that one distinct measuring point does not affect the final analysis results, it is recommended to select more than 5 measurement points for each object to be analyzed and more than 10 measurement points for samples from the quarries to be analyzed. The above two examples have shown that the credibility of the results of the two statistical analysis methods improves as the number of measuring points increases.
Comparing the two methods of cluster analysis (i.e., WHC and KMC) and BPCA, the following two points need to be noted:
- (1)
- Cluster analysis (i.e., WHC and KMC) cannot analyze data containing missing values, so those missing values below the LODs are replaced by 1/2 of the LODs in this paper; BPCA can analyze data with missing values.
- (2)
- KMC quantifies the measuring points as belonging to a certain group. WHC qualitatively displays the groups of measuring points with a diagram, and it also has a quantitative expression. From Figure 4 and Figure 8, we can know the similarity between measuring points and the cluster number changes with the change of SSD. The cluster number needs to be determined by analyzing the dendrogram and the actual situation of the data. BPCA also qualitatively displays the groups of measuring points with a diagram. In this respect, WHC and BPCA are better than KMC, especially when there are not many measuring points or the difference between groups is not significant.
Turning back to the focus of the elemental composition, the rock types in the Beijing area mainly include limestone, dolomite, marble, sandstone, and granite, among which the rock presents white, or greenish-white is mainly carbonate rocks, such as calcitic limestone, domomite, and dolomitic and calcitic marble. In this case study, the stones used in the construction of the tower and steles are easy to distinguish because they are made of calcite (i.e., those with 32–40% Ca and <LODs for Mg) or dolomite (i.e., those with 21–23% Ca and 2.4–3.7% Mg). As shown in Table 3, Table 4 and Table 5, only five or six major elements (Ca, K, Fe, Al, Si, and Mg) along with Bal during 34 measured elements present a difference in all of the samples. Therefore, consistent and satisfactory results can be obtained using a small number of measuring points from cluster analysis and BPCA methods. As for the JGT Tower and the two steles, the results of raw materials source obtained by cluster analysis and BPCA are completely the same and consistent, though less than 5% of total measuring points of the JGT Tower present inconsistent classifications. For the white and greenish-white stone relics in Beijing, using any of these three methods to analyze the source of the raw materials can obtain the same and correct result. In other words, the role of trace and minor elements were not very significant for provenance determination in this study. This contrasts with works on France limestones where the elements most useful for determining the provenance of statuary were the minor and trace elements [9].
6. Conclusions
A fast and non-destructive method is presented in this paper to identify the material source of stone cultural relics based on pXRF and statistical analyses. The chemical elements of stone relics and stones from a certain ancient quarry were measured by pXRF; the obtained data were classified by statistical analysis methods such as cluster analysis and PCA to identify whether the stones come from the quarry. The method for raw material identification is inexpensive, simple, high-efficiency, and applicable to immovable and large-scale cultural heritage, making it suitable for preliminary and extensive analytical surveys.
Using the methods, the chemical element content of the JGT Tower, two ancient steles (i.e., PAS stele and SJM stele), and samples from the Dashiwo quarry were measured and analyzed. The statistical results indicate that the stones of the SJM stele and the pedestal of the PAS stele are from the Dashiwo quarry, while the stones of the JGT Tower and the body of the PAS stele are not.
As for the JGT Tower and the body of PAS stele whose raw material sources have not been identified, it is suggested to explore all the potential quarries and then use the above method to identify whether the raw materials of the tower and stele come from the potential quarries by matching their element compositions. Potential quarries can be explored according to the regional geological data, ancient records, and historical sites in Beijing.
Author Contributions
Conceptualization, Z.Z.; methodology, Z.W.; software, F.W.; validation, Z.Z., Z.W. and J.L.; formal analysis, F.W. and J.L.; investigation, F.W.; resources, Z.W.; data curation, Z.W. and F.W.; writing—original draft preparation, Z.W., F.W. and Z.Z; writing—review and editing, Z.Z. and J.L; visualization, J.L.; supervision, Z.Z.; project administration, Z.Z.; funding acquisition, Z.Z. All authors have read and agreed to the published version of the manuscript.
Funding
This research was funded by the National Natural Science Foundation of China (grant number 41602329 to Z.Z.), and the Fundamental Research Funds for the Central Universities of China (grant number 2652019075 to Z.Z.).
Data Availability Statement
The dataset is presented directly in the present study. Additional data (unpublished) are available upon request from the corresponding author (Z.Z.).
Acknowledgments
The corresponding author (Z.Z.) wish to thank Lihui Li of the Institute of Geology and Geophysics, Chinese Academy of Sciences, for discussing the concept design. The authors wish to thank Yi Shi, Ruihong Jia, Di Li from the Beijing Stone Carving Art Museum for their assistance in field measurement.
Conflicts of Interest
The authors declare no conflict of interest.
References
- Miller, S.; Mcgibbon, F.M.; Caldwell, D.H.; Ruckley, N.A. Geological tools to interpret Scottish medieval carved sculpture: Combined petrological and magnetic susceptibility analysis. Geo. Soc. London Special Pub. 2006, 257, 283–305. [Google Scholar] [CrossRef]
- Siegesmund, S.; Kracke, T.; Ruedrich, J.; Schwarzburg, R. Jewish cemetery in Hamburg Altona (Germany): State of marble deterioration and provenance. Eng. Geol. 2010, 115, 200–208. [Google Scholar] [CrossRef]
- Moon, S.; Kim, M.; Kim, J.; Jwa, Y. Petrological study and provenance estimation on the stone materials from the rampart of the yeongsan-eupseong. J. Petrol. Soc. Kore 2014, 23, 367–373. [Google Scholar] [CrossRef] [Green Version]
- Lv, Q.; Dong, C.; Xu, H.; Wang, N.; Liu, B.; Ma, X.; Gu, H.; Zhou, C.; Wu, W. Characteristics and source analysis of bedding stone for Liangzhu ancient city wall in Zhejiang Province. Huaxia Archaeol. 2015, 28, 79–88. (in Chinese). [Google Scholar]
- Sayre, E.V. Brookhaven Procedures for Statistical Analyses of Multivariate Archaeometric Data; BNL report 21963; Brookhaven National Laboratory: New York, NY, USA, 1975. [Google Scholar]
- Dias, M.I.; Prudêncio, M.I.; De Matos, M.A.P.; Rodrigues, A.L. Tracing the origin of blue and white Chinese Porcelain ordered for the Portuguese market during the Ming dynasty using INAA. J. Archaeol. Sci. 2013, 40, 3046–3057. [Google Scholar] [CrossRef]
- Dias, M.I.; Rodrigues, A.L.; Kovács, I.; Szőkefalvi-Nagy, Z.; Prudêncio, M.I.; Kasztovszky, Z.; Maróti, B.; Marques, R.; Flord, P.; Cardoso, G. Chronological assessment of della Robbia sculptures by using PIXE, neutrons and luminescence techniques. Nucl. Instrum. Meth. B. 2020, 477, 77–79. [Google Scholar] [CrossRef]
- Dias, M.I.; Prudêncio, M.I.; Valer, A.C. Provenance and circulation of Bell Beakers from Western European societies of the 3rd millennium BC: The contribution of clays and pottery analyses. Appl. Clay Sci. 2017, 146, 334–342. [Google Scholar] [CrossRef]
- Holmes, L.L.; Harobttle, G. Compositional characterization of French limestone. A new tool for art historians. Archaeometry 1994, 36, 25–39. [Google Scholar] [CrossRef]
- Lizee, J.M.; Neff, H.; Glascock, M.D. Clay Acquisition and Vessel Distribution Patterns: Neutron Activation Analysis of Late Windsor and Shantok Tradition Ceramics from Southern New England. Am. Antiq. 1995, 60, 515–530. [Google Scholar] [CrossRef]
- Baxter, M.; Buck, C.E. Data handling and statistical analysis. In Modern Analytical Methods in Art and Archaeology; Cilberto, E., Spoto, G., Eds.; John Wiley&Sons: New York, NY, USA, 2000; pp. 681–746. [Google Scholar]
- Dias, M.I.; Kasztovszky, Z.S.; Prudêncio, M.I.; Harsányi, I.; Kovács, I.; Szőkefalvi-Nagy, Z.; Mihály, J.; Káli, G.; Valera, A.C.; Rodrigues, A.L. Investigating beads from Chalcolithic funerary cremation contexts of Perdigões. Portugal. J. Archaeol. Sci. Rep. 2018, 20, 434–442. [Google Scholar] [CrossRef]
- Dias, M.I.; Kasztovszky, Z.S.; Prudêncio, M.I.; Valera, A.C.; Maróti, B.; Harsányi, I.; Kovács, I.; Szokefalvi-Nagy, Z. X-ray and neutron-based non-invasive analysis of prehistoric stone artefacts: A contribution to understand mobility and interaction networks. Archaeol. Anthropol. Sci. 2018, 10, 1359–1373. [Google Scholar] [CrossRef]
- Tissot, I.; Monteiro, O.C.; Barreiros, M.A.; Corregidor, V.; Correia, J.; Guerra, M.F. Corrosion of silver alloys in sulphide environments: A multianalytical approach for surface characterisation. RSC. Adv. 2016, 6, 51856–51863. [Google Scholar] [CrossRef]
- Roumie, M.; Oggiano, I.; Reslan, A.; Srour, A.; El-Morr, Z.; Castiglione, M.; Tabbal, M.; Korek, M.; Nsouli, B. PIXE contribution for a database of Phoenician pottery in Lebanon. Nucl. Instrum. Meth. B. 2019, 450, 299–303. [Google Scholar] [CrossRef]
- Ikeoka, R.A.; Appoloni, C.R.; Rizzutto, M.A.; Bandeira, A.M. Computed Radiography, PIXE and XRF analysis of pre-colonial pottery from Maranhao, Brazil. Microchem. J. 2018, 138, 384–389. [Google Scholar] [CrossRef]
- Zhang, B.; Zhang, M.; Li, Y.; Cheng, H.; Zheng, J. PIXE study on recovery of making-technology of Chinese Longquan celadon made in the Southern Song Dynasty (1127–1279 CE). Ceram. Int. 2019, 45, 3081–3087. [Google Scholar] [CrossRef]
- Šmit, Ž.; Maróti, B.; Kasztovszky, Z.; Šemrov, A.; Kos, P. Analysis of Celtic small silver coins from Slovenia by PIXE and PGAA. Archaeol. Anthrop. Sci. 2020, 12, 1–12. [Google Scholar] [CrossRef]
- Kasztovszky, Z.; Maróti, B.; Harsányi, I.; Párkányi, D.; Szilágyi, V. A comparative study of PGAA and portable XRF used for non-destructive provenancing archaeological obsidian. Quatern. Int. 2018, 468, 179–189. [Google Scholar] [CrossRef]
- Szakmány, G.; Kasztovszky, Z.; Szilágyi, V.; Starnini, E.; Friedel, O.; Biró, K.T. Discrimination of prehistoric polished stone tools from Hungary with non-destructive chemical Prompt Gamma Activation Analyses (PGAA). Microchem. J. 2011, 23, 883–893. [Google Scholar] [CrossRef]
- Ioannides, D.; Kassianidou, V.; Papasavvas, G. A new approach to an old material: An examination of the metallurgical ceramic assemblage of Enkomi, Cyprus, with the use of handheld portable X-ray fluorescence spectrometry. Archaeol. Anthrop. Sci. 2021, 13, 1–17. [Google Scholar] [CrossRef]
- Simsek, G.; Demirsar Arli, B.; Kaya, S.; Colomban, P. On-site pXRF analysis of body, glaze and colouring agents of the tiles at the excavation site of Iznik kilns. J. Eur. Ceram. Soc. 2019, 39, 2199–2209. [Google Scholar] [CrossRef]
- Niziolek, L.C. Portable X-ray fluorescence analysis of ceramic covered boxes from the 12th/13th-century Java Sea Shipwreck: A preliminary investigation. J. Archaeol. Sci. Rep. 2018, 21, 679–701. [Google Scholar] [CrossRef]
- Hein, A.; Dobosz, A.; Day, P.M.; Kilikoglou, V. Portable ED-XRF as a tool for optimizing sampling strategy: The case study of a Hellenistic amphora assemblage from Paphos (Cyprus). J. Archaeol. Sci. 2021, 133, 105436. [Google Scholar] [CrossRef]
- Khramchenkova, R.; Ionescu, C.; Kaplan, P.; Gál, Á.; Gareev, B. A pXRF in Situ Study of 16th–17th Century Fresco Paints from Sviyazhsk (Tatarstan Republic, Russian Federation). Minerals 2019, 9, 114. [Google Scholar] [CrossRef] [Green Version]
- Nash, D.J.; Ciborowski, T.; Ullyott, J.S.; Pearson, M.P.; Darvill, T.; Greaney, S.; Maniatis, G.; Whitaker, K.A. Origins of the sarsen megaliths at Stonehenge. Sci. Adv. 2020, 6, eabc0133. [Google Scholar] [CrossRef]
- Mcgarry, A.; Floyd, B.; Littleton, J. Using portable X-ray fluorescence (pXRF) spectrometry to discriminate burned skeletal fragments. Archaeol. Anthropol. Sci. 2021, 13, 1–32. [Google Scholar] [CrossRef]
- Emmitt, J.; McAlister, A.; Armstrong, J. Pitfalls and Possibilities of Patinated Bronze: The Analysis of Pre-Roman Italian Armour Using pXRF. Minerals 2021, 11, 697. [Google Scholar] [CrossRef]
- Luo, Z. Jin Gang Throne Tower of Zhenjue Temple. Cult. Relics 1979, 29, 86–89. (in Chinese). [Google Scholar]
- Sun, L. Research on the Type and Statues of the Jin Gang Throne Tower of the Five Pagoda Temple in Beijing. Master’s Thesis, Capital Normal University, Beijing, China, July 2008. (in Chinese). [Google Scholar]
- Ma, Q. The Annals of Fangshan District; First Factory of Jingzhao Public: Beijing, China, 1928. (in Chinese) [Google Scholar]
- Liu, J.; Zhang, Z.; Li, B. Microscopic & macroscopic characterizations of Beijing marble as a building material for UNESCO heritage sites: New insights into physico-mechanical property estimation and weathering. Constr. Build. Mater. 2019, 225, 510–525. [Google Scholar]
- Zhang, Z.; Liu, J.; Li, B.; Yang, X. Thermally induced deterioration behaviour of two dolomitic marbles under heating–cooling cycles. R. Soc. Open Sci. 2018, 5, 180779. [Google Scholar] [CrossRef] [Green Version]
- Mo, Y.; Li, S.; Chao, Y.; Wang, L. Analysis of China aviation network structure evolution based on ward system clustering. IOP Conf Series: EES. 2018, 189, 062039. [Google Scholar] [CrossRef] [Green Version]
- Liu, Q.; Zhang, Z.; Zhang, B.; Mu, W.; Zhang, H.; Li, Y.; Xu, N. Hydrochemical analysis and identification of open-pit mine water sources: A case study from the Dagushan iron mine in Northeast China. Sci. Rep. 2021, 11, 25152. [Google Scholar] [CrossRef] [PubMed]
- Fang, Y.; Chen, H.; Lin, Y.; Zhao, C.; Lin, Y.; Zhou, F. Classification of Northeast China Cold Vortex Activity Paths in Early Summer Based on K-means Clustering and Their Climate Impact. Adv. Atmos. Sci. 2021, 38, 400–412. [Google Scholar] [CrossRef]
- Jansson, N.F.; Allen, R.L.; Skogsmo, G.; Tavakoli, S. Principal component analysis and K-means clustering as tools during exploration for Cn skarn deposits and industrial carbonates, Sala area, Sweden. J. Geochem. Explor. 2022, 233, 106906. [Google Scholar] [CrossRef]
- Forlay-Frick, P.; Fekete, J.; Héberger, K. Classification and replacement test of HPLC systems using principal component analysis. Anal. Chim. Acta. 2005, 536, 71–81. [Google Scholar] [CrossRef]
- Oba, S.; Sato, M.; Takemasa, I.; Matsubara, K.; Ishii, S. A Bayesian missing value estimation method for gene expression profile data. Bioinformatics 2003, 19, 2088–2096. [Google Scholar] [CrossRef] [PubMed]
- Zhang, Z.; Yang, X.; Ye, F.; Zhou, H.; Zhang, T. Microscopic characteristics of petrography and discussion on weathering mechanism of Fangshan marble in Beijing. J. Eng Geol. 2015, 23, 279–286. (in Chinese). [Google Scholar]
- Siegesmund, S.; Török, A.; Hüpers, A.; Müller, C.; Klemm, W. Mineralogical, geochemical and microfabric evidences of gypsum crusts: A case study from Budapest. Environ. Geol. 2007, 52, 385–397. [Google Scholar] [CrossRef]


Publisher’s Note: MDPI stays neutral with regard to jurisdictional claims in published maps and institutional affiliations. |
© 2022 by the authors. Licensee MDPI, Basel, Switzerland. This article is an open access article distributed under the terms and conditions of the Creative Commons Attribution (CC BY) license (https://creativecommons.org/licenses/by/4.0/).