Article

Calibrating Carbonization Temperatures of Wood Fragments Embedded within Pyroclastic Density Currents through Raman Spectroscopy

1
Department of Geology and Petroleum Geology, School of Geosciences, University of Aberdeen, Aberdeen AB24 3UE, UK
2
Dipartimento di Scienze, Sezione di Scienze Geologiche, University “Roma Tre”, Largo San Leonardo Murialdo 1, 00146 Roma, Italy
3
Jackson School of Geosciences, The University of Texas, 2305 Speedway, Stop C1160, Austin, TX 78712-1692, USA
4
Department of Physics and Geology, University of Perugia, Via Alessandro Pascoli, 06123 Perugia, Italy
*
Author to whom correspondence should be addressed.
Minerals 2022, 12(2), 203; https://doi.org/10.3390/min12020203
Submission received: 27 December 2021 / Revised: 24 January 2022 / Accepted: 29 January 2022 / Published: 5 February 2022

Abstract

:
The study of the structural order of charcoals embedded in pyroclastic density currents provides information on their emplacement temperature during volcanic eruptions. In the present work, a set of charcoals from three distinct pyroclastic density currents deposits whose temperatures have been previously estimated by charcoal reflectance analyses to lie between 250 °C and 550 °C, was studied by means of Raman spectroscopy. The analyses reveal a very disordered structural ordering of the charcoals, similar to kerogen matured under diagenetic conditions. Changes in Raman spectra at increasing temperatures reflect depolymerization and an increase of aromaticity and can be expressed by parameters derived from a simplified fitting method. Based on this approach, a second order polynomial regression with a high degree of correlation and a minimum error was derived to predict paleotemperatures of pyroclastic deposits. Our results show that Raman spectroscopy can provide a reliable and powerful tool for volcanological studies and volcanic hazard assessment given its advantage of minimum samples preparation, rapid acquisition processes and high precision.

Graphical Abstract

1. Introduction

Pyroclastic density currents (PDCs) are among the most devastating and least predictable volcanic phenomena on Earth, as shown by recent catastrophic events like the 2006 and 2010 eruptions of Merapi volcano, Indonesia [1,2,3], the 1999 and 2005 eruptions of Volcàn de Colima, Mexico [4,5,6,7] and the 2015 eruption of Calbuco [8,9]. In addition to high velocity, extensive destructive capacity and great run-out distances [2,10], the ability to maintain high temperatures during flow and emplacement [3,6,7,10,11,12,13] are among the main aspects that need to be taken in consideration for volcanic hazard assessment [14].
PDCs’ emplacement temperature estimation is thus one of the most important parameters to be considered in volcanological studies. Nevertheless, due to the difficulties to gain direct temperature measurements during the events, scientists usually adopted indirect methodologies, such as the partial thermal remanent magnetization (pTRM) of lithic clasts embedded within PDC deposits, which allows the emplacement temperature determination by measuring the components of the pTRM parallel to the magnetic field orientation, at the time of emplacement [15,16,17,18].
Moreover, PDCs are known to be able to entomb vegetation and produce large amount of charcoal [3,6,7,19,20,21]. Charcoal is the solid residue of the slow heating in low-oxygen condition (i.e., pyrolysis) of biological tissues. Studying the changes of the lignocellulosic structures in the original raw wood into the highly stable, condensed, polyaromatic configurations of the charcoal can provide information on the maximum temperatures attained during combustion (e.g., wildfire) or pyrolysis. Structural changes in charcoals can be detected by different chemical and physical methods including: elemental analysis, molecular markers, optical analyses (charcoal reflectance, Rc%), pyrolysis–gas chromatography-mass spectrometry (Py–GC–MS), solid state 13C nuclear magnetic resonance (NMR) spectroscopy, infrared (IR) spectroscopy, Raman spectroscopy, near edge X-ray absorption fine-structure spectroscopy (NEXAFS), X-ray diffraction or high resolution transmission electron microscopy (HRTEM) (see [22] for a complete review). Among them, Rc% is considered a valuable, relatively inexpensive, method for the evaluation of pyroclastic flow emplacement temperature even at low charring values. Several authors provided correlations between Rc% and pyrolysis temperatures measured on different wood types and at different heating rates [23,24,25]. However, only Scott and Glaspool [19] planned calorimeter experiments to reproduce pyrolysis conditions of wood fragments embedded in pyroclastic flow deposits and were able to correlate Rc% with emplacement temperatures. Charcoal reflectance analysis proved to be an effective, comparable and accurate geothermometer in numerous case studies and different volcanic deposit types [3,6,7,19,20,21], but despite its wide application, this technique implies time consumption in sample’s preparation and analyses processing. Thus, to have an appropriate and representative statistical analysis, prolonged time and a skilled operator are required, since the procedure is not automatic but linked to the operator’s data interpretation.
The support of a further independent, faster, automatic and valuable proxy, for the PDCs emplacement temperature evaluation, constitutes a significant contribution in terms of timesaving, big data availability and data processing simplification due to the lower incidence of data interpretation by the operator.
In recent years, Raman spectroscopy was demonstrated to be a powerful tool for the analysis of carbonaceous material. It is now routinely used to assess maximum paleo-temperature experienced by the rocks during prograde regional metamorphisms [26,27,28] and is becoming one of the most-used methods for thermal maturity assessment in diagenetic environment [29,30,31,32,33,34,35,36,37,38,39,40]. The main advantages of this geothermometer are its non-destructive nature, the minimum or null time for sample preparation and the ability to provide quantitative chemical parameters with a definition within microns.
Notwithstanding its wide versatility, Raman spectroscopy has been applied to characterize charcoals composition and structure only in recent time [41,42,43,44] and mainly in the high-temperature regime between 600 and 1800 °C.
In this work, for the first time, we aim to investigate the evolution of Raman spectra at relatively low temperatures (mainly between 250 and 600 °C), more relevant for PDCs flow and emplacement conditions [21,45]. With this purpose, based on already existing charcoal reflectance datasets, we selected charred wood samples from three different eruptions, (Figure 1a): the 2015 Volcan de Colima eruption, (Mexico), the 2015 Calbuco Volcano eruption (Chile) and the 4.6 ka Fogo Volcano eruption (Azores, Portugal). These eruptions have been selected as they all entombed great amounts of wood (Figure 1b,c) and represent a very wide spectrum of PDC types and deposits, associated with different degrees of explosivity and mechanisms, including small volume block and ash flows from lava dome collapse (Colima 2015), small volume flows from partial collapses of sub-Plinian eruption columns (Calbuco 2015) and large volume partial to total collapse of Plinian eruption columns (Fogo 4.6 ka).

2. Geological Setting and Materials

The first set of charcoal samples come from PDC deposits of the 2015 eruption of Colima Volcanic Complex (Mexico). Colima Volcanic Complex is composed by different volcanic edifices and experienced an activity ranging from extremely explosive Plinian eruptions (e.g., the 1576, 1818 and 1913 eruptions) to vulcanian events alternated with episodes of growth and dome collapses (e.g., the 1991, 2000–2005 and 2015 eruptions [5,46,47,48,49]). Charcoal samples collected from this site derive from deposits of a specific type of PDC associated with dome collapses, known as block and ash flows (BAF), emplaced during two major events occurred during the 10th and 11th of July 2015 eruption [6,7,50]. PDCs flowed confined along the Montegrande ravine on the southern slope of the volcano [4]. The deposits have volumes estimated between 4.5 × 10⁶ and 7.7 × 10⁶ m3 respectively and a maximum runout of 10.5 km from the crater [4,50]. The majority of charcoal fragments (samples: COL-20-01, COL-21, COL-04-03, COL-48-01, COL-08-01A, COL-15-01, see Table 1) were collected from still standing trees embedded in valley-confined deposits within Montegrande Ravine. These deposits are characterized by massive and stratified facies, with abundant andesitic blocks embedded in a lapilli ash matrix [46]. One of them, sample COL-20, was charred by the turbulent/overriding ash cloud deposits along the distal fan [6,7]. Samples COL-24-02, COL-05-02, COL-18-03 and COL-14-01 were collected along the better sorted and fine-grained overbank deposits where trees were partially buried by coarse and fine ash deposits. All charcoal fragments derive mostly from pine trees (e.g., Pinus harwegii) and only a few from spruce trees (e.g., Abies guatemalensis and Abies Jaliscana, [6]). Reflectance data from these deposits were published by [6,7].
The second set of charcoal samples comes from PDC deposits of the 4.6 ka Plinian eruption of Fogo volcano (Azores), known as Fogo A eruption [21,45]. Fogo volcano, located at the center of São Miguel Island, is one and the largest of the three active Quaternary volcanoes composing the Azorean islands. The 4.6 ka Fogo A eruption started with a hydromagmatic phase that was followed by the development of a Plinian eruptive column (>20 km in height, [51]) with the emplacement of 4 m of fallout deposit. The partial collapses of the column first generated small-volume, valley confined PDCs, known as “pink and black intraplinian ignimbrites”, and, in the final stage, the total collapse of the column led to the emplacement of a voluminous ignimbrite [21,45,52,53], known as “dark brown ignimbrite”. Based on [45] the total bulk volume on land of pink, black and dark brown ignimbrite is 3.2 km3 (0.24 km3, 0.07 km3 and 2.9 km3 respectively). This, combined with the fallout deposit bulk volume (1.2 km3) calculate by [51], infers a total bulk volume of 4.4 km3 of the entire Fogo A eruption [45]. A total of four samples (CH3-115-02 center, CH3-115-02 edge, CH4-22-01 center and CH1-113-01 edge) were selected. Samples CH3-115-02 center and CH3-115-02 edge derive from the “dark brown ignimbrite” from the northern flank of the island, characterized by massive and poorly sorted deposits with some stratifications at the base and at the top. Samples CH4-22 and CH1-113 derive from the “pink intraplinian ignimbrite” from the southern flank, that mainly consists of vesciculated pumice lapilli and ash. Charcoals mainly derived from laurel trees fragments (e.g., Laurus azorica and Laurus canaricus) and probably by conifers (see results section, Figure 1c). Here, reflectance data were measured and calibrated against TMR data in [21,45].
The third set of charcoal samples come from PDC deposits of the 2015 sub-Plinian eruption of Calbuco volcano (Chile). Calbuco volcano is a composite stratovolcano situated in the Southern Volcanic zone of the Andes [54]. Samples derive from PDC deposits generated by the partial collapse of the sub-Plinian (>15 km) column of the 22–23 April 2015 eruption [8,55]. Early PDCs were generated at the end of the first eruptive phase but most of the total volume, that has been estimated between 10 and 50 × 106 m3, was emplaced by PDCs during the 23rd of April event and reached runout distances of 7–8 km from the crater down the Rio Blanco [56]. These PDC deposits are massive and rich in dense scoria bombs and are all valley confined. Two charred wood of pine tree (i.e., Fitzroya Cupressoides) were collected in the valley confined by the ravine of the Rio Blanco deposits at 4–5 km from the crater (CAT 16A, CAT 05A).

3. Methods

3.1. Charcoal Reflectance and Correlation against Temperature

Most of the samples, as well as reflectance measurements shown in this work from charcoals collected in Colima and Fogo volcanoes, derive from [6,7,21]. Only the two samples belonging to Calbuco volcano present original reflectance data. Sample’s preparation methodology used for these two samples is summarized in [21].
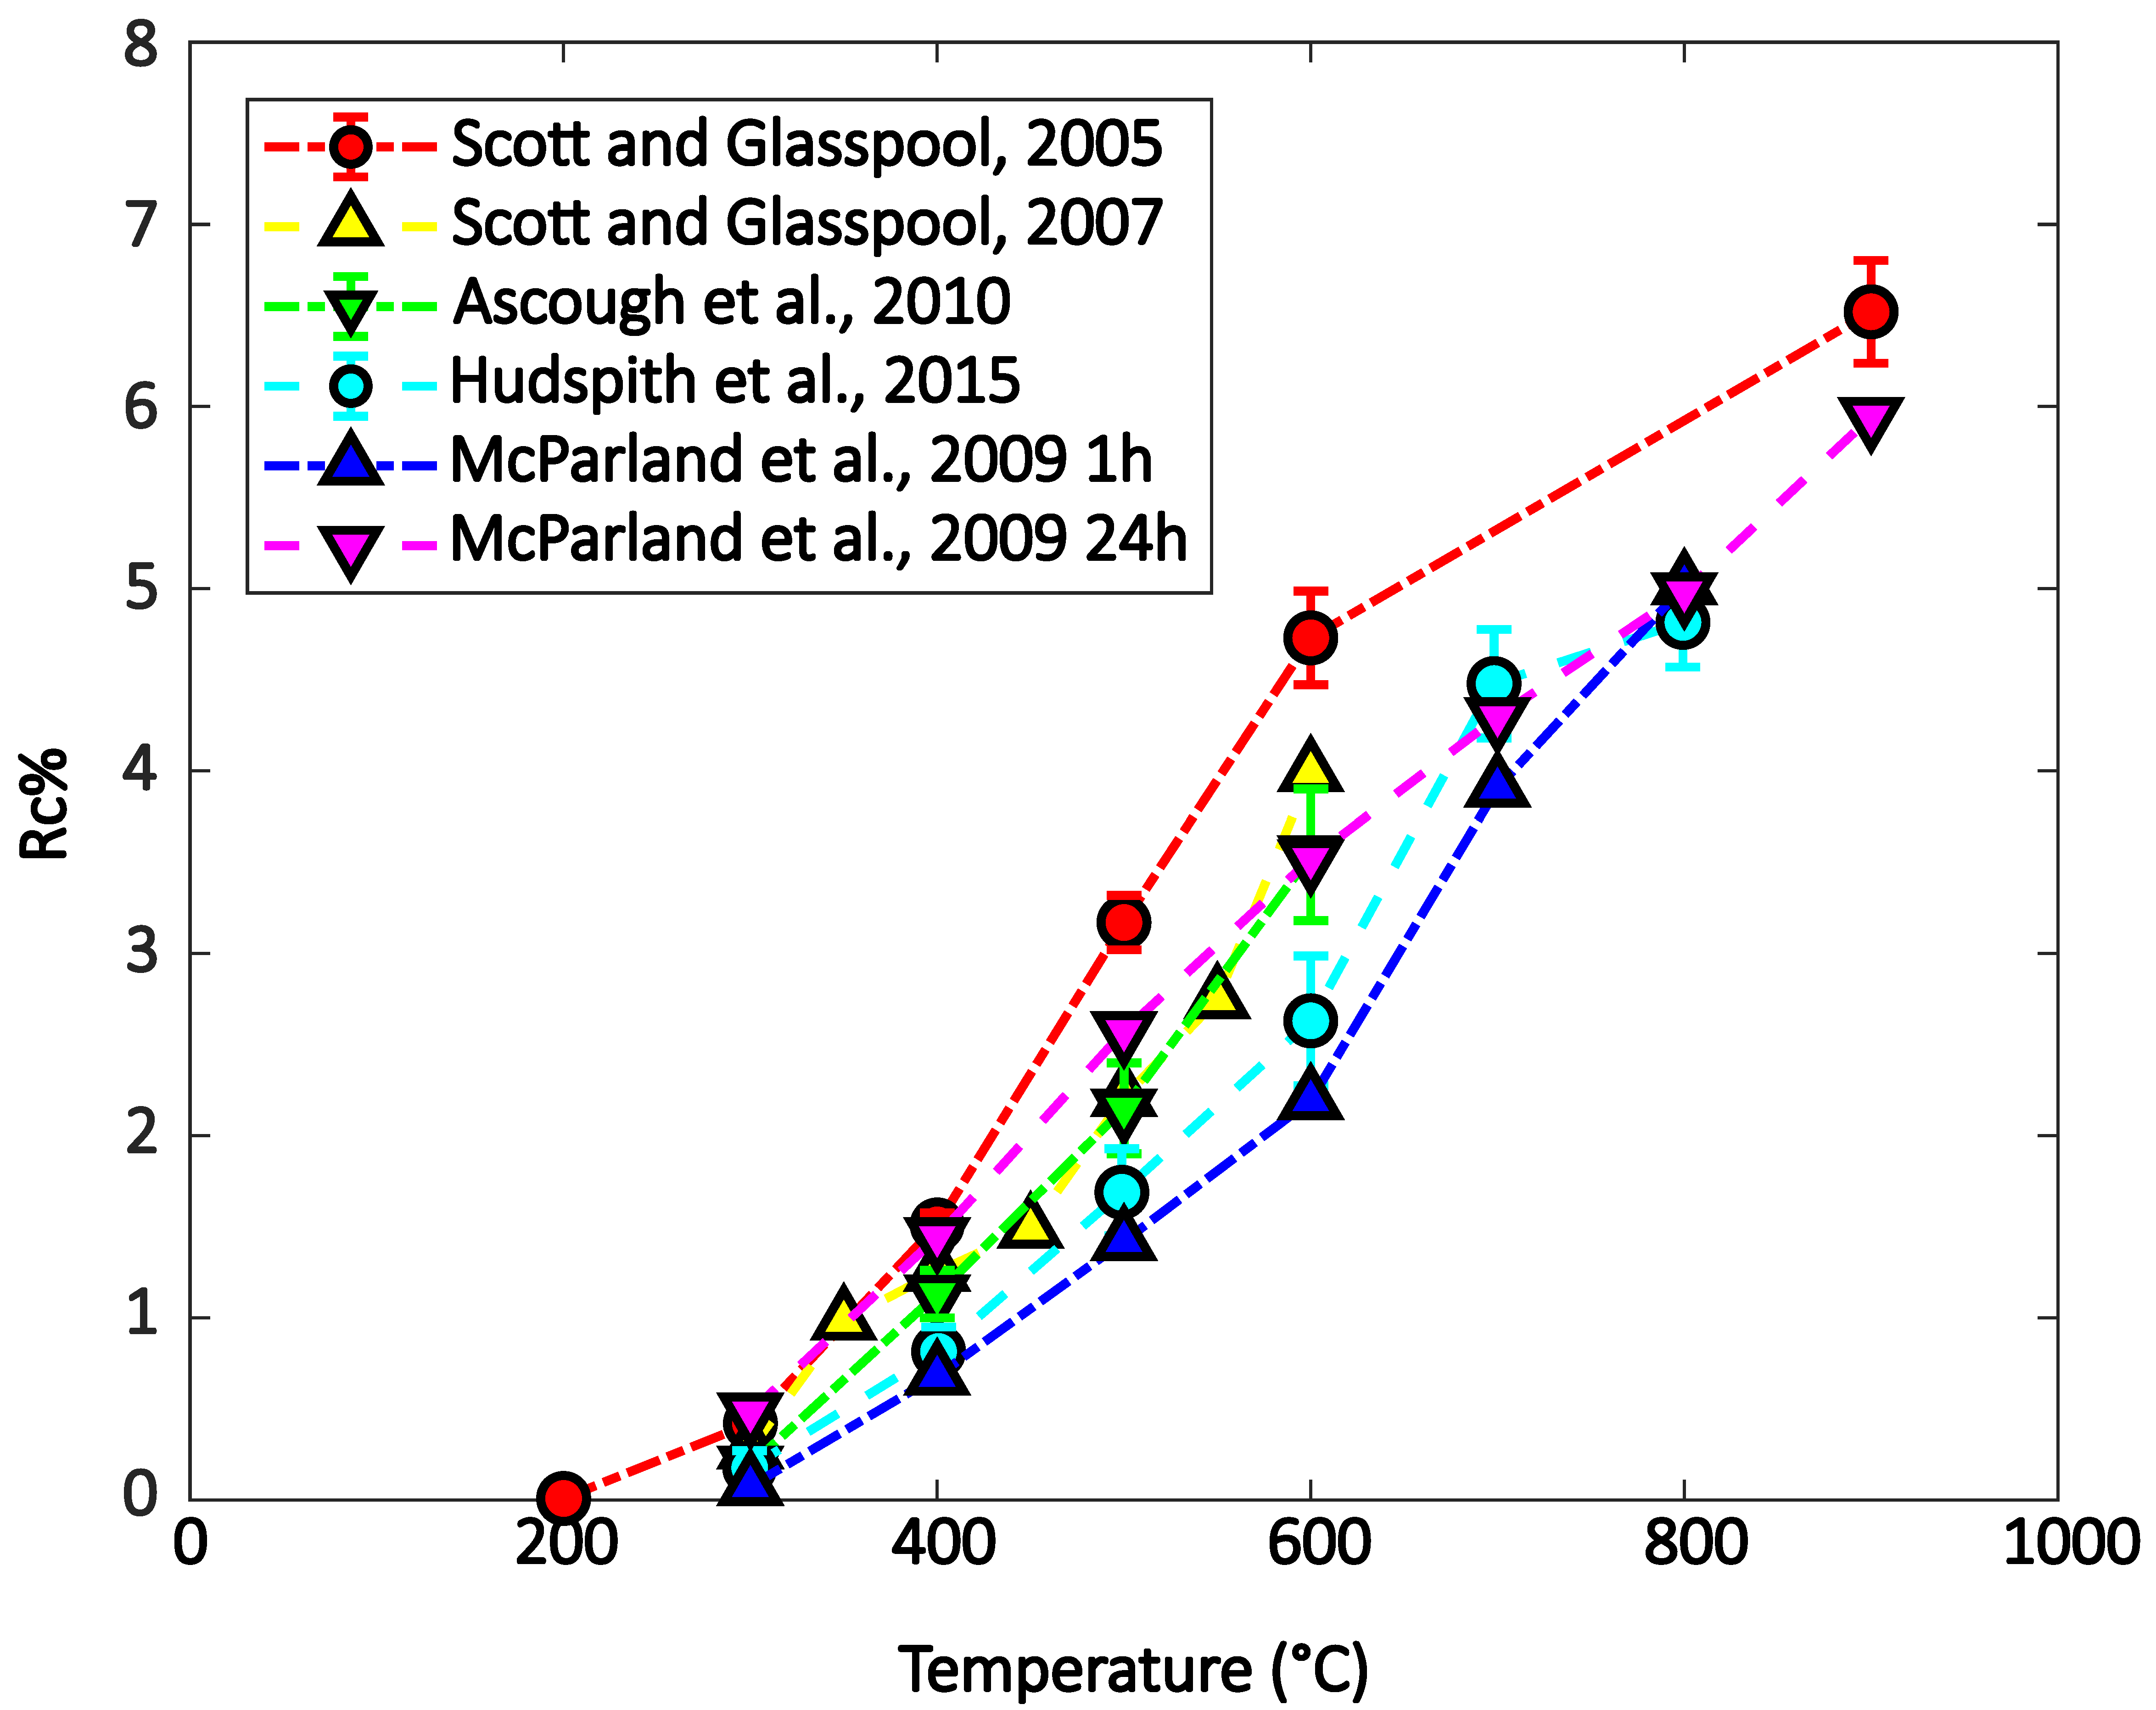
To establish the relation between Rc% and wood charring temperature, different charcoalification experiments (Figure 2) have been proposed in literature aiming at simulating charcoal production by wildfire [23,24,57] or by burial in volcanic ash deposits [19]. The experimental pyrolysis curves by [23,24,57,58] were calibrated for wildfire temperatures, representing rapid charring time, generally between one and five hours (Figure 2). On the other hand, the experimental studies of [19] were specifically focused to simulate conditions within pyroclastic flow deposits. They observed that, in samples at temperatures below 400 °C, Rc% becomes steady after four hours, while for charring temperatures higher than 400 °C, Rc% continues to rise gradually becoming nearly constant after 24 h.
All these authors carried out their experiments using different kinds of woods moving from low-density gymnosperms like pines (Pinus silvestris, [23]), Sequoia sempervirens [19,58], oaks (Quercus, [24]) and spruces (Picea Mariana, [57]) to low-density angiosperms like aspens and birches (Populus temuloides, Betula nana and Betula papyfera, [57]) to high-density angiosperms like mangroves (Rhizophora apiculate Blume, [23]) and fungi (Ganoderma Fungus, [58]). Results highlighted that different woods charred under the same conditions show similar reflectance values [57] even comparing low-density gymnosperms and high-density angiosperms [23]. However, differences can be observed between low-density gymnosperms and fungi [58] probably because of underlying differences in the internal structure, density and moisture content.
Calibration curves of Figure 2 show that for the same temperature, the highest Rc% values are achieved by samples pyrolyzed for longer time and that the spread among Rc% values rise with temperature increase, up to 800 °C. Moreover, measuring the same woods heated for different times [24,58] showed that the effect of residence time is much larger than the effect due to wood variability.
In this study, charcoal fragments mainly derived from low-density angiosperms and gymnosperms, so they are consistent with the experiments of [19,24,57,58]. Regarding the time of residence, PDCs are thought to maintain high temperatures for several months and [19] demonstrated that Rc% generally stabilized after 24 h or even later in the case of temperatures higher than 500 °C. Given this evidence, Scott and Glasspool’s correlation [19] was used as the most appropriate to assess minimum temperatures reached during the long-time heating in a pyroclastic flow.

3.2. Raman Spectroscopy

Raman spectroscopy was performed using a Jobin Yvon micro-Raman LabRam system in a backscattering geometry. In order to prevent preparation effects on Raman spectra [59], measurements were taken both on not altered charcoals and on plugs prepared for reflectance measurements before and after sample polishing (only with 1 and 0.3 µm alumina powder) and no significant differences were found.
A Neodimium-Yag laser at 532 nm (green laser) was used in a backscattering geometry using a 600 grooves/mm spectrometer grating and CCD detector. To avoid charcoal degradation, optical filters adjusted the power of the laser (<0.4 mW) with an integration time of 20 s for 3 repetitions for each measurement. Between 20 and 50 spectra were collected for each sample and each spot had a 2 µm diameter using a 50X optical power objective.
Data were collected in the range of 700–2300 cm−1 (first order Raman spectrum) and were analysed by a two band Lorentzian deconvolution through the PeakFit program designed by [60] and modified by [33].
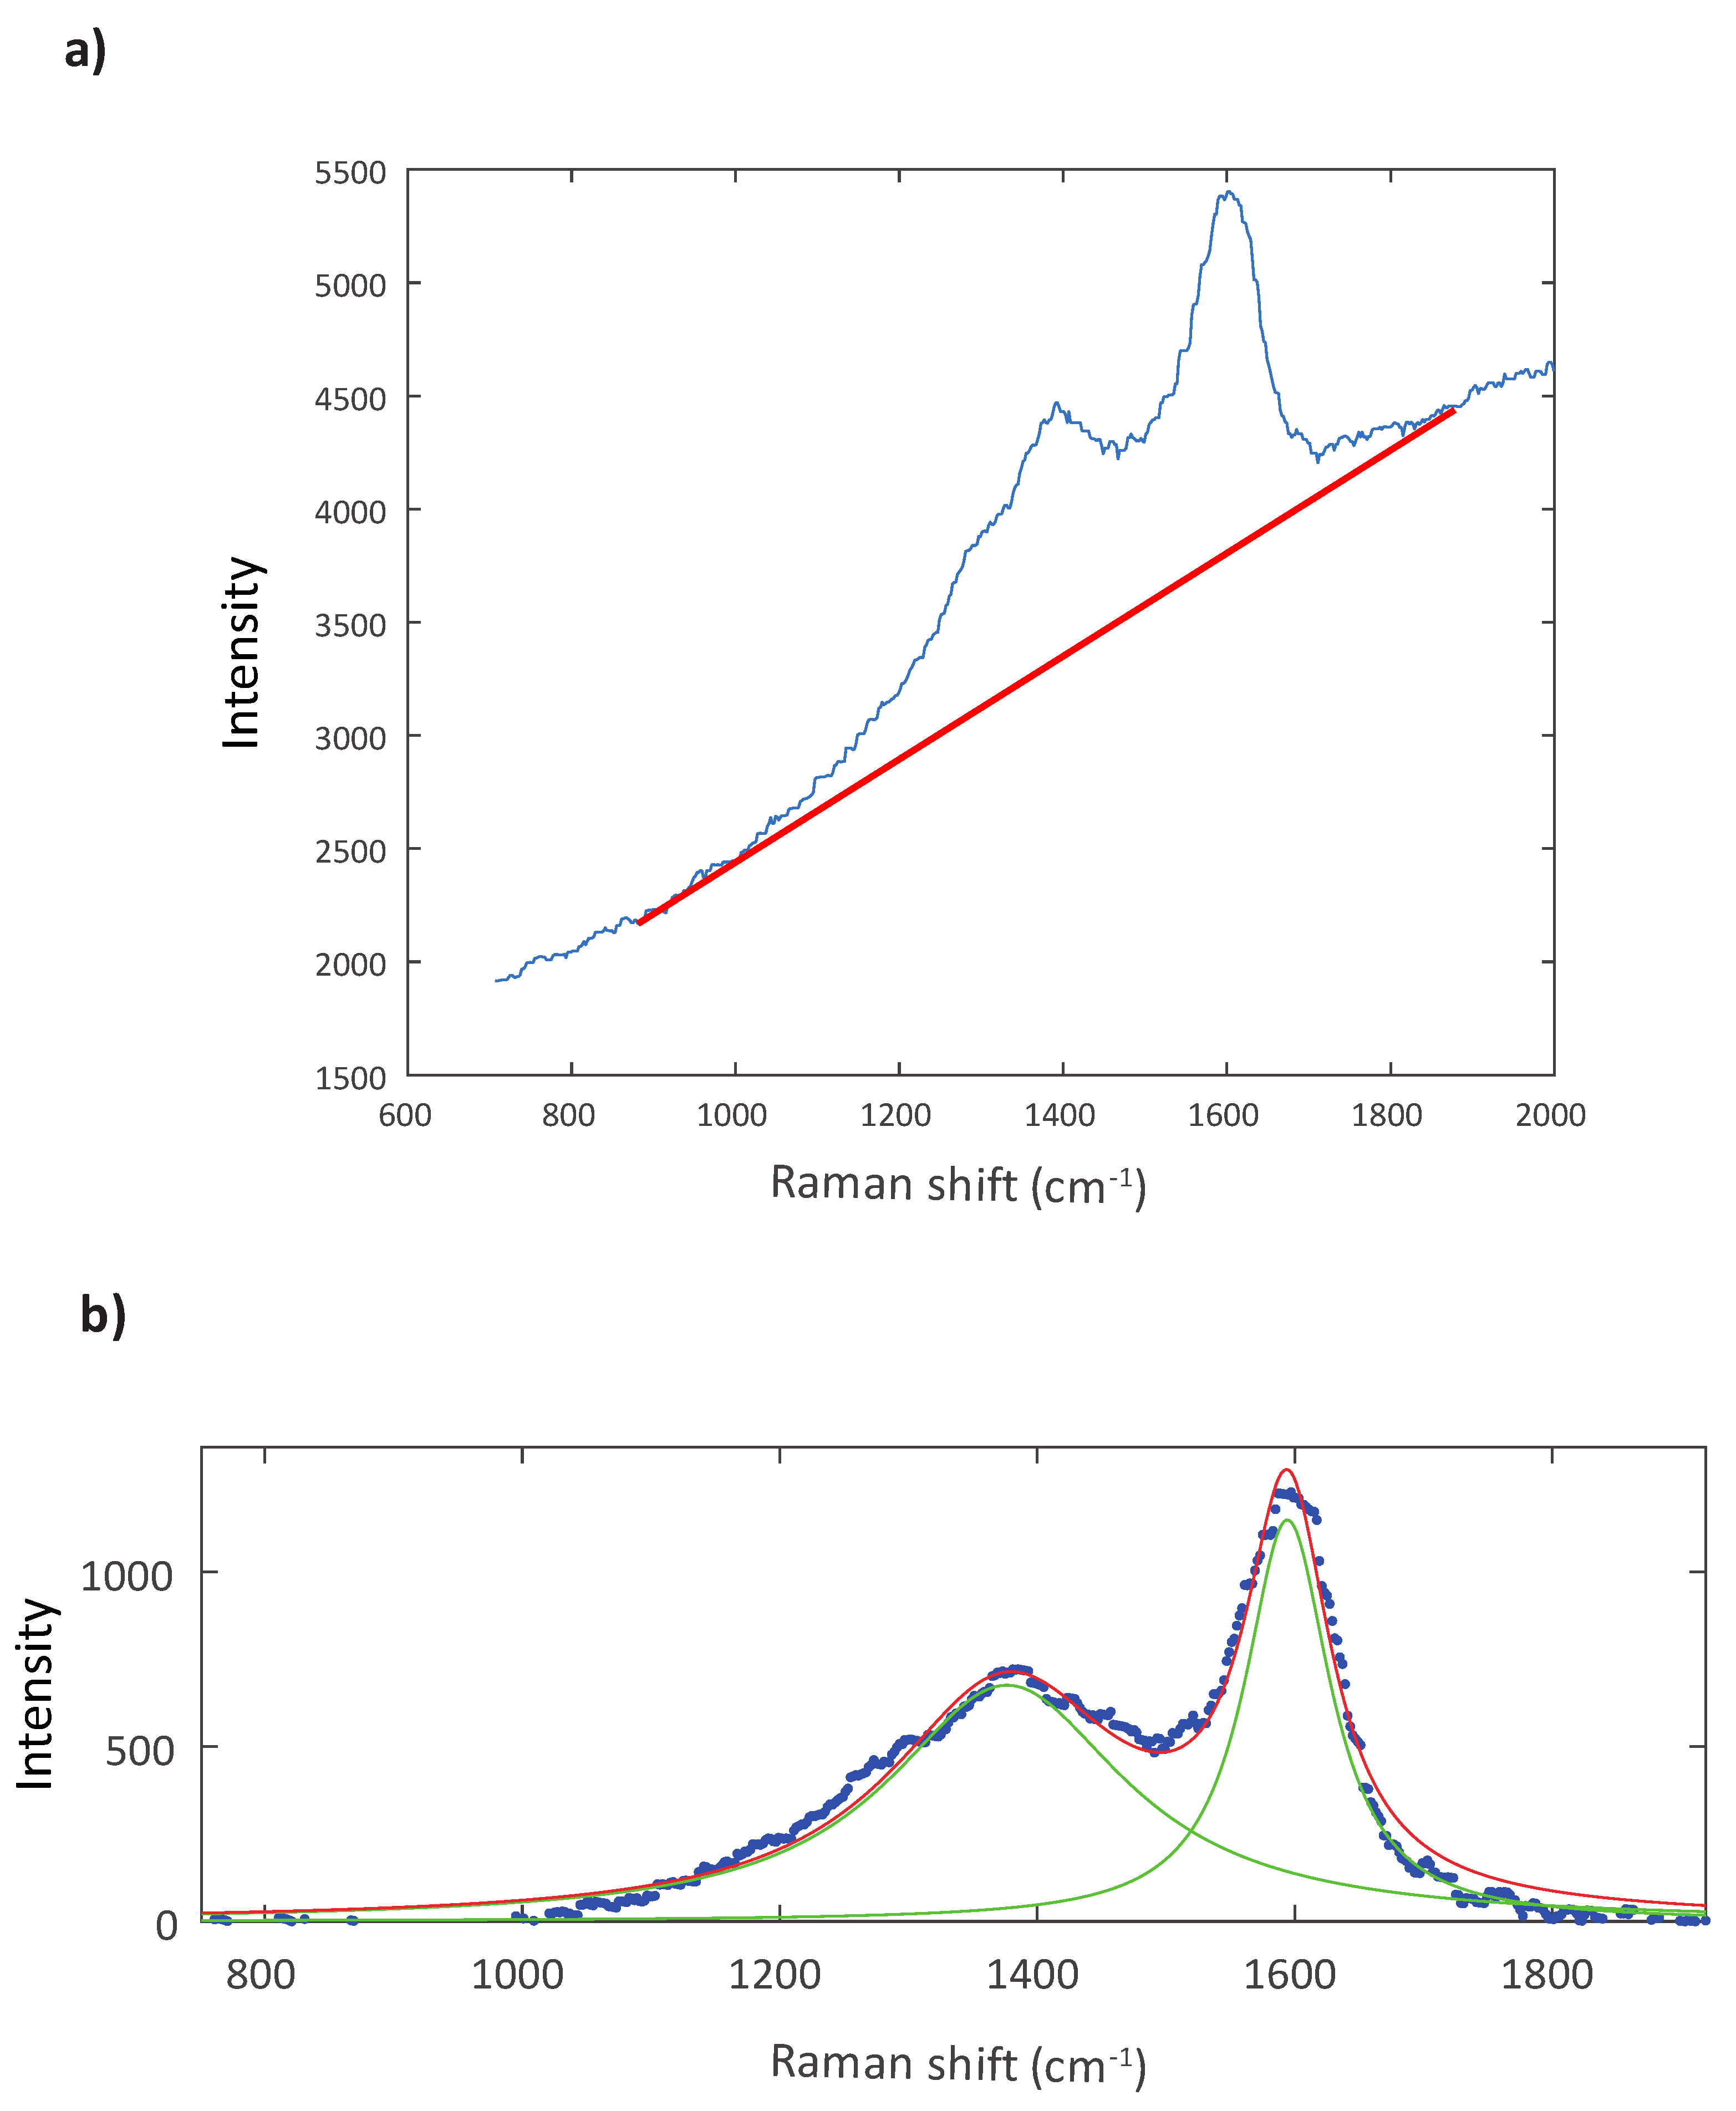
A simplified and automatic deconvolution was chosen to evaluate basic Raman parameters (e.g., distance between D and G bands, the D/G intensity, width and area ratios) and at the same time avoid errors derived by a complex multiple bands fitting. Before deconvolution, a quadratic baseline was subtracted to correct high fluorescing spectra. Control points for baseline were automatically found by the software between 750 and 850 cm−1 and between 1880 and 1920 cm−1. Subsequently, all spectra were fitted with two Lorentzian curves. In Figure 3, an example of the baseline subtraction (Figure 3a) and of the proposed two band deconvolution is shown (Figure 3b).

3.3. Regression Analysis

Raman spectra of carbonaceous material show sensible changes in response to temperature increase. These changes can be quantified by the variation of relative intensities and areas of the bands that composed the whole spectrum. However, in addition to temperature variation, spectra evolve differently according also to heating rate and pressure conditions [34,38,61,62,63]. This implies that the same value of a Raman thermal parameter can indicate different temperatures according to the geological settings in which the organic matter matured. To achieve the best results, the use of different Raman parameters in the same equation is advisable. For this reason, the most-used correlation between Raman parameters and temperature and/or thermal maturity are based on multiparameter regressions [28,30,33,64].
In this work, we propose a multivariate polynomial regression analysis based on parameters obtained from the automatic fitting approach, to represent the relationship between Raman parameters and temperatures. A detailed description of the multivariate polynomial regression can be found in Supplementary Materials.

4. Results

4.1. Charcoal Reflectance

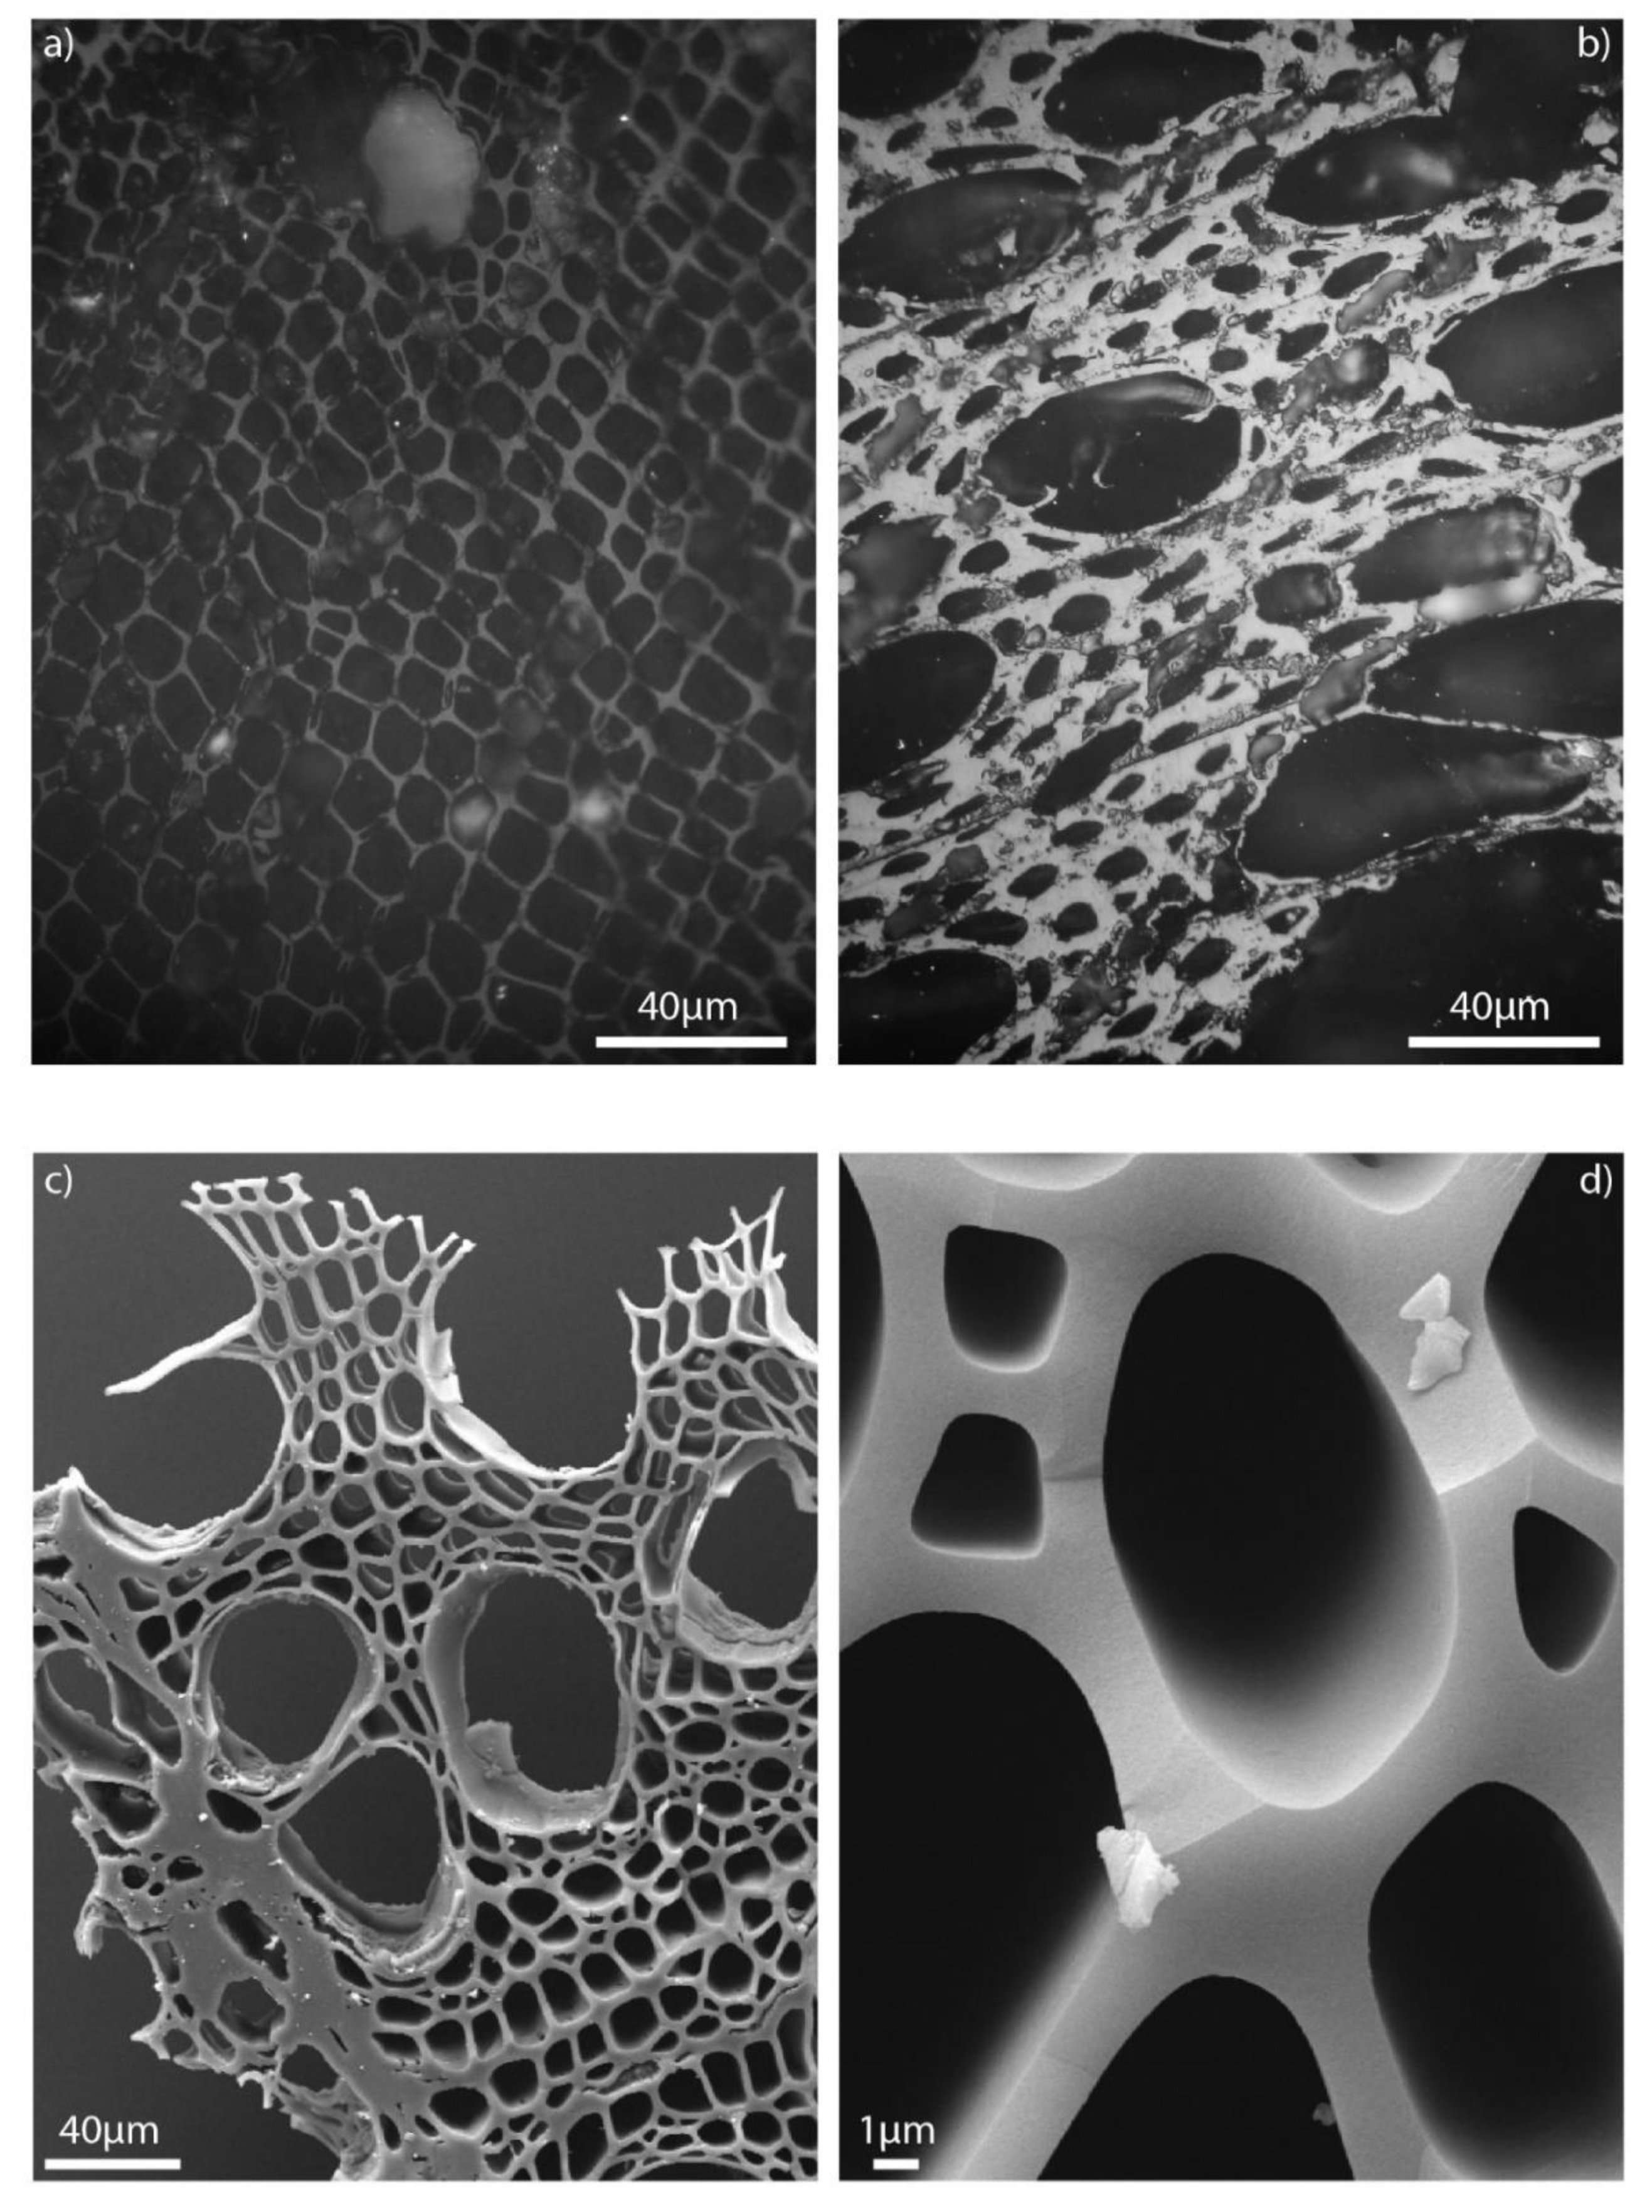
Rc% data for each sample shown in Table 1 are from [6,7,21] except samples CAT 16A and CAT 05A from Calbuco volcano. Charcoal fragments generally display intact cell walls with a cell shape varying from rounded to elongate (Figure 4) typical of the pyrofusinite group (a sub-group of the inertinite maceral group, see [58]). Tracheidal structures of both angiosperms and gymnosperms were recognized in these samples. Angiosperms show tracheids with different dimensions (Figure 4b,c) while gymnosperms structures have very similar shapes and dimensions (Figure 4a, [65]). Wood samples from Colima and Calbuco volcanoes are mainly constituted by gymnosperm group, while both angiosperms and gymnosperms families have been recognized in samples from Fogo Volcano. This is consistent with the presence of pine and spruce trees in Colima and Calbuco volcanoes, while at Fogo volcano it is likely that also conifer trees were embedded in the PDCs together with laurel trees [21].
It is worth noting that, in this work, despite belonging to different plant families, angiosperms and gymnosperms show Rc% values in the same ranges when measured within the same deposit level. Charcoals collected from Colima dataset show generally Rc% values between 0.27 and 0.57 in samples from the concentrated valley-confined deposits, while in the diluted ash cloud deposits they vary between 0.43 and 0.99 [6,7]; the lowest Rc% value was measured in distal fan area (0.25).
Charcoal fragments from the dark brown ignimbrite along the northern flank of Fogo volcano show Rc% values of about 0.5, while samples from the pink intraplinian ignimbrite on the southern flank display higher Rc% values between 1.20 and 1.37. The highest Rc% values (1.5 and 2.9) were both recorded from Calbuco Volcano. Standard deviations for the whole dataset are comprised between 0.02 and 0.12 and their values are the highest for the highest Rc%.
The conversion into paleotemperatures according to [19] shows PDCs emplacement for Colima volcano ranging between 245 and 353 °C and between 289 and 388 °C at Fogo volcano, while the two samples from Calbuco volcano indicate 408 and 566 °C.

4.2. Micro-Raman Spectroscopy

All spectra were measured by pointing the laser spot at cell walls (Figure 4), since spectra acquired on the surrounding matrix showed generally higher fluorescence.
In Figure 5, a selection of spectra at increasing reflectance values, both before (Figure 5a) and after baseline subtraction (Figure 5b), show typical D band at around 1350 cm−1 and G band at 1600 cm−1 (see dotted lines in Figure 5).
Samples with low Rc% values (0.28 Rc% in Figure 5a) show high fluorescent Raman spectra and after baseline deconvolution low signal-noise ratio (0.28 Rc% Figure 5b). As the maturity of the samples increases for higher Rc% values, fluorescence progressively decreases (Figure 5a) and signal-noise ratio increases (Figure 5b).
Further features that can be recognized as Rc% increase are: the progressive decrease of the G band width, the increase of the D band area and a shift of the D band toward lower wavenumbers (see the reference line at about 1350 cm−1 in Figure 5). In order to quantify these trends, the following parameters have been calculated: (i) position of the D and G bands (pD and pG); (ii) intensity of the D and G bands (ID and IG); (iii) width and area of the D and G bands (respectively wD, aD and wG, aG); (iv) distance between D and G bands (ΔD–G); (v) intensity ratio (ID/IG); (vi) full width at maximum height ratio (wD/wG); and (vii) area ratio (aD/aG).
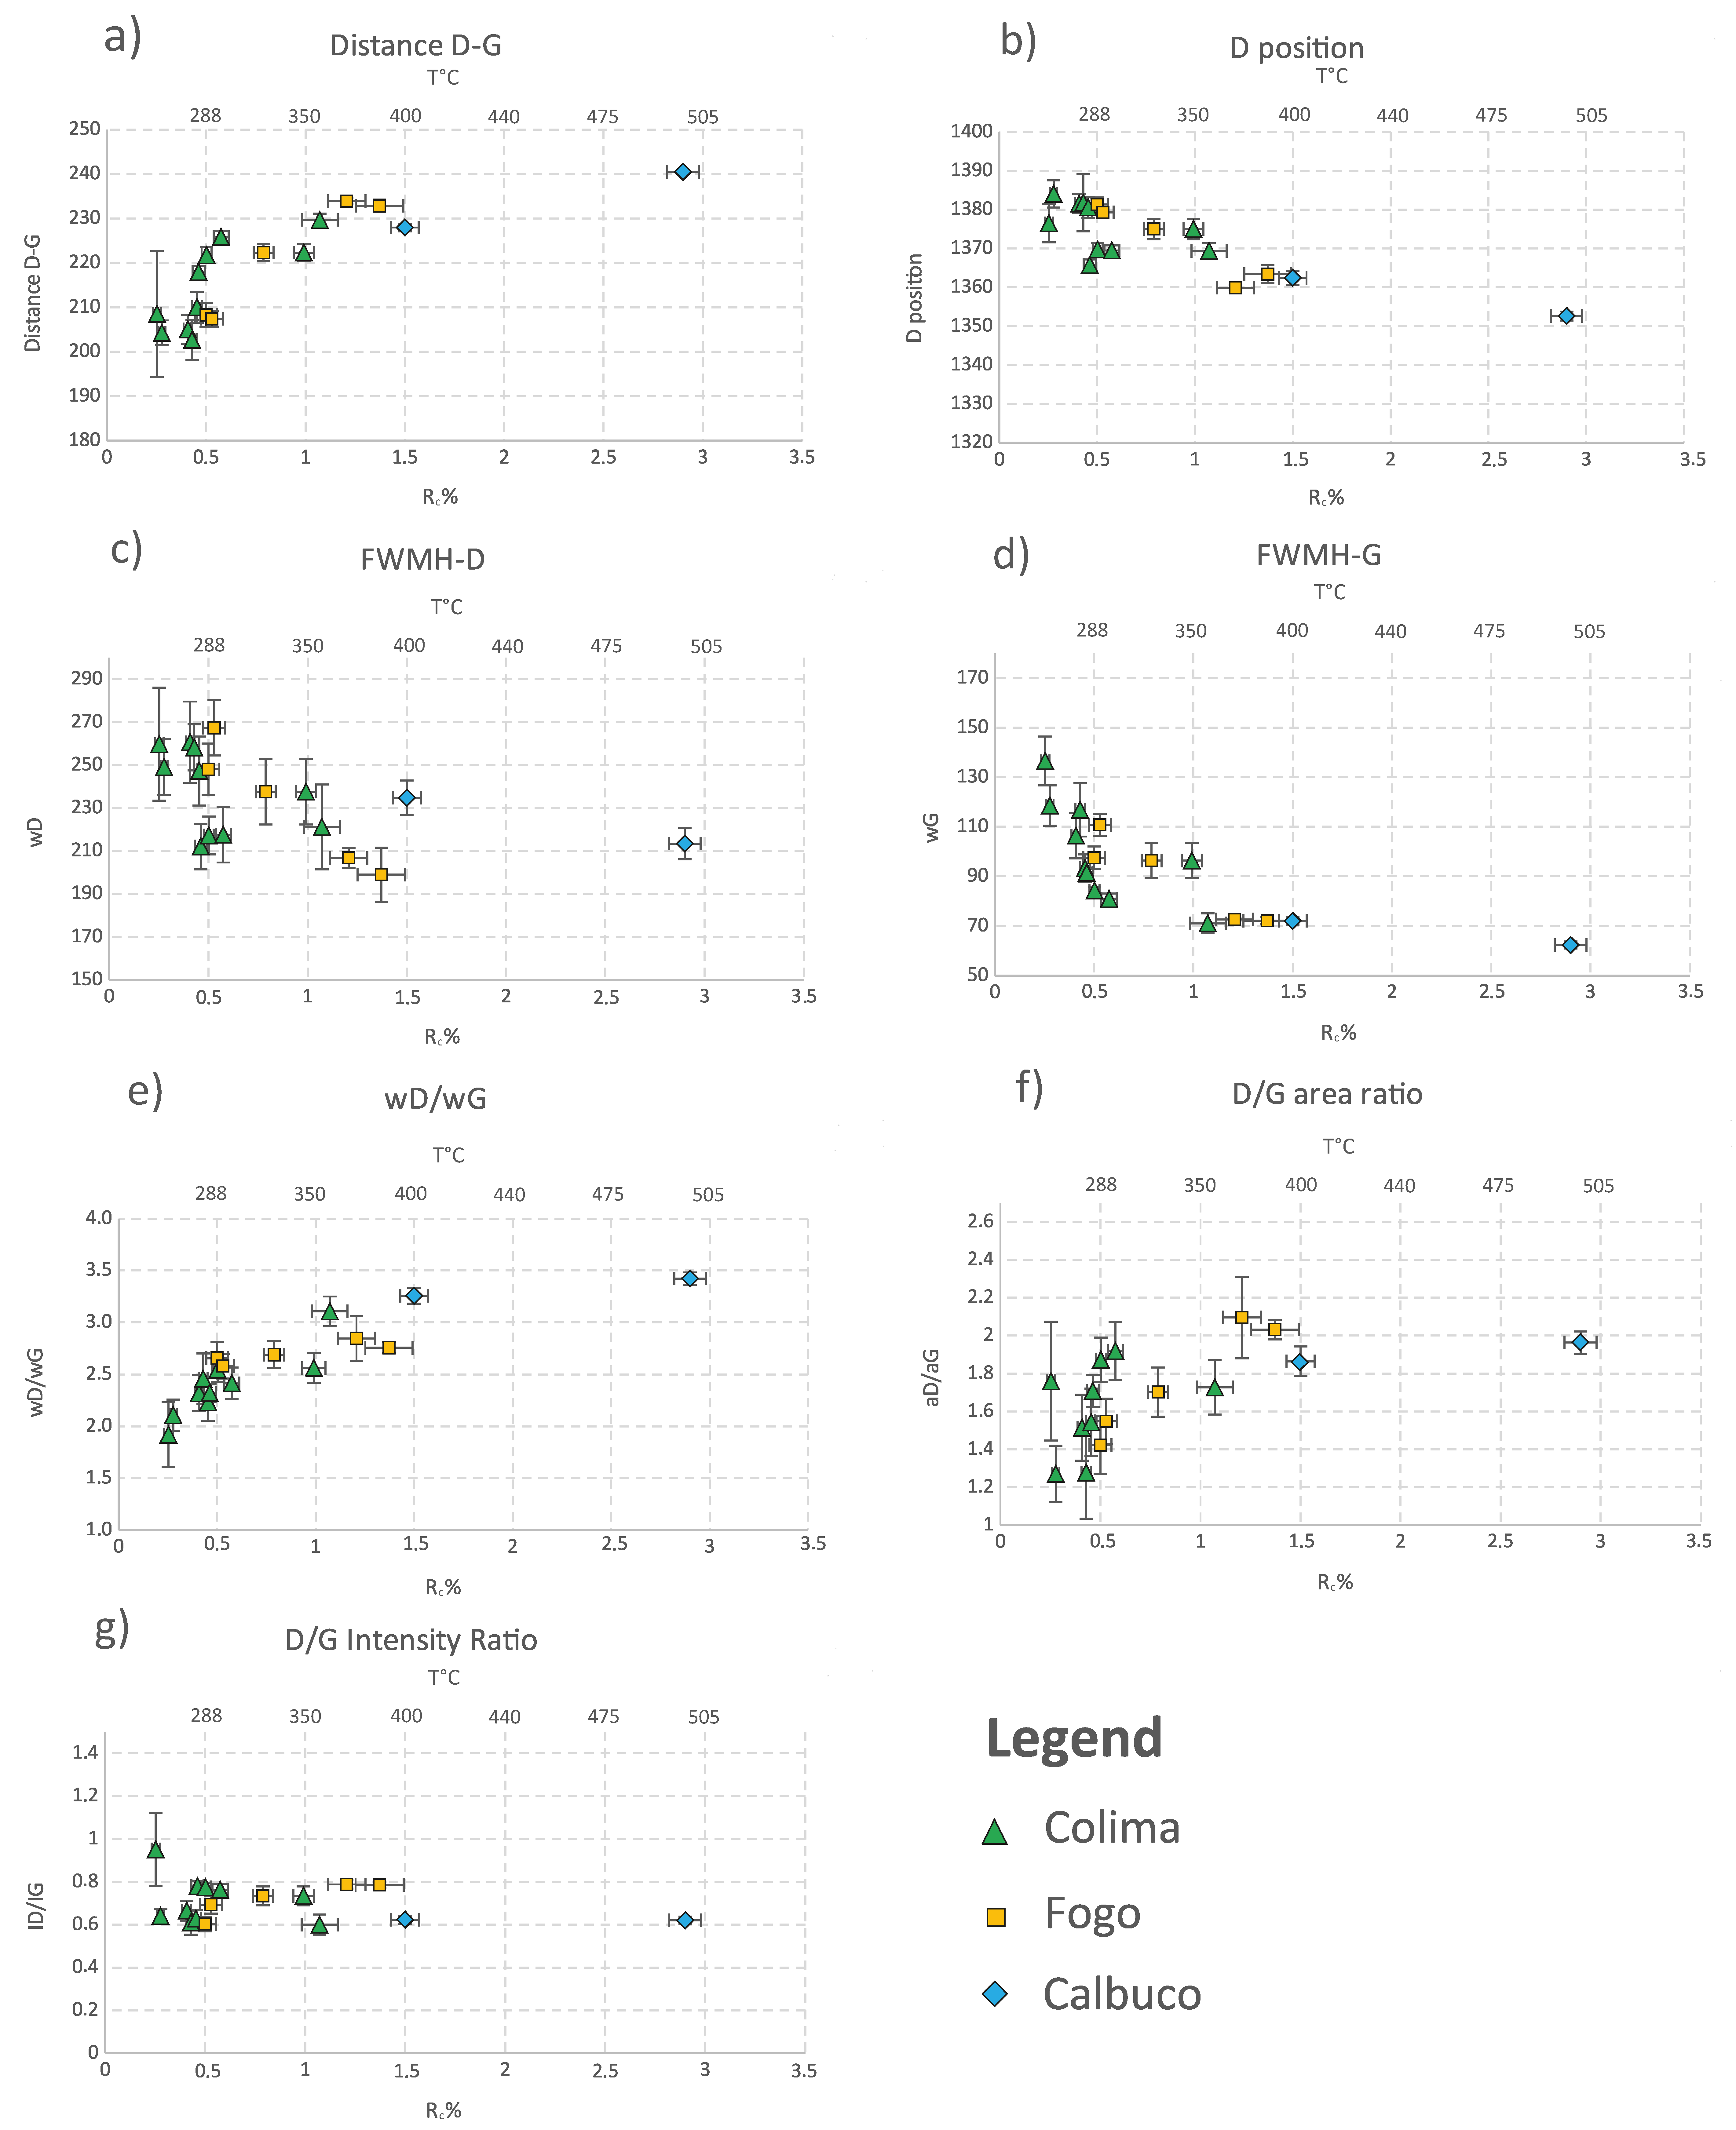
All Raman parameters are reported in Table 2, while Figure 6 shows the trends as a function of Rc% and converted temperature of D–G distance (Figure 6a), D position (Figure 6b), the width of the D (Figure 6c) and G (Figure 6d) and width, area and intensity ratios (Figure 6e–g).
Figure 6 shows that the best correlations between the Raman parameters and Rc% and temperature are: D–G distance, pD, wG and wD/wG (Figure 6a,d,e). None or limited correlations occur between intensity, area ratio and width of the D band versus Rc% and temperatures (Figure 6c,f,g).

5. Discussions

5.1. Raman Evolution of Charcoal in the Interaction with PDCs

PDCs are known to incorporate significant amounts of wood that are thus charred within the deposits. Carbonification into a PDCs is a heating event that occurs in a closed system (i.e., fluids generated by the heating cannot escape) and is relatively long lasting when compared with other natural charring processes (i.e., wildfire, impact meteorite, etc.). It has been experimentally reproduced by [19] showing that it led to an increase of Rc% values, with, nevertheless, a different trend than that predicted by the most-used kinetics equation for temperature-derived wood transformation during burial in sedimentary basin [66,67,68]. This means carbonification has its own kinetics that, similarly, but not in the same way, correlates reflectance values with temperature increases.
Rc% has the main advantage of being a relatively simple and easy technique, but it is still an indirect analysis and does not provide a sufficient insight into the chemical-physical changes occurring in the wood during the interaction with the pyroclastic flow as Raman spectroscopy can do. Evolution of Raman spectra, provides, indeed, detailed information on the aromatization degrees reached by charcoals at different temperatures if we compare our data after curve-fit with the available literature on the char formation. The process can be described by a three-stage evolution. At each one of these stages, typical Raman feature can be recognized and correlated with our observations.
Once the woods have been transformed into charcoal by fast heating, the main process that take place between 200 and 340 °C is depolymerization by band scission with a release of water and volatiles (mainly CO, CO2 and some hydrocarbons [69,70]). The presence in this stage of hydrogen-rich functional groups (i.e., aliphatic compounds) is probably the cause of the high fluorescence [71] that characterizes Raman spectra at temperature below ca 325° (Rc% lower than 0.78%, Figure 5 and Table 1). Concurrently, the D band position downshifts and the decrease of the G band width up to temperatures of about 500 °C (Figure 5 and Figure 7) reflects an increase of the size of the aromatic clusters that pass, in this stage, from simple mono-aromatic units up to larger compounds [71,72,73]. This is confirmed by [72], which measured the content of aromatic carbon in charcoals, showing an increase with temperature from less than the half (14% at 200 °C and 19% at 250 °C) to about 88% at 350 °C and more than 90% above 400 °C. Even if based on only two data points, the ΔD–G, pD, wG and wD/wG trends are confirmed also for wildfire coalification by [44].
The third stage, for temperatures from 600° up to a maximum of 1000 °C, is out of our ranges. Nevertheless, it is worth noting that the Raman evolution at this higher stage is related to a further increase degree of aromatic condensation of the turbostratically aligned polyaromatic [22,71,72,73] and has been described by [42], consisting mainly of a relative D band area and intensity increase with respect to the G band.

5.2. Calibration of an Empirical Model for the Estimation of Charring Temperature through Multivariate Polynomial Regression and Limit of the Method

Raman spectrum of organic matter is composed of several and most overlapping bands in the region between 1000 and 1700 cm−1 [29,31,74,75,76,77] that changes at different metamorphic and/or heating rate conditions [28,38,61,62]. The highest pressure and temperatures’ end-member graphite is composed by a single band at 1585 cm−1 while disordered bands at 1350 and 1620 cm−1 (i.e., D and D2 bands) arise at the onset of vacancies and lattice defects in the graphite crystals and generally four and five bands composed the spectrum at respectively mid and low metamorphic degrees [27,78]. In diagenesis, or in general for very disordered material, there is still an open debate on the number of bands that compose the spectrum, and several interpretations exist varying from four bands [79], to six [29,31,80], up to ten [76]. Nevertheless, when we want to find regression parameters to be correlated against temperature (or other factors, e.g., thermal maturity, pressure, heating rate and so on), it has been demonstrated by [79,81] that a fitting with four or more bands is mainly influenced by user interpretation and does not return replicable parameters.
In this work, low-temperature charcoal spectra strongly resemble low to middle diagenetic spectra (see [31]) probably because, given the relative short-term heating, the activation energy is the same as the long-time/low-temperature one suffered in diagenesis [34]. Thus, to reduce uncertainties related to a complicated multiband deconvolution that can strongly effect Raman measurements [34,74,81], we opted for a simplified automatic fitting approach based on two band deconvolution (Figure 7).
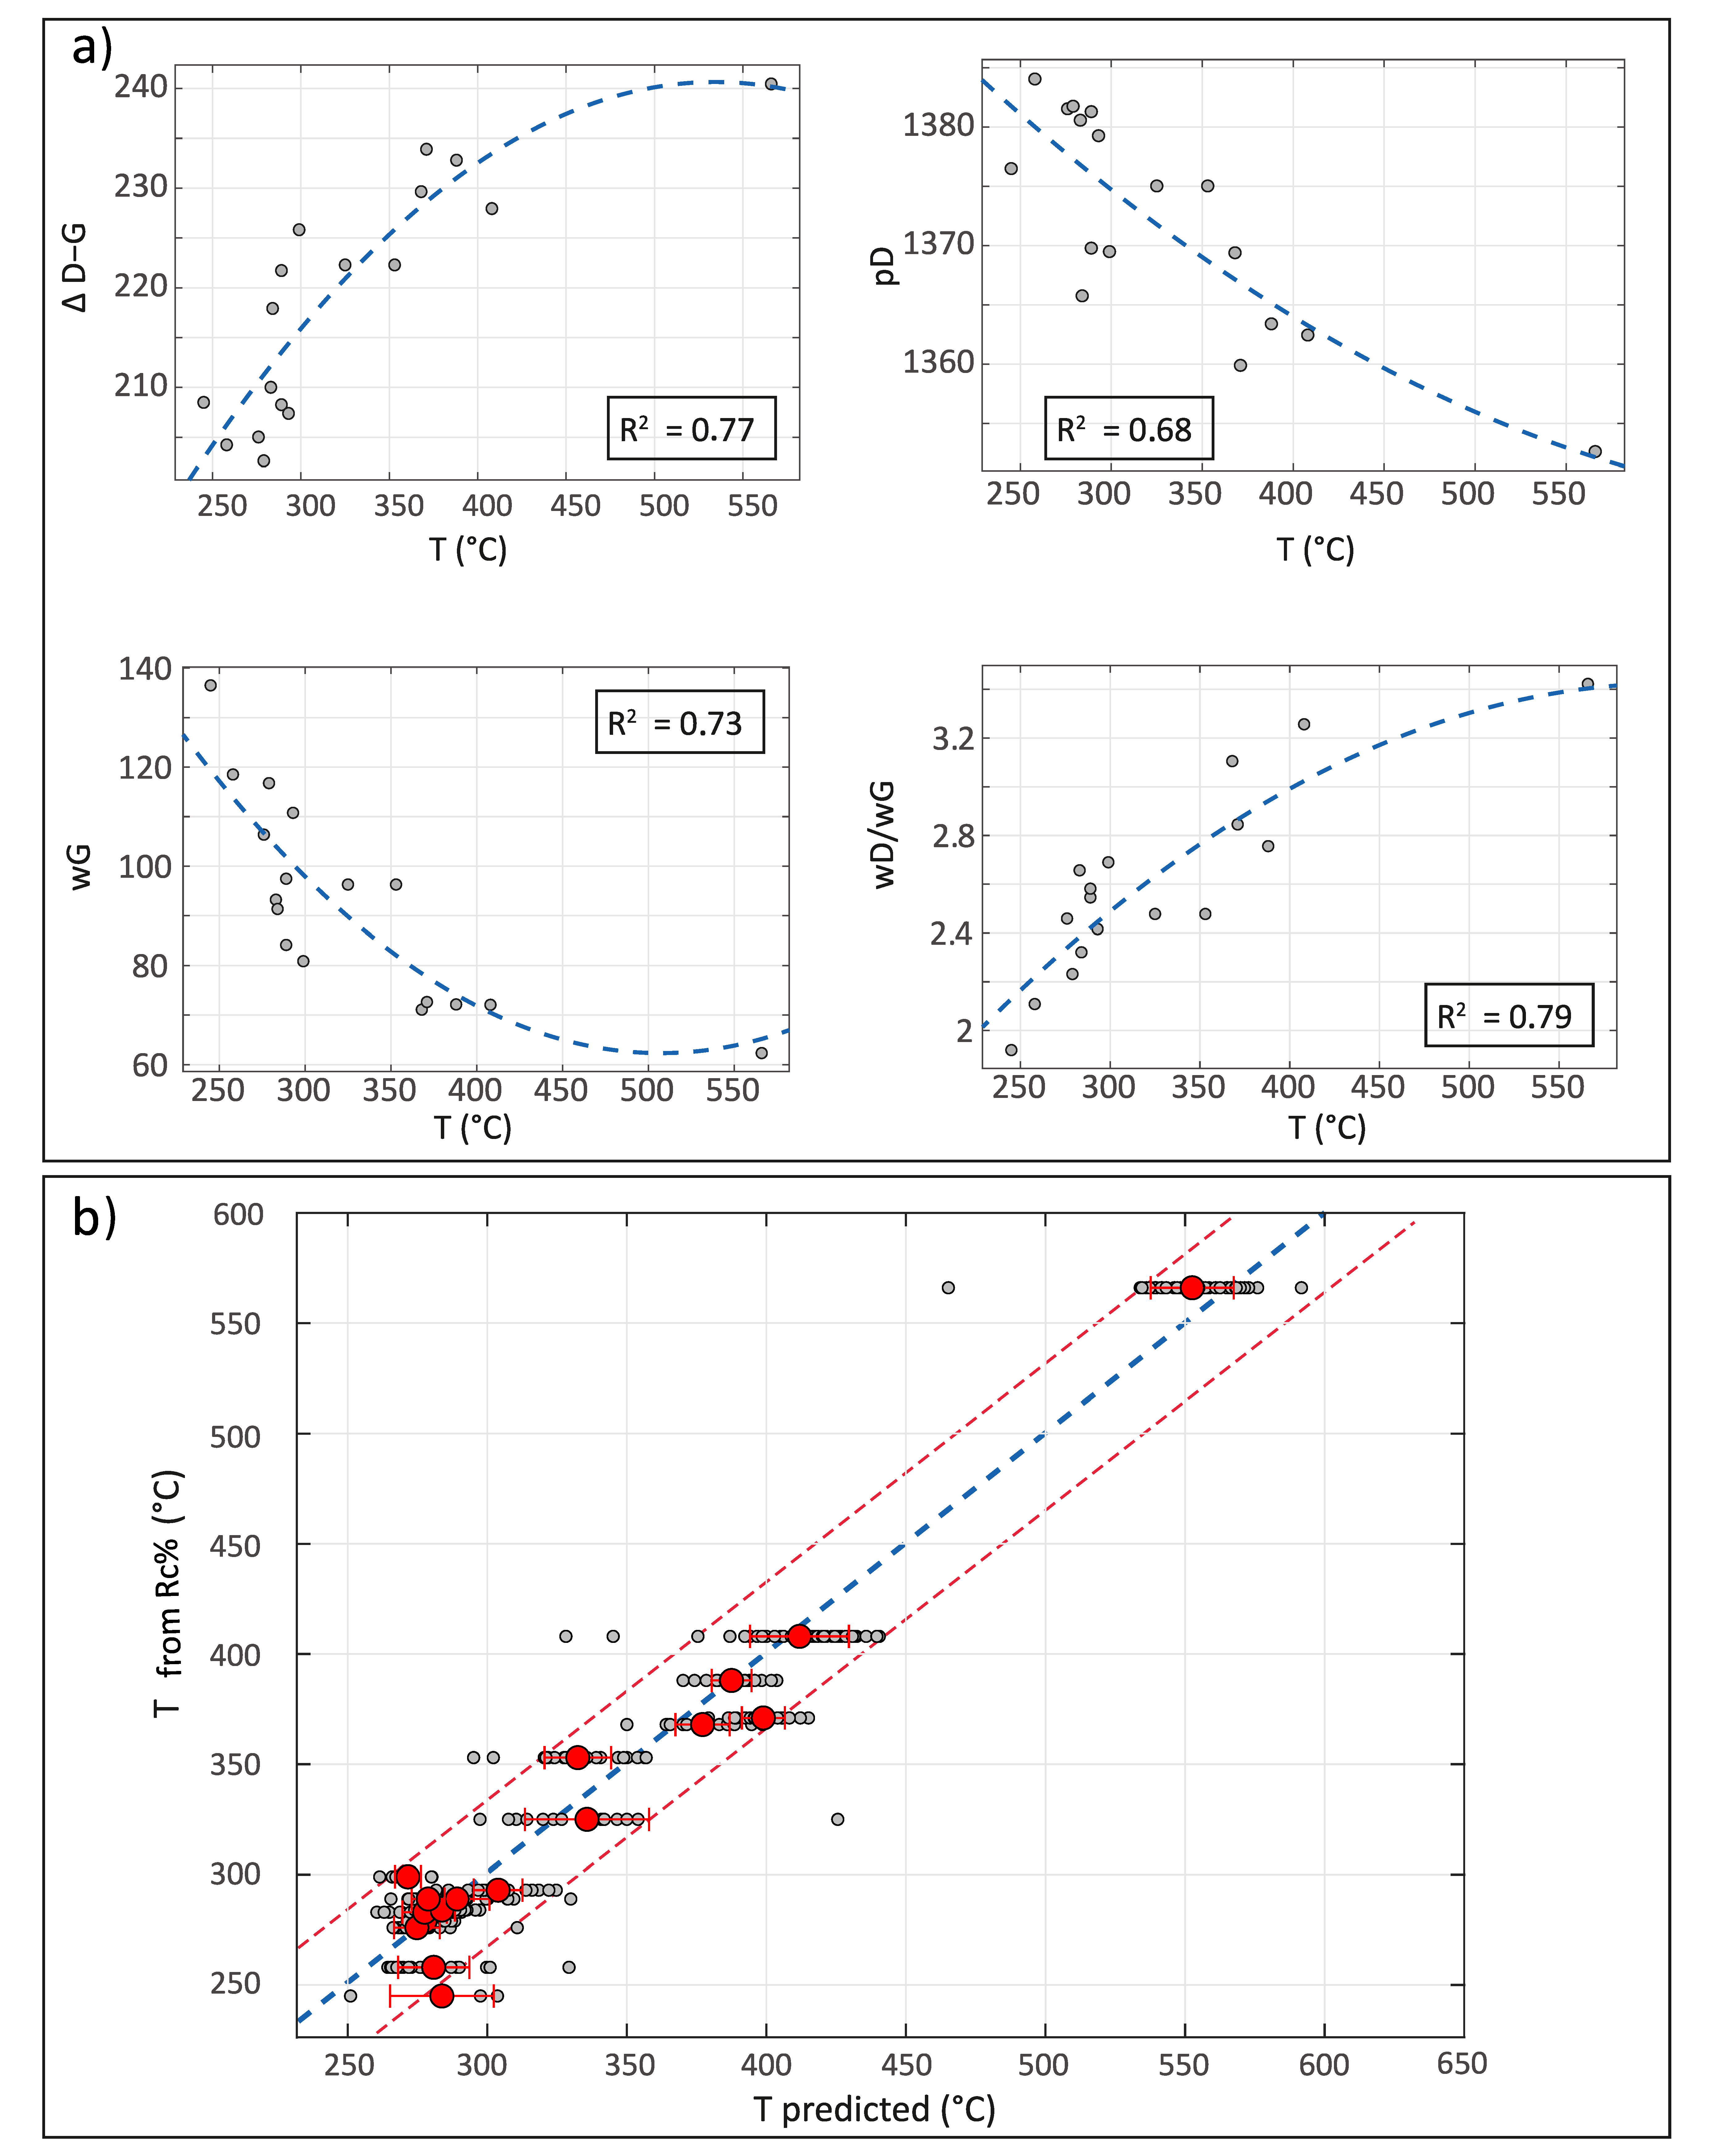
A multivariate polynomial regression using the four Raman parameters with the highest correlation (namely ΔD–G, pD, wG and wD/wG, Figure 7a) with temperature was derived.
Figure 7a shows that the ΔD–G, pD, wG and wD/wG relationship displays the most significant correlations versus temperature, with R2 comprised between 0.7 and 0.8. Thus, these parameters have been used to build the equation for temperature prediction. In Figure 7b, temperatures predicted by our model are plotted against temperatures derived by conversion of reflectance data, showing an R2 of 0.96 (more details about the regression model can be found in Supplementary Materials). In order to show the whole dataset variability, both average values of predicted temperatures (with their standard deviation red dots) and predicted values for each spectrum (small grey dots) are displayed in Figure 7b. Red dotted lines indicate the 90% confidence interval of the regression. The accuracy of the model is poorest at the lowest temperatures (below 275 °C, Figure 7b) due to the low quality of the Raman signal and the small number of available data, both problems arising from the high fluorescence of the spectra in this region. Despite that, the confidence interval indicates an error below 10% in most of the cases. The use of the model for higher temperatures has not been tested and will need further verification.

5.3. Raman Spectroscopy for Volcanological Studies

PDCs’ temperature is strongly related to the quantity of air ingested at the time of their formation along the volcano flanks [21,82] or further ingestion of air and/or other external cold material along flow [14] and also to confined or unconfined topography conditions [7,12].
All these boundary conditions strongly influence the carbonization degree acquired by the wood fragments incorporated in the pyroclastic flow. Due to rapid acquisition and its non-retrograde nature, the process of carbonification records over time the maximum temperatures experienced by the tree trunks during multiple flows transit. This implies that the charring degree acquired by a tree trunk can be not homogeneous because it reflects different conditions of pyroclastic flows heat transport and conservation capacity [7]. Therefore, in this work, Raman spectroscopy analyses on charred fragments reveal structural differences in aromatization related to the explosive degree (Plinian, sub-Plinian and Volcanian-dome collapse), pyroclastic flow transport and emplacement regime, quantity of ingested air and paleo-topography conditions of the three different case histories analysed.
The BAF generated during the 2015 dome collapse of Colima volcano destroyed the pine tree forest along the southern flank, filling completely the narrow Montegrande ravine to a distance of 10.5 km from the emission point [4,6,50,83]. Among the three-case history, this eruption is associated with the lowest erupted volumes and a maximum runout from the crater. These reflect the highest Raman disorder of charcoals’ Raman spectra. Nevertheless, a general increase of the average Raman ordering (Table 2) is observed moving from distal fan to valley confined to overbank samples that reflect an increase in temperatures, due to strongly confined topography condition and presence of high temperature dome collapse-derived blocks in the valley and the passage of the hotter dilute ash cloud on the overbank [6]. Sample COL-21 was also found in the distal fan; nevertheless, its high Rc% values point out that charcoals in these deposits were possibly remobilized after the eruption.
The 4.6 Ka Fogo A eruptive Plinian column is associated with high volumes during the eruption and underwent several partial collapses, which generated two intraplinian pyroclastic flows [45]. Valley-confined deposits (pink ignimbrites, Table 1) show similar Raman spectra as those from Colima, while an increasing ordering in the dark brown ignimbrite (Table 1) is a consequence of the short distance from the vent, low air ingestion and the absence of accidental big cold lithic blocks [45].
On the other hand, the PDC deposits of the 2015 sub-Plinian Calbuco volcano eruption show the highest Raman ordering since its valley-confined deposits, unlike the other two cases which are located in the closest position to the vent.

6. Conclusions

Charring temperature of charcoal fragments embedded in PDC deposits, emplaced during three explosive eruptions, has been analysed in this study coupling optical and Raman spectroscopic analyses. Charcoal reflectance results indicate a range between 0.25% and 2.90%, corresponding to pyrolysis temperatures between about 250 °C and 560 °C. Raman evolution of charcoal spectra at different temperatures has been discussed and Raman parameters were derived by a simplified two band deconvolution. A second order polynomial regression equation has been derived to predict paleotemperatures from Raman parameters, based on the four Raman parameters with the highest correlation. The goodness of the fit indicates that Raman spectra of charcoal well reflect the chemical modification of charcoal at relatively low carbonization temperatures (about 250–550 °C) and in relation to the nature of the volcanic deposits, providing a new suitable tool for volcanological studies and the assessment of volcanic hazard.

Supplementary Materials

The following supporting information can be downloaded at: https://www.mdpi.com/article/10.3390/min12020203/s1, File S1: Multivariate regression analysis. References [84,85,86] are cited in the Supplementary Materials.

Author Contributions

Conceptualization, A.S., A.P., G.G. and C.R.; methodology, A.S., A.P., C.R. and S.C.; software, A.S., A.V. and M.T.; validation, A.S., A.P., C.R., G.G. and S.C.; formal analysis, A.S. and A.P.; investigation, A.S. and A.P.; resources, G.G., C.R. and S.C.; data curation, A.S., A.P., S.C., C.R., A.V.; writing—original draft preparation, A.S.; writing—review and editing, A.P., C.R., S.C., A.V., M.T., G.G. and D.M.; visualization, A.S. and A.V.; supervision, C.R., S.C. and G.G.; project administration, S.C., C.R. and G.G.; funding acquisition, S.C. All authors have read and agreed to the published version of the manuscript.

Funding

Please add: This research was funded by an MIUR Roma Tre post-doctoral grant (2017–20) No. REP. 22-PROT. 219 of 26 January 2017.

Data Availability Statement

All data are reported in the manuscript and Supplementary Materials.

Acknowledgments

The Grant of Excellence Departments, MIUR (ARTICOLO 1, COMMI 314–337 LEGGE 232/2016) is gratefully acknowledged. MathWorks is acknowledged for providing the Matlab license for this work. A version of the script for calculating temperatures from Raman spectra can be provided by the authors upon request.

Conflicts of Interest

The authors declare no conflict of interest. The funders had no role in the design of the study; in the collection, analyses, or interpretation of data; in the writing of the manuscript, or in the decision to publish the results.

References

  1. Charbonnier, S.J.; Gertisser, R. Field observations and surface characteristics of pristine block-and-ash flow deposits from the 2006 eruption of Merapi Volcano, Java, Indonesia. J. Volcanol. Geotherm. Res. 2008, 177, 971–982. [Google Scholar] [CrossRef]
  2. Lube, G.; Cronin, S.J.; Thouret, J.-C. Kinematic characteristics of pyroclastic density currents at Merapi and controls on their avulsion from natural and engineered channels. Bulletin 2011, 123, 1127–1140. [Google Scholar] [CrossRef]
  3. Trolese, M.; Giordano, G.; Komorowski, J.C.; Jenkins, S.F.; Baxter, P.J.; Cholik, N.; Raditya, P.; Corrado, S. Very rapid cooling of the energetic pyroclastic density currents associated with the 5 November 2010 Merapi eruption (Indonesia). J. Volcanol. Geotherm. Res. 2018, 358, 1–12. [Google Scholar] [CrossRef]
  4. Capra, L.; Macías, J.L.; Cortés, A.; Dávila, N.; Saucedo, R.; Osorio-Ocampo, S.; Arce, J.L.; Gavilanes-Ruiz, J.C.; Corona-Chávez, P.; García-Sánchez, L. Preliminary report on the July 10–11, 2015 eruption at Volcán de Colima: Pyroclastic density currents with exceptional runouts and volume. J. Volcanol. Geotherm. Res. 2016, 310, 39–49. [Google Scholar] [CrossRef]
  5. Reyes-Dávila, G.A.; Arámbula-Mendoza, R.; Espinasa-Pereña, R.; Pankhurst, M.J.; Navarro-Ochoa, C.; Savov, I.; Vargas-Bracamontes, D.M.; Cortés-Cortés, A.; Gutiérrez-Martínez, C.; Valdés-González, C. Volcán de Colima dome collapse of July, 2015 and associated pyroclastic density currents. J. Volcanol. Geotherm. Res. 2016, 320, 100–106. [Google Scholar] [CrossRef]
  6. Pensa, A.; Capra, L.; Giordano, G.; Corrado, S. Emplacement temperature estimation of the 2015 dome collapse of Volcán de Colima as key proxy for flow dynamics of confined and unconfined pyroclastic density currents. J. Volcanol. Geotherm. Res. 2018, 357, 321–338. [Google Scholar] [CrossRef]
  7. Pensa, A.; Capra, L.; Giordano, G. Ash clouds temperature estimation. Implication on dilute and concentrated PDCs coupling and topography confinement. Sci. Rep. 2019, 9, 1–14. [Google Scholar] [CrossRef] [Green Version]
  8. Romero, J.E.; Morgavi, D.; Arzilli, F.; Daga, R.; Caselli, A.; Reckziegel, F.; Viramonte, J.; Díaz-Alvarado, J.; Polacci, M.; Burton, M. Eruption dynamics of the 22–23 April 2015 Calbuco Volcano (Southern Chile): Analyses of tephra fall deposits. J. Volcanol. Geotherm. Res. 2016, 317, 15–29. [Google Scholar] [CrossRef] [Green Version]
  9. Arzilli, F.; Morgavi, D.; Petrelli, M.; Polacci, M.; Burton, M.; Di Genova, D.; Spina, L.; La Spina, G.; Hartley, M.E.; Romero, J.E. The unexpected explosive sub-Plinian eruption of Calbuco volcano (22–23 April 2015; southern Chile): Triggering mechanism implications. J. Volcanol. Geotherm. Res. 2019, 378, 35–50. [Google Scholar] [CrossRef]
  10. Andrews, B.J. Dispersal and air entrainment in unconfined dilute pyroclastic density currents. Bull. Volcanol. 2014, 76, 852. [Google Scholar] [CrossRef]
  11. Lesti, C.; Porreca, M.; Giordano, G.; Mattei, M.; Cas, R.A.F.; Wright, H.M.N.; Folkes, C.B.; Viramonte, J. High-temperature emplacement of the Cerro Galán and Toconquis Group ignimbrites (Puna plateau, NW Argentina) determined by TRM analyses. Bull. Volcanol. 2011, 73, 1535–1565. [Google Scholar] [CrossRef]
  12. Ogburn, S.E.; Calder, E.S.; Cole, P.D.; Stinton, A.J. The effect of topography on ash-cloud surge generation and propagation. Geol. Soc. Lond. Mem. 2014, 39, 179–194. [Google Scholar] [CrossRef] [Green Version]
  13. Trolese, M.; Giordano, G.; Cifelli, F.; Winkler, A.; Mattei, M. Forced transport of thermal energy in magmatic and phreatomagmatic large volume ignimbrites: Paleomagnetic evidence from the Colli Albani volcano, Italy. Earth Planet. Sci. Lett. 2017, 478, 179–191. [Google Scholar] [CrossRef]
  14. Giordano, G.; Zanella, E.; Trolese, M.; Baffioni, C.; Vona, A.; Caricchi, C.; De Benedetti, A.A.; Corrado, S.; Romano, C.; Sulpizio, R. Thermal interactions of the AD79 Vesuvius pyroclastic density currents and their deposits at Villa dei Papiri (Herculaneum archaeological site, Italy). Earth Planet. Sci. Lett. 2018, 490, 180–192. [Google Scholar] [CrossRef]
  15. Hoblitt, R.P.; Kellogg, K.S. Emplacement temperatures of unsorted and unstratified deposits of volcanic rock debris as determined by paleomagnetic techniques. Geol. Soc. Am. Bull. 1979, 90, 633–642. [Google Scholar] [CrossRef]
  16. McClelland, E.A.; Druitt, T.H. Palaeomagnetic estimates of emplacement temperatures of pyroclastic deposits on Santorini, Greece. Bull. Volcanol. 1989, 51, 16–27. [Google Scholar] [CrossRef]
  17. Cioni, R.; Gurioli, L.; Lanza, R.; Zanella, E. Temperatures of the AD 79 pyroclastic density current deposits (Vesuvius, Italy). J. Geophys. Res. Solid Earth 2004, 109. [Google Scholar] [CrossRef]
  18. Porreca, M.; Mattei, M.; MacNiocaill, C.; Giordano, G.; McClelland, E.; Funiciello, R. Paleomagnetic evidence for low-temperature emplacement of the phreatomagmatic Peperino Albano ignimbrite (Colli Albani volcano, Central Italy). Bull. Volcanol. 2008, 70, 877–893. [Google Scholar] [CrossRef]
  19. Scott, A.C.; Glasspool, I.J. Charcoal reflectance as a proxy for the emplacement temperature of pyroclastic flow deposits. Geology 2005, 33, 589–592. [Google Scholar] [CrossRef]
  20. Caricchi, C.; Vona, A.; Corrado, S.; Giordano, G.; Romano, C. 79 AD Vesuvius PDC deposits’ temperatures inferred from optical analysis on woods charred in-situ in the Villa dei Papiri at Herculaneum (Italy). J. Volcanol. Geotherm. Res. 2014, 289, 14–25. [Google Scholar] [CrossRef]
  21. Pensa, A.; Porreca, M.; Corrado, S.; Giordano, G.; Cas, R. Calibrating the pTRM and charcoal reflectance (Ro%) methods to determine the emplacement temperature of ignimbrites: Fogo A sequence, São Miguel, Azores, Portugal, as a case study. Bull. Volcanol. 2015, 77. [Google Scholar] [CrossRef]
  22. Wiedemeier, D.B.; Abiven, S.; Hockaday, W.C.; Keiluweit, M.; Kleber, M.; Masiello, C.A.; McBeath, A.V.; Nico, P.S.; Pyle, L.A.; Schneider, M.P.W.; et al. Aromaticity and degree of aromatic condensation of char. Org. Geochem. 2015, 78, 135–143. [Google Scholar] [CrossRef] [Green Version]
  23. Ascough, P.L.; Bird, M.I.; Scott, A.C.; Collinson, M.E.; Cohen-Ofri, I.; Snape, C.E.; Le Manquais, K. Charcoal reflectance measurements: Implications for structural characterization and assessment of diagenetic alteration. J. Archaeol. Sci. 2010, 37, 1590–1599. [Google Scholar] [CrossRef] [Green Version]
  24. McParland, L.C.; Collinson, M.E.; Scott, A.C.; Campbell, G. The use of reflectance values for the interpretation of natural and anthropogenic charcoal assemblages. Archaeol. Anthropol. Sci. 2009, 1, 249–261. [Google Scholar] [CrossRef] [Green Version]
  25. Hudspith, V.A.; Hadden, R.M.; Bartlett, A.I.; Belcher, C.M. Does fuel type influence the amount of charcoal produced in wildfires? Implications for the fossil record. Palaeontology 2018, 61, 159–171. [Google Scholar] [CrossRef] [Green Version]
  26. Beyssac, O.; Goffé, B. Raman spectra of carbonaceous material in metasediments: A new geothermometer. J. Metamorph. Geol. 2002, 859–871. [Google Scholar] [CrossRef]
  27. Lahfid, a.; Beyssac, O.; Deville, E.; Negro, F.; Chopin, C.; Goffé, B. Evolution of the Raman spectrum of carbonaceous material in low-grade metasediments of the Glarus Alps (Switzerland). Terra Nov. 2010, 22, 354–360. [Google Scholar] [CrossRef]
  28. Lünsdorf, N.K.; Dunkl, I.; Schmidt, B.C.; Rantitsch, G.; von Eynatten, H. Towards a Higher Comparability of Geothermometric Data Obtained by Raman Spectroscopy of Carbonaceous Material. Part 2: A Revised Geothermometer. Geostand. Geoanal. Res. 2017, 41, 593–612. [Google Scholar] [CrossRef]
  29. Guedes, A.; Valentim, B.; Prieto, A.C.; Rodrigues, S.; Noronha, F. Micro-Raman spectroscopy of collotelinite, fusinite and macrinite. Int. J. Coal Geol. 2010, 83, 415–422. [Google Scholar] [CrossRef]
  30. Wilkins, R.W.T.; Boudou, R.; Sherwood, N.; Xiao, X. International Journal of Coal Geology Thermal maturity evaluation from inertinites by Raman spectroscopy: The ‘ RaMM ’ technique. Int. J. Coal Geol. 2014, 128–129, 143–152. [Google Scholar] [CrossRef]
  31. Schito, A.; Romano, C.; Corrado, S.; Grigo, D.; Poe, B. Diagenetic thermal evolution of organic matter by Raman spectroscopy. Org. Geochem. 2017, 106. [Google Scholar] [CrossRef]
  32. Corrado, S.; Schito, A.; Romano, C.; Grigo, D.; Poe, B.T.; Aldega, L.; Caricchi, C.; Di Paolo, L.; Zattin, M. An integrated platform for thermal maturity assessment of polyphase, long-lasting sedimentary basins, from classical to brand-new thermal parameters and models: An example from the on-shore Baltic Basin (Poland). Mar. Pet. Geol. 2020, 122, 104547. [Google Scholar] [CrossRef]
  33. Schito, A.; Corrado, S. An automatic approach for characterization of the thermal maturity of dispersed organic matter Raman spectra at low diagenetic stages. Geol. Soc. Lond. Spec. Publ. 2020, 484, 107–119. [Google Scholar] [CrossRef]
  34. Henry, D.G.; Jarvis, I.; Gillmore, G.; Stephenson, M. Raman spectroscopy as a tool to determine the thermal maturity of organic matter: Application to sedimentary, metamorphic and structural geology. Earth-Sci. Rev. 2019, 198, 102936. [Google Scholar] [CrossRef]
  35. Muirhead, D.K.; Bond, C.E.; Watkins, H.; Butler, R.W.H.; Schito, A.; Crawford, Z.; Marpino, A. Raman Spectroscopy: An Effective Thermal Marker in Low Temperature Carbonaceous Fold-Thrust Belts; Special Publications: London, UK, 2020; Volume 490. [Google Scholar]
  36. Nirrengarten, M.; Mohn, G.; Schito, A.; Corrado, S.; Gutiérrez-García, L.; Bowden, S.A.; Despinois, F. The thermal imprint of continental breakup during the formation of the South China Sea. Earth Planet. Sci. Lett. 2020, 531. [Google Scholar] [CrossRef]
  37. Corrado, S.; Gusmeo, T.; Schito, A.; Alania, V.; Enukidze, O.; Conventi, E.; Cavazza, W. Validating far-field deformation styles from the Adjara-Trialeti fold-and-thrust belt to the Greater Caucasus (Georgia) through multi-proxy thermal maturity datasets. Mar. Pet. Geol. 2021, 130, 105141. [Google Scholar] [CrossRef]
  38. Muirhead, D.K.; Kedar, L.; Schito, A.; Corrado, S.; Bond, C.E.; Romano, C. Raman spectral shifts in naturally faulted rocks. Geochem. Geophys. Geosyst. 2021, 22, e2021GC009923. [Google Scholar] [CrossRef]
  39. Schito, A.; Guedes, A.; Valentim, B.; Vergara Sassarini, A.; Corrado, S. A Predictive Model for Maceral Discrimination by Means of Raman Spectra on Dispersed Organic Matter: A Case Study from the Carpathian Fold-and-Thrust Belt (Ukraine). Geosciences 2021, 11, 213. [Google Scholar] [CrossRef]
  40. Spina, A.; Cirilli, S.; Sorci, A.; Schito, A.; Clayton, G.; Corrado, S.; Fernandes, P.; Galasso, F.; Montesi, G.; Pereira, Z. Assessing Thermal Maturity through a Multi-Proxy Approach: A Case Study from the Permian Faraghan Formation (Zagros Basin, Southwest Iran). Geosciences 2021, 11, 484. [Google Scholar] [CrossRef]
  41. Yamauchi, S.; Kurimoto, Y. Raman spectroscopic study on pyrolyzed wood and bark of Japanese cedar: Temperature dependence of Raman parameters. J. Wood Sci. 2003, 49, 235–240. [Google Scholar] [CrossRef]
  42. Deldicque, D.; Rouzaud, J.N.; Velde, B. A Raman-HRTEM study of the carbonization of wood: A new Raman-based paleothermometer dedicated to archaeometry. Carbon N. Y. 2016, 102, 319–329. [Google Scholar] [CrossRef]
  43. Surup, G.R.; Nielsen, H.K.; Heidelmann, M.; Trubetskaya, A. Characterization and reactivity of charcoal from high temperature pyrolysis (800–1600 °C). Fuel 2019, 235, 1544–1554. [Google Scholar] [CrossRef]
  44. Theurer, T.; Muirhead, D.K.; Jolley, D.; Mauquoy, D. The applicability of Raman spectroscopy in the assessment of palaeowildfire intensity. Palaeogeogr. Palaeoclimatol. Palaeoecol. 2021, 570, 110363. [Google Scholar] [CrossRef]
  45. Pensa, A.; Giordano, G.; Cas, R.A.F.; Porreca, M. Thermal state and implications for eruptive styles of the intra-Plinian and climactic ignimbrites of the 4.6 ka Fogo A eruption sequence, São Miguel, Azores. Bull. Volcanol. 2015, 77, 99. [Google Scholar] [CrossRef]
  46. Saucedo, R.; Macías, J.L.; Bursik, M. Pyroclastic flow deposits of the 1991 eruption of Volcán de Colima, Mexico. Bull. Volcanol. 2004, 66, 291–306. [Google Scholar] [CrossRef]
  47. Macias, J.L.; Saucedo, R.; Gavilanes, J.C.; Varley, N.; Velasco-Garcia, S.; Bursik, M.; Vargas-Gutierrez, V.; Cortes, A. Flujos piroclásticos asociados a la actividad explosiva del Volcán de Colima y perspectivas futuras. GEOS 2006, 25, 340–351. [Google Scholar]
  48. Sulpizio, R.; Capra, L.; Sarocchi, D.; Saucedo, R.; Gavilanes-Ruiz, J.C.; Varley, N.R. Predicting the block-and-ash flow inundation areas at Volcán de Colima (Colima, Mexico) based on the present day (February 2010) status. J. Volcanol. Geotherm. Res. 2010, 193, 49–66. [Google Scholar] [CrossRef]
  49. Saucedo, R.; Macías, J.L.; Sheridan, M.F.; Bursik, M.I.; Komorowski, J.-C. Modeling of pyroclastic flows of Colima Volcano, Mexico: Implications for hazard assessment. J. Volcanol. Geotherm. Res. 2005, 139, 103–115. [Google Scholar] [CrossRef]
  50. Macorps, E.; Charbonnier, S.J.; Varley, N.R.; Capra, L.; Atlas, Z.; Cabré, J. Stratigraphy, sedimentology and inferred flow dynamics from the July 2015 block-and-ash flow deposits at Volcán de Colima, Mexico. J. Volcanol. Geotherm. Res. 2018, 349, 99–116. [Google Scholar] [CrossRef]
  51. Walker, G.P.L.; Croasdale, R. Two Plinian-type eruptions in the Azores. J. Geol. Soc. Lond. 1971, 127, 17–55. [Google Scholar] [CrossRef]
  52. Wallenstein, N.; Duncan, A.; Guest, J.E.; Almeida, M.H. Eruptive history of Fogo Volcano, São Miguel, Azores. Geol. Soc. Lond. Mem. 2015, 44, 105–123. [Google Scholar] [CrossRef]
  53. Medeiros, J.; Carmo, R.; Pimentel, A.; Vieira, J.C.; Queiroz, G. Assessing the impact of explosive eruptions of Fogo volcano (São Miguel, Azores) on the tourism economy. Nat. Hazards Earth Syst. Sci. 2021, 21, 417–437. [Google Scholar] [CrossRef]
  54. López-Escobar, L.; Parada, M.A.; Hickey-Vargas, R.; Frey, F.A.; Kempton, P.D.; Moreno, H. Calbuco Volcano and minor eruptive centers distributed along the Liquiñe-Ofqui Fault Zone, Chile (41–42 S): Contrasting origin of andesitic and basaltic magma in the Southern Volcanic Zone of the Andes. Contrib. Miner. Petrol. 1995, 119, 345–361. [Google Scholar] [CrossRef]
  55. Castruccio, A.; Clavero, J.; Segura, A.; Samaniego, P.; Roche, O.; Le Pennec, J.-L.; Droguett, B. Eruptive parameters and dynamics of the April 2015 sub-Plinian eruptions of Calbuco volcano (southern Chile). Bull. Volcanol. 2016, 78, 1–19. [Google Scholar] [CrossRef]
  56. Van Eaton, A.R.; Amigo, Á.; Bertin, D.; Mastin, L.G.; Giacosa, R.E.; González, J.; Valderrama, O.; Fontijn, K.; Behnke, S.A. Volcanic lightning and plume behavior reveal evolving hazards during the April 2015 eruption of Calbuco volcano, Chile. Geophys. Res. Lett. 2016, 43, 3563–3571. [Google Scholar] [CrossRef] [Green Version]
  57. Hudspith, V.A.; Belcher, C.M.; Kelly, R.; Hu, F.S. Charcoal reflectance reveals early Holocene boreal deciduous forests burned at high intensities. PLoS ONE 2015, 10. [Google Scholar] [CrossRef] [Green Version]
  58. Scott, A.C.; Glasspool, I.J. Observations and experiments on the origin and formation of inertinite group macerals. Int. J. Coal Geol. 2007, 70, 53–66. [Google Scholar] [CrossRef]
  59. Lünsdorf, N.K. Raman spectroscopy of dispersed vitrinite-Methodical aspects and correlation with reflectance. Int. J. Coal Geol. 2016, 153, 75–86. [Google Scholar] [CrossRef]
  60. O’Haver, T. A Pragmatic Introduction to Signal Processing with Applications in Scientific Measurement: An Inllustruated Essay with Free Software to Download; University of Maryland: College Park, MD, USA, 2016; ISBN 9781533372857. [Google Scholar]
  61. Beyssac, O.; Goffé, B.; Petitet, J.-P.; Froigneux, E.; Moreau, M.; Rouzaud, J.-N. On the characterization of disordered and heterogeneous carbonaceous materials by Raman spectroscopy. Spectrochim. Acta Part A Mol. Biomol. Spectrosc. 2003, 59, 2267–2276. [Google Scholar] [CrossRef]
  62. Muirhead, D.K.; Parnell, J.; Spinks, S.; Bowden, S.A. Characterization of organic matter in the Torridonian using Raman spectroscopy. Geol. Soc. Lond. Spec. Publ. 2017, 448, 71–80. [Google Scholar] [CrossRef] [Green Version]
  63. Beyssac, O.; Pattison, D.R.M.; Bourdelle, F. Contrasting degrees of recrystallization of carbonaceous material in the Nelson aureole, British Columbia and Ballachulish aureole, Scotland, with implications for thermometry based on Raman spectroscopy of carbonaceous material. J. Metamorph. Geol. 2019, 37, 71–95. [Google Scholar] [CrossRef] [Green Version]
  64. Schmidt, J.S.; Hinrichs, R.; Araujo, C.V. Maturity estimation of phytoclasts in strew mounts by micro-Raman spectroscopy. Int. J. Coal Geol. 2017, 173, 1–8. [Google Scholar] [CrossRef]
  65. Blanchette, R.A. A review of microbial deterioration found in archaeological wood from different environments. Int. Biodeterior. Biodegrad. 2000, 46, 189–204. [Google Scholar] [CrossRef]
  66. Sweeney, J.J.; Burnham, A.K. Evaluation of a simple model of vitrinite reflectance based on chemical kinetics. Am. Assoc. Pet. Geol. Bull. 1990, 74, 1559–1570. [Google Scholar] [CrossRef]
  67. Burnham, A.K. Organic Geochemistry Kinetic models of vitrinite, kerogen, and bitumen reflectance. Org. Geochem. 2019, 131, 50–59. [Google Scholar] [CrossRef]
  68. Nielsen, S.B.; Clausen, O.R.; McGregor, E. Basin% Ro: A vitrinite reflectance model derived from basin and laboratory data. Basin Res. 2017, 29, 515–536. [Google Scholar] [CrossRef]
  69. Kilzer, F.J.; Broido, A. Speculations on the nature of cellulose pyrolysis. Pyrodynamics 1965, 2, 151–163. [Google Scholar]
  70. Rowell, R. The Chemistry of Solid Wood; American Chemical Society: Washington, DC, USA, 1984. [Google Scholar]
  71. Ascough, P.L.; Bird, M.I.; Wormald, P.; Snape, C.E.; Apperley, D. Influence of production variables and starting material on charcoal stable isotopic and molecular characteristics. Geochim. Cosmochim. Acta 2008, 72, 6090–6102. [Google Scholar] [CrossRef] [Green Version]
  72. McBeath, A.V.; Smernik, R.J.; Schneider, M.P.W.; Schmidt, M.W.I.; Plant, E.L. Determination of the aromaticity and the degree of aromatic condensation of a thermosequence of wood charcoal using NMR. Org. Geochem. 2011, 42, 1194–1202. [Google Scholar] [CrossRef]
  73. Schneider, M.P.W.; Smittenberg, R.H.; Dittmar, T.; Schmidt, M.W.I. Comparison of gas with liquid chromatography for the determination of benzenepolycarboxylic acids as molecular tracers of black carbon. Org. Geochem. 2011, 42, 275–282. [Google Scholar] [CrossRef]
  74. Quirico, E.; Rouzaud, J.-N.; Bonal, L.; Montagnac, G. Maturation grade of coals as revealed by Raman spectroscopy: Progress and problems. Spectrochim. Acta Part A Mol. Biomol. Spectrosc. 2005, 61, 2368–2377. [Google Scholar] [CrossRef] [PubMed]
  75. Sadezky, a.; Muckenhuber, H.; Grothe, H.; Niessner, R.; Pöschl, U. Raman microspectroscopy of soot and related carbonaceous materials: Spectral analysis and structural information. Carbon N. Y. 2005, 43, 1731–1742. [Google Scholar] [CrossRef]
  76. Li, C.-Z. Some recent advances in the understanding of the pyrolysis and gasification behaviour of Victorian brown coal. Fuel 2007, 86, 1664–1683. [Google Scholar] [CrossRef]
  77. Rebelo, S.L.H.; Guedes, A.; Szefczyk, M.E.; Pereira, A.M.; Araújo, J.P.; Freire, C. Progress in the Raman spectra analysis of covalently functionalized multiwalled carbon nanotubes: Unraveling disorder in graphitic materials. Phys. Chem. Chem. Phys. 2016, 18, 12784–12796. [Google Scholar] [CrossRef]
  78. Buseck, P.R.; Beyssac, O. From organic matter to graphite: Graphitization. Elements 2014, 10, 421–426. [Google Scholar] [CrossRef]
  79. Henry, D.G.; Jarvis, I.; Gillmore, G.; Stephenson, M.; Emmings, J.F. Assessing low-maturity organic matter in shales using Raman spectroscopy: Effects of sample preparation and operating procedure. Int. J. Coal Geol. 2018, 191, 135–151. [Google Scholar] [CrossRef]
  80. Ferralis, N.; Matys, E.D.; Knoll, A.H.; Hallmann, C.; Summons, R.E. Rapid, direct and non-destructive assessment of fossil organic matter via microRaman spectroscopy. Carbon N. Y. 2016, 108, 440–449. [Google Scholar] [CrossRef] [Green Version]
  81. Lupoi, J.S.; Fritz, L.P.; Hackley, P.C.; Solotky, L.; Weislogel, A.; Schlaegle, S. Quantitative evaluation of vitrinite reflectance and atomic O/C in coal using Raman spectroscopy and multivariate analysis. Fuel 2018, 230, 1–8. [Google Scholar] [CrossRef]
  82. Trolese, M.; Cerminara, M.; Ongaro, T.E.; Giordano, G. The footprint of column collapse regimes on pyroclastic flow temperatures and plume heights. Nat. Commun. 2019, 10, 1–10. [Google Scholar] [CrossRef] [Green Version]
  83. Capra, L.; Gavilanes-Ruiz, J.C.; Bonasia, R.; Saucedo-Giron, R.; Sulpizio, R. Re-assessing volcanic hazard zonation of Volcán de Colima, México. Nat. Hazards 2015, 76, 41–61. [Google Scholar] [CrossRef]
  84. Cecen, A. Multivariate Polynomial Regression 2020. Available online: https://www.github.com/ahmetcecen/MultiPolyRegress (accessed on 28 January 2022).
  85. Ostertagová, E. Modelling using polynomial regression. Procedia Eng. 2012, 48, 500–506. [Google Scholar] [CrossRef] [Green Version]
  86. Rennie, J.D.M. On the value of leave-one-out cross-validation bounds. In Computers in Biology and Medicine; Elsevier: Amsterdam, The Netherlands, 2003; pp. 123–129. [Google Scholar]
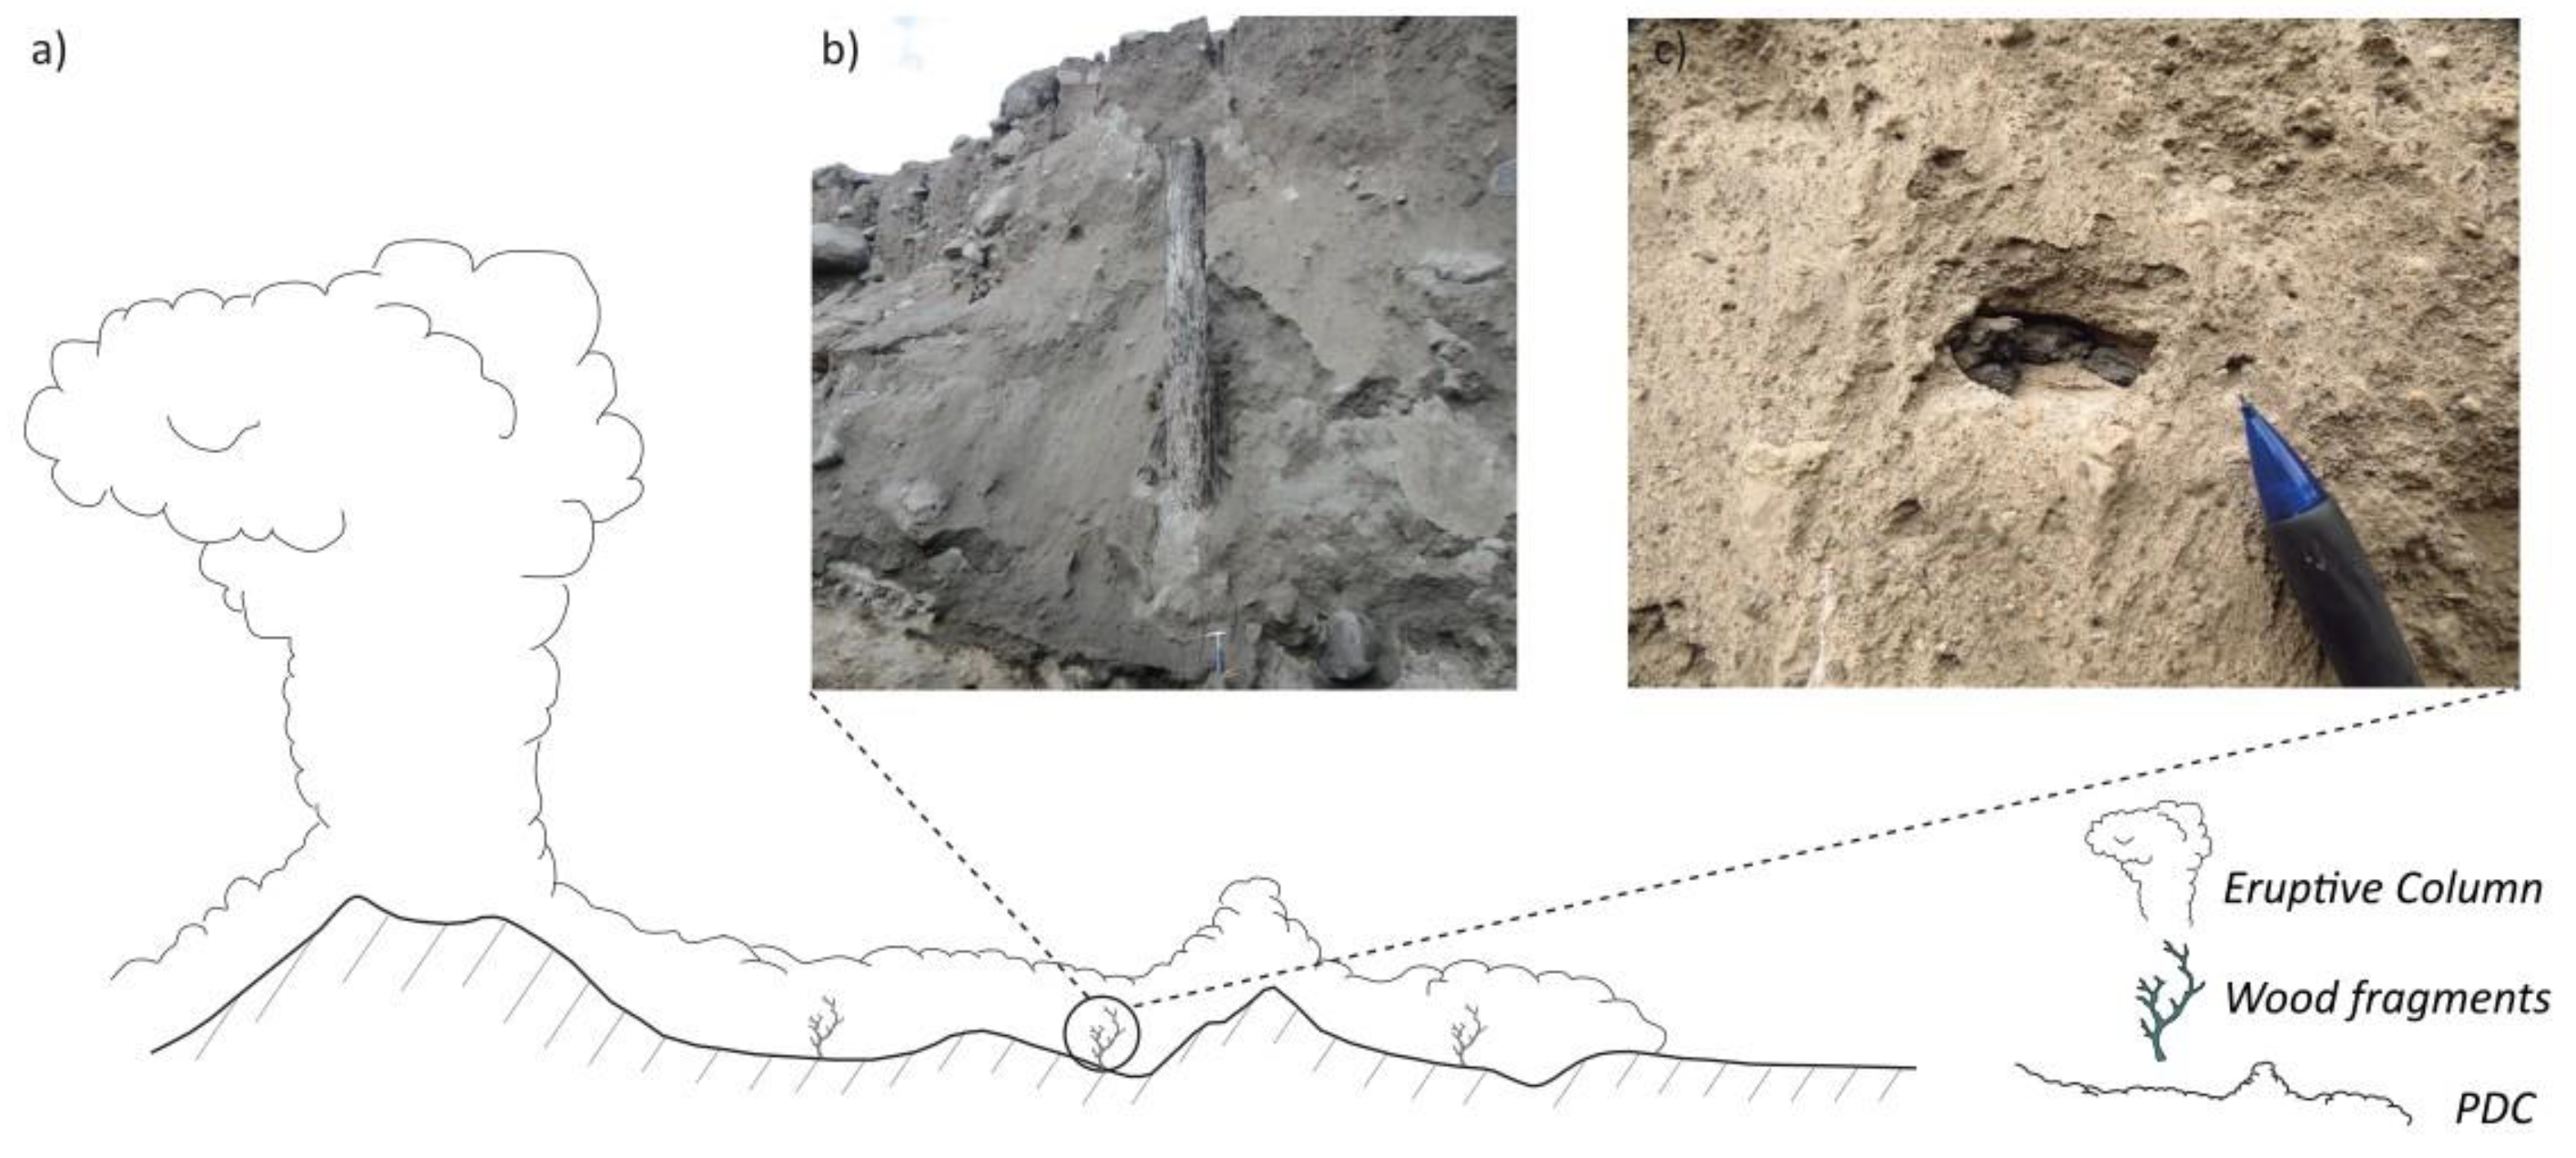
Figure 1. (a) Schematic representations of a PDC; (b) standing pine-tree trunk within a block-and-ash flow deposit from Volcán de Colima; (c) charcoal fragment embedded within a PDC deposit (ignimbrite) from Fogo volcano. Hammer at the bottom of Figure 1b is about 30 cm long while pencil in Figure 1c is about 2 cm.
Minerals 12 00203 g001
Figure 2. Conversion of charcoal reflectance measurements (Rc%) into temperatures (°C). Representation of the five pyrolysis curves from: Scott and Glasspool [19] (red dotted-dashed line with red dots), Scott and Glasspool [58] (yellow dashed line with yellow triangles), Hudspith et al. [57] (cyan dashed line and cyan dots); Ascough et al. [23] (green dotted-dashed line and green triangles), McParland et al. [24] 1 h (blue dotted-dashed line and blue triangles), McParland et al. [24] 24 h (pink dashed line and pink triangles). Bars indicate standard deviations (available only for data from Scott et al. [19], Ascough et al. [23] and Hudspith et al. [57]). Redrawn after Pensa et al. [6].
Minerals 12 00203 g002
Figure 3. Spectra treatment and deconvolution. (a) Representative raw spectrum and quadratic baseline (red line). (b) Spectrum after baseline subtraction and two band fitting.
Minerals 12 00203 g003
Figure 4. Example of wooden cells from (a) gymnosperms observed under reflected light with Rc% of 0.33 (b) angiosperms observed under reflected light with Rc% of 1.50; (c) SEM image of angiosperm and (d) SEM enlarged view of tracheidal structures.
Minerals 12 00203 g004
Figure 5. Selected spectra at different reflectance values, before (a) and after baseline subtraction (b). Dotted lines show the position of the D band at around 1350 cm−1 and of the G band at 1600 cm−1. Rc% values refer to the mean value of the samples.
Minerals 12 00203 g005
Figure 6. Raman parameters vs. measured charcoal reflectance (Rc%) and temperature (upper x axis). Green triangles were used for Colima samples, yellow squares for Fogo samples and blue diamonds for Calbuco samples. Bars represent standard deviation (Table 2). (a) Distance between D and G bands; (b) position of the D band; (c) Full width at maximum height of the D band; (d) Full width at maximum height of the G band; (e) Full width at maximum height ratio of the D and G bands; (f) area ratio of the D and G bands; (g) Intensiy ratio of the D and G bands.
Minerals 12 00203 g006
Figure 7. Calibration model for the evaluation of carbonification temperatures by Raman spectroscopy. (a) Second order polynomial correlation between Raman parameters (see text for abbreviations and symbols) and temperatures (°C) derived by reflectance analyses. (b) Temperatures predicted by polynomial regression vs. temperatures derived by reflectance analyses. Red dots and red lines indicate respectively average values and standard deviation. Light grey dots indicate predicted values for each spectrum in the dataset according to automatic fitting.
Minerals 12 00203 g007
Table 1. Charcoal reflectance average values for each sample and conversion into temperature (°C) according to Scott and Glasspool [19].
SampleProvenanceRc% AverageSdT °C [19]±°CLocalityPosition
COL-20-01 Colima Volcano0.250.022459Montegrande RavineDistal fan Ash cloud
COL-04-03Colima Volcano0.280.022588Montegrande RavineValley pond
COL-24-02Colima Volcano0.400.0227611Montegrande RavineOverbank
COL-48-01Colima Volcano0.430.0227913Montegrande RavineValley pond
COL-08-01AColima Volcano0.450.0328311Montegrande RavineValley pond
COL-05-02Colima Volcano0.460.0328413Montegrande RavineOverbank
COL-15-01Colima Volcano0.500.0228911Montegrande RavineValley pond
COL-14-01Colima Volcano0.570.0429915Montegrande Ravineoverbank
COL-18-03Colima Volcano0.990.0535310Montegrande Ravineoverbank
COL-21 Colima Volcano1.070.083685Montegrande RavineDistal fan?
CH3-115-02 centreFogo Volcano0.50.052898Dark brown ignimbrite, North flankValley pond
CH3-115-02 edgeFogo Volcano0.530.052934Dark brown ignimbrite, North flankValley pond
CH3-114-01B Fogo Volcano0.850.0833210Dark brown ignimbrite, North flankValley pond
CH1-113-01 edgeFogo Volcano1.210.093717Pink Ignimbrite, South FlankVeneer deposit
CH4_022-01 centreFogo Volcano1.370.1238811Pink Ignimbrite, South FlankValley pond
CAT 16A Calbuco Volcano1.500.074082Rio Blanco ravineValley confined
CAT 05A Calbuco Volcano2.900.085663Rio Blanco ravineValley confined
Table 2. Average Raman parameters calculated for the different samples. Acronyms: pD: position of the D band; pG: position of the G band; ID: intensity of the D band; IG: intensity of the G band; wD: full width at maximum height of the D band; wG full width at maximum height of the G band; aD: area of the D band; aG: area of the G band; ΔD–G: distance between D and G bands; ID/IG: intensity ratio; wD/wG: full width at maximum height ratio; aD/aG: area ratio; std: standard deviation.
SiteSamplespDstdpGstdIDstdIGstdwDstdwGstd
Fogo volcanoCH1-113-01 edge1359.900.701593.800.331876.21275.362383.51367.88206.694.6272.640.65
Fogo volcanoCH4-022-01 centre1363.402.291596.211.411427.56645.061816.99821.44198.9212.6372.151.49
Calbuco volcanoCAT 16A1362.451.791590.411.1911,467.371537.6318,334.302233.66234.748.0372.071.64
Colima volcanoCOL-20-011376.504.931585.009.831188.50125.211286.18308.27259.7826.34136.509.86
Colima volcanoCOL-04-031384.063.481588.302.811827.50476.372851.56749.73249.0813.06118.518.13
Calbuco volcanoCAT 05A1352.631.151593.091.077388.501822.0011,885.992874.65213.387.3262.331.42
Colima volcanoCOL-24-021381.552.451586.571.862276.131326.583367.291690.18260.6618.94106.369.20
Colima volcanoCOL-48-011381.767.351584.413.681617.43407.152434.78607.02258.2010.74116.7610.75
Colima volcanoCOL-08-01A1380.582.701590.601.261531.93205.542553.91557.26247.2416.1193.235.62
Colima volcanoCOL-05-021365.771.401583.690.781032.37283.641630.71416.14212.0010.6391.372.21
Fogo volcanoCH3-115-02 centre1381.311.881589.572.10776.34113.82994.79143.68247.9812.0697.464.54
Colima volcanoCOL-15-011369.791.621591.520.971279.47341.062125.81563.90217.188.8184.161.45
Fogo volcanoCH3-115-02 edge1379.271.431586.671.35551.82130.58711.67166.50267.3312.91110.774.48
Colima volcanoCOL-14-011369.501.321595.320.971113.72212.461596.81240.77217.5012.9280.882.13
Colima volcanoCOL-18-031375.042.641597.331.861238.99271.311690.43383.28237.5815.2296.307.14
Colima volcanoCOL-211369.402.011599.051.171362.51422.372233.50621.63221.1419.8471.103.95
Fogo VolcanoCH3-114-01B1369.162.631594.761.33204.81106.22285.87143.3921.9618.1076.652.68
SiteSamplesaDstdaGstdΔD–GstdID/IGstdwD/wGstdaG/aDstd
Fogo volcanoCH1-113-01 edge5.41 × 1058.16 × 1042.59 × 1053.97 × 104233.900.710.790.022.850.052.100.07
Fogo volcanoCH4-022-01 centre4.05 × 1051.89 × 1051.96 × 1058.87 × 104232.811.400.790.012.760.152.030.11
Calbuco volcanoCAT 16A3.70 × 1065.40 × 1051.98 × 1062.53 × 105227.950.850.620.023.260.081.870.08
Colima volcanoCOL-20-014.10 × 1055.42 × 1042.45 × 1056.22 × 104208.5014.200.950.171.920.311.760.52
Colima volcanoCOL-04-036.21 × 1051.72 × 1054.93 × 1051.44 × 105204.242.810.640.032.110.151.270.12
Calbuco volcanoCAT 05A2.20 × 1065.62 × 1051.12 × 1062.79 × 105240.460.420.620.023.420.061.960.07
Colima volcanoCOL-24-027.84 × 1054.94 × 1055.32 × 1052.87 × 105205.033.230.670.052.320.171.510.17
Colima volcanoCOL-48-015.71 × 1051.55 × 1053.78 × 1051.01 × 105202.644.520.610.062.460.241.280.22
Colima volcanoCOL-08-01A5.33 × 1056.34 × 1044.39 × 1051.32 × 105210.023.450.630.042.230.181.540.14
Colima volcanoCOL-05-023.51 × 1051.06 × 1052.25 × 1056.08 × 104217.931.360.780.022.320.081.710.12
Fogo volcanoCH3-115-02 centre2.29 × 1053.75 × 1041.34 × 1051.81 × 104208.272.730.600.032.660.121.420.10
Colima volcanoCOL-15-014.34 × 1051.23 × 1053.06 × 1058.68 × 104221.731.810.780.022.550.121.870.11
Fogo volcanoCH3-115-02 edge1.67 × 1054.27 × 1048.87 × 1042.08 × 104207.391.810.690.042.580.131.550.12
Colima volcanoCOL-14-014.01 × 1058.45 × 1042.58 × 1054.52 × 104225.831.320.760.032.420.151.920.15
Colima volcanoCOL-18-034.05 × 1059.84 × 1042.41 × 1056.85 × 104222.301.950.730.042.480.211.700.22
Colima volcanoCOL-214.24 × 1051.44 × 1052.40 × 1057.16 × 104229.651.420.600.053.110.141.730.18
Fogo VolcanoCH3-114-01B6.07 × 1043.25 × 1043.26 × 1041.65 × 104225.603.340.710.042.760.201.830.19
Publisher’s Note: MDPI stays neutral with regard to jurisdictional claims in published maps and institutional affiliations.