Abstract
To evaluate the vibration effect caused by carbon dioxide phase-transition fracturing, the Hilbert–Huang transform was used to study the change of vibration energy with distance in different frequency bands. The results are drawn as follows: (1) The peak particle velocity (PPV) decreases as a power function with an increase in distance and has fallen below 25 mm/s at 2.8 m. (2) The energy of vibration signals induced by carbon dioxide phase-transition fracturing is mainly distributed at the frequency band of 10–50 Hz. With the increase in distance, the energy distribution of vibration signals falls in four phases: Propagation to high frequency (0–13.9 m); a rapid high-frequency energy decrease (20–30 m); energy fluctuation (30–47.2 m) and a stable energy distribution (larger than 50 m). (3) The proportion of the low-frequency vibration energy (0–10 Hz) increases as a result of the increase in distance (less than 8.7 m), which should be paid more attention.
1. Introduction
Safe and efficient rock-fracturing technology has always played an important role in the field of hard rock excavation such as mining, tunneling and subway foundation pits [1]. Explosive blasting was the most commonly used method in the past because of its high efficiency, effectiveness and low cost [2,3,4]. However, it is strictly controlled because of flames, flying rocks and damage to the surrounding buildings caused by blasting vibration, especially close to complex and sensitive areas such as buildings and subways [5,6,7,8]. In contrast with explosive blasting, liquid carbon dioxide (CO2) fracturing technology is mainly based on the gas pressure generated by the liquid CO2 phase-transition, which is a physical transition process, showing wide application prospects owing to the small impact on the environment and surrounding buildings [9,10,11]. However, the construction process of this technology requires the transport and storage of high-pressure gas cylinders, resulting in certain security risks. To overcome the shortcomings of this technology, Hu and Yan et al. proposed a new, pneumatic rock-fracturing technology based on solid CO2 ice powder and a CO2 energy agent (CO2-EA). The CO2 ice powder can be instantly vaporized after a large amount of heat is released with the deflagration of CO2-EA, thereby fracturing rocks through gas shock waves and gas pressure [12,13]. However, there are no related studies on the vibration effect of rock-fracturing technology on the surrounding buildings.
The vibration effect on the surrounding buildings caused by rock-fracturing is related to the peak particle velocity (PPV), frequency and duration of vibration signals [14,15,16]. The time-frequency analysis method can generate time–frequency information at the same time by mapping a one-dimensional signal (amplitude changes with time) to a two-dimensional time–frequency plane (energy changes with time and frequency), which is suitable to analyze the effect of rock-fracturing-induced vibration. The commonly used time–frequency analysis methods include the short-time Fourier transform (STFT), wavelet packet transform (WPT), Wigner–Ville distribution (WVD) and Hilbert–Huang transform (HHT). The STFT method uses a sine function as the basis function and is mainly suitable for processing stationary signals. However, for nonstationary signals, the time and frequency resolution cannot achieve optimal values at the same time [17]. The WPT method was proposed to overcome these shortcomings and had high time and frequency resolutions [18,19,20]. However, it still needs to choose a basis wavelet with a fixed shape, which may affect the decomposition results of signals [21]. The WVD method does not restrict each aspect in terms of time and frequency, and the resolution is high. However, if used for multiple signal components, cross-term interference easily occurs, which seriously affects the decomposition of the original signal [22,23]. Given the limitations of the above methods, another method for time–frequency analysis named HHT has become increasingly popular in recent years [24,25]. This method dispenses the restriction of the basis function and can adapt to the signal change, which is suitable for nonlinear and nonstationary signals [26]. The ground vibration signals induced by rock fracturing have the characteristics of a sudden change and unevenness, which are typical for nonlinear and nonstationary signals. Therefore, it is more suitable to use HHT for time–frequency analysis.
Time–frequency analysis of vibration signals caused by rock fracturing is mainly concentrated in the field of explosive blasting, where the WPT [27,28,29,30] and HHT [31,32,33,34,35,36,37] were the mainly used methods. The results show that high-frequency energy decreases faster than low-frequency energy with an increase in distance. There are also several studies on the vibration energy distribution caused by liquid CO2 phase-transition fracturing rock. Chen et al. found that the main frequency band of the vibration signal induced by liquid CO2 fracturing rock had a small correlation with the propagation distance, but the corresponding energy proportion gradually decreased as the distance increased [38]. Liu et al. studied the vibration energy caused by the liquid CO2 phase-transition using the HHT method and found that the frequency of the particle vibration was mainly distributed in the range of 0–100 Hz, and the energy was mainly concentrated in the range of 0–20 Hz [39]. Li et al. found that the vibration energy caused by the liquid CO2 phase-transition decreased rapidly with the increase in distance, and 85% of the energy was distributed at 6–60 Hz [40].
However, there are few references regarding the distribution of vibration energy caused by CO2 ice powder phase-transition fracturing. In this study, the vibration signals induced by CO2 ice powder phase-transition fracturing were gathered by a microseismic monitoring system. Then, the HHT method was used to study the energy distribution of vibration signals and the change alongside the increase in distance. The results are of significance for evaluating the safety and promoting the application of rock-fracturing technology.
2. Engineering Background
2.1. Process of Rock-Fracturing
The test was carried out in Lin’an District, Hangzhou City, Zhejiang Province, China, where the tunnel beneath Qingshan Lake was under excavation nearby (Figure 1). The construction area was a small hill covered by tuff, whose uniaxial compression strength was 80 MPa. Explosives were prohibited owing to the fact the area is adjacent to the subway and residential areas. Rock was broken mainly by virtue of the hydraulic hammer, albeit at rather low efficiency. This is because the rock is compact and the area for rock-fracturing lacks free faces. To improve the efficiency of rock-fracturing, the rock-fracturing test was performed in the area using the rock-fracturing method with CO2 ice powder. The system for CO2 ice powder phase-transition fracturing is mainly composed of solid CO2 ice powder, CO2-EA, a heating device, a storage tube and an electric initiator (Figure 2). The CO2-EA is solid powder and is sealed in a polyvinyl chloride (PVC) tube in advance. The storage tube shows a diameter of 9 cm and a length of 100 cm. Each storage tube is filled with 4 kg of CO2 ice powder. The PVC tube packed with CO2-EA is set in the middle part of the storage tube. Two boreholes, labeled H1# and H2#, were detected during the rock-fracturing test with a diameter of Φ110 mm, a depth of 3 m and a hole-sealing length of 2 m. In terms of the mechanism of the CO2 ice powder phase-transition fracturing, CO2-EA is rapidly combusted to release a great deal of heat under the excitation of high voltage; in this case, the surrounding CO2 ice powder is rapidly gasified to generate high-pressure CO2 and trigger gas shock waves after fracturing through the tube wall. A small number of impact fractures are generated after the shock waves are applied to the hole wall, although with a short action time. The impact fractures and primary fractures in rock mainly propagate and extend under the effect of quasi-static pressure of high-pressure gas, thus leading to rock fracture. According to the site photos after rock fracturing, it can be seen that no obvious crushed zone is found around the boreholes, and the rock fracture mainly manifests in the occurrence of macroscopic cracks (Figure 2).
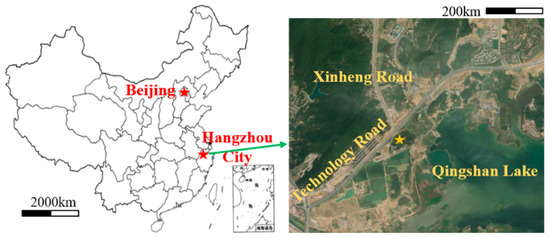
Figure 1.
Rock-fracturing site (source elaborated by authors).
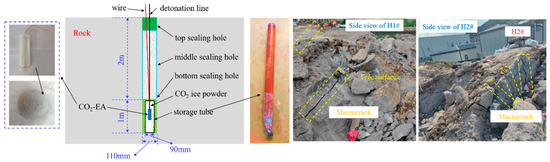
Figure 2.
Fracturing system and site photos (source elaborated by authors).
2.2. Ground Vibration Monitoring
The whole rock-fracturing process with CO2 ice powder was monitored by applying a KJ522 microseismic (MS) monitoring system (Xuzhou Fuan Technology Co., Ltd., Xuzhou City, China) consisting of a monitoring substation, a junction box, vibration sensors, a monitoring computer and monitoring software. Sixteen channels in a monitoring substation were used to synchronously collect the vibration signals, in which the analog–digital (AD) conversion accuracy and sampling frequency of each channel were 24 bit and 2 kHz in the test, respectively. The output signals from the monitoring substation were voltage signals, with the selectable voltage range of ±10 V during the test. The vibration sensors responded within the frequency range of 0.1–500 Hz. A total of thirteen vibration sensors were distributed near the rock-fracturing position during the test (Figure 3). The distance between the vibration sensors and the rock-fracturing position was between 2.8 and 66.7 m. The sensors were fixed on the ground by mixing plaster powder with water until full coupling, and the test started after the gypsum was hardened. The lines were fixed with the aid of adhesive tape to avoid the interference of line shaking on the monitoring.
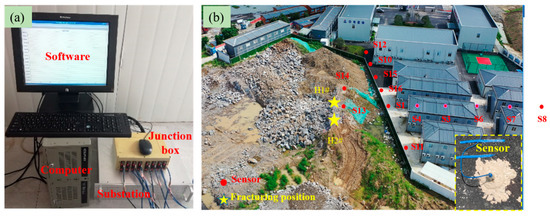
Figure 3.
MS monitoring system and vibration sensors layout: (a) MS monitoring system, (b) vibration sensors layout (source elaborated by authors).
3. Hilbert-Huang Transform
The ground vibration signals caused by CO2 phase-transition fracturing are typically nonlinear and nonstationary. HHT can adapt to signal changes without the requirement of a basis function, so it is rather suitable for dealing with this type of signal. The method mainly comprises two steps, i.e., empirical mode decomposition (EMD) and the Hilbert transform [24,25,26].
- (1)
- EMD
EMD aims to decompose signals into various meaningful components at instantaneous frequencies. It is supposed that S(t) is the ground vibration signal. The extreme of the signal is first attained and the upper and lower envelope lines Smax(t) and Smin(t) of the signal are obtained through cubic spline interpolation. The mean of the two envelope lines equals m1(t). A new series h1(t) is obtained by subtracting m1(t) from S(t). The series h1(t) is regarded as the first component decomposed using EMD, which is also called the intrinsic mode function (IMF), if h1(t) synchronously satisfies two conditions: (1) The number of zero-crossing points is equal to or has a difference of 1 in comparison to the extreme points in the whole data series; (2) as for any point in the signal, the mean of the envelope lines determined by the local maximum and local minimum is 0, that is, the signal is locally symmetric to the timeline. Otherwise, the above steps are repeated to decompose the h1(t) signal. The decomposed components may not completely satisfy the conditions stipulated by IMF in the practical application. In order to prevent the decomposition process from continuing and never ending, the standard deviation (SD) between two sequential results is introduced as the criterion in this method. Supposed that the datum screened at the kth times is h1k(t), then the SD between h1k(t) and the last decomposition result h1(k-1)(t) can be expressed as follows:
If SD is lower than the preset critical value, h1k(t) can be regarded as the first IMF, recorded as C1(t). Previous experience shows that the optimal critical value of SD is within 0.2–0.3, which not only guarantees the linear stability of the IMF but also enables the IMF to show the physical meaning of the amplitude and frequency modulation. The residual signal (r1(t)) is attained by subtracting C1(t) from S(t), and then the above decomposition continues on r1(t) to obtain more IMF components. When the residual rn(t) obtained through the nth times of decomposition is lower than the preset error or becomes a monotonic function, the decomposition process is ended. Finally, n IMF components and the residual rn(t) are attained. Therefore, the original signal can be expressed as the superposition of various IMF components and the residual.
- (2)
- Hilbert transform
To attain the change relationship of the instantaneous frequency with time, each IMF component decomposed using EMD is subjected to the Hilbert transform to obtain the complex IMF component:
where ai(t) and θi(t) represent the instantaneous amplitude and instantaneous phase of the complex IMF component, respectively. The instantaneous frequency is calculated as follows:
thus, Ci(t) can be expressed as follows:
Thus, the Hilbert spectrum can be obtained as follows:
The Hilbert marginal spectrum is attained by performing the integral operation on time using H(ω, t), that is,
The marginal spectrum provides the measurement results of amplitude at each frequency and reflects the accumulation of amplitudes within the whole time period. The Hilbert instantaneous energy can be defined by performing the integral on the frequency using the square of the amplitude:
The change in the signal energy with time can be obtained according to the Hilbert instantaneous energy. By conducting the integral on time based on the square of the amplitude, the Hilbert energy spectrum can be attained:
The Hilbert energy spectrum offers measurement results of the energy at each frequency and shows the energy accumulated at each frequency within the whole time period.
4. HHT Analysis on Vibration Signals Induced by CO2 Phase-Transition Fracturing
4.1. Empirical Mode Decomposition
Figure 4 shows the vibration waveforms induced by two rock-fracturing events (H1# and H2#) with CO2 ice powder. It can be seen that all 13 vibration sensors distributed around the rock-fracturing position respond to the events. For each rock-fracturing event, the waveforms received by the sensors are arranged from the top down according to a gradually increasing distance from the rock-fracturing position. It is necessary to perform EMD decomposition on the waveforms first to study the time–frequency characteristics of the vibration waveforms. The waveform received by sensor S13 closest to the rock-fracturing position in rock-fracturing event H1 is selected as the research object. It can be observed that the original waveform is decomposed into nine IMF components and a residual component (Figure 5a). The most significant difference among C1–C9 is that the fluctuation period increasingly grows. Each component is subjected to a fast Fourier transform to obtain the power spectrum (Figure 5b). The frequency range of the power spectrum should be within 0–1000 Hz according to the Nyquist sampling theorem [23]. However, the frequency of the signal components is mainly distributed within 400 Hz and therefore the frequency within 0–400 Hz is only shown on the horizontal axis. It can be seen that the dominant frequency (DF, frequency corresponding to peak point) of the waveforms increasingly declines from C1 to C9. It indicates that the EMD decomposition is performed from a high frequency to a low frequency, that is, the IMF component at a higher frequency is first decomposed. It is worth noting that the C1 component is greatly different from the other components in terms of the power spectrum, which presents many high-frequency components. The main reason is that the component contains high-frequency noises. As for the peak change of IMF components, the IMF component with the highest peak is not decomposed at first. The peak gradually increases from C1 to C3 while it is gradually reduced from C3 to C9. This is because the C1 component contains high-frequency noises, showing relatively low effective components; the C3 component shows a rather approximated shape with the original signal and contains many effective components.
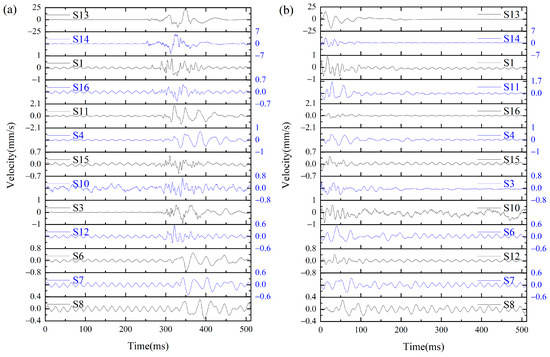
Figure 4.
Vibration signals caused by CO2 phase-transition fracturing: (a) H1, (b) H2 (source elaborated by authors).
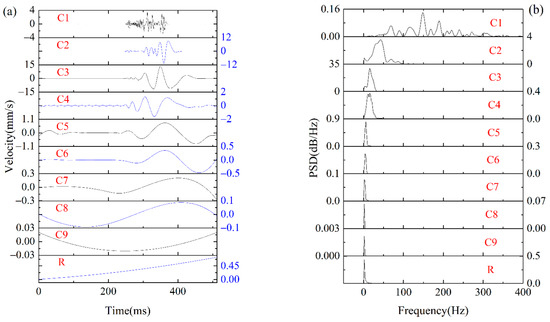
Figure 5.
EMD decomposition results and power spectrum: (a) EMD decomposition results, (b) power spectrum (source elaborated by authors).
Different components make diverse contributions to the original signal. When calculating the Hilbert three-dimensional (3D) spectrum, it is necessary to select IMF components that are similar to the original signal. Otherwise, an unnecessary low-frequency energy distribution and high-frequency noises may be introduced, which influence the result of the time–frequency analysis. To quantitatively describe the correlation between the IMF components and the original signal, the following formula is shown [37]:
where denotes the covariance between the ith IMF component and the original signal; and refer to the standard deviation of the ith IMF component and that of the original signal, respectively. The critical value of the similarity can be calculated using the following formula [41]:
That is, the IMF components with a correlation ηi larger than ηTH are retained while those with similarities lower than ηTH are eliminated. The value of ηTH is calculated as 0.18 for waveform S13 of the H1 event. Figure 6 displays the correlation coefficients (CC) between all IMF components and the original signal (S13 waveform). It can be found that the correlations of C2–C4 components with the original signal are larger than the critical value, so they are retained. A reconstructed signal is attained by superposing the three component signals and comparing them with the original signal. It can be found that two signals (that is, the reconstructed signal and the original signal) are rather similar both in the change trend and the range of velocity (Figure 7). It reveals that the method of reconstructing the signal shows high accuracy. When calculating the Hilbert energy spectrum, the method is applied to select the effective IMF components and then reconstruct the signal.
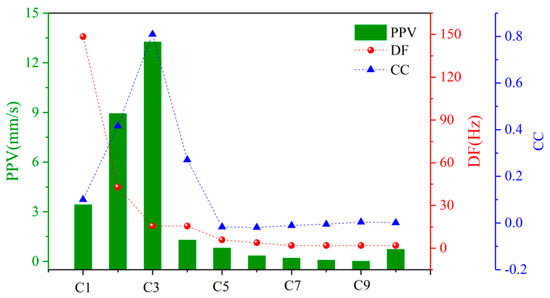
Figure 6.
Comparison of PPV, DF and CC (source elaborated by authors).
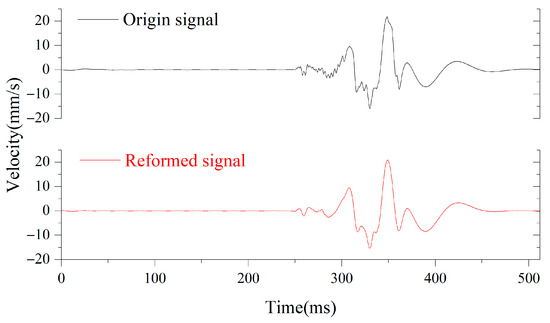
Figure 7.
Comparison between the original signal and the reconstructed signal (source elaborated by authors).
4.2. Hilbert Spectrum
After performing the EMD decomposition on all waveforms in Figure 4, the effective IMF components are selected utilizing Equations (10) and (11). Moreover, the Hilbert energy spectrum (energy–time–frequency spectrum) of all vibration waveforms in the two rock-fracturing events are calculated using Equations (3)–(6). Some results are selected for analysis according to the gradually increasing distance (Figure 8). The change in the signal energy with time and the instantaneous frequency can be clearly observed from the Hilbert energy spectrum. Different colors represent different energy levels: The energy gradually increases from blue to red. The maximum signal energy corresponds to the peak velocity of the original waveform: A high peak velocity in the original waveform corresponds to high signal energy. The distribution range of the signal energy generally gradually shrinks with the increase in the distance.
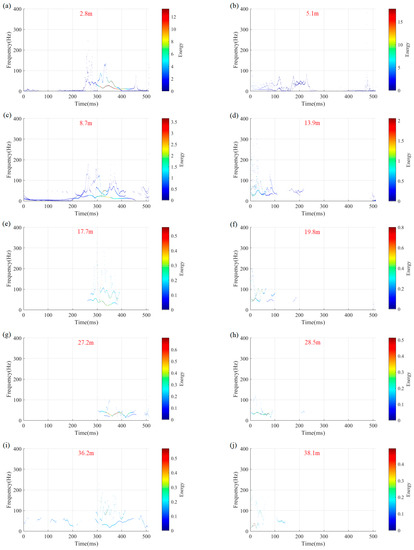
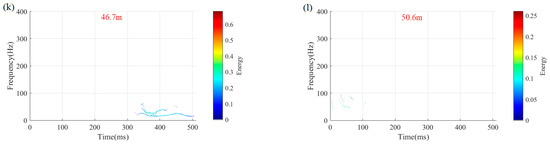
Figure 8.
Hilbert energy spectrum of different distance: (a) 2.8 m, (b) 5.1 m, (c) 8.7 m, (d) 13.9 m, (e) 17.7 m, (f) 19.8 m, (g) 27.2 m, (h) 28.5 m, (i) 36.2 m, (j) 38.1 m, (k) 46.7 m, (l) 50.6 m (source elaborated by authors).
The energy of the vibration signals is distributed in different manners with different distances from the energy–time perspective. With the increase in distance, the distribution of the signal energy is increasingly delayed, which reflects the propagation process of the vibration signal. For example, the energy of the vibration signal starts to occur from about 250 ms at a distance of 2.8 m; the signal energy appears at about 300 ms at a distance of 27.2 m; at a distance of 46.7 m, the signal energy does not occur until about 320 ms. The occurrence time of the maximum signal energy also corresponds to that of the peak velocity to some extent. For example, the maximum energy mainly appears at about 350 ms at 2.8 m, and the vibration velocity of signals in the original waveform also essentially reaches the maximum at 350 ms. Generally, the energy is more irregularly attenuated after reaching the peak due to the high signal energy at a short distance, that is, the coda wave is more developed. For example, at 2.8 m, the energy of the vibration signals locally reaches a peak at about 450 ms after decreasing to a low value at 400 ms; at 5.1 m, the vibration signals show apparent energy distribution at 160–250 ms after dropping to a low value at about 150 ms. Apart from the peak energy or the peak vibration velocity, the fluctuation of coda waves is also noticeable in the engineering application of rock-fracturing with CO2 ice. The larger the intensity of coda waves and the longer the action time, the greater the influence on the surrounding buildings. The coda waves are relatively developed within the range of 13.9 m on the whole.
The distribution of the vibration energy at different distances greatly differs according to the analysis from the energy–frequency perspective. Within the range of 13.9 m, the corresponding frequency range of the signal energy gradually broadens, and the distribution of the signal energy gradually becomes dispersed with the increasing distance. The signal energy is mainly distributed within 100 Hz at 5.1 m; the corresponding frequency distribution range of the signal energy increases to about 180 Hz at 8.7 m while it grows to about 300 Hz at 13.9 m. The high-frequency components larger than 100 Hz are gradually reduced and the corresponding frequency distribution range of the signal energy is gradually narrowed when the distance is within 20–30 m. It mainly reflects the fact high-frequency components of the signals were attenuated with the increase in distance. However, the attenuation is not sustained. The corresponding frequency distribution range of the signal energy fluctuates as the distance continues to increase. For example, the frequency distribution range of the signal energy widens at 36.2 m. The reason is that new noise is carried by the signal during propagation. It can be also found from the original waveform that the noise in the signals is great at 36.2 m. After the distance exceeds 50 m, the distribution of the signal energy does not significantly vary any longer, which indicates that the influence of the vibration within the distance range can be ignored. This can also be verified from the original waveform, that is, the S6, S7 and S8 waveforms from the H1 event exhibit a high similarity with the S12, S7 and S8 waveforms from the H2 event. According to the above analysis, it can be seen that with the increasing distance, the frequency distribution of the signal energy mainly varies following this process, that is, propagation to a high frequency, rapid attenuation of high-frequency energy, signal energy fluctuation and stabilized distribution of the signal energy. This change in the frequency distribution of the signal energy with increasing distance contributes to the rapid decay of the vibration velocity since the high-frequency components decay faster.
4.3. Marginal Spectrum
The distribution of the signal energy at different frequencies (marginal spectrum) can be attained by accumulating the Hilbert energy spectrum in the frequency domain. The marginal spectrum of all vibration waveforms triggered by two rock-fracturing events with CO2 ice powder is shown in Figure 9. From the top to the bottom, the marginal spectrum shows the gradually increasing distance from the rock-fracturing position. By comprehensively analyzing the two events it can be seen that the signal energy is distributed concentratedly (8–27 Hz) at the distance of 2.8 m. In this case, only one obvious peak is found at the frequency of about 11 Hz; at the distance of 5.1 m, the signal energy is significantly diffused, and an obvious energy distribution appears within the ranges of 5–10 Hz and 21–50 Hz. There are two obvious peaks within the whole frequency range, which separately occur at 9 and 26 Hz; at the distance of 8.7 m, the proportion of the signal energy significantly decreases within 25–50 Hz. Multiple peaks are present in the range of 0–25 Hz, separately at about 5, 13, 19 and 24 Hz. At the distance of 13.9 m, the signal energy becomes rather dispersed (0–77 Hz) and the energy range (0–18) is significantly reduced. According to the above analysis, it can be found that the frequency distribution of the signal energy varies in the process of single-peak, two-peak, multi-peak and dispersed distribution with a distance in the vicinity of 13.9 m. It implies that the distribution of the signal energy is increasingly dispersed with the increase in distance. The main reason is that the vibration waves significantly vary after experiencing multiple instances of reflection and refraction during their propagation. At a distance within 17.7–23.4 m, the signal energy at a frequency higher than 50 Hz is obviously attenuated and is mainly distributed within 20–40 Hz when reaching 23.4 m. It indicates that the propagation medium of vibration waves shows a stronger absorption capacity for high-frequency energy with the increase in distance. Therefore, the signal energy is gradually transferred to a low frequency. At a distance within 25.2–47.2 m, the signal energy is distributed within a small range (lower than 20). The signal energy is unstable in terms of the frequency distribution, probably appearing as a broad band (such as the S10 waveform from the H2 event) or a narrow band, such as the S3 waveform from the H1 event. The distribution of the signal energy shows no obviously changing regularity with the growing distance. It indicates that the signal propagates unstably within the distance range; after exceeding 50 m, different signals from the same event deliver a rather similar energy distribution, which implies that the signal energy does not significantly vary after exceeding a certain distance, and the influence of the vibration within the distance can be ignored.
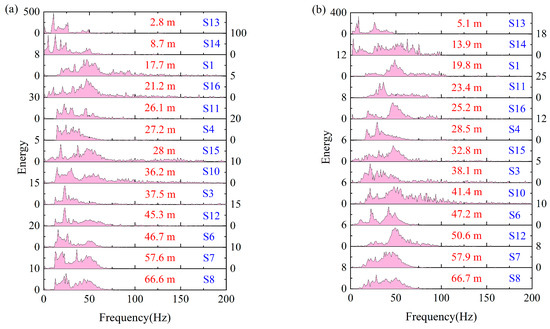
Figure 9.
Marginal spectrum: (a) H1 event, (b) H2 event (source elaborated by authors).
5. Discussion
5.1. Attenuation of the Signal Energy with the Distance
The energy of vibration signals is gradually attenuated with the distance due to spherical diffusion, media absorption and the interfacial effect of energy during the propagation of the vibration waves induced by rock fracturing with CO2 ice powder. According to the energy distribution of the Hilbert energy spectrum, the attenuation of the total signal energy with the distance is calculated through energy accumulation, as shown in Figure 10. It can be seen that the attenuation trend of the total signal energy is rather similar to that of the PPV: The signal energy is rapidly attenuated within a short distance (within 10 m) while it is slowly attenuated at a longer distance (beyond 20 m), which conforms to the change characteristic of the power function. The fitting accuracy (R2) using the power function is larger than 0.98, which implies that the attenuation of the vibration energy and PPV induced by rock fracturing with CO2 ice powder indeed conforms to the attenuation law of the power function. At a distance of 2.8 m, the PPV of the vibration signals fell to 21.9 mm/s, which is lower than the permissible vibration velocity of common buildings in China (25 mm/s). The total energy of the vibration signals beyond 20 m only takes up 3–10% that at 2.8 m and it basically fluctuates within a small range with an increasing distance. It indicates that the influence of the vibration induced by rock fracturing with CO2 ice powder can be ignored after exceeding 20 m. It is worth noting that the proportion of the vibration energy whose frequency is close to the natural vibration frequency of the building shows an amplification effect. Generally, low-frequency vibration (lower than 10 Hz) leads to greater structural damage to buildings [16,23]. Therefore, it is also necessary to focus on the proportion of low-frequency energy and its change as a result of distance separate from changes of the PPV and the total signal energy in practical research. According to the safety standard for permissible blast vibration in China (Table 1), the distributed signal energy is partitioned and calculated by taking 0–10 Hz (S1) and 10–50 Hz (S2) as frequency bands. The proportions of the signal energy within the two frequency bands at different distances are calculated, as shown in Figure 11. Obviously, the proportion of the signal energy at frequency band S2 (larger than 35%) is higher than that at frequency band S1 (35%). It implies that frequency band S2 is the main frequency band for the energy of the vibration signals induced by rock fracturing with CO2 ice powder, which is rather favorable for the safety of surrounding buildings.
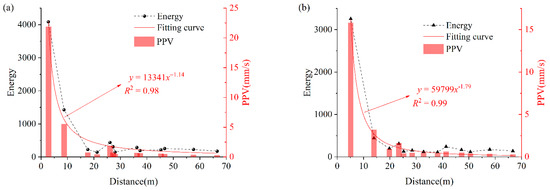
Figure 10.
Attenuation of the total signal energy with the distance: (a) H1 event, (b) H2 event (source elaborated by authors).

Table 1.
Blasting vibration criteria of China Blasting Safety Regulations (GB6722-2014).
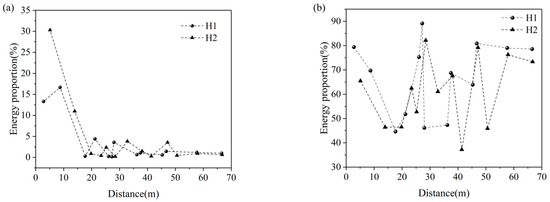
Figure 11.
Distribution law of the proportion of the signal energy at different frequency bands as a result of distance: (a) S1 frequency band, (b) S2 frequency band (source elaborated by authors).
The vibration energy induced by different rock-fracturing events probably shows a difference in terms of the attenuation law. Similar to the attenuation of the total signal energy, the changes in the signal energy from events H1 and H2 at the two frequency bands as a result of distance are not significant after exceeding 20 m. Considering that the total signal energy is low within the range, the condition with the distance in the range of 20 m is intensively analyzed. The proportion of the signal energy from the event H1 at the frequency band S1 gradually rises as the distance increases from 2.8 m to 8.7 m. Within the distance range, the proportion of the vibration energy at the frequency band S2 gradually decreases. It reveals that the natural frequency of the surrounding media is approximated to that of the frequency band S1 and lower than that of the frequency band S2. The absorption of media for the signal energy at the frequency band S1 is lower than that for that at the frequency band S2. Therefore, the distribution proportion of the signal energy at a low frequency shows an amplification effect, which is essentially caused by inconsistency of the attenuation degree of the signal energy at different frequency bands. The signal energy at frequency band S1 is rapidly reduced as the distance increases from 8.7 m to 17.7 m. It reveals that the amplification effect of the proportion of the signal energy at a low frequency only occurs within a certain distance, which should be considered in the engineering application of rock fracturing with CO2 ice powder. As for event H2, the signal energy at frequency bands S1 and S2 gradually declines as the distance increases from 5.1 m to 13.9 m; when the distance grows from 13.9 m to 20 m, the signal energy at frequency band S1 is reduced by 10% while that at frequency band S2 essentially remains the same. It reveals two aspects: On the one hand, the distance corresponding to the amplification effect of the proportion of low-frequency energy should be lower than 13.9 m; on the other hand, the attenuation distance of the energy at the frequency band S2 is lower than that at S1, that is, the low-frequency energy propagates farther. Through comprehensive analysis, it can be found that the influential distance of the energy at frequency band S2 is in the vicinity of 13.9 m while that at S1 is approximately 20 m. This is consistent with the influential distance of the vibration obtained according to the attenuation of the total signal energy. It can be concluded that the influential distance of the vibration induced via rock fracturing with CO2 ice powder is mainly affected by the proportion change of the low-frequency vibration energy.
5.2. Comparation of Explosive Blasting, Liquid CO2 and CO2 Ice Powder Phase-Transition Fracturing
Explosive blasting is mainly based on a violent chemical reaction. Once the explosive explodes in the rock, a large amount of energy is released instantaneously to produce a gas shock wave, which acts to form a crushing zone around the blasthole (Figure 12a). As the distance increases, the shock wave decays into a stress wave. Under the action of stress waves, rocks in an inelastic state are plastically deformed or even damaged, forming radial and circumferential cracks [42]. As the distance increases, the stress wave decays into a ground vibration wave, which causes the rock mass to vibrate elastically, potentially affecting the surrounding buildings. As a physical change, CO2 fracturing is mainly based on the phase-transition of liquid or solid CO2. The strong thrust generated by the CO2 phase-transition forms an initial crack around the borehole, which in turn extends and expands into the rock around the borehole under the quasi-static pressure of gas expansion, thus fracturing the rock. The CO2 phase-transition fracturing process does not result in a crushing zone similar to explosive blasting, due to the longer quasi-static action of the gas resulting in a longer duration of fluctuations. Figure 12b,c shows a typical blasting waveform and its Hilbert energy spectrum, respectively. It can be observed that the explosive blasting waveform reaches its peak much faster from the initial moment of fluctuation, reflecting the violent nature of the explosive blasting. The energy spectrum distribution shows that the energy is in a wider range of frequencies and at a higher peak frequency (above 100 Hz). When the charge is constant, the attenuation of PPV with distance conforms to a power function. However, under the same terrain and charge, the PPV caused by CO2 phase-transition fracturing is smaller than that of explosive blasting because more energy is released by explosive blasting. For PPV caused by liquid CO2 fracturing, Li et al. state that when the liquid CO2 charge is 3.2 kg, the PPV drops to 35 mm/s at 3.5 m from the borehole and below 25 mm/s at 4 m from the borehole [40]. In this paper, the PPV was reduced to 21.9 mm/s at a distance of 2.8 m when the charge of CO2 ice powder was 4 kg. It can be concluded that, in general, rock fracturing with CO2 ice powder causes less vibration than liquid CO2, although the attenuation of vibration velocity is dependent on the charge, the physical and mechanical properties of the rock and the topography. This is mainly due to the fact that more heat is consumed by CO2 ice powder fracturing the rock for gasification, the quasi-static action of the gas fracturing the rock is longer and most of the energy has been used to fracture the rock, causing less ground vibration.
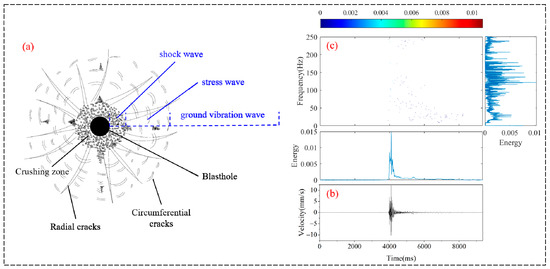
Figure 12.
Rock-fracturing principle of explosive blasting and ground vibration waveform caused: (a) rock fracturing principle, (b) ground vibration waveform, (c) Hilbert energy spectrum (source elaborated by authors).
6. Conclusions
To study the effect of the vibration induced by CO2 ice powder phase-transition fracturing on the surrounding buildings, the energy distribution of vibration signals induced by rock fracturing as well as its change as a result of distance were investigated by applying HHT. The main conclusions are drawn as follows:
(1) The Hilbert energy spectrum shows the change in the signal energy with time and instantaneous frequency. From the energy–time perspective, the energy is not regularly attenuated after the peak energy, and coda waves are developed within the distance of 13.9 m. From the energy–frequency perspective, the energy distribution of vibration signals experiences the following four change phases with the increase in distance: Propagation to a high frequency (0–13.9 m), rapid attenuation of high-frequency energy (20–30 m), energy fluctuation (30–47.2 m) and stable energy distribution (larger than 50 m). This change law increases the attenuation rate of PPV.
(2) The marginal spectrum corresponding to the Hilbert–Huang transform mainly reflects the distribution of the signal energy at different frequencies. Within a distance of 13.9 m, the distribution of the signal energy at the frequency band is increasingly dispersed with the growing distance, displaying the changes of single-peak, two-peak, multi-peak and dispersed distribution.
(3) The attenuation of the total signal energy and PPV conforms to the form of a power function. The proportion of the signal energy at the frequency band at 10–50 Hz (higher than 35%) is larger than that at the frequency band at 0–10 Hz (35%). It implies that the frequency band at 10–50 Hz is the corresponding main frequency band of the energy of vibration signals induced by rock fracturing with CO2 ice powder.
(4) The PPV induced by rock fracturing with CO2 ice powder dropped to below 25 mm/s at 2.8 m when the charge of the CO2 ice powder was 4 kg, which satisfies the standard for the permissible vibration of common buildings in China (25 mm/s). When the distance increases to 8.7 m, the proportion of the signal energy at a low frequency (0–10 Hz) shows the amplification effect. Low-frequency vibration energy results in the greatest damage to buildings, which should be paid more attention.
Author Contributions
B.L.: Methodology, software, formal analysis, writing—original draft preparation. E.W.: Conceptualization, resources, funding acquisition. S.H.: Funding acquisition, project administration, supervision. A.M.: Investigation, writing—reviewing and editing. All authors have read and agreed to the published version of the manuscript.
Funding
This research was funded by the Key Program of National Natural Science Foundation of China (Grant No. 51934007), the Major Scientific and Technological Innovation Program in Shandong Province (Grant No. 2019JZZY020505), a Project Funded by the Priority Academic Program Development of Jiangsu Higher Education Institutions (Grant No. PAPD), the Open Fund Project of State Key Laboratory (Grant No. HKLBEF202004) and the Natural Science Foundation of Jiangsu Province (Grant No. BK20201313).
Data Availability Statement
Not applicable.
Acknowledgments
The authors would like to thank the reviewers and editors who presented critical and constructive comments for the improvement of this paper.
Conflicts of Interest
The authors declare that they have no known competing financial interests or personal relationships that could have appeared to influence the work reported in this paper.
References
- Zhou, S.; Jiang, N.; He, X.; Luo, X. Rock breaking and dynamic response characteristics of carbon dioxide phase transition fracturing considering the gathering energy effect. Energies 2020, 13, 1336. [Google Scholar] [CrossRef]
- Zhou, W.; Li, Z.; Wu, X.; Wang, S.; Lv, Y.; Lou, X.; Du, C.; Liang, R. A novel method to evaluate the effect of slope blasting under impact loading. Shock Vib. 2020, 2020, 6029190. [Google Scholar] [CrossRef]
- Khandelwal, M.; Singh, T.N. Prediction of blast-induced ground vibration using artificial neural network. Int. J. Rock Mech. Min. 2009, 46, 1214–1222. [Google Scholar] [CrossRef]
- Liu, S.; Li, X.; Wang, D.; Zhang, D. Experimental study on temperature response of different ranks of coal to liquid nitrogen soaking. Nat. Resour. Res. 2021, 32, 1467–1480. [Google Scholar] [CrossRef]
- Armaghani, D.J.; Hajihassani, M.; Mohamad, E.T.; Marto, A.; Noorani, S.A. Blasting-induced flyrock and ground vibration prediction through an expert artificial neural network based on particle swarm optimization. Arab. J. Geosci. 2014, 7, 5383–5396. [Google Scholar] [CrossRef]
- Monjezi, M.; Hasanipanah, M.; Khandelwal, M. Evaluation and prediction of blast-induced ground vibration at Shur River Dam, Iran, by artificial neural network. Neural Comput. Appl. 2013, 22, 1637–1643. [Google Scholar] [CrossRef]
- Liu, S.J.; Huang, Z.H. Feasibility study on the application of carbon dioxide phase change fracturing technology in a foundation pit of an open cut tunnel. Vibroeng. Procedia 2019, 29, 295–300. [Google Scholar] [CrossRef]
- Genet, M.; Yan, W.Y.; Tran-Cong, T. Investigation of a hydraulic impact: A technology in rock breaking. Arch. Appl. Mech. 2009, 79, 825–841. [Google Scholar] [CrossRef]
- Zhang, Y.; Deng, J.; Ke, B.; Deng, H.; Li, J. Experimental study on explosion pressure and rock breaking characteristics under liquid carbon dioxide blasting. Adv. Civ. Eng. 2018, 4, 7840125. [Google Scholar] [CrossRef]
- Li, M.; Ni, H.; Xiao, C.; Wang, R. Influences of supercritical carbon dioxide jets on damage mechanisms of rock. Arab. J. Sci. Eng. 2018, 43, 2641–2658. [Google Scholar] [CrossRef]
- Gao, F.; Tang, L.; Zhou, K.; Zhang, Y.; Ke, B. Mechanism analysis of liquid carbon dioxide phase transition for fracturing rock masses. Energies 2018, 11, 2909. [Google Scholar] [CrossRef]
- Hu, S.; Pang, S.; Yan, Z. A new dynamic fracturing method: Deflagration fracturing technology with carbon dioxide. Int. J. Fract. 2019, 220, 99–111. [Google Scholar] [CrossRef]
- Yan, Z.; Hu, S.B.; Bian, Y.; Pang, S.; Wang, Q. Experimental study on the mass ratio of dry ice power pneumatic fracturing concrete. Eng. Blasting 2019, 5, 14–18. [Google Scholar]
- Khandelwal, M.; Singh, T.N. Prediction of blast induced ground vibrations and frequency in opencast mine: A neural network approach. J. Sound Vib. 2006, 289, 711–725. [Google Scholar] [CrossRef]
- Wang, Z.W.; Li, X.B.; Peng, K.; Xie, J.F. Impact of blasting parameters on vibration signal spectrum: Determination and statistical evidence. Tunn. Undergr. Space Technol. 2015, 48, 94–100. [Google Scholar] [CrossRef]
- Nateghi, R.; Goshtasbi, K.; Nejati, H.R. Prediction of shear strain induced by blasting waves in surface structures based on coupled frequency, velocity, and displacement effects. J. Vib. Control 2020, 27, 971–984. [Google Scholar] [CrossRef]
- Grigoryan, A.M.; Jenkinson, J.; Agaian, S.S. Quaternion Fourier transform based alpha-rooting method for color image measurement and enhancement. Signal Process. 2015, 109, 269–289. [Google Scholar] [CrossRef]
- Kim, H.S.; Park, H.W. Wavelet-based moving-picture coding using shift-invariant motion estimation in wavelet domain. Signal Process. 2001, 16, 669–679. [Google Scholar] [CrossRef]
- Das, S.; Gupta, V.K. A wavelet-based parametric characterization of temporal features of earthquake accelerograms. Eng. Struct. 2011, 33, 2173–2185. [Google Scholar] [CrossRef]
- Majak, J.; Shvartsman, B.S.; Kirs, M.; Pohlak, M.; Herranen, H. Convergence theorem for the Haar wavelet based discretization method. Compos. Struct. 2015, 126, 227–232. [Google Scholar] [CrossRef]
- Li, N.; Li, B.; Chen, D.; Wang, E.; Tan, Y.; Qian, J.; Jia, H. Waveform characteristics of earthquakes induced by hydraulic fracturing and mining activities: Comparison with those of natural earthquakes. Nat. Resour. Res. 2020, 29, 3653–3674. [Google Scholar] [CrossRef]
- Choi, H.I.; Williams, W.J. Improved time-frequency representation of multicomponent signals using exponential kernels. IEEE Trans. Acoust. Speech Signal Process. 1989, 37, 862–871. [Google Scholar] [CrossRef]
- Li, N.; Li, B.; Chen, D.; Wang, E.; Tan, Y.; Qian, J.; Jia, H. Discrimination of different blasting and mine microseismic waveforms using FFT, SPWVD and multifractal method. Environ. Earth Sci. 2021, 80, 36. [Google Scholar] [CrossRef]
- Huang, N.E.; Shen, Z.; Long, S.R.; Wu, M.C.; Shih, H.H.; Zheng, Q.; Yen, N.C.; Tung, C.C.; Liu, H.H. The empirical mode decomposition method and the Hilbert spectrum for non-stationary time series analysis 1998. Proc. R. Soc. Lond. Ser. A 1971, 458, 903–905. [Google Scholar] [CrossRef]
- Huang, N.E.; Shen, Z.; Long, S.R. A new view of nonlinear water waves: The Hilbert spectrum. Annu. Rev. Fluid Mech. 1999, 31, 417–457. [Google Scholar] [CrossRef]
- Li, X.; Li, Z.; Wang, E.; Feng, J.; Kong, X.; Chen, L.; Li, B.; Li, N. Analysis of natural mineral earthquake and blast based on Hilbert-Huang transform (HHT). J. Appl. Geophys. 2016, 128, 79–86. [Google Scholar] [CrossRef]
- Ling, T.H.; Li, X.B.; Dai, T.G.; Peng, Z.B. Features of energy distribution for blast vibration signals based on wavelet packet decomposition. J. Cent. South Univ. Technol. 2005, 12, 135–140. [Google Scholar] [CrossRef]
- Zhong, G.S.; Ao, L.P.; Zhao, K. Influence of explosion parameters on wavelet packet frequency band energy distribution of blast vibration. J. Cent. South Univ. 2012, 19, 2674–2680. [Google Scholar] [CrossRef]
- Huang, D.; Cui, S.; Li, X. Wavelet packet analysis of blasting vibration signal of mountain tunnel. Soil Dyn. Earthq. Eng. 2019, 117, 72–80. [Google Scholar] [CrossRef]
- Chen, G.; Li, Q.Y.; Li, D.Q.; Wu, Z.Y.; Liu, Y. Main frequency band of blast vibration signal based on wavelet packet transform. Appl. Math. Model. 2019, 74, 569–585. [Google Scholar] [CrossRef]
- Li, X.; Wang, E.; Li, Z.; Bie, X.; Chen, L.; Feng, J.; Li, N. Blasting wave pattern recognition based on Hilbert-Huang transform. Geomech. Eng. 2016, 11, 607–624. [Google Scholar] [CrossRef]
- Li, X.L.; Chen, S.J.; Liu, S.M.; Li, Z.H. AE waveform characteristics of rock mass under uniaxial loading based on Hilbert-Huang transform. J. Cent. South Univ. 2021, 28, 1843–1856. [Google Scholar] [CrossRef]
- Li, L.; Wang, F.; Shang, F.; Jia, Y.; Zhao, C.; Kong, D. Energy spectrum analysis of blast waves based on an improved Hilbert-Huang transform. Shock Waves 2016, 27, 487–494. [Google Scholar] [CrossRef]
- Yuan, H.; Liu, X.; Liu, Y.; Bian, H.; Chen, W.; Wang, Y. Analysis of acoustic wave frequency spectrum characters of rock mass under blasting damage based on the HHT method. Adv. Civ. Eng. 2018, 2018, 9207476. [Google Scholar] [CrossRef]
- Chen, L.; Chen, J.; Luo, Y.; Guo, Y.; Mu, Y.; Zhong, D.; Liu, W.; Yang, T.; Chen, W. Propagation laws of blasting seismic waves in weak rock mass: A case study of Muzhailing tunnel. Adv. Civ. Eng. 2020, 2020, 8818442. [Google Scholar] [CrossRef]
- Zhao, Y.; Shan, R.L.; Wang, H.L. Research on vibration effect of tunnel blasting based on an improved Hilbert-Huang transform. Environ. Earth Sci. 2021, 80, 206. [Google Scholar] [CrossRef]
- Yu, C.; Yue, H.; Li, H.; Xia, X.; Liu, B. Scale model test study of influence of joints on blasting vibration attenuation. Bull. Eng. Geol. Environ. 2020, 80, 533–550. [Google Scholar] [CrossRef]
- Chen, G.; Li, Q.Y.; Liu, X.X.; Wu, Z.Y.; Ma, J. Research on energy distribution characters about liquid CO2 phase-transition broken rock vibration signal. Blasting 2018, 35, 155–163. [Google Scholar]
- Liu, X.X.; Li, Q.Y.; Feng, G.W.; Chen, G.; Xie, X. Vibrational energy distribution of rock broken by phase transition of liquid carbon dioxide. Min. Metall. Eng. 2018, 38, 5–10. [Google Scholar]
- Li, Q.Y.; Chen, G.; Luo, D.Y.; Ma, H.P.; Liu, Y. An experimental study of a novel liquid carbon dioxide rock-breaking technology. Int. J. Rock Mech. Min. 2020, 128, 104244. [Google Scholar] [CrossRef]
- Ayenu-Prah, A.; Attoh-Okine, N. A criterion for selecting relevant intrinsic mode functions in empirical mode decomposition. Adv. Adapt. Data Anal. 2010, 2, 1–24. [Google Scholar] [CrossRef]
- Tao, M.; Zhao, H.T.; Li, X.B.; Ma, A. Comprehensive comparative analysis of liquid CO2 phase change fracturing and explosive rock fracturing. Blasting 2018, 35, 41–49. [Google Scholar]


Publisher’s Note: MDPI stays neutral with regard to jurisdictional claims in published maps and institutional affiliations. |
© 2022 by the authors. Licensee MDPI, Basel, Switzerland. This article is an open access article distributed under the terms and conditions of the Creative Commons Attribution (CC BY) license (https://creativecommons.org/licenses/by/4.0/).