
Geochemistry and Petrogenesis of Shoshonitic Dyke Swarm in the Northeast of Meshkinshahr, NW Iran


Abstract
:1. Introduction
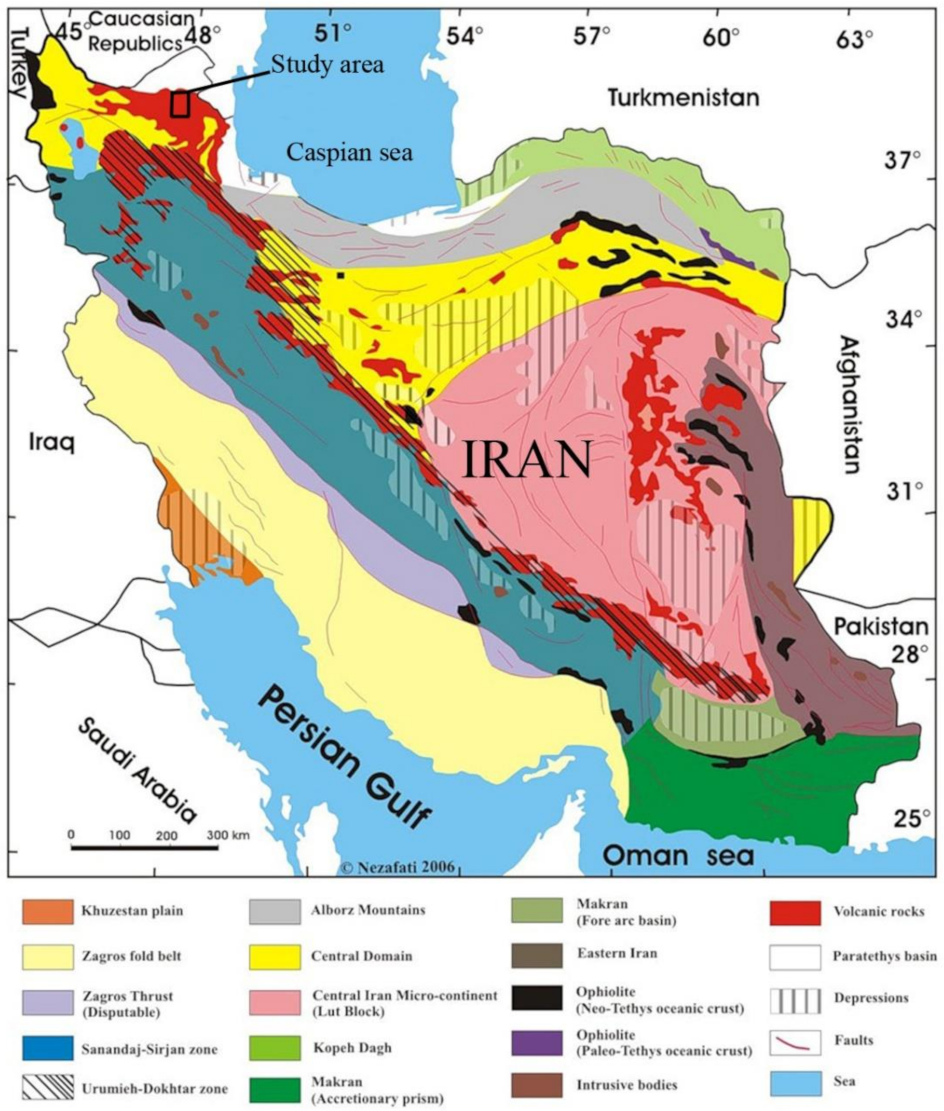
Geological Setting
2. Materials and Methods
3. Results
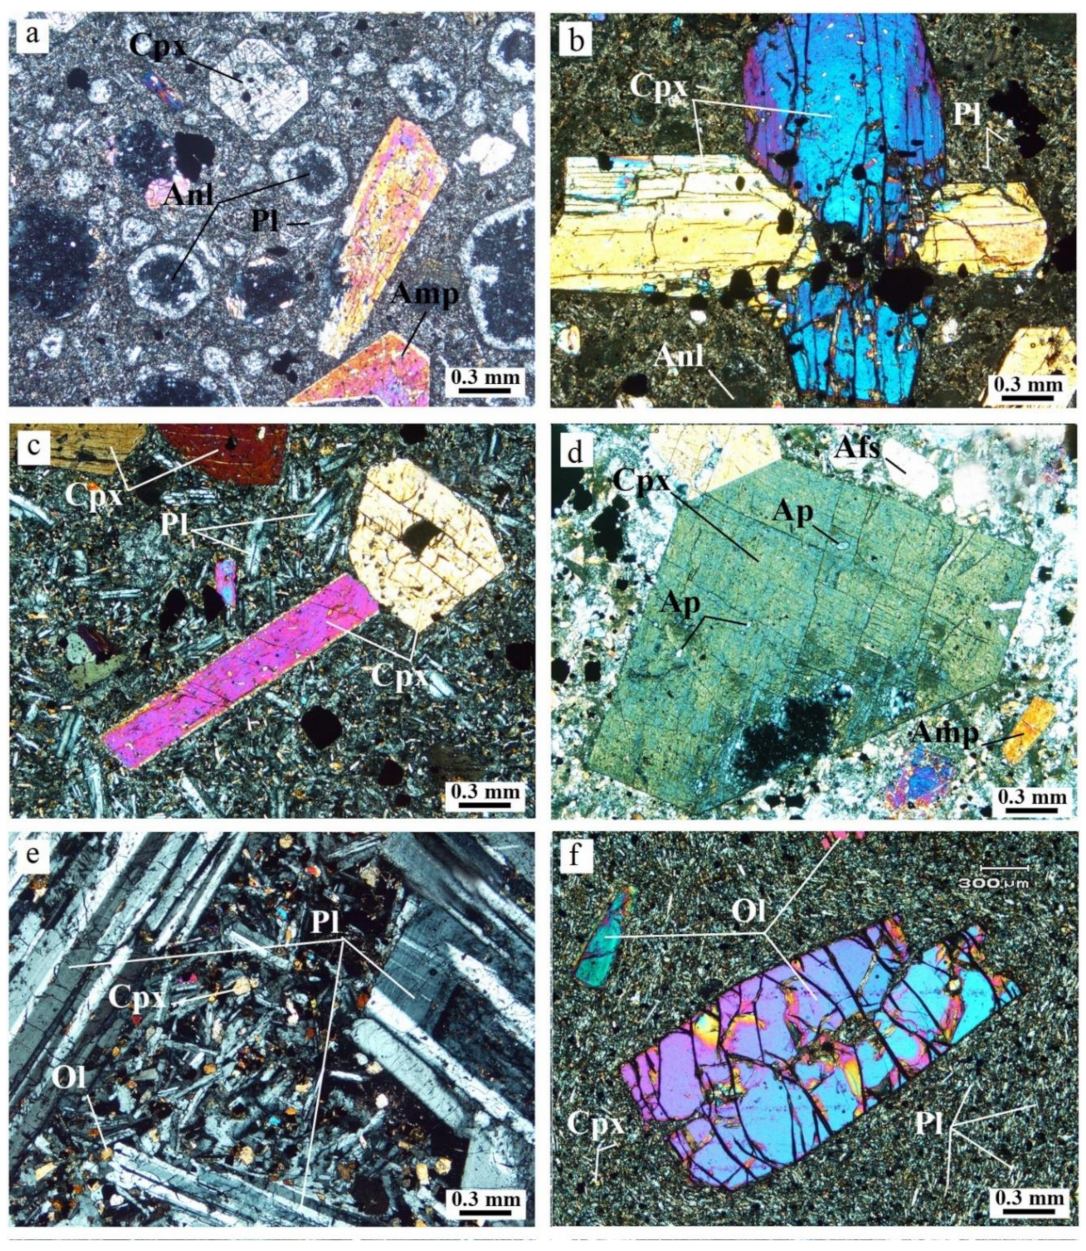
3.1. Petrographic Description
3.1.1. The Tephritic Dykes
3.1.2. The Andesitic Dykes
3.1.3. The Basaltic and Basaltic-Andesitic Dykes
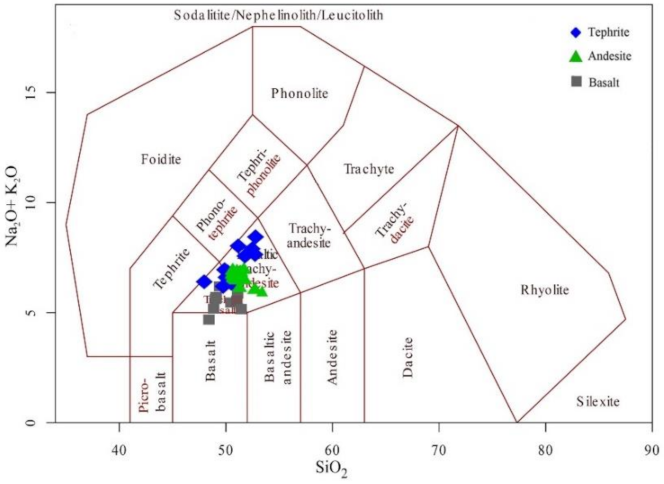
3.2. Geochemistry
3.2.1. Major Elements
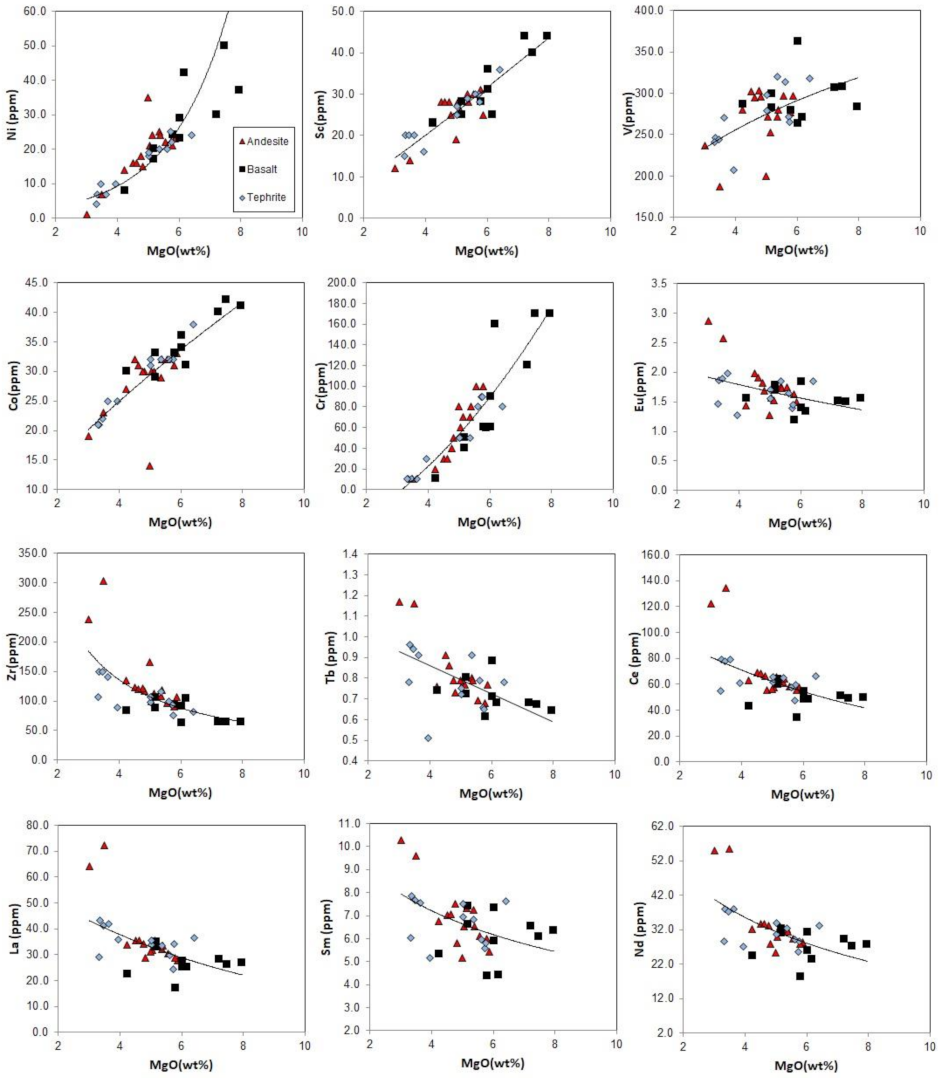
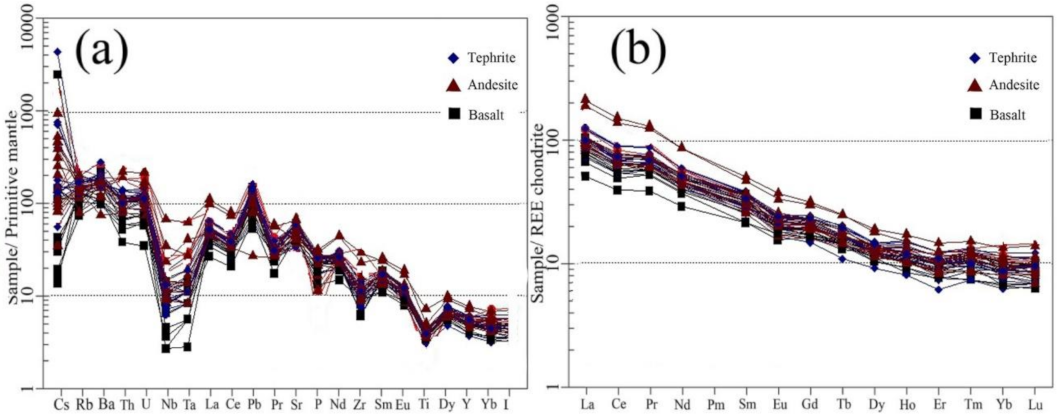
3.2.2. Trace Elements
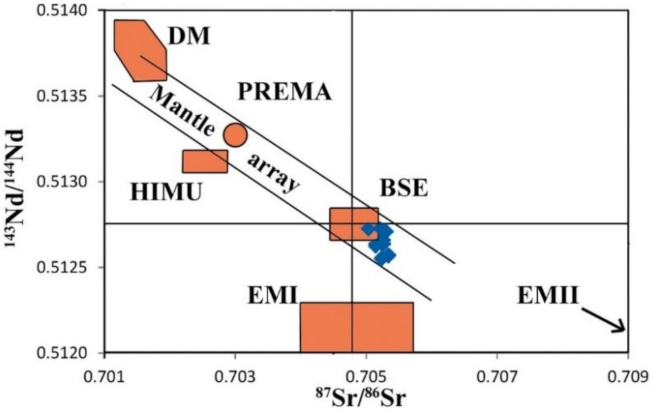
3.2.3. Sr–Nd Isotope Geochemistry
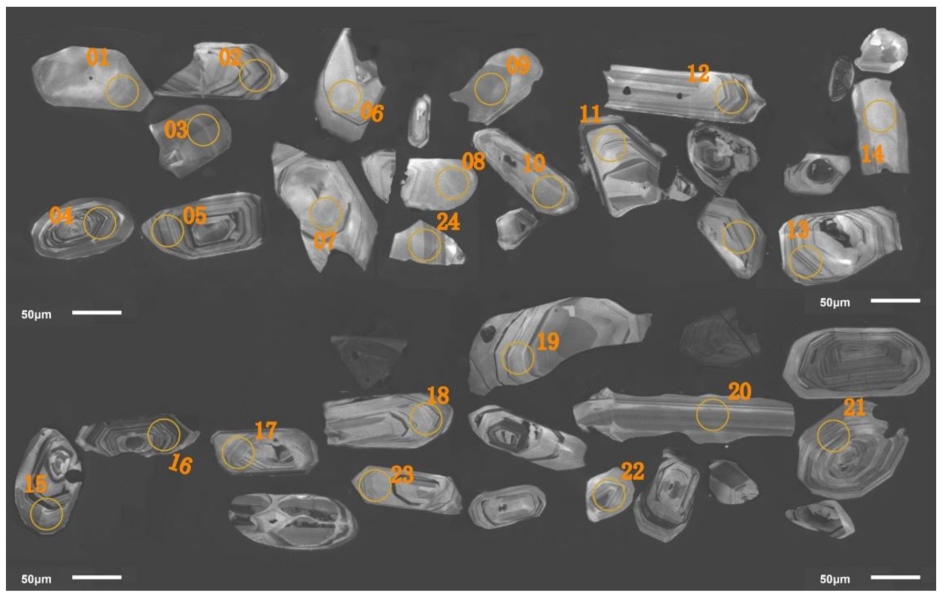
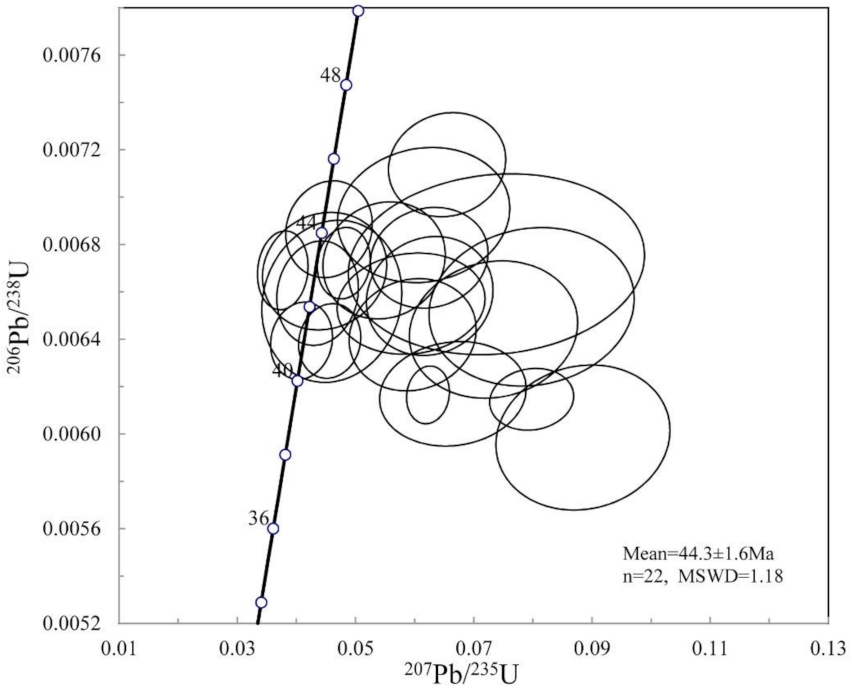
3.2.4. Zircon U–Pb Isotopic Dating
4. Discussion
4.1. Partial Melting
4.2. Fractional Crystallization
4.3. Geodynamic Implications
5. Conclusions
Author Contributions
Funding
Data Availability Statement
Acknowledgments
Conflicts of Interest
References
- Bleeker, W.; Ernst, R. Short-lived mantle generated magmatic events and their dyke swarms: The key unlocking Earth’s paleogeographic record back to 2.6 Ga. In Dyke Swarms—Time Markers of Crustal Evolution, Proceedings of the Fifth International Conference, IDC-5, Rovaniemi, Finland, 31 July–3 August 2005; Hanski, E., Mertanen, S., Rämö, T., Vuollo, J., Eds.; Taylor & Francis: Boca Raton, FL, USA, 2006; pp. 1–24. ISBN 0-415-39899-1. [Google Scholar]
- Halls, H.C. The Importance and Potential of Mafic Dyke Swarms in Studies of Geodynamic Processes. Geosci. Can. 1982, 9, 3. [Google Scholar]
- Srivastava, R.K. Dyke Swarms: Keys for Geodynamic Interpretation; Springer: Berlin/Heidelberg, Germany, 2011. [Google Scholar] [CrossRef]
- Joplin, G.A. The problem of the potash-rich basaltic rocks. Miner. Mag. J. Miner. Soc. 1965, 34, 266–275. [Google Scholar] [CrossRef]
- Keller, J. Petrology of some volcanic rock series of the Aeolian arc, Southern Tyrrhenian Sea: Calc-alkaline and shoshonitic associations. Contrib. Miner. Pet. 1974, 46, 29–47. [Google Scholar] [CrossRef]
- Peccerillo, A.; Taylor, S.R. Geochemistry of eocene calc-alkaline volcanic rocks from the Kastamonu area, Northern Turkey. Contrib. Miner. Petrol. 1976, 58, 63–81. [Google Scholar] [CrossRef]
- Morrison, G.W. Characteristics and tectonic setting of the shoshonite rock association. Lithos 1980, 13, 97–108. [Google Scholar] [CrossRef]
- Peccerillo, A. Potassic and ultrapotassic rocks: Compositional characteristics, petrogenesis, and geologic significance. Episodes 1992, 15, 243–251. [Google Scholar] [CrossRef]
- Müller, D.; Groves, D.I. Potassic Igneous Rocks and Associated Gold-Copper Mineralization, 3rd ed.; Springer: Berlin/Heidelberg, Germany, 1997. [Google Scholar]
- Campbell, I.H.; Stepanov, A.S.; Liang, H.-Y.; Allen, C.M.; Norman, M.; Zhang, Y.-Q.; Xie, Y.-W. The origin of shoshonites: New insights from the Tertiary high-potassium intrusions of eastern Tibet. Contrib. Miner. Pet. 2014, 167, 1–22. [Google Scholar] [CrossRef]
- Jiang, Y.-H.; Jiang, S.-Y.; Ling, H.-F.; Zhou, X.-R.; Rui, X.-J.; Yang, W.-Z. Petrology and geochemistry of shoshonitic plutons from the western Kunlun orogenic belt, Xinjiang, northwestern China: Implications for granitoid geneses. Lithos 2002, 63, 165–187. [Google Scholar] [CrossRef]
- Küster, D.; Harms, U. Post-collisional potassic granitoids from the southern and northwestern parts of the Late Neoproterozoic East African Orogen: A review. Lithos 1998, 45, 177–195. [Google Scholar] [CrossRef]
- Wyllie, P.J.; Sekine, T. The formation of mantle phlogopite in subduction zone hybridization. Contrib. Miner. Pet. 1982, 79, 375–380. [Google Scholar] [CrossRef]
- Topuz, G.; Okay, A.; Altherr, R.; Schwarz, W.H.; Siebel, W.; Zack, T.; Satır, M.; Şen, C. Post-collisional adakite-like magmatism in the Ağvanis Massif and implications for the evolution of the Eocene magmatism in the Eastern Pontides (NE Turkey). Lithos 2011, 125, 131–150. [Google Scholar] [CrossRef]
- Stocklin, J. Structural History and Tectonics of Iran: A Review. AAPG Bull. 1968, 52, 1229–1258. [Google Scholar] [CrossRef]
- Berberian, M.; King, G.C.P. Towards a paleogeography and tectonic evolution of Iran. Can. J. Earth Sci. 1981, 18, 210–265. [Google Scholar] [CrossRef]
- McQuarrie, N.; Stock, J.M.; Verdel, C.; Wernicke, B.P. Cenozoic evolution of Neotethys and implications for the causes of plate motions. Geophys. Res. Lett. 2003, 30, 20. [Google Scholar] [CrossRef] [Green Version]
- Şengör, A.M.C. A new model for the late Palaeozoic—Mesozoic tectonic evolution of Iran and implications for Oman. Geol. Soc. London Spéc. Publ. 1990, 49, 797–831. [Google Scholar] [CrossRef]
- Amidi, S.M.; Emami, M.H.; Michel, R. Alkaline character of Eocene volcanism in the middle part of central Iran and its geodynamic situation. Geol. Rundsch. 1984, 73, 917–932. [Google Scholar] [CrossRef]
- Verdel, C.; Wernicke, B.P.; Hassanzadeh, J.; Guest, B. A Paleogene extensional arc flare-up in Iran. Tectonics 2011, 30, 1–20. [Google Scholar] [CrossRef] [Green Version]
- Agard, P.; Omrani, J.; Jolivet, L.; Whitechurch, H.; Vrielynck, B.; Spakman, W.; Monié, P.; Meyer, B.; Wortel, R. Zagros orogeny: A subduction-dominated process. Geol. Mag. 2011, 148, 692–725. [Google Scholar] [CrossRef] [Green Version]
- Aftabi, A.; Atapour, H. Regional aspects of shoshonitic volcanism in Iran. Episodes 2000, 23, 119–125. [Google Scholar]
- Alberti, A.; Comin-Chiaramonti, P.; Di Battistini, G.; Fioriti, R.; Sinigei, S. Crystal Fractionation in the eastern Azerbaijan (Iran) Lower Tertiary shoshonitic suite. Neues Jahrbuch für Mineral. Monatshefte 1981, 1, 35–48. [Google Scholar]
- Comin-Chiaramonti, P.; Meriani, S.; Mosca, R.; Sinigoi, S. On the occurrence of analcime in the northeastern Azerbaijan volcanics (northwestern Iran). Lithos 1979, 12, 187–198. [Google Scholar] [CrossRef]
- Dilek, Y.; Imamverdiyev, N.; Şafak, A. Geochemistry and tectonics of Cenozoic volcanism in the Lesser Caucasus (Azerbaijan) and the peri-Arabian region: Collision-induced mantle dynamics and its magmatic fingerprint. Int. Geol. Rev. 2009, 52, 536–578. [Google Scholar] [CrossRef]
- Haghipour, A.; Aghanabati, A. Geological Map of Iran (Scale 1:2,500,000); Geological Survey of Iran: Tehran, Iran, 1985. [Google Scholar]
- Lescuyer, J.L.; Riou, R. Géologie de la Région de Mianeh (Azerbaijan): Contribution à L’étude du Volcanisme Tertiaire de L’Iran; Université Scientifique et Médicale de Grenoble: Grenoble, France, 1976. [Google Scholar]
- Lotfi, M. Geology and Petrology of Mianeh, Azerbaijan Area; Tehran University: Tehran, Iran, 1975. [Google Scholar]
- Sauter, D.; Cannat, M.; Rouméjon, S.; Andreani, M.; Birot, D.; Bronner, A.; Brunelli, D.; Carlut, J.; Delacour, A.; Guyader, V.; et al. Continuous exhumation of mantle-derived rocks at the Southwest Indian Ridge for 11 million years. Nat. Geosci. 2013, 6, 314–320. [Google Scholar] [CrossRef] [Green Version]
- Whitechurch, H.; Omrani, J.; Agard, P.; Humbert, F.; Montigny, R.; Jolivet, L. Evidence for Paleocene–Eocene evolution of the foot of the Eurasian margin (Kermanshah ophiolite, SW Iran) from back-arc to arc: Implications for regional geodynamics and obduction. Lithos 2013, 182–183, 11–32. [Google Scholar] [CrossRef] [Green Version]
- Dhont, D.; Chorowicz, J. Review of the neotectonics of the Eastern Turkish–Armenian Plateau by geomorphic analysis of digital elevation model imagery. Geol. Rundsch. 2005, 95, 34–49. [Google Scholar] [CrossRef]
- Dilek, Y.; Şafak, A. Geochemical and temporal evolution of Cenozoic magmatism in western Turkey: Mantle response to collision, slab break-off, and lithospheric tearing in an orogenic belt. Geol. Soc. Lond. Spéc. Publ. 2009, 311, 213–233. [Google Scholar] [CrossRef]
- Keskin, M. Magma generation by slab steepening and breakoff beneath a subduction-accretion complex: An alternative model for collision-related volcanism in Eastern Anatolia, Turkey. Geophys. Res. Lett. 2003, 30, 7–10. [Google Scholar] [CrossRef]
- Kheirkhah, M.; Allen, M.; Emami, M. Quaternary syn-collision magmatism from the Iran/Turkey borderlands. J. Volcanol. Geotherm. Res. 2009, 182, 1–12. [Google Scholar] [CrossRef] [Green Version]
- Pearce, J.; Bender, J.; de Long, S.; Kidd, W.; Low, P.; Güner, Y.; Saroglu, F.; Yilmaz, Y.; Moorbath, S.; Mitchell, J. Genesis of collision volcanism in Eastern Anatolia, Turkey. J. Volcanol. Geotherm. Res. 1990, 44, 189–229. [Google Scholar] [CrossRef]
- Riou, R.; Dupuy, C.; Dostal, J. Geochemistry of coexisting alkaline and calc-alkaline volcanic rocks from northern Azerbaijan (N.W. Iran). J. Volcanol. Geotherm. Res. 1981, 11, 253–275. [Google Scholar] [CrossRef]
- Göçmengil, G.; Karacik, Z.; Genç, Ş.C.; Billor, M.Z. 40Ar-39Ar geochronology and petrogenesis of postcollisional trachytic volcanism along the İzmir-Ankara-Erzincan Suture Zone (NE, Turkey)*. Turk. J. Earth Sci. 2018, 27, 1–31. [Google Scholar] [CrossRef]
- Emami, M.H. Geologie de la Region de Qom. Aran (Iran) Contribution an I’etude Dynamique Etgeochemique du Volcanisme Tertiaire I’Iran Central. Earth Grenoble 1981, 21, 489. [Google Scholar]
- Ghasemi-Barghi, A.; Vosoughi–Abedini, M.; Pourmoafee, M. Petrography, Geochemistry and geodynamic of moradloo dikes, Northwest of Ardebil (NW Iran). Geosciences 2006, 16, 92–107. [Google Scholar]
- Hassanzadeh, J. Metallogenic and Tectonomagmatic Events in the SE Sector of Cenozoic Active Continental Margin of Central Iran (Shahr-e Babak Area, Kerman Province); University of California: Los Angeles, CA, USA, 1993. [Google Scholar]
- Moradian, A. Petrological and Economical Evaluation of Feldspathoidal Rocks of Northern Shahr-e Babak, Kerman. Master’s Thesis, Tehran University, Tehran, Iran, 1990. [Google Scholar]
- Aftabi, A.; Atapour, H. Geochemical and petrological characteristics of shoshonitic and potassic calcalkaline magmatism at Sarcheshmeh and Dehsiahan porphyry copper deposits, Kerman, Iran. Res. Bull. Isfahan Univ. 1997, 9, 127–156. [Google Scholar]
- Atapour, H. Petrology and Geochemistry of Shoshonitic Association of Goud-e-Biabani Bardsir Area, Kerman Province. Master’s Thesis, Shahid Bahonar University of Kerman, Kerman, Iran, 1994. (In Persian). [Google Scholar]
- Fadaeian, M.; Jahangiri, A.; Moayyed, M. Mineral chemistry, thermobarometry and genesis of Clinopyroxenes in dyke swarm of northeast of meshkinshahr, NW Iran. Journal of Geoscience 2016, 25, 19–36. [Google Scholar] [CrossRef]
- Stöcklin, J. Structural Correlation of the Alpine Ranges between Iran and Central Asia; Memoire Hors Serie; Societe Geologique de France: Paris, France, 1977; Volume 8, pp. 333–353. [Google Scholar]
- Nabavi, M.H. An introduction to the geology of Iran. Geol. Surv. Iran 1976, 109. [Google Scholar]
- Nezafati, N. Au-Sn-W-Cu-Mineralization in the Astaneh-Sarband Area, West Central Iran including a Comparison of the Ores with Ancient Bronze Artifacts from Western Asia. Ph.D. Thesis, University of Freiberg, Freiberg, Germany, 2006. [Google Scholar]
- Alberti, A.A.; Comin-Chiaramonti, P.; Sinigoi, S.; Nicoletti, M.; Petrucciani, C. Neogene and quaternary volcanism in Eastern Azerbaijan (Iran): Some K-Ar age determinations and geodynamic implications. Geol. Rundsch. 1980, 69, 216–225. [Google Scholar] [CrossRef]
- Didon, J.; Germain, Y.M. Le Sabalan, Volcan Plio-quaternaire de l’Azerbaidjan Oriental (Iran): Étude Géologique et Pétrographique de L’édifice et de son Environnement Régional. Doctoral Dissertation, Universite Scientifique et Médicale de Grenoble, Grenoble, France, 1976. [Google Scholar]
- Babakhani, A.; Khan-Nazar, H. Geological Map of Lahrud Area (1:100000); Geological Survey of Iran: Tehran, Iran, 1991. [Google Scholar]
- Alberti, A.; Battistini, G.; Nicoletti, M.; Petruciani, C.; Sinigoi, S. Geochronology of the Eastern Azerbaijan volcanic plateau (northwest Iran). Rend. Soc. Ital. Min. Petrol. 1976, 32, 579–589. [Google Scholar]
- Li, C.-F.; Li, X.-H.; Li, Q.-L.; Guo, J.-H.; Li, X.-H.; Feng, L.-J.; Chu, Z.-Y. Simultaneous Determination of 143Nd/144Nd and 147Sm/144Nd Ratios and Sm–Nd Contents from the Same Filament Loaded with Purified Sm–Nd Aliquot from Geological Samples by Isotope Dilution Thermal Ionization Mass Spectrometry. Anal. Chem. 2012, 84, 6040–6047. [Google Scholar] [CrossRef]
- Li, C.-F.; Li, X.-H.; Li, Q.; Guo, J.-H.; Li, X.-H.; Yang, Y.-H. Rapid and precise determination of Sr and Nd isotopic ratios in geological samples from the same filament loading by thermal ionization mass spectrometry employing a single-step separation scheme. Anal. Chim. Acta 2012, 727, 54–60. [Google Scholar] [CrossRef]
- Xie, L.; Zhang, Y.; Zhang, H.; Sun, J.; Wu, F. In situ simultaneous determination of trace elements, U-Pb and Lu-Hf isotopes in zircon and baddeleyite. Sci. Bull. 2008, 53, 1565–1573. [Google Scholar] [CrossRef] [Green Version]
- Andersen, T. Correction of common lead in U–Pb analyses that do not report 204Pb. Chem. Geol. 2002, 192, 59–79. [Google Scholar] [CrossRef]
- Ludwig, K.R. User’s Manual for Isoplot 3.00: A Geochronological Toolkit for Microsoft Excel; Berkeley Geochronology Center Special Publication; Berkeley Geochronology Center: Berkeley, CA, USA; pp. 238–249.
- Whitney, D.; Evans, B.W. Abbreviations for names of rock-forming minerals. Am. Miner. 2009, 95, 185–187. [Google Scholar] [CrossRef]
- Middlemost, E.A.K. Naming materials in the magma/igneous rock system. Earth-Sci. Rev. 1994, 37, 215–224. [Google Scholar] [CrossRef]
- Hastie, A.R.; Kerr, A.C.; Pearce, J.A.; Mitchell, S. Classification of Altered Volcanic Island Arc Rocks using Immobile Trace Elements: Development of the Th–Co Discrimination Diagram. J. Pet. 2007, 48, 2341–2357. [Google Scholar] [CrossRef] [Green Version]
- Pearce, J.A. Trace element characteristics of lavas from destructive plate boundaries. In Andesites: Orogenic Andesites and Related Rocks; John Wiley and Sons: Hoboken, NJ, USA, 1982. [Google Scholar]
- Pearce, J.A.; Cann, J.R. Tectonic setting of basic volcanic rocks determined using trace element analyses. Earth Planet. Sci. Lett. 1973, 19, 290–300. [Google Scholar] [CrossRef]
- Pearce, J.A.; Peate, D.W. Tectonic Implications of the Composition of Volcanic ARC Magmas. Ann. Rev. Earth Planet. Sci. 1995, 23, 251–285. [Google Scholar] [CrossRef]
- Hofmann, A.W.; Jochum, K.P. Source characteristics derived from very incompatible trace elements in Mauna Loa and Mauna Kea basalts, Hawaii Scientific Drilling Project. J. Geophys. Res. Earth Surf. 1996, 101, 11831–11839. [Google Scholar] [CrossRef]
- Zhang, Z.; Xiao, X.; Wang, J.; Wang, Y.; Kusky, T.M. Post-collisional Plio-Pleistocene shoshonitic volcanism in the western Kunlun Mountains, NW China: Geochemical constraints on mantle source characteristics and petrogenesis. J. Southeast Asian Earth Sci. 2008, 31, 379–403. [Google Scholar] [CrossRef]
- McDonough, W.F.; Sun, S.-S. The composition of the Earth. Chem. Geol. 1995, 120, 223–253. [Google Scholar] [CrossRef]
- Liew, T.C.; Hofmann, A.W. Precambrian crustal components, plutonic associations, plate environment of the Hercynian Fold Belt of central Europe: Indications from a Nd and Sr isotopic study. Contrib. Miner. Pet. 1988, 98, 129–138. [Google Scholar] [CrossRef]
- Elitok, Ö.; Özgür, N.; Drüppel, K.; Dilek, Y.; Platevoet, B.; Guillou, H.; Poisson, A.; Scaillet, S.; Satır, M.; Siebel, W.; et al. Origin and geodynamic evolution of late Cenozoic potassium-rich volcanism in the Isparta area, southwestern Turkey. Int. Geol. Rev. 2009, 52, 454–504. [Google Scholar] [CrossRef]
- Eyuboglu, Y. Late Cretaceous high-K volcanism in the eastern Pontide orogenic belt: Implications for the geodynamic evolution of NE Turkey. Int. Geol. Rev. 2009, 52, 142–186. [Google Scholar] [CrossRef]
- Lu, Y.-J.; Kerrich, R.; Cawood, P.A.; McCuaig, T.C.; Hart, C.J.; Li, Z.-X.; Hou, Z.-Q.; Bagas, L. Zircon SHRIMP U–Pb geochronology of potassic felsic intrusions in western Yunnan, SW China: Constraints on the relationship of magmatism to the Jinsha suture. Gondwana Res. 2012, 22, 737–747. [Google Scholar] [CrossRef]
- Mitchell, R.; Smith, C.; Vladykin, N. Isotopic composition of strontium and neodymium in potassic rocks of the Little Murun complex, Aldan Shield, Siberia. Lithos 1994, 32, 243–248. [Google Scholar] [CrossRef]
- Rock, N.M.S.; Groves, D.I. Geochemical discrimination between shoshonitic and potassic volcanic rocks in different tectonic settings: A pilot study. Miner. Pet. 1992, 46, 259–289. [Google Scholar] [CrossRef]
- Aldanmaz, E.; Pearce, J.; Thirlwall, M.; Mitchell, J. Petrogenetic evolution of late Cenozoic, post-collision volcanism in western Anatolia, Turkey. J. Volcanol. Geotherm. Res. 2000, 102, 67–95. [Google Scholar] [CrossRef]
- Alıcı, P.; Temel, A.; Gourgaud, A.; Kieffer, G.; Gündoğdu, M. Petrology and geochemistry of potassic rocks in the Gölcük area (Isparta, SW Turkey): Genesis of enriched alkaline magmas. J. Volcanol. Geotherm. Res. 1998, 85, 423–446. [Google Scholar] [CrossRef]
- Şafak, A.; Genc, S. Petrogenesis and time-progressive evolution of the Cenozoic continental volcanism in the Biga Peninsula, NW Anatolia (Turkey). Lithos 2008, 102, 316–340. [Google Scholar] [CrossRef]
- Şafak, A.; Dilek, Y.; Genc, S.; Sunal, G.; Gertisser, R.; Furnes, H.; Foland, K.A.; Yang, J. Spatial, temporal and geochemical evolution of Oligo–Miocene granitoid magmatism in western Anatolia, Turkey. Gondwana Res. 2012, 21, 961–986. [Google Scholar] [CrossRef]
- Ersoy, E.Y.; Helvacı, C.; Uysal, I.; Karaoğlu, Ö.; Palmer, M.R.; Dindi, F. Petrogenesis of the Miocene volcanism along the İzmir-Balıkesir Transfer Zone in western Anatolia, Turkey: Implications for origin and evolution of potassic volcanism in post-collisional areas. J. Volcanol. Geotherm. Res. 2012, 241–242, 21–38. [Google Scholar] [CrossRef]
- Ersoy, E.Y.; Helvacı, C.; Palmer, M.R. Mantle source characteristics and melting models for the early-middle Miocene mafic volcanism in Western Anatolia: Implications for enrichment processes of mantle lithosphere and origin of K-rich volcanism in post-collisional settings. J. Volcanol. Geotherm. Res. 2010, 198, 112–128. [Google Scholar] [CrossRef]
- Kirchenbaur, M.; Münker, C.; Schuth, S.; Marchev, P.; Garbe-Schönberg, D. Tectonomagmatic Constraints on the Sources of Eastern Mediterranean K-rich Lavas. J. Pet. 2011, 53, 27–65. [Google Scholar] [CrossRef]
- Gülmez, F.; Genc, S.; Prelević, D.; Tüysüz, O.; Karacik, Z.; Roden, M.F.; Billor, Z. Ultrapotassic Volcanism from the Waning Stage of the Neotethyan Subduction: A Key Study from the Izmir–Ankara–Erzincan Suture Belt, Central Northern Turkey. J. Pet. 2016, 57, 561–593. [Google Scholar] [CrossRef]
- Karacık, Z.; Yılmaz, Y.; Pearce, J.A.; Ece, Ö.I. Petrochemistry of the south Marmara granitoids, northwest Anatolia, Turkey. Geol. Rundsch. 2007, 97, 1181–1200. [Google Scholar] [CrossRef]
- Ersoy, Y.E.; Helvacı, C.; Palmer, M.R. Petrogenesis of the Neogene volcanic units in the NE–SW-trending basins in western Anatolia, Turkey. Contrib. Miner. Pet. 2012, 163, 379–401. [Google Scholar] [CrossRef]
- Moine-Vaziri, H.; Khalili Marandi, S.H.; Brousse, R. Importance doun volcanism potassique, au Miocene Superier, en Azerbaijan, Iran. Comp. R. Acad. Sci. Paris 1991, 313, 1603–1610. [Google Scholar]
- Robinson, J.C.; Wood, B.J. The depth of the spinel to garnet transition at the peridotite solidus. Earth Planet. Sci. Lett. 1998, 164, 277–284. [Google Scholar] [CrossRef]
- Niu, Y.; Hékinian, R. Spreading-rate dependence of the extent of mantle melting beneath ocean ridges. Nature 1997, 385, 326–329. [Google Scholar] [CrossRef]
- McCulloch, M.; Gamble, J. Geochemical and geodynamical constraints on subduction zone magmatism. Earth Planet. Sci. Lett. 1991, 102, 358–374. [Google Scholar] [CrossRef]
- Litasov, K.D.; Foley, S.F.; Litasov, Y.D. Magmatic modification and metasomatism of the subcontinental mantle beneath the Vitim volcanic field (East Siberia): Evidence from trace element data on pyroxenite and peridotite xenoliths from Miocene picrobasalt. Lithos 2000, 54, 83–114. [Google Scholar] [CrossRef]
- Shaw, D.M. Trace element fractionation during anatexis. Geochim. Cosmochim. Acta 1970, 34, 237–243. [Google Scholar] [CrossRef]
- McKenzie, D.; O’Nions, R.K. Partial Melt Distributions from Inversion of Rare Earth Element Concentrations. J. Pet. 1991, 32, 1021–1091. [Google Scholar] [CrossRef]
- McKenzie, D.; O’Nions, R.K. The Source Regions of Ocean Island Basalts. J. Pet. 1995, 36, 133–159. [Google Scholar] [CrossRef]
- Sun, S.-s.; McDonough, W.F. Chemical and isotopic systematics of oceanic basalts: Implications for mantle composition and processes. In Geological Society, London, Special Publications; Geological Society of London: London, UK, 1989; Volume 42, pp. 313–345. [Google Scholar] [CrossRef]
- Eyuboglu, Y.; Santosh, M.; Yi, K.; Bektaş, O.; Kwon, S. Discovery of Miocene adakitic dacite from the Eastern Pontides Belt (NE Turkey) and a revised geodynamic model for the late Cenozoic evolution of the Eastern Mediterranean region. Lithos 2012, 146-147, 218–232. [Google Scholar] [CrossRef]
- Zhilong, H.; Chongqiang, L.; Hailing, Y.; Cheng, X.; Runsheng, H.; Yunhua, X.; Bo, Z.; Wenbo, L. The geochemistry of lamprophyres in the Laowangzhai gold deposits, Yunnan Province, China: Implications for its characteristics of source region. Geochem. J. 2002, 36, 91–112. [Google Scholar] [CrossRef] [Green Version]
- Keskin, M.; Pearce, J.; Mitchell, J. Volcano-stratigraphy and geochemistry of collision-related volcanism on the Erzurum–Kars Plateau, northeastern Turkey. J. Volcanol. Geotherm. Res. 1998, 85, 355–404. [Google Scholar] [CrossRef]
- Yılmaz, Y.; Güner, Y.; Şaroğlu, F. Geology of the quaternary volcanic centres of the east Anatolia. J. Volcanol. Geotherm. Res. 1998, 85, 173–210. [Google Scholar] [CrossRef]
- Conticelli, S.; Avanzinelli, R.; Poli, G.; Braschi, E.; Giordano, G. Shift from lamproite-like to leucititic rocks: Sr–Nd–Pb isotope data from the Monte Cimino volcanic complex vs. the Vico stratovolcano, Central Italy. Chem. Geol. 2013, 353, 246–266. [Google Scholar] [CrossRef]
- Ersoy, E.Y.; Helvacı, C. FC–AFC–FCA and mixing modeler: A Microsoft® Excel© spreadsheet program for modeling geochemical differentiation of magma by crystal fractionation, crustal assimilation and mixing. Comput. Geosci. 2010, 36, 383–390. [Google Scholar] [CrossRef]
- Agard, P.; Omrani, J.; Jolivet, L.; Mouthereau, F. Convergence history across Zagros (Iran): Constraints from collisional and earlier deformation. Geol. Rundsch. 2005, 94, 401–419. [Google Scholar] [CrossRef]
- Davidson, J.P.; Turner, S.; Plank, T. Dy/Dy*: Variations Arising from Mantle Sources and Petrogenetic Processes. J. Pet. 2012, 54, 525–537. [Google Scholar] [CrossRef] [Green Version]
- Sims, K.W.W.; DePaolo, D.J.; Murrell, M.T.; Baldridge, W.S.; Goldstein, S.J.; Clague, D.A. Mechanisms of Magma Generation Beneath Hawaii and Mid-Ocean Ridges: Uranium/Thorium and Samarium/Neodymium Isotopic Evidence. Science 1995, 267, 508–512. [Google Scholar] [CrossRef] [PubMed] [Green Version]
- Sims, K.; DePaolo, D.; Murrell, M.; Baldridge, W.; Goldstein, S.; Clague, D.; Jull, M. Porosity of the melting zone and variations in the solid mantle upwelling rate beneath Hawaii: Inferences from 238U-230Th-226Ra and 235U-231Pa disequilibria. Geochim. Cosmochim. Acta 1999, 63, 4119–4138. [Google Scholar] [CrossRef]
- Beier, C.; Turner, S.; Plank, T.; White, W. A preliminary assessment of the symmetry of source composition and melting dynamics across the Azores plume. Geochem. Geophys. Geosyst. 2010, 11, 11. [Google Scholar] [CrossRef]
- Niu, Y.; Collerson, K.D.; Batiza, R.; Wendt, J.I.; Regelous, M. Origin of enriched-type mid-ocean ridge basalt at ridges far from mantle plumes: The East Pacific Rise at 11°20′N. J. Geophys. Res. Earth Surf. 1999, 104, 7067–7087. [Google Scholar] [CrossRef] [Green Version]
- Regelous, M.; Niu, Y.; Wendt, J.; Batiza, R.; Greig, A.; Collerson, K. Variations in the geochemistry of magmatism on the East Pacific Rise at 10°30′N since 800 ka. Earth Planet. Sci. Lett. 1999, 168, 45–63. [Google Scholar] [CrossRef] [Green Version]
- Turner, S.; Beier, C.; Niu, Y.; Cook, C. U-Th-Ra disequilibria and the extent of off-axis volcanism across the East Pacific Rise at 9°30′N, 10°30′N, and 11°20′N. Geochem. Geophys. Geosyst. 2011, 12. [Google Scholar] [CrossRef] [Green Version]
- Salters, V.J.M.; Stracke, A. Composition of the depleted mantle. Geochem. Geophys. Geosyst. 2004, 5, 5. [Google Scholar] [CrossRef]
- Plank, T.; Langmuir, C.H. The chemical composition of subducting sediment and its consequences for the crust and mantle. Chem. Geol. 1998, 145, 325–394. [Google Scholar] [CrossRef]
- Kinzler, R.J. Melting of Mantle Peridotite at Pressures Approaching the Spinel to Garnet Transition. Miner. Mag. 1994, 58A, 483–484. [Google Scholar] [CrossRef]
- Parat, F.; Holtz, F.; Feig, S.T. Pre-eruptive Conditions of the Huerto Andesite (Fish Canyon System, San Juan Volcanic Field, Colorado): Influence of Volatiles (C-O-H-S) on Phase Equilibria and Mineral Composition. J. Pet. 2008, 49, 911–935. [Google Scholar] [CrossRef] [Green Version]
- Sisson, T.W.; Grove, T.L. Temperatures and H2O contents of low-MgO high-alumina basalts. Contrib. Miner. Pet. 1993, 113, 167–184. [Google Scholar] [CrossRef]
- Alonso-Perez, R.; Müntener, O.; Ulmer, P. Igneous garnet and amphibole fractionation in the roots of island arcs: Experimental constraints on andesitic liquids. Contrib. Miner. Pet. 2009, 157, 541–558. [Google Scholar] [CrossRef] [Green Version]
- Pearce, J.A. Role of the Sub-Continental Lithosphere in Magma Genesis at Active Continental Margins. In Continental Basalts and Mantle Xenoliths; Hawkesworth, C.J., Norry, M.J., Eds.; Shiva Publications: Cheshire, UK, 1983; pp. 230–249. [Google Scholar]
- Eyuboglu, Y. Slab window magmatism and convergent margin tectonics. Geosci. Front. 2013, 4, 349–351. [Google Scholar] [CrossRef]
- Hawkesworth, C.J.; Hergt, J.; Ellam, R.M.; McDermott, F. Element fluxes associated with subduction related magmatism. Philos. Trans. R. Soc. Lond. Ser. A Phys. Eng. Sci. 1991, 335, 393–405. [Google Scholar] [CrossRef]
- Khedr, M.Z.; Arai, S.; Tamura, A.; Morishita, T. Clinopyroxenes in high-P metaperidotites from Happo-O’ne, central Japan: Implications for wedge-transversal chemical change of slab-derived fluids. Lithos 2010, 119, 439–456. [Google Scholar] [CrossRef]
- Pearce, J.A.; Parkinson, I.J. Trace element models for mantle melting: Application to volcanic arc petrogenesis. Geol. Soc. London, Spéc. Publ. 1993, 76, 373–403. [Google Scholar] [CrossRef]
- DePaolo, D.J. Trace element and isotopic effects of combined wallrock assimilation and fractional crystallization. Earth Planet. Sci. Lett. 1981, 53, 189–202. [Google Scholar] [CrossRef]
- Gorton, M.P.; Schandl, E.S. From Continents to Island Arcs: A Geochemical Index of Tectonic Setting for Arc-Related and Within-Plate Felsic to Intermediate Volcanic Rocks. Can. Miner. 2000, 38, 1065–1073. [Google Scholar] [CrossRef]
- Schandl, E.S.; Gorton, M.P. Application of High Field Strength Elements to Discriminate Tectonic Settings in Vms Environments. Econ. Geol. 2002, 97, 629–642. [Google Scholar] [CrossRef]
- Condie, K.C. High field strength element ratios in Archean basalts: A window to evolving sources of mantle plumes? Lithos 2005, 79, 491–504. [Google Scholar] [CrossRef]
- Moayyed, M. Petrologic Studies of Tertiary Volcano-Plutonic Belt in Western Alborz-Azerbaijan, with a Special Focus on Hashtchin Area, Iran. Ph.D. Thesis, Shahid Beheshti University, Tehran, Iran, 2001. [Google Scholar]
- Kamali, A.A.; Moayyed, M.; Amel, N.; Hosseinzadeh, M.R.; Mohammadiha, K.; Santos, J.F.; Brenna, M. Post-Mineralization, Cogenetic Magmatism at the Sungun Cu-Mo Porphyry Deposit (Northwest Iran): Protracted Melting and Extraction in an Arc System. Minerals 2018, 8, 588. [Google Scholar] [CrossRef] [Green Version]
- Aghazadeh, M.; Castro, A.; Omran, N.R.; Emami, M.H.; Moinvaziri, H.; Badrzadeh, Z. The gabbro (shoshonitic)–monzonite–granodiorite association of Khankandi pluton, Alborz Mountains, NW Iran. J. Southeast Asian Earth Sci. 2010, 38, 199–219. [Google Scholar] [CrossRef]
- Castro, A.; Aghazadeh, M.; Badrzadeh, Z.; Chichorro, M. Late Eocene–Oligocene post-collisional monzonitic intrusions from the Alborz magmatic belt, NW Iran. An example of monzonite magma generation from a metasomatized mantle source. Lithos 2013, 180–181, 109–127. [Google Scholar] [CrossRef]
- Moritz, R.; Rezeau, H.; Ovtcharova, M.; Tayan, R.; Melkonyan, R.; Hovakimyan, S.; Ramazanov, V.; Selby, D.; Ulianov, A.; Chiaradia, M.; et al. Long-lived, stationary magmatism and pulsed porphyry systems during Tethyan subduction to post-collision evolution in the southernmost Lesser Caucasus, Armenia and Nakhitchevan. Gondwana Res. 2016, 37, 465–503. [Google Scholar] [CrossRef] [Green Version]
- Şengör, A.M.C.; Özeren, S.; Genç, T.; Zor, E. East Anatolian high plateau as a mantle-supported, north-south shortened domal structure. Geophys. Res. Lett. 2003, 30, 30. [Google Scholar] [CrossRef] [Green Version]
- Möritz, R.; Ghazban, F.; Singer, B.S. Eocene Gold Ore Formation at Muteh, Sanandaj-Sirjan Tectonic Zone, Western Iran: A Result of Late-Stage Extension and Exhumation of Metamorphic Basement Rocks within the Zagros Orogen. Econ. Geol. 2006, 101, 1497–1524. [Google Scholar] [CrossRef]
- Verdel, C.; Wernicke, B.P.; Ramezani, J.; Hassanzadeh, J.; Renne, P.R.; Spell, T.L. Geology and thermochronology of Tertiary Cordilleran-style metamorphic core complexes in the Saghand region of central Iran. GSA Bull. 2007, 119, 961–977. [Google Scholar] [CrossRef]
- Dilek, Y.; Sandvol, E. Seismic structure, crustal architecture and tectonic evolution of the Anatolian-African Plate Boundary and the Cenozoic Orogenic Belts in the Eastern Mediterranean Region. Geol. Soc. Lond. Spéc. Publ. 2009, 327, 127–160. [Google Scholar] [CrossRef]


| Rock Type | Andesite | ||||||||||||||||
|---|---|---|---|---|---|---|---|---|---|---|---|---|---|---|---|---|---|
| Sample No. | Dy-17 | Dy-27 | Dy-38 | Dy-43 | Dy-62 | Dy68B | Dy-69 | Dy-78 | Dy-79 | Dy-83A | Dy-84 | Dy-86 | Dy-87 | Dy-88 | |||
| SiO2 | 50.20 | 49.40 | 50.40 | 49.50 | 48.90 | 49.70 | 48.80 | 48.90 | 48.60 | 48.40 | 48.90 | 48.80 | 48.90 | 49.80 | |||
| TiO2 | 0.88 | 0.68 | 0.78 | 0.76 | 0.74 | 0.84 | 0.88 | 0.76 | 0.69 | 0.70 | 0.80 | 0.81 | 0.80 | 1.41 | |||
| Al2O3 | 16.25 | 14.80 | 14.55 | 15.15 | 15.95 | 16.35 | 15.30 | 14.50 | 14.15 | 14.30 | 15.20 | 15.40 | 15.30 | 18.65 | |||
| Fe2O3 | 9.72 | 9.39 | 9.60 | 10.09 | 9.97 | 6.52 | 10.22 | 9.91 | 9.62 | 9.87 | 10.34 | 10.40 | 10.59 | 8.89 | |||
| MnO | 0.16 | 0.16 | 0.15 | 0.17 | 0.18 | 0.09 | 0.16 | 0.17 | 0.17 | 0.18 | 0.18 | 0.16 | 0.19 | 0.16 | |||
| MgO | 4.22 | 5.06 | 5.36 | 5.13 | 4.81 | 4.99 | 5.87 | 5.38 | 5.79 | 5.56 | 4.77 | 4.50 | 4.62 | 3.50 | |||
| CaO | 8.03 | 9.24 | 9.43 | 8.66 | 9.42 | 9.49 | 7.67 | 9.23 | 9.71 | 9.42 | 9.02 | 8.79 | 8.72 | 7.00 | |||
| Na2O | 3.15 | 2.62 | 2.71 | 2.65 | 2.77 | 2.76 | 2.27 | 2.48 | 2.28 | 2.45 | 3.38 | 2.77 | 2.75 | 3.91 | |||
| K2O | 4.44 | 4.74 | 4.28 | 4.84 | 4.19 | 3.44 | 4.11 | 4.51 | 4.93 | 4.79 | 3.83 | 4.73 | 4.76 | 3.35 | |||
| P2O5 | 0.43 | 0.47 | 0.47 | 0.54 | 0.44 | 0.23 | 0.34 | 0.53 | 0.53 | 0.54 | 0.52 | 0.55 | 0.56 | 0.65 | |||
| Cr2O3 | 0.01 | 0.01 | 0.01 | 0.01 | 0.01 | 0.01 | 0.01 | 0.01 | 0.01 | 0.01 | 0.01 | 0.01 | 0.01 | 0.01 | |||
| BaO | 0.14 | 0.13 | 0.11 | 0.12 | 0.12 | 0.05 | 0.09 | 0.11 | 0.12 | 0.13 | 0.13 | 0.14 | 0.12 | 0.09 | |||
| SO3 | 0.05 | 0.04 | 0.04 | 0.03 | 0.04 | 1.08 | 0.01 | 0.02 | 0.07 | 0.03 | 0.03 | 0.05 | 0.04 | 0.04 | |||
| SrO | 0.10 | 0.12 | 0.11 | 0.14 | 0.13 | 0.10 | 0.08 | 0.12 | 0.11 | 0.10 | 0.15 | 0.14 | 0.14 | 0.09 | |||
| LOI_1000 | 1.69 | 2.64 | 1.95 | 1.87 | 1.62 | 3.37 | 3.70 | 2.58 | 2.63 | 2.84 | 2.16 | 2.19 | 1.78 | 1.59 | |||
| Total | 99.47 | 99.50 | 99.95 | 99.66 | 99.29 | 99.02 | 99.51 | 99.21 | 99.41 | 99.32 | 99.42 | 99.44 | 99.28 | 99.14 | |||
| FeOt | 8.75 | 8.45 | 8.64 | 9.08 | 8.97 | 5.87 | 9.20 | 8.92 | 8.66 | 8.88 | 9.30 | 9.36 | 9.53 | 8.00 | |||
| Mg# | 46.24 | 51.63 | 52.52 | 50.18 | 48.87 | 60.26 | 53.22 | 51.82 | 54.39 | 52.74 | 47.75 | 46.16 | 46.36 | 43.82 | |||
| Na2O + K2O | 7.59 | 7.36 | 6.99 | 7.49 | 6.96 | 6.20 | 6.38 | 6.99 | 7.21 | 7.24 | 7.21 | 7.50 | 7.51 | 7.26 | |||
| Na2O/K2O | 0.71 | 0.55 | 0.63 | 0.55 | 0.66 | 0.80 | 0.55 | 0.55 | 0.46 | 0.51 | 0.88 | 0.59 | 0.58 | 1.17 | |||
| Trace | |||||||||||||||||
| Ba | 1235.00 | 1210.00 | 975.00 | 1005.00 | 1080.00 | 492.00 | 800.00 | 969.00 | 1030.00 | 1135.00 | 1140.00 | 1235.00 | 1130.00 | 783.00 | |||
| Ce | 62.70 | 57.40 | 60.80 | 65.90 | 55.20 | 56.20 | 57.30 | 64.60 | 55.20 | 58.00 | 66.60 | 68.70 | 68.50 | 134.50 | |||
| Cr | 20.00 | 60.00 | 70.00 | 70.00 | 50.00 | 80.00 | 60.00 | 80.00 | 100.00 | 100.00 | 40.00 | 30.00 | 30.00 | 10.00 | |||
| Cs | 20.30 | 1.74 | 1.94 | 10.00 | 8.29 | 0.72 | 2.10 | 2.34 | 1.70 | 4.34 | 6.72 | 11.35 | 3.00 | 9.85 | |||
| Dy | 4.90 | 4.07 | 4.65 | 4.28 | 4.05 | 4.70 | 4.61 | 4.77 | 3.89 | 4.26 | 4.67 | 4.38 | 4.70 | 6.50 | |||
| Er | 2.56 | 2.22 | 2.29 | 1.95 | 1.89 | 2.55 | 2.40 | 2.27 | 1.84 | 1.95 | 2.43 | 2.28 | 2.34 | 3.27 | |||
| Eu | 1.44 | 1.57 | 1.76 | 1.53 | 1.69 | 1.27 | 1.50 | 1.73 | 1.62 | 1.74 | 1.82 | 1.98 | 1.91 | 2.57 | |||
| Ga | 19.30 | 16.60 | 17.30 | 16.40 | 18.90 | 21.40 | 17.10 | 18.00 | 15.80 | 17.20 | 17.30 | 17.10 | 17.40 | 22.30 | |||
| Gd | 5.59 | 5.73 | 6.03 | 5.33 | 5.63 | 5.15 | 5.38 | 5.78 | 5.53 | 5.62 | 6.26 | 6.26 | 6.35 | 8.26 | |||
| Hf | 3.90 | 2.90 | 3.20 | 3.20 | 2.80 | 3.80 | 2.80 | 2.90 | 2.40 | 2.40 | 3.10 | 3.40 | 3.30 | 6.40 | |||
| Ho | 0.94 | 0.80 | 0.86 | 0.76 | 0.73 | 0.93 | 0.81 | 0.74 | 0.70 | 0.71 | 0.84 | 0.87 | 0.86 | 1.20 | |||
| La | 33.80 | 31.70 | 32.20 | 35.40 | 28.90 | 31.10 | 27.70 | 33.40 | 28.90 | 30.40 | 34.20 | 35.50 | 35.60 | 72.20 | |||
| Lu | 0.32 | 0.27 | 0.28 | 0.31 | 0.30 | 0.38 | 0.32 | 0.29 | 0.23 | 0.27 | 0.33 | 0.33 | 0.31 | 0.47 | |||
| Nb | 9.40 | 5.40 | 6.50 | 7.70 | 7.10 | 15.20 | 7.50 | 9.20 | 5.80 | 6.20 | 8.80 | 9.40 | 9.20 | 44.20 | |||
| Nd | 32.10 | 29.80 | 32.20 | 32.90 | 28.00 | 25.30 | 28.30 | 31.50 | 27.80 | 29.30 | 33.30 | 33.80 | 33.60 | 55.40 | |||
| Pr | 7.96 | 7.49 | 8.14 | 8.52 | 6.84 | 6.50 | 6.99 | 7.77 | 6.88 | 7.08 | 8.28 | 8.32 | 8.34 | 14.90 | |||
| Rb | 100.00 | 96.80 | 94.90 | 112.50 | 89.00 | 83.60 | 92.80 | 69.90 | 81.90 | 79.70 | 47.60 | 81.70 | 94.90 | 96.80 | |||
| Sm | 6.77 | 6.54 | 7.24 | 7.32 | 5.79 | 5.17 | 5.43 | 6.54 | 6.00 | 6.10 | 7.50 | 7.01 | 7.06 | 9.60 | |||
| Sn | 2.00 | 1.00 | 2.00 | 2.00 | 1.00 | 1.00 | 1.00 | 2.00 | 1.00 | 1.00 | 3.00 | 2.00 | 2.00 | 2.00 | |||
| Sr | 823.00 | 1010.00 | 946.00 | 1095.00 | 1150.00 | 942.00 | 721.00 | 1010.00 | 910.00 | 836.00 | 1350.00 | 1225.00 | 1165.00 | 809.00 | |||
| Ta | 0.70 | 0.40 | 0.60 | 0.50 | 0.40 | 1.50 | 0.40 | 0.50 | 0.30 | 0.30 | 0.50 | 0.50 | 0.50 | 2.30 | |||
| Tb | 0.76 | 0.77 | 0.80 | 0.77 | 0.73 | 0.79 | 0.77 | 0.79 | 0.68 | 0.69 | 0.79 | 0.91 | 0.86 | 1.16 | |||
| Th | 9.87 | 8.43 | 8.33 | 9.02 | 8.42 | 6.43 | 6.63 | 8.25 | 6.72 | 7.07 | 8.49 | 8.68 | 8.85 | 17.95 | |||
| Tm | 0.34 | 0.31 | 0.33 | 0.31 | 0.32 | 0.36 | 0.33 | 0.31 | 0.26 | 0.25 | 0.34 | 0.36 | 0.38 | 0.45 | |||
| U | 2.49 | 2.41 | 2.39 | 2.25 | 2.37 | 3.15 | 1.36 | 2.19 | 2.06 | 1.76 | 2.23 | 2.28 | 2.39 | 4.39 | |||
| V | 280.00 | 271.00 | 272.00 | 253.00 | 296.00 | 200.00 | 297.00 | 280.00 | 277.00 | 297.00 | 303.00 | 302.00 | 295.00 | 187.00 | |||
| W | 5.00 | 3.00 | 2.00 | 2.00 | 1.00 | 1.00 | 1.00 | 2.00 | 2.00 | 2.00 | 2.00 | 1.00 | 2.00 | 8.00 | |||
| Y | 24.20 | 19.90 | 22.70 | 20.50 | 21.30 | 24.80 | 22.60 | 22.40 | 19.00 | 20.00 | 24.20 | 24.20 | 23.40 | 32.30 | |||
| Yb | 2.30 | 1.87 | 2.24 | 2.06 | 1.78 | 2.41 | 2.00 | 1.90 | 1.73 | 1.77 | 2.22 | 2.27 | 1.97 | 2.93 | |||
| Zr | 134.00 | 99.00 | 108.00 | 113.00 | 117.00 | 165.00 | 106.00 | 119.00 | 91.00 | 97.00 | 122.00 | 123.00 | 120.00 | 303.00 | |||
| Ag | 0.25 | 0.25 | 0.25 | 0.25 | 0.25 | 0.25 | 0.25 | 0.25 | 0.25 | 0.25 | 0.25 | 0.25 | 0.25 | 0.25 | |||
| As | 5.00 | 5.00 | 6.00 | 9.00 | 83.00 | 6.00 | 7.00 | 5.00 | |||||||||
| Cd | 0.25 | 0.25 | 0.25 | 0.25 | 0.25 | 0.25 | 0.25 | 0.25 | 0.25 | 0.25 | 0.25 | 0.25 | 0.25 | 0.25 | |||
| Co | 27.00 | 30.00 | 29.00 | 30.00 | 30.00 | 14.00 | 33.00 | 32.00 | 31.00 | 32.00 | 30.00 | 32.00 | 31.00 | 23.00 | |||
| Cu | 127.00 | 129.00 | 110.00 | 125.00 | 122.00 | 30.00 | 109.00 | 120.00 | 138.00 | 138.00 | 122.00 | 126.00 | 132.00 | 97.00 | |||
| Li | 20.00 | 10.00 | 10.00 | 20.00 | 20.00 | 10.00 | 20.00 | 10.00 | 20.00 | 20.00 | 10.00 | 20.00 | 20.00 | 30.00 | |||
| Mo | 1.00 | 2.00 | 1.00 | 1.00 | 1.00 | 89.00 | 1.00 | 1.00 | 1.00 | 1.00 | 2.00 | ||||||
| Ni | 14.00 | 21.00 | 25.00 | 24.00 | 15.00 | 35.00 | 23.00 | 24.00 | 21.00 | 22.00 | 18.00 | 16.00 | 16.00 | 7.00 | |||
| Pb | 18.00 | 15.00 | 19.00 | 16.00 | 17.00 | 4.00 | 12.00 | 19.00 | 19.00 | 16.00 | 20.00 | 19.00 | 20.00 | 12.00 | |||
| Sc | 23.00 | 28.00 | 30.00 | 26.00 | 25.00 | 19.00 | 25.00 | 28.00 | 31.00 | 30.00 | 28.00 | 28.00 | 28.00 | 14.00 | |||
| Zn | 86.00 | 80.00 | 76.00 | 87.00 | 86.00 | 54.00 | 82.00 | 86.00 | 83.00 | 85.00 | 89.00 | 92.00 | 94.00 | 90.00 | |||
| Sum_REE | 162.48 | 150.54 | 159.82 | 167.34 | 141.85 | 142.81 | 143.84 | 162.39 | 141.26 | 148.14 | 169.58 | 172.97 | 172.78 | 313.41 | |||
| Dy/Dy * | 0.68 | 0.66 | 0.66 | 0.63 | 0.70 | 0.65 | 0.75 | 0.76 | 0.69 | 0.73 | 0.66 | 0.60 | 0.71 | 0.60 | |||
| Dy/Yb | 2.13 | 2.18 | 2.08 | 2.08 | 2.28 | 1.95 | 2.31 | 2.51 | 2.25 | 2.41 | 2.10 | 1.93 | 2.39 | 2.22 | |||
| Eu/Eu * | 0.72 | 0.79 | 0.82 | 0.75 | 0.91 | 0.76 | 0.85 | 0.87 | 0.87 | 0.91 | 0.82 | 0.92 | 0.88 | 0.89 | |||
| Th/Hf | 2.53 | 2.91 | 2.60 | 2.82 | 3.01 | 1.69 | 2.37 | 2.84 | 2.80 | 2.95 | 2.74 | 2.55 | 2.68 | 2.80 | |||
| (Ce/Yb)N | 6.93 | 7.81 | 6.90 | 8.14 | 7.89 | 5.93 | 7.29 | 8.65 | 8.12 | 8.33 | 7.63 | 7.70 | 8.84 | 11.68 | |||
| (La/Sm)N | 3.071 | 2.982 | 2.736 | 2.975 | 3.07 | 3.7 | 3.138 | 3.142 | 2.963 | 3.066 | 2.805 | 3.115 | 3.102 | 4.626 | |||
| (Sm/Yb)N | 3.19 | 3.79 | 3.50 | 3.85 | 3.53 | 2.32 | 2.94 | 3.73 | 3.76 | 3.74 | 3.66 | 3.35 | 3.88 | 3.55 | |||
| Rock type | Andesite | Basalt | Tephrite | ||||||||||||||
| Sample No. | Dy-93 | Dy-20 | Dy-29 | Dy-31 | Dy-39 | Dy-40 | Dy-46 | Dy-50 | Dy-61 | Dy66A | Dy-71 | Dy-9 | Dy-11 | Dy-18 | |||
| SiO2 | 49.20 | 49.20 | 48.10 | 47.10 | 46.00 | 49.20 | 46.70 | 47.20 | 47.30 | 48.60 | 50.90 | 50.70 | 51.30 | 48.10 | |||
| TiO2 | 0.98 | 0.87 | 0.75 | 0.71 | 0.70 | 0.85 | 0.65 | 0.87 | 0.67 | 0.88 | 0.89 | 0.78 | 0.78 | 0.71 | |||
| Al2O3 | 16.95 | 18.05 | 14.75 | 14.20 | 12.50 | 14.55 | 11.45 | 14.40 | 12.45 | 14.90 | 16.85 | 16.70 | 16.80 | 14.70 | |||
| Fe2O3 | 7.76 | 9.79 | 10.02 | 10.18 | 10.91 | 10.18 | 10.97 | 11.35 | 11.03 | 10.19 | 9.69 | 9.07 | 8.87 | 9.67 | |||
| MnO | 0.16 | 0.19 | 0.18 | 0.18 | 0.18 | 0.17 | 0.18 | 0.18 | 0.19 | 0.15 | 0.18 | 0.18 | 0.17 | 0.17 | |||
| MgO | 3.00 | 4.26 | 5.19 | 5.18 | 7.22 | 6.04 | 7.96 | 6.05 | 7.50 | 5.82 | 6.19 | 3.36 | 3.45 | 5.02 | |||
| CaO | 7.58 | 9.61 | 10.40 | 11.55 | 13.55 | 9.27 | 12.95 | 10.80 | 11.70 | 9.25 | 8.96 | 6.76 | 7.07 | 9.81 | |||
| Na2O | 1.62 | 2.86 | 2.21 | 1.04 | 1.18 | 2.98 | 1.82 | 2.74 | 2.16 | 2.28 | 2.78 | 3.81 | 3.52 | 2.36 | |||
| K2O | 3.86 | 2.83 | 4.47 | 5.48 | 3.40 | 3.16 | 3.42 | 3.11 | 3.81 | 3.38 | 2.59 | 4.97 | 4.98 | 4.90 | |||
| P2O5 | 0.60 | 0.44 | 0.54 | 0.55 | 0.49 | 0.34 | 0.47 | 0.55 | 0.51 | 0.27 | 0.37 | 0.49 | 0.48 | 0.52 | |||
| Cr2O3 | 0.01 | 0.01 | 0.01 | 0.01 | 0.02 | 0.01 | 0.02 | 0.01 | 0.02 | 0.01 | 0.02 | 0.01 | 0.01 | 0.01 | |||
| BaO | 0.12 | 0.07 | 0.14 | 0.15 | 0.15 | 0.09 | 0.11 | 0.08 | 0.12 | 0.09 | 0.08 | 0.11 | 0.11 | 0.14 | |||
| SO3 | 0.03 | 0.03 | 0.02 | 0.02 | 0.04 | 0.02 | 0.02 | 0.01 | 0.01 | 0.01 | 0.01 | 0.08 | 0.03 | 0.04 | |||
| SrO | 0.14 | 0.10 | 0.13 | 0.14 | 0.12 | 0.10 | 0.12 | 0.14 | 0.12 | 0.10 | 0.09 | 0.12 | 0.13 | 0.12 | |||
| LOI_1000 | 7.57 | 1.42 | 2.55 | 2.83 | 2.76 | 2.85 | 2.20 | 1.76 | 2.02 | 3.70 | 0.23 | 2.21 | 1.75 | 2.75 | |||
| Total | 99.58 | 99.73 | 99.46 | 99.32 | 99.22 | 99.81 | 99.04 | 99.25 | 99.61 | 99.63 | 99.83 | 99.35 | 99.45 | 99.02 | |||
| FeOt | 6.98 | 8.81 | 9.02 | 9.16 | 9.82 | 9.16 | 9.87 | 10.21 | 9.92 | 9.17 | 8.72 | 8.16 | 7.98 | 8.70 | |||
| Mg# | 43.37 | 46.30 | 50.64 | 50.20 | 56.73 | 54.03 | 58.97 | 51.36 | 57.39 | 53.08 | 55.86 | 42.33 | 43.52 | 50.70 | |||
| Na2O + K2O | 5.48 | 5.69 | 6.68 | 6.52 | 4.58 | 6.14 | 5.24 | 5.85 | 5.97 | 5.66 | 5.37 | 8.78 | 8.50 | 7.26 | |||
| Na2O/K2O | 0.42 | 1.01 | 0.49 | 0.19 | 0.35 | 0.94 | 0.53 | 0.88 | 0.57 | 0.67 | 1.07 | 0.77 | 0.71 | 0.48 | |||
| REE | |||||||||||||||||
| Ba | 1105.00 | 670.00 | 1265.00 | 1310.00 | 1455.00 | 733.00 | 1030.00 | 776.00 | 1065.00 | 743.00 | 655.00 | 1050.00 | 1030.00 | 1280.00 | |||
| Ce | 122.50 | 42.80 | 63.90 | 59.80 | 50.60 | 48.10 | 49.20 | 54.00 | 48.90 | 34.20 | 47.80 | 78.90 | 77.70 | 61.30 | |||
| Cr | 10.00 | 50.00 | 40.00 | 120.00 | 90.00 | 170.00 | 60.00 | 170.00 | 60.00 | 160.00 | 10.00 | 10.00 | 50.00 | ||||
| Cs | 5.41 | 0.40 | 2.34 | 0.28 | 0.33 | 0.63 | 2.99 | 3.07 | 54.10 | 0.73 | 0.90 | 16.30 | 15.30 | 96.70 | |||
| Dy | 6.09 | 4.35 | 4.40 | 4.23 | 3.93 | 4.39 | 3.80 | 4.53 | 3.55 | 4.13 | 3.77 | 4.98 | 4.99 | 4.10 | |||
| Er | 2.78 | 2.20 | 2.21 | 2.06 | 1.75 | 2.30 | 1.69 | 2.16 | 1.74 | 2.18 | 1.99 | 2.75 | 2.75 | 2.05 | |||
| Eu | 2.87 | 1.56 | 1.78 | 1.68 | 1.51 | 1.39 | 1.55 | 1.84 | 1.49 | 1.19 | 1.33 | 1.86 | 1.89 | 1.56 | |||
| Ga | 17.10 | 20.10 | 16.20 | 15.30 | 13.90 | 16.50 | 11.80 | 17.80 | 13.60 | 18.10 | 19.50 | 18.80 | 19.90 | 15.70 | |||
| Gd | 8.74 | 4.59 | 6.20 | 5.73 | 5.11 | 4.70 | 5.07 | 6.07 | 4.67 | 4.50 | 4.49 | 6.37 | 6.79 | 5.33 | |||
| Hf | 5.30 | 2.60 | 3.30 | 2.60 | 2.00 | 2.90 | 2.00 | 2.20 | 2.20 | 2.50 | 2.60 | 4.40 | 4.00 | 2.80 | |||
| Ho | 1.05 | 0.82 | 0.81 | 0.74 | 0.74 | 0.85 | 0.59 | 0.86 | 0.64 | 0.80 | 0.73 | 1.07 | 1.04 | 0.73 | |||
| La | 64.10 | 22.30 | 35.00 | 32.70 | 28.20 | 25.10 | 26.80 | 27.50 | 26.20 | 17.00 | 25.10 | 43.10 | 41.10 | 33.70 | |||
| Lu | 0.37 | 0.32 | 0.28 | 0.25 | 0.23 | 0.33 | 0.23 | 0.27 | 0.21 | 0.32 | 0.29 | 0.41 | 0.38 | 0.27 | |||
| Nb | 22.60 | 4.60 | 6.70 | 4.20 | 2.90 | 5.30 | 1.70 | 2.30 | 1.70 | 6.50 | 9.20 | 12.00 | 11.50 | 5.90 | |||
| Nd | 54.90 | 24.30 | 32.30 | 30.90 | 29.20 | 25.80 | 27.50 | 31.10 | 27.20 | 18.30 | 23.40 | 38.00 | 37.20 | 30.60 | |||
| Pr | 14.20 | 5.96 | 8.22 | 8.10 | 6.99 | 6.69 | 6.68 | 7.59 | 6.49 | 4.36 | 5.88 | 10.05 | 9.94 | 8.06 | |||
| Rb | 124.50 | 44.40 | 78.20 | 109.50 | 60.80 | 79.20 | 58.20 | 48.80 | 64.90 | 75.60 | 63.60 | 109.00 | 110.50 | 101.50 | |||
| Sm | 10.30 | 5.33 | 7.38 | 6.61 | 6.54 | 5.90 | 6.32 | 7.33 | 6.07 | 4.35 | 4.39 | 7.86 | 7.66 | 6.96 | |||
| Sn | 1.00 | 1.00 | 2.00 | 1.00 | 1.00 | 1.00 | 1.00 | 1.00 | 1.00 | 1.00 | 1.00 | 2.00 | 2.00 | 2.00 | |||
| Sr | 1320.00 | 835.00 | 1065.00 | 1105.00 | 1040.00 | 838.00 | 938.00 | 1205.00 | 958.00 | 877.00 | 793.00 | 974.00 | 1050.00 | 975.00 | |||
| Ta | 1.00 | 0.30 | 0.50 | 0.30 | 0.20 | 0.40 | 0.10 | 0.20 | 0.20 | 0.30 | 0.50 | 1.00 | 0.90 | 0.40 | |||
| Tb | 1.17 | 0.74 | 0.80 | 0.72 | 0.68 | 0.71 | 0.64 | 0.88 | 0.67 | 0.61 | 0.68 | 0.96 | 0.94 | 0.72 | |||
| Th | 15.10 | 4.68 | 8.76 | 8.09 | 6.37 | 5.59 | 5.18 | 3.03 | 5.48 | 4.75 | 4.16 | 11.40 | 11.30 | 8.51 | |||
| Tm | 0.37 | 0.35 | 0.32 | 0.30 | 0.22 | 0.37 | 0.22 | 0.30 | 0.29 | 0.33 | 0.26 | 0.38 | 0.40 | 0.28 | |||
| U | 3.44 | 1.26 | 2.01 | 2.17 | 1.52 | 1.43 | 1.57 | 0.69 | 1.54 | 1.15 | 1.24 | 2.76 | 2.52 | 2.31 | |||
| V | 237.00 | 286.00 | 282.00 | 299.00 | 306.00 | 263.00 | 283.00 | 362.00 | 307.00 | 279.00 | 270.00 | 246.00 | 244.00 | 279.00 | |||
| W | 1.00 | 1.00 | 4.00 | 2.00 | 5.00 | 1.00 | 1.00 | 1.00 | 1.00 | 1.00 | 1.00 | 3.00 | 1.00 | ||||
| Y | 30.10 | 21.90 | 21.10 | 19.90 | 17.30 | 20.80 | 16.30 | 21.10 | 16.60 | 21.40 | 20.20 | 25.30 | 25.70 | 20.40 | |||
| Yb | 2.51 | 2.26 | 1.99 | 1.88 | 1.49 | 2.05 | 1.44 | 1.75 | 1.44 | 1.94 | 1.97 | 2.67 | 2.47 | 1.87 | |||
| Zr | 238.00 | 83.00 | 105.00 | 88.00 | 64.00 | 91.00 | 64.00 | 62.00 | 64.00 | 93.00 | 103.00 | 149.00 | 150.00 | 98.00 | |||
| Ag | 0.25 | 0.25 | 0.25 | 0.25 | 0.25 | 0.25 | 0.25 | 0.25 | 0.25 | 0.25 | 0.25 | 0.25 | 0.25 | 0.25 | |||
| As | 7.00 | 7.00 | 5.00 | 8.00 | 5.00 | 6.00 | |||||||||||
| Cd | 0.25 | 0.25 | 0.25 | 0.25 | 0.25 | 0.25 | 0.25 | 0.25 | 0.25 | 0.25 | 0.25 | 0.25 | |||||
| Co | 19.00 | 30.00 | 29.00 | 33.00 | 40.00 | 34.00 | 41.00 | 36.00 | 42.00 | 33.00 | 31.00 | 21.00 | 22.00 | 31.00 | |||
| Cu | 94.00 | 127.00 | 128.00 | 158.00 | 151.00 | 92.00 | 121.00 | 36.00 | 136.00 | 90.00 | 96.00 | 90.00 | 88.00 | 139.00 | |||
| Li | 10.00 | 10.00 | 10.00 | 10.00 | 10.00 | 10.00 | 10.00 | 20.00 | 10.00 | 20.00 | 20.00 | 50.00 | |||||
| Mo | 1.00 | 2.00 | 1.00 | ||||||||||||||
| Ni | 1.00 | 8.00 | 20.00 | 17.00 | 30.00 | 29.00 | 37.00 | 23.00 | 50.00 | 24.00 | 42.00 | 7.00 | 10.00 | 18.00 | |||
| Pb | 15.00 | 16.00 | 20.00 | 20.00 | 21.00 | 11.00 | 16.00 | 8.00 | 15.00 | 10.00 | 13.00 | 19.00 | 22.00 | 21.00 | |||
| Sc | 12.00 | 23.00 | 25.00 | 28.00 | 44.00 | 31.00 | 44.00 | 36.00 | 40.00 | 28.00 | 25.00 | 20.00 | 20.00 | 27.00 | |||
| Zn | 85.00 | 95.00 | 87.00 | 86.00 | 82.00 | 81.00 | 80.00 | 85.00 | 85.00 | 78.00 | 86.00 | 99.00 | 92.00 | 84.00 | |||
| Sum_REE | 291.95 | 117.88 | 165.59 | 155.7 | 137.19 | 128.68 | 131.73 | 146.18 | 129.56 | 94.21 | 122.08 | 199.36 | 195.25 | 157.53 | |||
| Dy/Dy* | 0.65 | 0.69 | 0.66 | 0.68 | 0.78 | 0.72 | 0.78 | 0.81 | 0.73 | 0.79 | 0.64 | 0.58 | 0.62 | 0.65 | |||
| Dy/Yb | 2.43 | 1.92 | 2.21 | 2.25 | 2.64 | 2.14 | 2.64 | 2.59 | 2.47 | 2.13 | 1.91 | 1.87 | 2.02 | 2.19 | |||
| Eu/Eu* | 0.93 | 0.97 | 0.81 | 0.84 | 0.80 | 0.81 | 0.84 | 0.85 | 0.86 | 0.83 | 0.92 | 0.81 | 0.81 | 0.79 | |||
| Th/Hf | 2.85 | 1.80 | 2.65 | 3.11 | 3.19 | 1.93 | 2.59 | 1.38 | 2.49 | 1.90 | 1.60 | 2.59 | 2.83 | 3.04 | |||
| (Ce/Yb)N | 12.41 | 4.82 | 8.17 | 8.09 | 8.64 | 5.97 | 8.69 | 7.85 | 8.64 | 4.48 | 6.17 | 7.52 | 8.00 | 8.34 | |||
| (La/Sm)N | 3.828 | 2.574 | 2.917 | 3.043 | 2.652 | 2.617 | 2.609 | 2.308 | 2.655 | 2.404 | 3.517 | 3.373 | 3.301 | 2.979 | |||
| (Sm/Yb)N | 4.45 | 2.56 | 4.02 | 3.81 | 4.76 | 3.12 | 4.76 | 4.54 | 4.57 | 2.43 | 2.41 | 3.19 | 3.36 | 4.03 | |||
| Rock type | Tephrite | ||||||||||||||||
| Sample No. | Dy-24 | Dy-25C | Dy-41 | Dy-47 | Dy-49 | Dy-51 | Dy-59A | Dy-81 | Dy-88B | ||||||||
| SiO2 | 47.60 | 50.20 | 47.80 | 50.40 | 44.80 | 48.20 | 49.10 | 47.80 | 47.50 | ||||||||
| TiO2 | 0.75 | 0.74 | 0.85 | 0.77 | 0.75 | 0.66 | 0.59 | 0.74 | 0.76 | ||||||||
| Al2O3 | 15.15 | 16.90 | 14.50 | 16.50 | 13.00 | 15.05 | 17.45 | 14.45 | 14.50 | ||||||||
| Fe2O3 | 10.21 | 8.25 | 10.18 | 9.26 | 10.88 | 9.75 | 8.25 | 10.21 | 10.17 | ||||||||
| MnO | 0.18 | 0.19 | 0.15 | 0.19 | 0.19 | 0.18 | 0.16 | 0.17 | 0.18 | ||||||||
| MgO | 5.02 | 3.31 | 5.73 | 3.62 | 6.42 | 5.77 | 3.93 | 5.62 | 5.36 | ||||||||
| CaO | 9.23 | 5.86 | 9.05 | 7.99 | 11.30 | 9.80 | 7.51 | 9.11 | 10.75 | ||||||||
| Na2O | 3.70 | 4.31 | 3.41 | 3.27 | 2.04 | 2.30 | 3.33 | 2.62 | 2.57 | ||||||||
| K2O | 3.80 | 5.02 | 3.23 | 5.16 | 4.64 | 4.82 | 5.59 | 4.74 | 3.96 | ||||||||
| P2O5 | 0.55 | 0.45 | 0.34 | 0.50 | 0.57 | 0.58 | 0.55 | 0.52 | 0.53 | ||||||||
| Cr2O3 | 0.01 | 0.00 | 0.01 | 0.01 | 0.01 | 0.01 | 0.01 | 0.01 | 0.01 | ||||||||
| BaO | 0.14 | 0.12 | 0.07 | 0.13 | 0.15 | 0.15 | 0.20 | 0.11 | 0.14 | ||||||||
| SO3 | 0.03 | 0.02 | 0.01 | 0.03 | 0.09 | 0.04 | 0.05 | 0.06 | 0.02 | ||||||||
| SrO | 0.14 | 0.08 | 0.08 | 0.14 | 0.14 | 0.14 | 0.14 | 0.10 | 0.14 | ||||||||
| LOI_1000 | 2.72 | 3.89 | 4.28 | 1.10 | 4.28 | 1.86 | 2.51 | 2.80 | 2.56 | ||||||||
| Total | 99.23 | 99.34 | 99.69 | 99.07 | 99.26 | 99.31 | 99.37 | 99.06 | 99.15 | ||||||||
| FeOt | 9.19 | 7.42 | 9.16 | 8.33 | 9.79 | 8.77 | 7.42 | 9.19 | 9.15 | ||||||||
| Mg# | 49.34 | 44.28 | 52.72 | 43.64 | 53.90 | 53.97 | 48.55 | 52.16 | 51.08 | ||||||||
| Na2O + K2O | 7.50 | 9.33 | 6.64 | 8.43 | 6.68 | 7.12 | 8.92 | 7.36 | 6.53 | ||||||||
| Na2O/K2O | 0.97 | 0.86 | 1.06 | 0.63 | 0.44 | 0.48 | 0.60 | 0.55 | 0.65 | ||||||||
| Trace (ppm) | |||||||||||||||||
| Ba | 1320.00 | 1055.00 | 643.00 | 1140.00 | 1420.00 | 1425.00 | 1870.00 | 1030.00 | 1225.00 | ||||||||
| Ce | 65.40 | 55.10 | 47.10 | 78.80 | 66.30 | 59.50 | 60.70 | 57.40 | 64.90 | ||||||||
| Cr | 50.00 | 10.00 | 90.00 | 10.00 | 80.00 | 90.00 | 30.00 | 80.00 | 50.00 | ||||||||
| Cs | 3.03 | 2.32 | 1.17 | 2.65 | 3.83 | 3.04 | 8.76 | 3.35 | 2.87 | ||||||||
| Dy | 4.46 | 4.47 | 4.18 | 5.10 | 4.16 | 3.51 | 3.12 | 4.24 | 4.89 | ||||||||
| Er | 2.18 | 2.18 | 2.25 | 2.51 | 1.87 | 1.63 | 1.36 | 2.02 | 2.43 | ||||||||
| Eu | 1.70 | 1.46 | 1.39 | 1.98 | 1.85 | 1.45 | 1.28 | 1.64 | 1.85 | ||||||||
| Ga | 16.80 | 16.40 | 17.10 | 18.50 | 15.50 | 14.80 | 16.20 | 16.80 | 18.50 | ||||||||
| Gd | 5.60 | 5.31 | 4.40 | 6.36 | 5.72 | 4.76 | 4.08 | 5.85 | 6.39 | ||||||||
| Hf | 3.40 | 3.10 | 2.60 | 4.30 | 2.50 | 2.20 | 2.20 | 2.50 | 2.90 | ||||||||
| Ho | 0.77 | 0.94 | 0.78 | 0.98 | 0.70 | 0.64 | 0.56 | 0.76 | 0.83 | ||||||||
| La | 35.50 | 29.00 | 24.40 | 41.80 | 36.50 | 34.10 | 35.80 | 29.70 | 33.60 | ||||||||
| Lu | 0.28 | 0.32 | 0.31 | 0.37 | 0.24 | 0.23 | 0.22 | 0.30 | 0.32 | ||||||||
| Nb | 7.30 | 7.60 | 5.10 | 10.10 | 4.00 | 4.60 | 5.80 | 6.50 | 8.50 | ||||||||
| Nd | 33.90 | 28.60 | 25.70 | 37.90 | 33.20 | 28.70 | 27.00 | 29.10 | 32.40 | ||||||||
| Pr | 8.45 | 7.28 | 6.46 | 10.00 | 8.86 | 7.58 | 7.31 | 7.23 | 7.83 | ||||||||
| Rb | 61.60 | 94.60 | 83.00 | 120.00 | 97.70 | 104.50 | 121.50 | 77.90 | 102.50 | ||||||||
| Sm | 7.52 | 6.04 | 5.58 | 7.55 | 7.62 | 5.80 | 5.17 | 5.96 | 6.84 | ||||||||
| Sn | 1.00 | 1.00 | 1.00 | 1.00 | 1.00 | 1.00 | 2.00 | 1.00 | 1.00 | ||||||||
| Sr | 1195.00 | 661.00 | 665.00 | 1165.00 | 1240.00 | 1210.00 | 1190.00 | 860.00 | 1185.00 | ||||||||
| Ta | 0.50 | 0.60 | 0.40 | 0.70 | 0.30 | 0.30 | 0.40 | 0.30 | 0.40 | ||||||||
| Tb | 0.75 | 0.78 | 0.66 | 0.91 | 0.78 | 0.65 | 0.51 | 0.79 | 0.91 | ||||||||
| Th | 9.04 | 7.21 | 5.45 | 10.85 | 8.99 | 9.19 | 11.10 | 6.97 | 8.16 | ||||||||
| Tm | 0.31 | 0.35 | 0.33 | 0.37 | 0.26 | 0.26 | 0.22 | 0.29 | 0.30 | ||||||||
| U | 2.25 | 1.70 | 1.54 | 2.60 | 2.46 | 2.50 | 2.97 | 2.18 | 2.28 | ||||||||
| V | 298.00 | 241.00 | 271.00 | 270.00 | 318.00 | 265.00 | 207.00 | 314.00 | 320.00 | ||||||||
| W | 4.00 | 1.00 | 12.00 | 2.00 | 1.00 | 3.00 | 2.00 | 5.00 | 1.00 | ||||||||
| Y | 21.40 | 22.60 | 20.90 | 25.80 | 19.20 | 16.20 | 15.30 | 21.10 | 23.40 | ||||||||
| Yb | 2.01 | 2.12 | 2.02 | 2.36 | 1.72 | 1.57 | 1.35 | 1.82 | 1.91 | ||||||||
| Zr | 106.00 | 106.00 | 94.00 | 140.00 | 81.00 | 76.00 | 89.00 | 100.00 | 116.00 | ||||||||
| Ag | 0.25 | 0.25 | 0.25 | 0.25 | 0.25 | 0.25 | 0.25 | 0.25 | 0.25 | ||||||||
| As | 7.00 | 6.00 | 9.00 | 14.00 | 14.00 | 5.00 | |||||||||||
| Cd | 0.25 | 0.25 | 0.25 | 0.25 | 0.25 | 0.25 | 0.25 | 0.25 | 0.25 | ||||||||
| Co | 32.00 | 21.00 | 32.00 | 25.00 | 38.00 | 32.00 | 25.00 | 32.00 | 32.00 | ||||||||
| Cu | 144.00 | 81.00 | 98.00 | 102.00 | 193.00 | 181.00 | 147.00 | 137.00 | 130.00 | ||||||||
| Li | 20.00 | 10.00 | 10.00 | 10.00 | 20.00 | 20.00 | 20.00 | 20.00 | 10.00 | ||||||||
| Mo | 1.00 | 1.00 | 1.00 | 1.00 | |||||||||||||
| Ni | 19.00 | 4.00 | 25.00 | 7.00 | 24.00 | 22.00 | 10.00 | 20.00 | 20.00 | ||||||||
| Pb | 19.00 | 16.00 | 10.00 | 20.00 | 22.00 | 20.00 | 25.00 | 18.00 | 21.00 | ||||||||
| Sc | 25.00 | 15.00 | 30.00 | 20.00 | 36.00 | 28.00 | 16.00 | 30.00 | 29.00 | ||||||||
| Zn | 96.00 | 79.00 | 81.00 | 94.00 | 89.00 | 82.00 | 76.00 | 86.00 | 90.00 | ||||||||
| Sum_REE | 168.83 | 143.95 | 125.56 | 196.99 | 169.78 | 150.38 | 148.68 | 147.1 | 165.4 | ||||||||
| Dy/Dy* | 0.67 | 0.69 | 0.70 | 0.65 | 0.69 | 0.63 | 0.61 | 0.72 | 0.77 | ||||||||
| Dy/Yb | 2.22 | 2.11 | 2.07 | 2.16 | 2.42 | 2.24 | 2.31 | 2.33 | 2.56 | ||||||||
| Eu/Eu* | 0.81 | 0.79 | 0.86 | 0.88 | 0.86 | 0.85 | 0.86 | 0.85 | 0.86 | ||||||||
| Th/Hf | 2.66 | 2.33 | 2.10 | 2.52 | 3.60 | 4.18 | 5.05 | 2.79 | 2.81 | ||||||||
| (Ce/Yb)N | 8.28 | 6.61 | 5.93 | 8.49 | 9.80 | 9.64 | 11.44 | 8.02 | 8.64 | ||||||||
| (La/Sm)N | 2.904 | 2.954 | 2.69 | 3.406 | 2.947 | 3.617 | 4.26 | 3.065 | 3.022 | ||||||||
| (Sm/Yb)N | 4.05 | 3.09 | 2.99 | 3.47 | 4.80 | 4.00 | 4.15 | 3.55 | 3.88 | ||||||||
| Sample No. | Rock Type | Rb (ppm) | Sr (ppm) | 87Rb/86Sr | 87Sr/86Sr | Error (2 s) | Sm (ppm) | Nd (ppm) | 147Sm/144Nd | 143Nd/144Nd | Error (2 s) | εNd |
|---|---|---|---|---|---|---|---|---|---|---|---|---|
| Dy-22B | Basalt | 56.48 | 1029 | 0.1589 | 0.705144 | 0.000010 | 6.356 | 30.17 | 0.1275 | 0.512628 | 0.000015 | 0.03 |
| Dy-24 | Tephrite | 62.59 | 1170 | 0.1547 | 0.705250 | 0.000010 | 6.653 | 31.18 | 0.1292 | 0.512660 | 0.000012 | 0.64 |
| Dy-47 | Tephrite | 125.7 | 1165 | 0.3122 | 0.705234 | 0.000010 | 7.859 | 36.95 | 0.1288 | 0.512553 | 0.000015 | −1.46 |
| Dy-59A | Tephrite | 124.9 | 1179 | 0.3066 | 0.705295 | 0.000013 | 4.948 | 24.76 | 0.1210 | 0.512709 | 0.000014 | 1.62 |
| Dy-63B | Basalt | 18.23 | 326.8 | 0.1614 | 0.705212 | 0.000009 | 4.730 | 16.63 | 0.1722 | 0.512728 | 0.000014 | 1.84 |
| Dy-71 | Basalt | 64.48 | 743.4 | 0.2510 | 0.705250 | 0.000012 | 4.922 | 23.41 | 0.1273 | 0.512636 | 0.000012 | 0.17 |
| Dy-78 | Andesite | 70.48 | 965.1 | 0.2113 | 0.705339 | 0.000012 | 6.549 | 31.06 | 0.1276 | 0.512570 | 0.000015 | −1.11 |
| Dy-81 | Tephrite | 75.84 | 804.8 | 0.2727 | 0.705255 | 0.000012 | 6.210 | 28.68 | 0.1311 | 0.512660 | 0.000012 | 0.63 |
| Dy-88 | Andesite | 96.19 | 770.9 | 0.3611 | 0.705030 | 0.000012 | 9.92 | 54.46 | 0.1103 | 0.512725 | 0.000012 | 1.96 |
| Spot | Pb (ppm) | Th (ppm) | U (ppm) | Th/U | Isotopic Ratios | Age (Ma) | |||||||||||||
|---|---|---|---|---|---|---|---|---|---|---|---|---|---|---|---|---|---|---|---|
| 207Pb/206Pb | 1σ | 207Pb/235U | 1σ | 206Pb/238U | 1σ | 208Pb/232Th | 1σ | 238U/232Th | 207Pb/235U | 1σ | 206Pb/238U | 1σ | 208Pb/232Th | 1σ | |||||
| 35F-01 | 2.78 | 179 | 338 | 0.52 | 0.0632 | 0.0080 | 0.0548 | 0.0068 | 0.0067 | 0.0002 | 0.0027 | 0.0002 | 1.9361 | 54.2 | 6.58 | 43.3 | 1.04 | 54.3 | 3.60 |
| 35F-02 | 9.46 | 1060 | 1142 | 0.92 | 0.0474 | 0.0041 | 0.0409 | 0.0035 | 0.0064 | 0.0001 | 0.0021 | 0.0001 | 1.1169 | 40.7 | 3.37 | 41.1 | 0.69 | 41.7 | 1.45 |
| 35F-03 | 3.52 | 316 | 388 | 0.81 | 0.0698 | 0.0071 | 0.0655 | 0.0065 | 0.0071 | 0.0001 | 0.0022 | 0.0001 | 1.2555 | 64.4 | 6.24 | 45.8 | 0.92 | 45.0 | 2.30 |
| 35F-04 | 9.55 | 951 | 1105 | 0.86 | 0.0427 | 0.0036 | 0.0377 | 0.0028 | 0.0067 | 0.0001 | 0.0022 | 0.0001 | 1.2010 | 37.6 | 2.76 | 43.0 | 0.70 | 44.9 | 1.50 |
| 35F-05 | 10.56 | 960 | 1214 | 0.79 | 0.0525 | 0.0035 | 0.0480 | 0.0030 | 0.0067 | 0.0001 | 0.0023 | 0.0001 | 1.4105 | 47.6 | 2.86 | 43.2 | 0.63 | 47.3 | 1.65 |
| 35F-06 | 2.30 | 198 | 280 | 0.70 | 0.0583 | 0.0099 | 0.0460 | 0.0078 | 0.0066 | 0.0002 | 0.0023 | 0.0002 | 1.4940 | 45.7 | 7.58 | 42.2 | 1.44 | 46.4 | 3.37 |
| 35F-07 | 1.83 | 145 | 210 | 0.69 | 0.1152 | 0.0240 | 0.0798 | 0.0115 | 0.0065 | 0.0002 | 0.0026 | 0.0002 | 1.4844 | 77.9 | 10.77 | 42.0 | 1.41 | 52.9 | 4.03 |
| 35F-08 | 3.17 | 190 | 379 | 0.50 | 0.0711 | 0.0074 | 0.0625 | 0.0066 | 0.0067 | 0.0001 | 0.0028 | 0.0002 | 2.0317 | 61.5 | 6.27 | 43.3 | 0.89 | 57.3 | 3.92 |
| 35F-09 | 2.03 | 197 | 234 | 0.84 | 0.1061 | 0.0176 | 0.0733 | 0.0094 | 0.0064 | 0.0002 | 0.0021 | 0.0001 | 1.2446 | 71.9 | 8.88 | 41.4 | 1.22 | 42.8 | 2.83 |
| 35F-10 | 3.12 | 211 | 380 | 0.55 | 0.1199 | 0.0151 | 0.0885 | 0.0097 | 0.0060 | 0.0002 | 0.0030 | 0.0002 | 1.8389 | 86.1 | 9.06 | 38.5 | 1.29 | 60.5 | 4.65 |
| 35F-11 | 2.15 | 150 | 254 | 0.58 | 0.0723 | 0.0125 | 0.0615 | 0.0096 | 0.0069 | 0.0002 | 0.0024 | 0.0002 | 1.7253 | 60.6 | 9.20 | 44.5 | 1.20 | 49.0 | 3.44 |
| 35F-12 | 3.35 | 470 | 364 | 1.28 | 0.0812 | 0.0100 | 0.0665 | 0.0082 | 0.0062 | 0.0001 | 0.0021 | 0.0001 | 0.7995 | 65.4 | 7.79 | 39.6 | 0.93 | 41.5 | 2.23 |
| 35F-13 | 3.17 | 223 | 382 | 0.58 | 0.0717 | 0.0082 | 0.0597 | 0.0071 | 0.0064 | 0.0002 | 0.0027 | 0.0002 | 1.7289 | 58.9 | 6.79 | 41.2 | 1.00 | 54.5 | 3.04 |
| 35F-14 | 1.37 | 108 | 146 | 0.74 | 0.1081 | 0.0292 | 0.0738 | 0.0165 | 0.0067 | 0.0003 | 0.0029 | 0.0003 | 1.3743 | 72.3 | 15.63 | 43.2 | 1.61 | 58.0 | 5.15 |
| 35F-15 | 26.18 | 1889 | 3228 | 0.58 | 0.0749 | 0.0031 | 0.0623 | 0.0024 | 0.0062 | 0.0001 | 0.0026 | 0.0001 | 1.7817 | 61.3 | 2.29 | 39.6 | 0.51 | 52.1 | 1.59 |
| 35F-16 | 25.30 | 1189 | 3031 | 0.39 | 0.0951 | 0.0057 | 0.0798 | 0.0047 | 0.0061 | 0.0001 | 0.0039 | 0.0002 | 2.5978 | 78.0 | 4.41 | 39.5 | 0.55 | 79.2 | 3.49 |
| 35F-17 | 4.48 | 335 | 531 | 0.63 | 0.0489 | 0.0051 | 0.0455 | 0.0048 | 0.0069 | 0.0001 | 0.0022 | 0.0001 | 1.5952 | 45.2 | 4.69 | 44.1 | 0.86 | 43.9 | 2.17 |
| 35F-18 | 3.51 | 268 | 415 | 0.64 | 0.0723 | 0.0113 | 0.0594 | 0.0083 | 0.0066 | 0.0001 | 0.0025 | 0.0001 | 1.5641 | 58.6 | 7.91 | 42.1 | 0.90 | 49.5 | 2.55 |
| 35F-19 | 2.62 | 239 | 317 | 0.75 | 0.0532 | 0.0088 | 0.0448 | 0.0069 | 0.0067 | 0.0002 | 0.0019 | 0.0001 | 1.3421 | 44.5 | 6.74 | 43.0 | 1.04 | 38.2 | 2.53 |
| 35F-20 | 3.04 | 359 | 320 | 1.11 | 0.0750 | 0.0085 | 0.0626 | 0.0071 | 0.0066 | 0.0002 | 0.0023 | 0.0001 | 0.9265 | 61.6 | 6.75 | 42.3 | 1.06 | 45.5 | 2.21 |
| 35F-22 | 9.55 | 887 | 1124 | 0.78 | 0.0529 | 0.0043 | 0.0456 | 0.0035 | 0.0064 | 0.0001 | 0.0023 | 0.0001 | 1.5929 | 45.3 | 3.37 | 41.1 | 0.66 | 47.4 | 1.95 |
| 35F-23 | 6.46 | 704 | 734 | 0.95 | 0.0501 | 0.0050 | 0.0436 | 0.0046 | 0.0066 | 0.0001 | 0.0024 | 0.0001 | 1.1342 | 43.3 | 4.43 | 42.4 | 0.93 | 49.2 | 2.37 |
| Elements | Olivine | Opx | Cpx | Garnet | Amphibole | Biotite | Plagioclase |
|---|---|---|---|---|---|---|---|
| Sm | 0.0013 | 0.01 | 0.283 | 0.217 | 0.85 | 0.03 | 0.11 |
| Rb | 0.002 | 0.003 | 0.0047 | 0.042 | 0.1 | 5.18 | 0.1 |
| Th | 0.04 | 0.13 | 0.03 | 0.05 | 0.0145 | 0.01 | |
| Ta | 0.000018 | 0.15 | 0.013 | 0.06 | 0.25 | 0.1069 | 0.04 |
| La | 0.00064 | 0.002 | 0.0435 | 0.01 | 0.2 | 0.035 | 0.27 |
| Yb | 0.14 | 0.34 | 0.512 | 0.067 |
Publisher’s Note: MDPI stays neutral with regard to jurisdictional claims in published maps and institutional affiliations. |
© 2022 by the authors. Licensee MDPI, Basel, Switzerland. This article is an open access article distributed under the terms and conditions of the Creative Commons Attribution (CC BY) license (https://creativecommons.org/licenses/by/4.0/).
Share and Cite
Fadaeian, M.; Jahangiri, A.; Ao, S.; Kamali, A.A.; Xiao, W. Geochemistry and Petrogenesis of Shoshonitic Dyke Swarm in the Northeast of Meshkinshahr, NW Iran. Minerals 2022, 12, 309. https://doi.org/10.3390/min12030309
Fadaeian M, Jahangiri A, Ao S, Kamali AA, Xiao W. Geochemistry and Petrogenesis of Shoshonitic Dyke Swarm in the Northeast of Meshkinshahr, NW Iran. Minerals. 2022; 12(3):309. https://doi.org/10.3390/min12030309
Chicago/Turabian StyleFadaeian, Mohammad, Ahmad Jahangiri, Songjian Ao, Amin Allah Kamali, and Wenjiao Xiao. 2022. "Geochemistry and Petrogenesis of Shoshonitic Dyke Swarm in the Northeast of Meshkinshahr, NW Iran" Minerals 12, no. 3: 309. https://doi.org/10.3390/min12030309