Article

Simulation of Grinding Media Motion and Collisions in Wet-Operated Accelerator-Mill Using DEM Coupled with CFD

1
School of Mechanical and Electronic Engineering, Suzhou University, Suzhou 234000, China
2
School of Mechanical Engineering, Southeast University, Nanjing 211189, China
3
Wet Grinding School-Enterprise Joint Laboratory of Suzhou University-Anhui Root Industrial Co., Ltd., Suzhou 234000, China
*
Author to whom correspondence should be addressed.
Minerals 2022, 12(3), 341; https://doi.org/10.3390/min12030341
Submission received: 9 December 2021 / Revised: 3 March 2022 / Accepted: 7 March 2022 / Published: 10 March 2022
(This article belongs to the Topic Advances in Separation and Purification Techniques)

Abstract

:
The relative motion and collision between grinding media in a wet-stirred accelerator mill are modelled using the discrete element method (DEM) coupled with computational fluid dynamics (CFD). The local average normalized grinding media velocity profile is employed to divide the grinding chamber into four volumes, which facilitates the analysis of the stress energy distribution. The local grinding media filling levels, velocity distributions, stress energy distributions and energy efficiencies are compared at various total grinding media filling levels and stirrer speeds. The rationality of the division of stress energy volume was verified by the stress energy distribution. The stress intensity, stress number and collision stress energy from the grinding media’s motion and particle collisions exhibited different distributions, with the stress number playing a leading role in the collision stress energy distribution. Moreover, energy efficiency is quantitatively characterized under different process conditions. This simulation-based research provides a theoretical reference for the industrial application and product development of accelerator mills used for grinding applications.

1. Introduction

Ultrafine-particle products containing micron-, sub-micron- and nano-sized particles are in increasing demand by various industries, for example, for ceramics, inks, paint pigments, pharmaceutics and microorganisms [1,2]. Ultrafine particles can be produced by the bottom-up and top-down approaches. Bottom-up approaches involve building particles through the precipitation of dissolved molecules [3,4], which is a classical technique used in pharmaceutical chemistry [5]. Top-down approaches involve creating fine particles by physical crushing, which include high-pressure homogenization [6] and stirred media milling [7]. High-pressure homogenization involves the forcing of a suspension under pressure through a narrow aperture to crush materials. However, the homogenizer has many vulnerable parts and requires many cycles to achieve the desired product [8]. Wet stirred media milling (WSMM) is the most popular approach to producing particle sizes of a few microns or less. An aqueous suspension containing product particles, dissolved stabilizers (polymer and/or surfactant) and a grinding media (beads) is stirred at high speed by a stirrer. Repeated stressing of product particles captured between the colliding beads causes their breakage. However, during wet grinding processes, only a small part of the dynamic energy is used for particle crushing, while a large part is converted into sound and heat energy [9]. One possibility for improving the performance of WSMM is to obtain a better understanding of the motions and collisions of the grinding media, as the frequency, strength and types of their impacts determine the efficiency of WSMM [10].
To understand grinding mechanisms, most current research has been based on experiments, which are very time-consuming and costly; furthermore, their findings usually involve various empirical relationships that are hard to generalize and apply elsewhere [10]. The movement and collisions of the grinding media in WSMM are crucial issues in describing the key energy transfer mechanism. However, it is normally difficult to analyse the motions and collisions of grinding media by means of experiments observed in a tiny space [11]. With the development of computer technology, finite element simulation has made it possible to analyse grinding media collisions [12]. Larsson et al. [13] proposed a multi-physics model of wet stirred media mill to simulate the interactions between the different constituents. Cisternas et al. [14] analyzed the current trends of multiphase system in modeling, design and optimization. Beinert et al. [15] developed a multi-scale modelling method to predict and optimize wet grinding processes. Based on the DEM-CFD simulation, the acting forces, stressing probability, stressing energy and bead motion are studied at the meso- and macro-scales. The results show that bead rotation and trans-latoric movement have decisive influences on the capture probability. Based on the normalized bead velocity profile, Fragnière et al. [16] divided a grinding chamber into four zones to analyse the local bead concentrations, velocity profiles, bead collisions and stress energies using DEM simulations coupled with CFD. They argued that the quantitatively normalized velocity profiles of beads serve as a good basis for modelling the stress energy distribution. Based on DEM and CFD, Kushimoto et al. [11] proposed a new simulation method for analysing the dynamic and breakage behaviours of aggregates by comparison with an experiment on dynamic and breakage behaviors of aggregates around a falling ball in liquid. Beinert et al. [9] derived an approach to the one-way coupling of DEM and CFD. Based on Navier-Stokes equations, an analytical solution of the displacement forces that occur when beads approach other beads or a wall was proposed. Jayasundara et al. [10] modelled particle flow using DEM to analyse the effect of particle-wall friction, disc hole size, and stirrer distance and shape on the flow properties of grinding media. Three different mills, a cylindrical rotor, a disc stirrer, and a planetary ball mill were investigated by Beinert et al. [17] using coupled CFD and DEM simulations, and analyses of bead movement, kinetic energy and contacts were developed.
It can be seen from the above research that numerical models based on CFD-DEM simulations of WSMM have increased our understanding of bead movements and collisions. Most simulation-based research has focused on disk mills, which are applied by various industries for the production of ultrafine particles [8]. However, the grinding characteristics of wet-operated accelerator mills, which show excellent grinding performance (e.g., in the field of nano-pesticides in current industrial applications), have not been studied. The aim of the present work is to explore the selection of stress energy volume, local grinding media distribution and velocity profiles via DEM-CFD simulation. Furthermore, the grinding media collision frequency, stressing intensity and resulting collision energy distribution and energy efficiency that occur in various technologies are described and compared.

2. Materials, Mill and Simulation Methods

2.1. Material Properties

The material used for wet grinding was a pesticide suspension. Table 1 shows its main properties, e.g., density, viscosity, as used in the various simulations. The grinding media was yttrium-stabilized zirconium oxide, for which the Poisson ratio and shear modulus were obtained from the manufacturer’s worksheets. The shear modulus was decreased by a factor of 104 to allow for a longer time-step and, therefore, quicker simulations [18]. The values of the restitution coefficient, static friction factor and rolling friction factor were obtained based on historical data from the manufacturer’s engineers. The pesticide density and viscosity were derived from the manufacturer’s product test data. The cylinder and agitator of the mill were made of ceramic materials to ensure a certain surface finish.

2.2. Mill and Grinding Media

The wet stirred-media mill used in this study was a 15 L pilot industrial wet-operated accelerator mill produced by Root Co., Ltd., Suzhou, China. It consisted of three inner acceleration grinding rotors and an outer grinding chamber. To conduct the simulation effectively, the sizes of all parts of the mill were reduced to the same scale. Figure 1a shows the simulated geometry of the mill and the dimensions of its main components. Figure 1b shows the size of the simulation area, which was a representative slice between the two accelerator grinding rotors. The DEM simulation of the boundaries was periodic in the axial direction. The size of the simulation area was determined according to the geometry of the laboratory mill. The circumferential speed of the accelerator grinding rotor varied from 800 rpm to 1400 rpm in increments of 200 rpm. The grinding media, yttrium-stabilized zirconium oxide, had a nearly monodispersed distribution with a size of dgm = 800 μm.

2.3. Simulation Methods

Coupled CFD–DEM simulations were performed to investigate the grinding media’s motion and collisions in the pesticide suspension. The software packages used for the DEM simulations was EDEM2018 (version 4.0.0, academic adaption, UK DEM Solutions, Edinburgh, UK). Workbench (version 19.1, academic adaption, ANSYS, Inc., Pittsburgh, PA, USA) that solves the Navier-Stokes equations for a Cartesian base was employed for the CFD simulations. The triangular/tetrahedral meshes were used to save the workload of meshing, the minimum value of the grid quality is 0.12617, the maximum value is 0.99992, and the average value is 0.8142. The DEM and CFD simulations were fully coupled using the discrete phase model. Exchange of momentum between the bead and fluid phases was conducted in both directions. The Hertz–Mindlin contact model was used for the DEM simulations. The standard k–ϵ turbulence model and scalable wall functions for near-wall treatment were employed for the CFD simulations. For DEM-CFD coupling, the Koch–Hill drag law was adopted in the current simulation [19]. DEM-CFD coupling was performed for every CFD time step. In the simulation setting, the fixed time step method is adopted; the time step is 0.01 s, and the total time step is 330. The convergence criterion for all equation residuals is set to 10−3. When the continuity equation residuals drop to 9.7091 × 10⁻⁴, other component residuals drop to (1.1~2.8) × 10−5, indicating that the convergence criteria are met.
The number of particles or contacts within a mill in a simulation is a key determinant of the computational costs. Therefore, the geometric dimensions of the cylinder and the accelerator grinding rotor were scaled and reduced by the same proportion. Three accelerator grinding rotors were simulated using periodic boundaries to emulate a section from the middle of the accelerator grinding rotor. To achieve a good comparative analysis of the simulation results, the degrees of filling investigated for the grinding media ranged from 60% to 90%. The diameter of the grinding bead, dgm, was 0.8 mm. As the porosity was assumed to be ε = 0.4, the resulting number of grinding beads in the chamber was approximately 40,306–60,459.
Based on DEM simulation, when all the grinding beads in the grinding chamber were generated, the stirrer driven by the motor started to rotate at the given speed. Therefore, under the action of friction, the suspension dragged the grinding media to rotate at high speed around the stirring shaft. Data analysis started after a processing time of 2 s to ensure that a steady stirring state had been reached. The velocities, positions, collision forces, and collision energy of the grinding media were sampled 20 times per second.
The comminution process in WSMM is, as a rule, determined by the stress intensity and the number of stress events (stress number) [20]. The stress intensity (SI) is defined as the kinetic energy resulting from translational normal impacts, SEtn ( = 1 2 m g v t n , r e l 2 ) and translational shear, SEts ( = 1 2 I g ω t s , r e l 2 ), here mg, Ig, vtn,rel, and ωts,rel are the grinding bead mass, the moment of inertia, the relative trans-latoric normal velocity, and the trans-latoric angular velocity. The stress number (SNg) is defined as the number of grinding bead contacts per time and unit mill volume, which is mainly determined by the contact judgment algorithm of the grid cell method. With these quantities, the kinetic energy transferred to the product particles, SEcs, which is responsible for grinding can be calculated as following.
S E c s = S I S N g
In order to estimate the maximum possible stress energy transferred to the chamber, the analytical stress energy model was introduced [21,22]. The maximum possible stress energy is defined as the net energy consumption of the WSMM, SEnet, which can be calculated as a product of contacts pre time and stress energy:
S E n e t = 6 π m g v r 2 n s r ( 1 + Y p Y g ) 1
where in mg, vr, and nsr are the grinding media mass, rotor tip speed, and the stirrer speed, respectively. Yp and Yg are the moduli of elasticity of the material and beads, respectively.
For different types of product particles, the effectiveness of their comminution in the chamber depends on the dominant grinding media contact type [17]. The grinding performance of the mill is determined by the energy distribution in the chamber, and the stress energy distribution is related to the number of grinding beads. Here the local grinding media filling, φlg, which is the locally defined number of grinding beads per unit volume, was also calculated by Equation (3) [16].
φ l g = κ 1 ε , ( κ + ε 1 )
where κ = Nlg × π × dg3/6 Vsc, Nlg is the local number of grinding beads, and Vsc is the local volume of the fluid-grinding media mixture.

3. Results and Discussion

3.1. Stress Energy Volumes

According to the proposed mill-related stress model, the stress energy distribution within the grinding area is the main indicator describing the comminution process. The most important comminution mechanisms occur due to bead–bead collisions at different relative velocities [17]. Figure 2 shows the calculated section vertically along the cylinder axis, where only half of the area required analysis due to its symmetry. The cross-sectioned area represents the main analysis region. The dimensionless radial Z′/R (R is the radial length) is plotted along the Z′-axis. The dimensionless axial X′/L (L is the axial length) is plotted along the X′-axis.
To explore the velocity variations of the grinding beads in each subzone studied in detail, the time-averaged velocities of local grinding beads at different stirrer speeds are shown in the XOZ′ coordinate plane in Figure 3 and Figure 4. The vertical axis represents the grinding bead velocities time-averaged and normalized by the stirrer-tip velocity (the circumferential velocity of the stirrer, as shown the linear velocity, vs, at point “s” in Figure 2, and vs = πdnsr; here d and nsr are the diameter and rotation speed of the stirring disc, respectively). Operating at a total filling level of 80%, the grinding media velocity profiles plotted relative to the circumferential stirring shaft speeds specified by the manufacturer were almost identical at all rotational speeds examined. Similar to a disk mill, the velocity of the grinding beads decreases gradually in the simulation cell (Z′/R = 0.39 → Z′/R = 0) from the top of the stirrer to the grinding chamber wall. This is mainly because the grinding beads that fly out at high speed from the top of the stirrer due to centrifugal force are subject to the resistance of the fluid, resulting in the loss of kinetic energy. When the grinding beads hit the chamber wall during deceleration, further kinetic energy is lost and their velocity reaches the minimum value.
However, unlike beads in a disk mill, where their velocity is mainly affected by the radius of the disc [23], the velocity of grinding beads in an accelerator mill increases due to centrifugal force and it generates the greater pressure from the chamber wall to the centre of the stirrer disc (Z/R = 0 → Z/R ≤ 0.69), until the grinding beads reach the maximum velocity near the stirrer shaft (Z/R = 0.9, X/L = 0.4). It was particularly evident that the grinding media were not driven by friction between the stirrer and beads, which is very common in disk mills. In fact, in the process of high-speed rotation by the acceleration stirrer, due to the strong centrifugal force, a certain degree of vacuum is formed at the entrance of each rotor close to the shaft. Under the action of the high-pressure flow at the exit of the rotor, the grinding beads are moved in a state of acceleration from the chamber wall to the stirrer shaft. When the high-speed grinding beads impact the stirrer shaft, the direction of their movement changes due to the drag of the fluid. The beads then impact the stirrer disc again, causing their kinetic energy to be further reduced. Therefore, along the axial direction of the stirrer shaft, the speed of the grinding beads shows a downward trend overall (X/L ≥ 0.4), as shown in Figure 3b.
Figure 4 shows the normalized average grinding media velocities plotted for the different grinding media fillings at a stirrer speed nsr = 1200 rpm. In Figure 4, it is particularly evident that the normalized velocity profiles are, in general, similar for the different stirrer speeds investigated above (Figure 3). In the radial plane, although the filling rates of the grinding media are different, they all have the same or similar trends in speed changes. From the chamber wall to the stirrer shaft, the speed change of the grinding beads goes through four stages: a slow acceleration stage, a fast acceleration stage, a steady stage and a deceleration stage. In the radial and axial planes shown in Figure 4, these stages correspond to the slow acceleration zone (Z/R ≤ 0.39), fast acceleration zone (Z/R ≤ 0.69), smooth zone (Z/R ≤ 0.9, X/L ≤ 0.4) and deceleration zone (X/L ≥ 0.4), respectively.
The average velocity of the grinding beads shown did not provide any direct indication of the grinding effectiveness. However, the changes in the velocity gradients of the grinding beads in each zone can be clearly seen in Figure 3 and Figure 4. The relative velocity of the grinding beads should be decisive for the stress energy [22]. Therefore, it becomes particularly evident that zones with different stress energies exist in the accelerator mill grinding chamber. The volume with high stress energies is relatively small and the stress energy is not uniformly distributed in the grinding chamber. To effectively identify the stress energy distribution, the grinding chamber was subdivided into four volumes of different stress energies [22], namely, stress energy volumes (SEVs).
Figure 5 shows the definition and dimensions of the investigated volumes (SEV_1–SEV_4) in the accelerator mill. Considering the symmetry of the grinding chamber’s structure, the cell element described by SEV_1–SEV_4 ranges from the middle of the stirrer disc to half of the length between the two stirrer discs. In the following analysis, the dynamic characteristics of grinding beads coupled with pesticides are described within each volume. For convenience of description, the coordinate origin is transformed from the point o′ ({X′,O′,Z′}) to the point o ({X,O,Z}).

3.2. Local Grinding Media Filling

The grinding media filling level is an important indicator that is used to characterize the frequencies of particle abrasion, impact and compression [21]. The time-averaged local grinding media concentrations within SEV_1–SEV_4 at various stirrer speeds and total filling levels are shown in Figure 6. Operating at a total filling level of 80% (Figure 6a), an uneven distribution of the grinding media is particularly evident within the defined volumes. In all simulations, the lowest grinding media filling is in SEV_3, while the highest is in SEV_1. The stirrer speed seems to have no significant influence on any of the volumes until the stirrer speed is > 1200 rpm. When the stirrer speed nsr = 400 rpm, the local grinding media filling levels within SEV_1 and SEV_2 increase, while those in SEV_3 and SEV_4 decrease, which is different from the case of the disk mill [16]. It is particularly evident in Figure 6a that, when the stirrer speed nsr ≤ 1200 rpm, the local grinding media concentrations within SEV_1–SEV_4 remain basically unchanged.
This is because the amounts of grinding media thrown out at the top of the stirrer disc and sucked in at its bottom remain basically unchanged, thus forming a relatively stable self-circulation. However, when the stirrer speed is further increased (nsr > 1200 rpm), the centrifugal force is also further increased and more grinding media is thrown out from the top of the stirring disc, thus accumulating and extruding in SEV_1 and SEV_2. Meanwhile, in SEV_3 and SEV_4, there is a serious loss of grinding media, causing its concentration to decrease. That is, when nsr > 1200 rpm, the balanced self-circulation of grinding media is disrupted, which causes changes in its concentration in each SEV.
Figure 6b depicts the local grinding media filling levels in SEV_1–4 at a stirrer speed of 1200 rpm. An uneven distribution of grinding media can be seen at low total filling levels, while at high filling levels (φ = 90%), the concentration tends to be even. The grinding media concentration within volumes SEV_1–4 increases almost proportionally to the total filling level. Obviously, the grinding media concentrations in SEV_1 and SEV_4 are higher than those in SEV_2 and SEV_3. This may be because the grinding media in SEV_2 and SEV_3 are always in an accelerated state and are seldom hindered by the chamber wall, stirrer shaft and stirrer disc, as they are in SEV_1 and SEV_4.
Figure 7 shows the local grinding media concentrations in the Y0OZ0 coordinate plane at any given instant. It can be observed that there is a periodic shift in the circumferential distribution. Even when coupled with the pesticide solution, the local grinding media concentration is still affected by gravitational force. Therefore, large gaps are created within SEV_2 and SEV_3, which also explains why their local grinding media concentrations are relatively low (compare with Figure 6).
For a quantitative comparison of the beads’ distribution, its fraction within a 15° fan-shaped volume was calculated. The local grinding media filling level in each 15° fan-shaped volume was time-averaged. Figure 8 shows the grinding media filling in each 15° fan-shaped volume along the circumference. At a stirrer speed of 1200 rpm, the local grinding media filling level is basically constant at different total filling levels (Figure 8a). However, except that the local filling level is >60% at a total filling level of 60%, the other local filling levels are lower than their corresponding total filling levels. Therefore, the uneven distribution of grinding media along the axial direction is particularly evident at different total filling levels.
Figure 8b depicts the extent to which the stirrer speed effectively influences the local grinding media filling level in each 15° fan-shaped volume along the circumference at a total filling level of 80%. It can be seen that, at about Rpa = 60°, the local grinding media concentration reaches the maximum for the various stirrer speeds. This phenomenon can be explained by the state of the force on the beads. The force acting on the beads along the radial and axial direction does not affect the beads’ concentration in each 15° fan-shaped volume. In addition, under the high-speed rotation of the stirring shaft, the circular motion is the main motion of the beads in the grinding chamber. Therefore, in this study, only the circumferential tangential force of the beads is taken into account. Moreover, the bead distribution in the chamber is mainly affected by long-term forces, such as the force between the fluid and grinding beads. To simplify the complex problems, the transient forces such as bead–bead or bead–chamber wall forces are no longer considered.
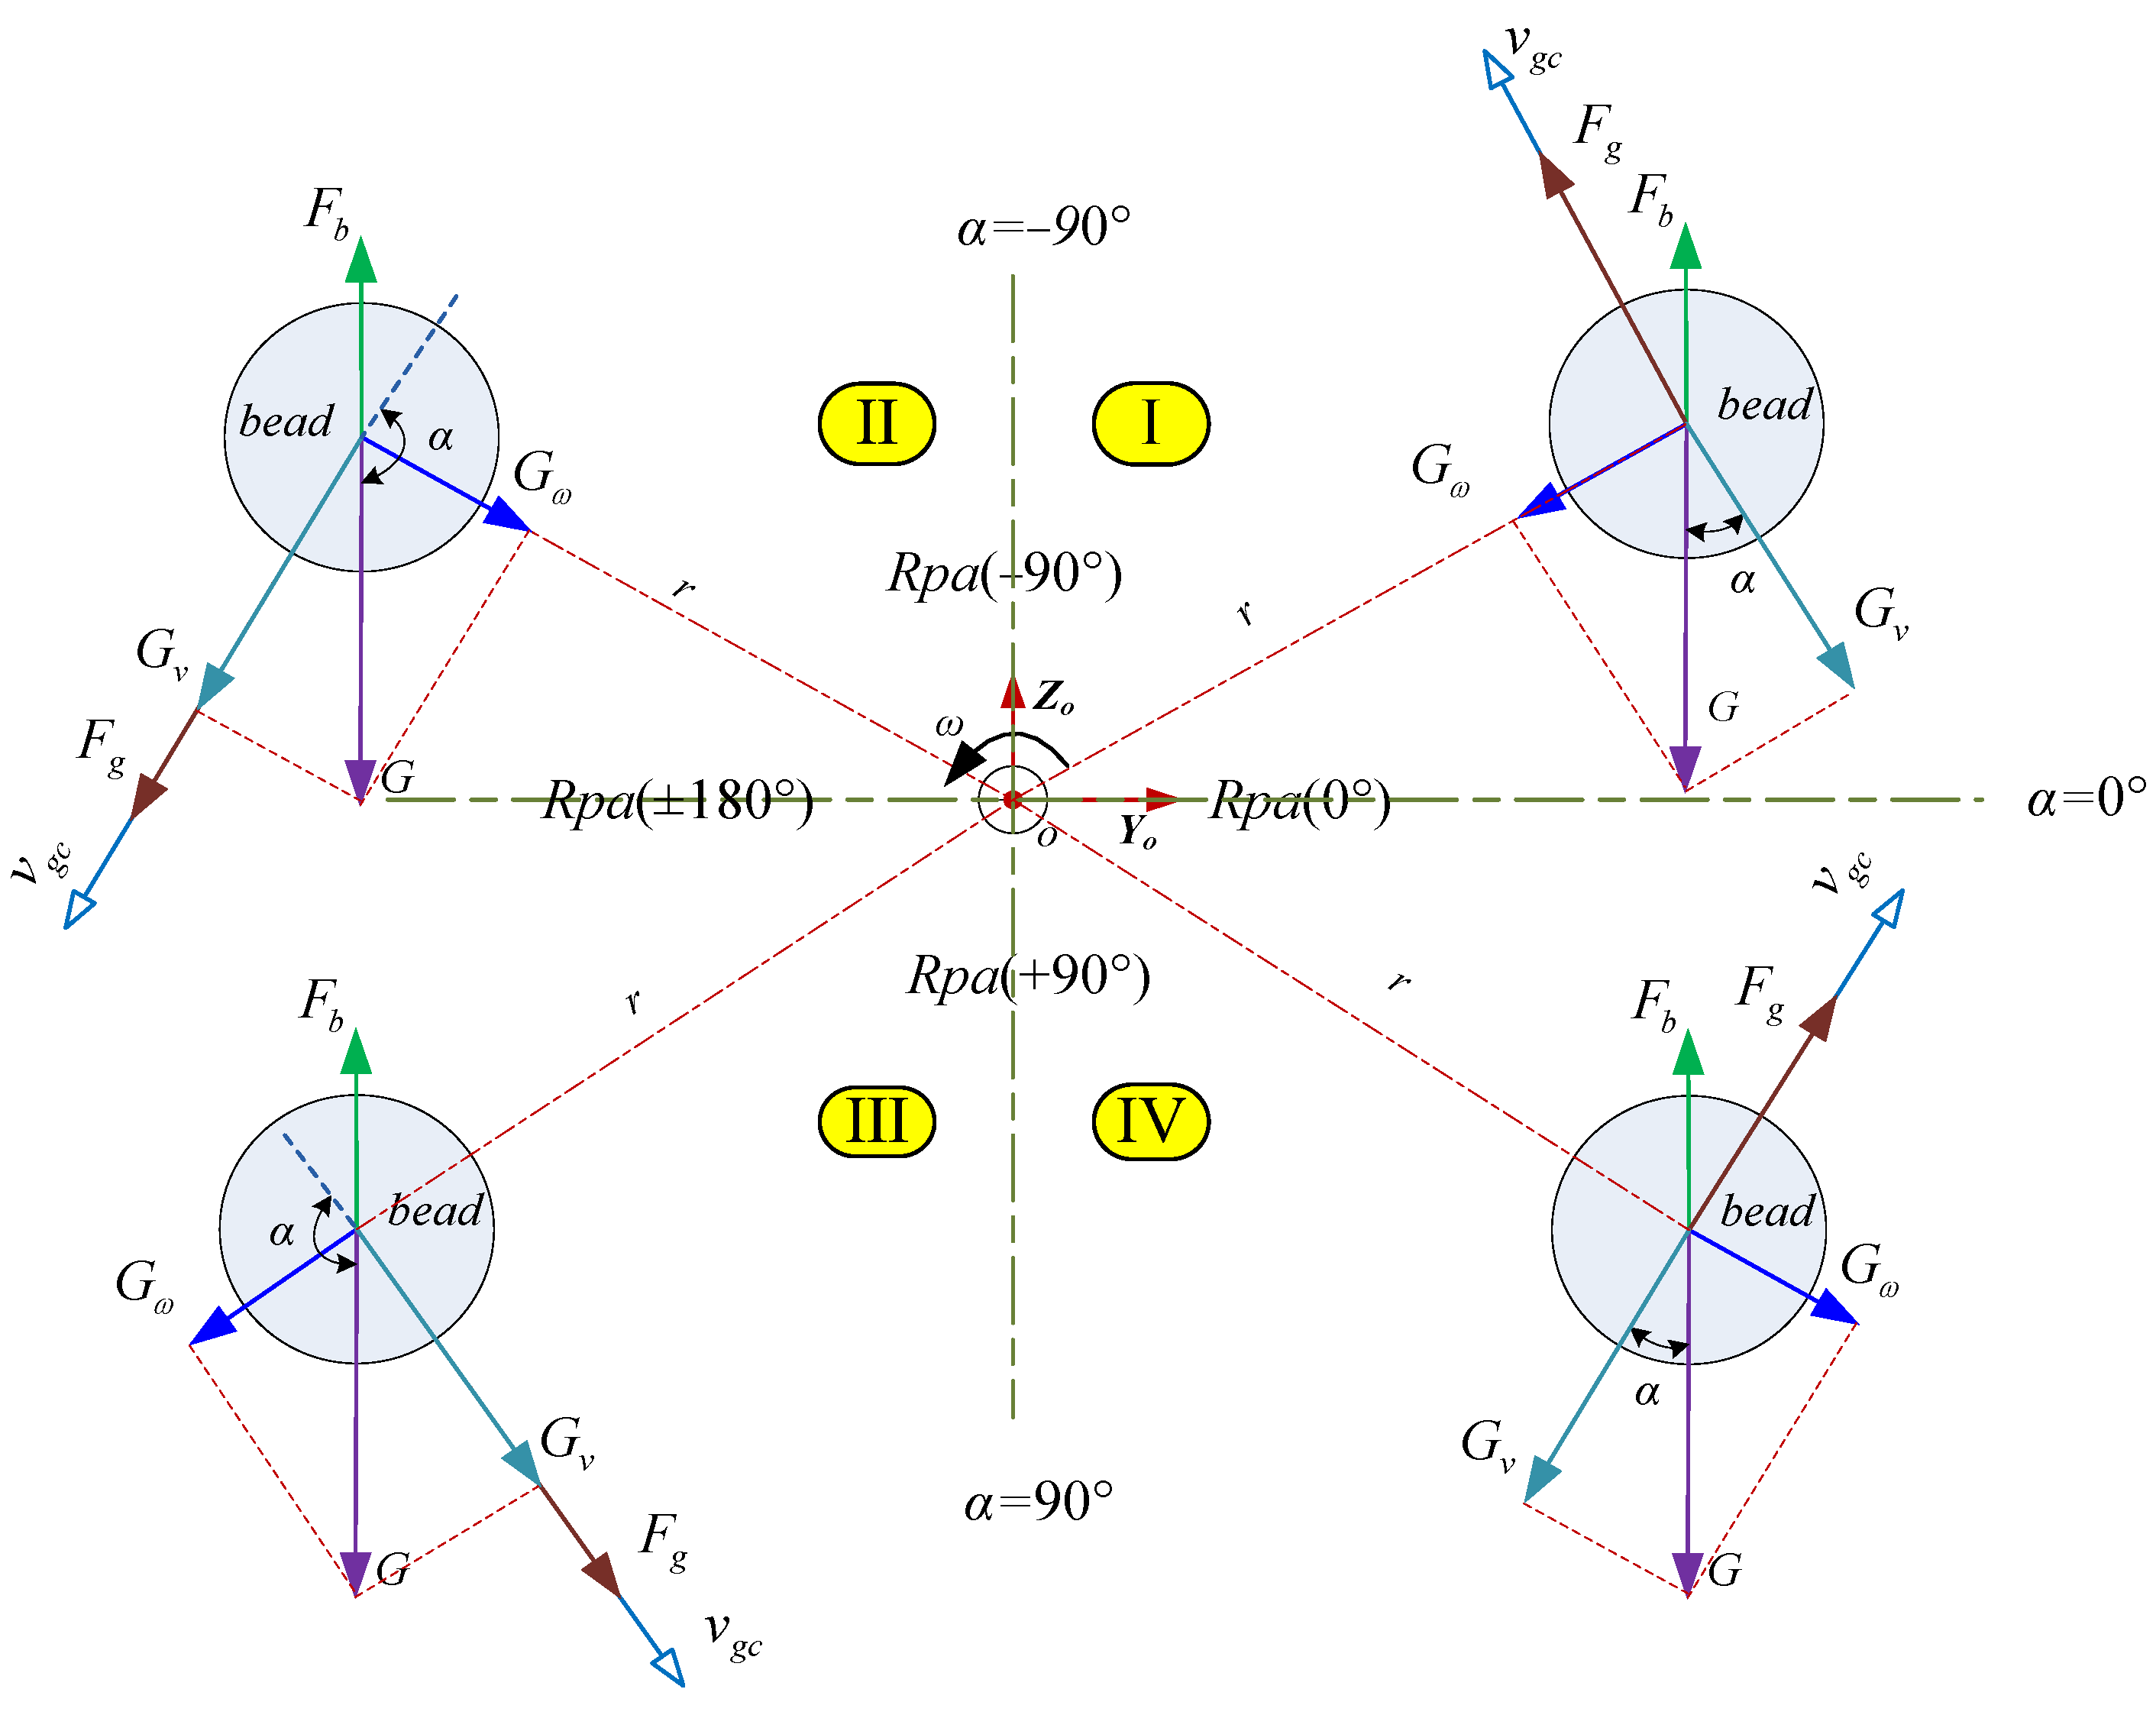
The grinding beads in a free state in the pesticide solution are subject to three forces, as shown in Figure 9, where G is the mass force expressed as G = m g g , which is always in the same direction as the acceleration of gravity; and Fb is the buoyancy force caused by the density difference between the fluid and grinding media. Fb is always opposite to the direction of mass force G, which is given by F b = 1 6 π ρ p d d g m 3 [9]. The circumferential tangential drag force of the fluid Fg acting on a grinding bead can be determined by the circumferential tangential velocity of the bead relative to the fluid vgs (=vsvgc, vs and vgc represent the tangential velocity components of the fluid and bead along the circumference, respectively) and its projected area sp: F g = 1 2 e g ρ p d s p v g s 2 . Here, eg is the drag coefficient calculated by the Reynolds number [9].
The magnitudes and directions of Fb and G do not change over time. Gv and Gω are the components of G, along and perpendicular to the velocity vgc, respectively. It can be seen from the velocity distribution in Figure 3 that, except for a slight decrease in velocity in SEV_4, the beads are almost in an accelerated state. Because the primary motion of the bead is rotational motion in the chamber, we can determine that the beads have similar motion states if only the tangential motion of the beads is considered. Therefore, Fg and vgc are usually in the same direction. It is important to note that the direction of Gv and vgc is opposite or the same depending on the movement zone where the bead is located (I, II, III, IV). In steady state, supposing the fluid velocity vs is close to the tip velocity of stirrer, when the grinding bead speed is low (nsr = 800 rpm), it has the highest average velocity ratio, shown in Figure 3, which means there is less drag force Fg at 800 rpm. Therefore, the mass force G plays a leading role in the bead movement at 800 rpm.
Along the counter-clockwise direction from −90° to +90° in Figure 9, Fg and Gv are in the same direction and push the grinding beads to accelerate through the ±180° area (II, III), so the local grinding filling level, φlg, is low (Figure 8b). However, from +90° to 0° in the same direction, the situation is just the opposite: Fg and Gv are in the opposite direction. As α decreases, Gv gradually increases (Gv,α = 0° = G), causing the grinding beads to slow down and accumulate, thus forming a higher local grinding filling level (about Rpa = 60° in Figure 8b), while from 0° to −90° in the counter-clockwise direction, although Gv is still opposite to the velocity vgc, it will gradually tend to 0 as α increases (Gv,α=90° = 0). Therefore, it is impossible for beads to accumulate in this area (I).
When the stirrer speed is further increased (nsr = 1000 rpm and 1200 rpm in Figure 8b), it also can be confirmed from Figure 3 that the average velocity ratio gradually decreases, which means the drag force Fg is gradually increasing at 800 rpm and 1200 rpm. The role of Fg in controlling the bead movement gradually increases. As a result, along the circumferential direction, the local grinding media concentration tends to be the same (Figure 8b). With further increases in stirrer speed (nsr = 1400 rpm), the average velocity ratio is the minimum, which means the drag force Fg reaches the maximum at 1400 rpm. Therefore, Fg has a dominant role in controlling the bead movement and the influence of the mass force G can almost be ignored. Since the force acting on the grinding beads is basically the same at each moment, the concentration of local grinding beads tends to be consistent along the circumferential direction (Figure 8b).

3.3. Grinding Media Velocity Distribution

According to the mill-related stress model, the comminution process can be described by the related grinding bead velocity distribution in the chamber [22]. The grinding media velocity coupled with fluid velocity is described within energy volumes SEV_1–4. Figure 10 shows that, in the XOZ coordinate system of Figure 5, the normalized mean grinding media velocities at various stirrer speeds along the axial direction (X axis) for a filling level of 80%. In order to show the normalized mean velocity of beads in detail, each SEV is divided into different subzones, and then the bead velocity of subzones in the same radius is calculated to obtain multiple velocity curves in each SEV shown in Figure 10. It can be seen that the grinding media clearly moves fastest in SEV_3 and SEV_4. However, the grinding media speed decreases in the plane of symmetry near the energy zone (X/L = 0.1) and that near the stirrer (X/L = 0.9), which results in a large velocity gradient. SEV_2 is the main acceleration zone. Since the grinding beads are rarely hindered, their speed at a given radius tends to be consistent. The mean grinding media velocity in SEV_1 is the lowest of all investigated cases. However, at the exit at the top of the stirrer, the grinding beads have a higher average speed due to centrifugal acceleration (X/L = 0.8). Therefore, there is also a higher velocity gradient (Figure 10a–c). From a statistical point of view, the velocity distributions of the grinding media in Figure 10a–c are similar. However, when the grinding speed is increased to 1400 rpm, the scenario is slightly different. As shown in Figure 10d, the grinding beads in SEV_3 and SEV_4 achieve a higher average velocity and form a certain velocity gradient. However, the grinding bead speeds in SEV_1 and SEV_2 are seriously weakened and tend to be consistent. It can be confirmed that, under the action of centrifugal force, the grinding beads thrown out at high speed accumulate in SEV_1 and SEV_2, thus reducing the numbers of beads in SEV_3 and SEV_4. As the local filling level is reduced, the bead speeds in SEV_3 and SEV_4 increase. Similar results have been found for grinding bead motion in disk-mills [16,24].
Figure 11 shows the normalized mean grinding media velocities in SEV_1–4. Figure 11a shows the case at 1200 rpm. It can be confirmed that the grinding bead velocities in all volumes decrease with increases in filling level. In SEV_1, the grinding media velocities seem to be less affected by filling level than in other volumes. Surprisingly, although the local filling level in SEV_4 is higher than that in SEV_2, the local mean bead velocity in SEV_4 is still higher than that in SEV_2. On the other hand, it can also be clearly seen that when the filling level is low (i.e., φ = 60%), the mean grinding media speed in each volume differs greatly, thus forming a wider speed distribution. However, as the filling level increases (i.e., φ = 90%), the bead velocities in each volume gradually tend to be consistent, thereby reducing the range of velocities. Figure 11b shows the mean grinding bead velocities normalized by stirrer tip velocity for volumes SEV_1–4 at a total filling level of 80%. Below a stirrer speed of 1200 rpm, the same decreases in the normalized mean bead velocities are observed for all volumes. When the stirrer speed reaches 1400 rpm, the normalized mean grinding bead velocities for volumes SEV_3 and SEV_4 increase, while those for volumes SEV_1 and SEV_2 decrease. This is due to the higher local grinding bead concentration, which slows down their movement [16]. Therefore, the local grinding media velocity depends not only on the stirrer speed but on the local filling level. Similar results can be found in Figure 6a and Figure 10d, which are discussed in detail above.

3.4. Stress Energy Distribution

The comminution process in stirred media mills is, as a rule, determined by the stress intensity (SI) at each stress event and the stress number (SNg), defined as the number of the grinding bead contacts per time and unit mill volume [20]. The distributions of the stress intensity accumulated from all impact directions for the translational normal impact (SEtn) and translational shear (SEts) within SEV_1–4 are shown in Figure 12. The stress intensity depends on the relative speed of the bead–bead collisions and reflects the relative velocity gradient of the beads. Figure 12a,b show that, at a total grinding media filling level of 80%, although the stirrer has different speeds (nsr = 800 rpm and 1400 rpm, respectively), the stress intensity distributions are nearly the same. Collisions with higher stress intensity can be found in SEV_1 and SEV_3, with SEV_3 having the higher stress intensity. Except for this, no significant difference in stress intensity can be seen between SEV_2 and SEV_4. At a stirrer speed of 1200 rpm, the highest stress intensity can be found in SEV_3 (Figure 12c). However, when the total filling level increases to 90%, the distribution of the stress intensity changes and the highest value is found in SEV_1 (Figure 12d). Therefore, all the cases show that the higher stress intensities are mainly distributed in SEV_1 and SEV_3, which are less affected by stirrer speed. However, the filling rate can significantly change the stress intensity distribution. In addition, unlike in disk mills where the collisions with the highest stress intensity occur close to the disc circumference [22], the area of highest stress intensity in an accelerator mill mainly occurs away from the edge of the stirring disc in a wider area near the chamber wall and stirring shaft.
In a batch grinding process, the other key indicator that determines the comminution result is the stress number (SNg), which is defined as the number of the grinding bead contacts per time and unit mill volume. In the following, the stress number is evaluated for 1 s. Figure 13a,b show that the locally averaged stress number changes distinctly for stirrer speeds of 800 rpm and 1400 rpm at a total filling level of 80%. In Figure 13a, a moderate number of collisions can be found in SEV_1, followed by SEV_4. When the speed is increased to 1400 rpm, the high collision zone expands from SEV_1 to SEV_2, while the SNg of SEV_4 is weakened. Between the two stirrer discs, a peak in the SNg can be found in a grinding bead diameters distance to the stirrer disc top. The highest SNg (>15 × 108/m3 s) can be found in this area (Figure 13b). Overall, the SNg that the product particles are captured at and stressed by the grinding media increases with stirrer speed [15].
In Figure 13c,d, SEV_1 also shows the highest absolute number of collisions, followed by SEV_2 and SEV_4. It is evident that the highest SNg occurs in SEV_1 and the lowest occurs in SEV_3. This is the case for all investigated stirrer speeds and total grinding media filling levels. At a high total filling level of 90%, densely packed grinding media are tightly stressed toward the outer chamber wall, resulting in a lower local collision frequency (e.g., in SEV_1) compared to the reference case (Figure 13c). However, the total stress number derived from bead collisions increases with the total filling level. Such findings can also be confirmed in [16].
The collision stress energy (SEcs) is an exclusive characteristic of WSMM and represents the power consumed by the product particle crushing. By calculating the product of stress intensity SI and stress number SNg, a locally resolved collision stress energy per volume, SEcs, can be obtained [17]. Figure 14a–d show the locally averaged collision stress energies per unit volume under various parameters. As expected, the collision stress energy distribution shows the same dependency with various parameters. However, all cases show that the peak collision stress energy occurs in SEV_1, and a medium number of collisions occur in SEV_2 and SEV_4. The lowest collision stress energy occurs in SEV_3. Compared with the stress intensity distribution in Figure 12, as well as the stress number distribution in Figure 13, it can be clearly seen that the collision stress energy distribution is very similar to that of the stress number distribution but is quite different from that of the stress intensity distribution. Therefore, we can be sure that the stress number distribution is more important than the collision stress intensity distribution. Taking the different process parameters into account, the highest local collision stress energy was, in all cases, found between the top surface of the stirrer disc and the grinding chamber wall. With increases in stirrer speed (Figure 14b) and grinding media filling level (Figure 14d), the collision stress energy increases significantly and the dominance of the high collision stress energy in SEV_1 expands radially to SEV_2 and SEV_4. Nevertheless, except for these cases, no significant difference in collision stress energy can be found in SEV_3.
It is known that the type of collision stress energy indicates the way that product particles are stressed and is an exclusive characteristic of the WSMM grinding mechanism. Thus, to understand the stressing processes, it is necessary to identify the types of stress energy for the whole energy spectrum. Figure 15a,b show the locally averaged stress energies resulting from translational normal impacts and translational shear, respectively. The numbers of bead–bead collisions that occur are evaluated for 1 s at a stirrer speed of 1200 rpm and total grinding media filling level of 80%. It can be seen that, regardless of the translational normal impact or translational shear, the highest collision stress energies also take place in SEV_1. This is evident at all investigated stirrer speeds and total filling levels. It is worth noting that the collision stress energy resulting from the translational shear direction (SEts) is an order of magnitude higher than that resulting from the translational normal impact direction (SEtn).
This is also demonstrated in Figure 16a,b, where SEcs,sum is the sum of all locally averaged stress energy SEcs, SEts,sum denotes the sum of trans-latoric shear energy SEts in a single SEV. and SEV_total is the sum of the ratio of SEts,sum/SEcs,sum. Figure 16 shows that SEV_1 has the highest relative translational shear energy, followed by SEV_2, SEV_4 and SEV_3. Nevertheless, in Figure 16a, the ratio of SEts,sum/SEcs,sum in SEV_1 remains basically unchanged, while those in SEV_2, SEV_4 and SEV_3 increase continuously with the total filling level. Therefore, the total proportion of translational shear energy, SEV_total, constantly increases. However, at a total filling level of 80% under different stirrer speeds, the situation becomes a little different (Figure 16b). At stirrer speeds < 1000 rpm, the ratio of SEts,sum/SEcs,sum in every volume increases but, after that, although it increases slightly in SEV_1 until 1200 rpm, it decreases in the other volumes. Therefore, this leads to a decrease in the total proportion of translational shear energy(SEV_total). This may be due to the particularly high centrifugal force squeezing most of the beads onto the chamber wall (SEV_1), reducing the numbers of beads in other volumes and resulting in a reduction in collision energy. However, we must note that in this case, the translational shear energy, SEts,sum, still accounts for 80% of the total collision stress energy(SEcs,sum). Dominance of the shear component has also been reported in other literature [25].

3.5. Energy Efficiency

During the comminution process in WSMMs, only a small part of the kinetic energy of the grinding media is used for comminution. According to the stress model proposed by Kawade et al. [21], the maximum stress energy obtained by the grinding media, SEnet, defined as the net stress energy transferred to the chamber, can be obtained according to Equation (2), which is used to calculate the energy utilization rate for various parameters. By accumulating the local stress energies for 1 s and relating them to the volume, a locally resolved stress energy from grinding bead collisions was obtained. Figure 17 shows the absolute values of SEcs,sum and SEnet and their ratio under different filling levels and stirrer speeds. In Figure 17, all cases have in common the increasing grinding media filling level at a stirrer speed of 1200 rpm and stirrer speed at a total grinding media filling level of 80% increases the net stress energy SEnet. There is a nearly proportionate increase in SEnet in Figure 17a, while in Figure 17b, there is a slightly disproportionate and increasing trend in SEnet. In Figure 17a, the collision stress energy SEcs,sum also increases with SEnet. However, the ratio of SEcs,sum/SEnet decreases at a total filling level of 90%. Therefore, among filling levels of 60%, 70%, 80% and 90%, 80% is expected to be the most energy efficient. In Figure 17b, looking at the range of 800–1400 rpm, the collision stress energy SEcs,sum increases with SEnet until 1400 rpm. SEcs,sum achieves the highest stress energy (0.0068 × 10⁷) at 1200 rpm; however, the ratio of SEcs,sum/SEnet is lower than that at 1000 rpm. The SEnet exhibits the highest collision stress energy at 1400 rpm, but its energy efficiency is the lowest. On average, in terms of energy efficiency, 1000 rpm may be the most favourable stirrer speed. In fact, most of the energy of the grinding media is dissipated as heat via several mechanisms, such as friction against the chamber wall, bead–bead contacts and bead wear/deformation [22]. However, the ‘true’ stress energy contributing to particle crushing, and the energy efficiency simulation, remain unknown and need to be addressed in future [15,17].

4. Conclusions

The WSMM process is often a key bottleneck in many industrial fine grinding and dispersing processes. A fundamental understanding of the flow of a grinding media in a mill is vital to discovering the grinding mechanism. However, obtaining such flow information by experimental techniques is always costly and time-consuming. Based on a stress model [21], numerical DEM-CFD studies were carried out with consideration of the stress energy volume, acting forces, grinding media filling level and stressing energy distribution. This revealed the grinding characteristics of a wet-operated accelerator mill.
Four volumes (SEV_1–4) were defined based on grinding bead velocity profiles obtained from DEM-CFD simulations for data evaluation. The simulated local average grinding bead velocity profiles obtained at various stirrer speeds and total filling levels demonstrate that the beads are in a state of continuous acceleration from the chamber wall to stirrer shaft. The highest bead velocity occurs close to the stirring shaft, unlike in disk mills where it occurs at the disc tip [15,16]. Therefore, four distinct volumes (SEV_1–4) were provided and validated by the collision stress energy distribution.
The local grinding bead filling levels in SEV_1–4 are greatly affected by the stirrer speed, which is the opposite to the case for disk mills [16]. However, the change in local grinding bead filling level with the total filling level shows the same tendency. In the circumferential direction, the grinding bead distribution is relatively uniform at various total filling levels at 1200 rpm. However, the local filling levels are lower than their corresponding total filling levels, which means there is an uneven distribution of grinding media along the axial direction. On the other hand, the grinding bead distribution in the radial plane is greatly affected by the stirrer speed. Increasing the stirrer speed can significantly improve the local filling concentration and the uniformity of the grinding beads.
Regarding the grinding bead velocity profile, in the plane along the axial direction, the bead velocity within each volume is distributed in layers. The grinding beads in SEV_3 clearly move the fastest, while their velocities in SEV_1 are the lowest. The normalized average grinding bead velocities in SEV_1–4 gradually decline and tend to become uniform with increases in filling level at 1200 rpm, while with increases in stirrer speed at an 80% filling level, the velocities show the same tendency until 1200 rpm. The velocities in SEV_3 and SEV_4 rise while those in SEV_1 and SEV_2 fall due to the different bead concentrations.
Regarding the stress energy distribution, there are different profiles of stress intensity SI, stress number SNg and collision stress energy SEcs within each volume. The higher stress intensities are found in SEV_1 and SEV_3, while the higher stress numbers are found in SEV_1 and SEV_4. This ultimately causes the dominant collision stress energy to be distributed mainly in SEV_1. Comparing its translational normal component SEtn with its translational shear component SEts, it can be concluded that shear grinding is the dominant crushing mechanism of the accelerator mill, which is opposite to the case of disk mills [10,16]. The ratio of SEts,sum/SEcs,sum further confirms this. The ratio of SEts,sum/SEcs,sum is basically > 80% regardless of the bead filling level or stirrer speed.
Finally, a preliminary discussion of energy efficiency is made to provide a specific quantitative standard. Under the studied process conditions, the highest ratio of collision stress energy to net stress energy was only 0.45%. This further quantifies that only a small part of the energy input into the chamber is used for product particle comminution [10,26].
In the present simulations, though the energy distribution of the main product particle crushing zone is well described, other zones, such as the outlet zone, the stress energy distribution and its ratio to total energy still need to be revealed. The bead diameter used in this simulation is 0.8 mm. When the bead diameter is between 0.5–1 mm, the simulation shows the same stress energy distribution as this study, so it has a good reference value for mill optimization design. Future work will use numerical experiments to further reveal the influence of the stirrer structure on the stress energy distribution. Based on this, the specific stirrer structure is optimized and selected, and then the physical experiment is carried out on the stirrer optimized to determine the required product particle crushing rate for the specific feed material and the process parameters.

Author Contributions

Conceptualization, M.J. and K.H.; methodology, K.H. and F.S.; software and data curation, F.S. and Q.Y.; investigation, K.H. and B.W.; draft preparation, K.H. and Q.Y.; funding acquisition, C.M. and X.L. All authors have read and agreed to the published version of the manuscript.

Funding

This work was supported in part by the Natural Science Foundation of Anhui Province under Grant 2108085ME172, in part by the 2020 Suzhou Science and Technology Plan Project: Development of Nano-pesticide Insecticide Grinding Equipment, in part by the Suzhou University key project under Grant 2021yzd02, in part by the Corporate-funded R&D projects under Grant 2019xhx033, 2021xhx023, 2021xhx022, 2021xhx024 and 2021xhx025, in part by the Suzhou College Teacher Application Ability Development Workstation under Grant 2018XJYY01,2020XJYY03, and in part by the Suzhou University Scientific Research Platform Project under Grant 2020ykf14.

Data Availability Statement

Data is contained within the article.

Acknowledgments

This work was carried out in Wet Grinding School-Enterprise Joint Laboratory of Suzhou University-Anhui Root Industrial Co., Ltd. We sincerely thank Chao Meng for his technical support throughout the work.

Conflicts of Interest

The authors declare no conflict of interest.

Nomenclature

DEM–CFDdiscrete element method/computational fluid dynamics
dgmgrinding media diameter
εporosity
SIstress intensity
SEtntranslational normal impact energy
SEtstranslational shear energy
SNgstress number
SEcskinetic energy transferred to the product particles
SEnetmaximum possible stress energy for particle crushing
SEcs,sumsum of all locally averaged stress energy SEcs
SEts,sumsum of translatoric shear energy SEts in a single SEV
SEV_totalsum of the ratio of SEts,sum/SEcs,sum
mggrinding media mass
vrstirrer linear velocity
vggrinding media velocity
vgstangential velocity of the bead relative to the fluid
vstangential velocity components of the fluid
vgctangential velocity components of the bead
nsrstirrer speed
Ypelasticity moduli of the material
Ygelasticity moduli of the beads
φlglocal grinding media filling level
φtotal grinding media filling level
κvolume ratio
Rstirrerdistance between stirrer shaft and edge of stirring disc
Rdistance between stirrer shaft and stirrer tip
rdistance between stirrer shaft and bead
SEV_1–4stress energy volume
Gmass force
Fbbuoyancy force
Fgcircumferential tangential drag force of the fluid
Gv, Gωcomponents of the resultant force of G and Fb

References

  1. Juhnke, M.; Berghausen, J.; Timpe, C. Accelerated formulation development for nanomilled active pharmaceutical ingredients using a screening approach. Chem. Eng. Technol. 2010, 33, 1412–1418. [Google Scholar] [CrossRef]
  2. Knieke, C.; Steinborn, C.; Romeis, S.; Peukert, W.; Breitung-Faes, S.; Kwade, A. Nanoparticle Production with Stirred-Media Mills: Opportunities and Limits. Chem. Eng. Technol. 2010, 33, 1401–1411. [Google Scholar] [CrossRef]
  3. Anais, J.P.; Razzouq, N.; Carvalho, M.; Fernandez, C.; Astier, A.; Paul, M.; Astier, A.; Fessi, H.; Lorino, A.M. Development of α-tocopherol acetate nanoparticles: Influence of preparative processes. Drug. Dev. Ind. Pharm. 2009, 35, 216–223. [Google Scholar] [CrossRef] [PubMed]
  4. Wagh, K.S.; Patil, S.K.; Akarte, A.K.; Baviskar, D.T. Nanosuspension-a new approach of bioavailability enhancement. Int. J. Pharm. Sci. Rev. Res. 2011, 8, 61–65. [Google Scholar]
  5. Bansal, S.; Bansal, M.; Kumria, R. Nanocrystals: Current strategies and trends. Int. J. Pharm. Biomed. Sci. 2012, 3, 406–419. [Google Scholar]
  6. Kolaib, E.; Sharma, R. Nanodispersions platform for solubility improvement. Int. J. Res. Pharm. Biomed. Sci. 2013, 4, 636–643. [Google Scholar]
  7. Böttcher, A.-C.; Schilde, C.; Kwade, A. Experimental assessment of grinding bead velocity distributions and stressing conditions in stirred media mills. Adv. Powder Technol. 2021, 32, 413–423. [Google Scholar] [CrossRef]
  8. Loh, Z.H.; Samanta, A.K.; Heng, P.W.S. Overview of milling techniques for improving the solubility of poorly water-soluble drugs. Asian J. Pharm. Sci. 2015, 10, 255–274. [Google Scholar] [CrossRef] [Green Version]
  9. Beinert, S.; Schilde, C.; Kwade, A. Simulation of Stress Energy and Grinding Media Movement within a Wet-Operated Annular-Gap Mill Using the Discrete-Element Method. Chem. Eng. Technol. 2012, 35, 1911–1921. [Google Scholar] [CrossRef]
  10. Jayasundara, C.T.; Yang, R.; Yu, A. Discrete particle simulation of particle flow in a stirred mill: Effect of mill properties and geometry. Ind. Eng. Chem. Res. 2012, 51, 1050–1061. [Google Scholar] [CrossRef]
  11. Kushimoto, K.; Ishihara, S.; Kano, J. Development of ADEM–CFD model for analyzing dynamic and breakage behavior of aggregates in wet ball milling. Adv. Powder Technol. 2019, 30, 1131–1140. [Google Scholar] [CrossRef]
  12. Makokha, A.B.; Moys, M.H.; Bwalya, M.M. Modeling the RTD of an industrial overflow ball mill as a function of load volume and slurry concentration. Miner. Eng. 2011, 24, 335–340. [Google Scholar] [CrossRef]
  13. Larsson, S.; Prieto, J.M.R.; Heiskari, H.; Jonsén, P. Novel Particle-Based Approach for Modeling a Wet Vertical Stirred Media Mill. Minerals 2021, 11, 55. [Google Scholar] [CrossRef]
  14. Cisternas, L.A.; Lucay, F.A.; Botero, Y.L. Trends in Modeling, Design, and Optimization of Multiphase Systems in Minerals Processing. Minerals 2019, 10, 22. [Google Scholar] [CrossRef] [Green Version]
  15. Beinert, S.; Fragnière, G.; Schilde, C.; Kwade, A. Multiscale simulation of fine grinding and dispersing processes: Stressing probability, stressing energy and resultant breakage rate. Adv. Powder Technol. 2018, 29, 573–583. [Google Scholar] [CrossRef]
  16. Fragnière, G.; Naumann, A.; Schrader, M.; Kwade, A.; Schilde, C. Grinding Media Motion and Collisions in Different Zones of Stirred Media Mills. Minerals 2021, 11, 185. [Google Scholar] [CrossRef]
  17. Beinert, S.; Fragnière, G.; Schilde, C.; Kwade, A. Analysis and modelling of bead contacts in wet-operating stirred media and planetary ball mills with CFD–DEM simulations. Chem. Eng. Sci. 2015, 134, 648–662. [Google Scholar] [CrossRef]
  18. Lommen, S.; Schott, D.; Lodewijks, G. DEM speedup: Stiffness effects on behavior of bulk material. Particuology 2014, 12, 107–112. [Google Scholar] [CrossRef]
  19. Van Buijtenen, M.S.; Van Dijk, W.J.; Deen, N.G.; Kuipers, J.A.M.; Leadbeater, T.; Parker, D.J. Numerical and experimental study on multiple-spout fluidized beds. Chem. Eng. Sci. 2011, 66, 2368–2376. [Google Scholar] [CrossRef]
  20. Kwade, A.; Schwedes, J. Breaking characteristics of different materials and their effect on stress intensity and stress number in stirred media mills. Powder Technol. 2002, 122, 109–121. [Google Scholar] [CrossRef]
  21. Kwade, A. A stressing model for the description and optimization of grinding processes. Chem. Eng. Technol. 2003, 26, 199–205. [Google Scholar] [CrossRef]
  22. Stender, H.-H.; Kwade, A.; Schwedes, J. Stress energy distribution in different stirred media mill geometries. Int. J. Miner. Process. 2004, 74, S103–S117. [Google Scholar] [CrossRef]
  23. Jayasundara, C.T.; Yang, R.Y.; Guo, B.Y.; Yu, A.B.; Govender, I.; Mainza, A.; van der Westhuizen, A.; Rubenstein, J. CFD–DEM modelling of particle flow in IsaMills—Comparison between simulations and PEPT measurements. Miner. Eng. 2011, 24, 181–187. [Google Scholar] [CrossRef]
  24. Van der Westhuizen, A.P.; Govender, I.; Mainza, A.N.; Rubenstein, J. Tracking the motion of media particles inside an IsaMill™ using PEPT. Miner. Eng. 2011, 24, 195–204. [Google Scholar] [CrossRef]
  25. Trofa, M.; D’Avino, G.; Fabiano, B.; Vocciante, M. Nanoparticles synthesis in wet-operating stirred media: Investigation on the grinding efficiency. Materials 2020, 13, 4281. [Google Scholar] [CrossRef] [PubMed]
  26. Tokoro, C.; Ishii, Y.; Tsunazawa, Y.; Jiang, X.; Okuyama, K.; Iwamoto, M.; Sekine, Y. Optimum design of agitator geometry for a dry stirred media mill by the discrete element method. Adv. Powder Technol. 2021, 32, 850–859. [Google Scholar] [CrossRef]
Figure 1. Simulated geometry of the acceleration mill [mm]: (a) the mill dimensions and the radial simulation area; (b) axially cut side view.
Minerals 12 00341 g001
Figure 2. The calculated section covered with dotted lines and the red dot “s” indicates where the linear velocity is located.
Minerals 12 00341 g002
Figure 3. Local grinding media velocity distribution of the simulation cell under different stirrer speeds at a total grinding media filling φ = 80%, where vg and vr are the grinding media velocity and stirrer linear velocity, respectively; r and Rstirrer are the distance between stirrer shaft and bead and the distance between stirrer shaft and edge of stirring disc, respectively; (a) in the radial direction; (b) in the axial direction.
Minerals 12 00341 g003
Figure 4. Local average grinding media velocity of the simulation cell for different grinding media filling φ at a stirrer speed nsr =1200 rpm (a) in the radial direction; (b) in the axial direction.
Minerals 12 00341 g004
Figure 5. Definition and dimensions of stress energy volume(SEV_1–SEV_4) in accelerator-mill [mm]. The cell element described by SEV_1–SEV_4 ranges from the middle of the disc to half of the length between the two discs.
Minerals 12 00341 g005
Figure 6. Local grinding media filling in the SEV_1–SEV_4: (a) total grinding media filling φ = 80%; (b) stirrer speed nsr = 1200 rpm.
Minerals 12 00341 g006
Figure 7. Beads’ distribution in the Y0OZ0 coordinate plane at any given instant at a stirrer speed nsr = 1200 rpm.
Minerals 12 00341 g007
Figure 8. Grinding media distribution in each 15° fan-shaped volume time-averaged within 1 s: (a) stirrer speed nsr =1200 rpm; (b) total grinding media filling φ = 80%.
Minerals 12 00341 g008
Figure 9. Schematic diagram for the forces acting on the grinding bead.
Minerals 12 00341 g009
Figure 10. Grinding bead velocity within the volumes for volumes SEV_1~SEV_4 along the axial direction at a total grinding media filling φ = 80%: (a) stirrer speed nsr = 800 rpm; (b) stirrer speed nsr = 1000 rpm; (c) stirrer speed nsr = 1200 rpm; (d) stirrer speed nsr = 1400 rpm.
Minerals 12 00341 g010aMinerals 12 00341 g010b
Figure 11. Normalized mean grinding media velocities for volumes SEV_1~SEV_4: (a) depending on the total grinding media filling φ at a grinding stirrer speed nsr = 1200 rpm; (b) depending on the stirrer speed nsr at a total grinding media filling φ = 80%.
Minerals 12 00341 g011
Figure 12. Locally averaged stress intensity SI within volumes in the axial section marked as follows: ①→SEV_1, ②→SEV_2, ③→SEV_3, ④→SEV_4. (a) Stirrer speed nsr = 800 rpm/total grinding media filling φ = 80%; (b) Stirrer speed nsr = 1400 rpm/total grinding media filling φ = 80%; (c) Stirrer speed nsr = 1200 rpm/total grinding media filling φ = 60%; (d) Stirrer speed nsr = 1200 rpm/total grinding media filling φ = 90%.
Minerals 12 00341 g012
Figure 13. Locally averaged stress number SNg within volumes in the axial section marked as follows: ①→SEV_1, ②→SEV_2, ③→SEV_3, ④→SEV_4. (a) Stirrer speed nsr = 800 rpm/total grinding media filling φ = 80%; (b) Stirrer speed nsr = 1400 rpm/total grinding media filling φ = 80%; (c) Stirrer speed nsr = 1200 rpm/total grinding media filling φ = 60%; (d) Stirrer speed nsr = 1200 rpm/total grinding media filling φ = 90%.
Minerals 12 00341 g013
Figure 14. Locally averaged collision stress energy SEcs within volumes marked as follows: ①→SEV_1, ②→SEV_2, ③→SEV_3, ④→SEV_4. (a) Stirrer speed nsr = 800 rpm/total grinding media filling φ = 80%; (b) Stirrer speed nsr = 1400 rpm /total grinding media filling φ= 80%; (c) Stirrer speed nsr = 1200 rpm/total grinding media filling φ = 60%; (d) Stirrer speed nsr = 1200 rpm/total grinding media filling φ = 90%.
Minerals 12 00341 g014
Figure 15. Locally averaged collision stress energy components within volumes marked as follows: ①→SEV_1, ②→ SEV_2, ③→ SEV_3, ④→SEV_4, at a stirrer speed nsr = 1200 rpm and total grinding media filling φ = 80%: (a) translational normal component SEtn; (b) translational shear component SEts.
Minerals 12 00341 g015
Figure 16. The ratio of SEts,sum/SEcs,sum in each volume (SEV_1–4): (a) stirrer speed nsr = 1200 rpm for different total grinding media fillings. (b) total grinding media filling φ = 80% for different stirrer speeds.
Minerals 12 00341 g016
Figure 17. The collision stress energy SEcs,sum and net stress energy SEnet as well as their ratio: (a) stirrer speed nsr = 1200 rpm for different grinding media fillings. (b) total grinding media filling φ = 80% for different stirrer speeds.
Minerals 12 00341 g017
Table 1. Material property for the DEM-CFD Simulation.
ItemsSymbolUnitValue
Poisson ratioψ-0.25
Media densityρgmkg/m36040
Shear modulusGPa3.36 × 106
Restitution coefficientμc-0.5
Static friction factorμs-0.3
Rolling friction factorμr-0.01
Pesticide densityρpdkg/m31050
Pesticide viscosityυPa·s0.4
Publisher’s Note: MDPI stays neutral with regard to jurisdictional claims in published maps and institutional affiliations.

