Abstract
The Lala copper area in Huili County, Sichuan Province, China, is favored by superior regional metallogenic geological conditions due to its location in an extremely important copper–iron metallogenic belt in southwest China, and it has witnessed the formation of a series of unique iron–copper deposits following the superposition of multiple tectonic events. In recent years, major mineral exploration breakthroughs have been achieved in the deep and peripheral zones of this area. Using the Lala copper mining area in Sichuan as an example, this paper describes metallogenic prediction research carried out based on multivariate geoscience information (geological information, geophysics, geochemistry, and remote sensing data) and the application of geographic information system (GIS) technology and the radial basis function neural network (RBFLN) model. The five specific aspects covered in this paper are as follows: (1) we collected geology–geophysics–geochemistry remote sensing data and other information, adopted GIS technology to extract multivariate geoscience ore-forming anomaly information, and established a geoscience prospecting information database; (2) we applied the RBFLN algorithm for information on integrated analysis of ore-forming anomalies in the study area; (3) we applied a statistical method to divide the threshold value to delineate favorable ore-prospecting target areas; (4) we applied three-dimensional (3D) visualization technology, through which sample assistance was verified, to evaluate the performance of the RBFLN model; and (5) the results revealed that the RBFLN model can integrate multivariate and multi-type geoscience information and effectively predict metallogenic prospective areas and delineate favorable target areas. The metallogenic prediction method based on RBFLN technology provides a scientific basis for the exploration and deployment of minerals in the study area. It is obvious that the methods to predict and evaluate mineral resources are developing towards model integration and information intelligent analysis.
1. Introduction
Mineral resources play a significant role in China’s economic development. At present, China is relatively limited in terms of mineral resource storage, and will especially be reliant on the importation for copper for a period in the future. This has affected China’s industrial development to a large extent. Therefore, scientific predictions and evaluations of potential mineral resources are essential and serve as a key guarantee for the sustainable development of China’s national economy. Currently, resource prediction and evaluation has become a research focus in the field of mineral exploration [1].
Geostatistics is a branch of statistics established by French statistician G. Matheorn. Based on the theory of regionalized variables and with variation functions as a tool, it is a science that explores natural phenomena which occur both at random and with a certain structure in spatial distribution [2]. It initially targeted the single spatial parameter statistical model as a focus, which gave rise to linear geostatistics [2,3,4]. With the development of spatial parameters that tend to be more complex and diverse, nonlinear geostatistics [5,6] have emerged when linear geostatistics failed to provide solutions.
Since the 1970s, the development of methodological systems of regional metallogenic prediction has accelerated. It mainly covers three directions, two of which are regional metallogenic predictions based on the research of geological metallogenic theory and one which is based on the research of metallogenic dynamics theory [7]. The regional metallogenic prediction method adopted in this study relies on comprehensive geological research as the foundation, deposit models or geological anomalies as the bases, the computer as a means of research, and comprehensive quantitative analysis of multivariate information, such as geology, geophysics, geochemistry, and remote sensing data, as key approaches [8,9,10].
GIS technology, a computer system which integrates collection, storage, management, analysis, display, and application, is a general technology for analyzing and processing multivariate geographic data [11]. In metallogenic prediction, its application has advantages such as the integrated management of multivariate geoscience data, data space simulation analysis, and data quantification [12]. In recent years, the methodology system of metallogenic predictions based on GIS technology has been continuously deepened and developed. In the late 1980s, the Geological Survey of Canada used GIS technology for the potential mapping of mineral resources, mineral exploration, and mineral resource evaluation [13]. In 1988, Wyborn et al., from Australia, adopted GIS technology to evaluate mineral resource potentials [14]. In 2012, Silva et al. applied the ArcGIS-SDM fuzzy logic method to generate mineral exploration maps and evaluate potential exploration areas [15,16]. Additionally, Li et al. successfully developed the GeoCube software by integrating mathematical modeling methods [17] and quantitatively extracted and integrated 3D geoscience prospecting information of the Luanchuan mining area in Henan Province with the help of the software in question [18]. Combining GIS resource evaluation technology and 3D modeling technology, Wang et al. extracted and integrated comprehensive metallogenic information from the zones at different depths in the mining area [19].
Artificial neural networks (ANNs) have been widely applied in regional metallogenic prediction as a nonlinear classification method [20]. It classifies and recognizes data by imitating human biological neurons with the capacity to process complex nonlinear spatial datasets. To date, a wide range of ANNs has been developed, such as RBFLN, generalized regression neural networks (GRNNs), and probabilistic neural networks (PNNs) [21,22,23]. Previous studies have revealed that RBFLN is superior in metallogenic prediction.
Based on the metallogenic geological conditions and the metallogenic model of the Lala copper concentration area in Sichuan (Figure 1), this paper describes how multivariate geoscience ore-forming information was integrated with the help of GIS technology and the use of the RBFLN model. Predictive prospective outcomes and superimposed verification results of ore body models indicated that this method is capable of rendering theoretical bases and practical suggestions for mineral prospecting effort at deep zones in this area.
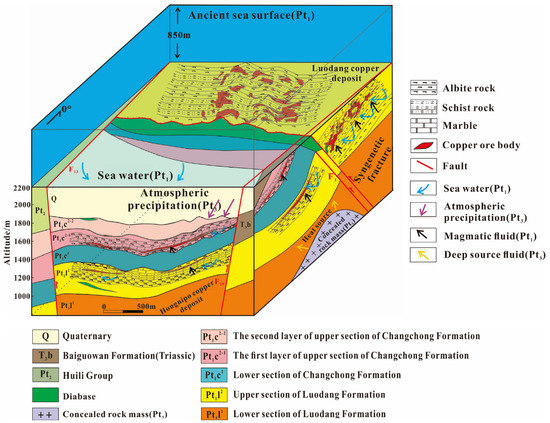
Figure 1.
Geological model for prospecting predictions of the Lala copper deposit (modified from [24]).
2. Geological Setting
2.1. Regional Geology
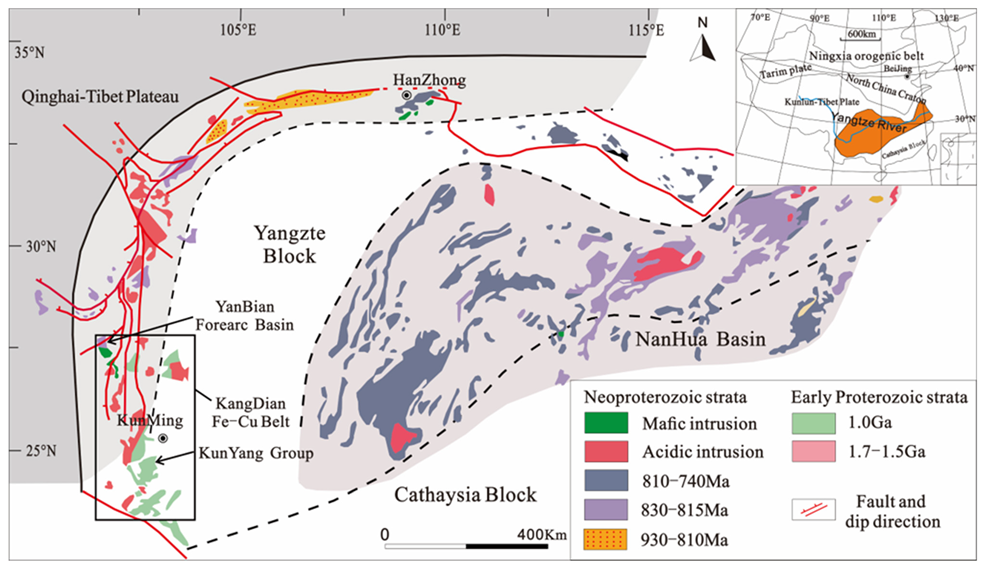
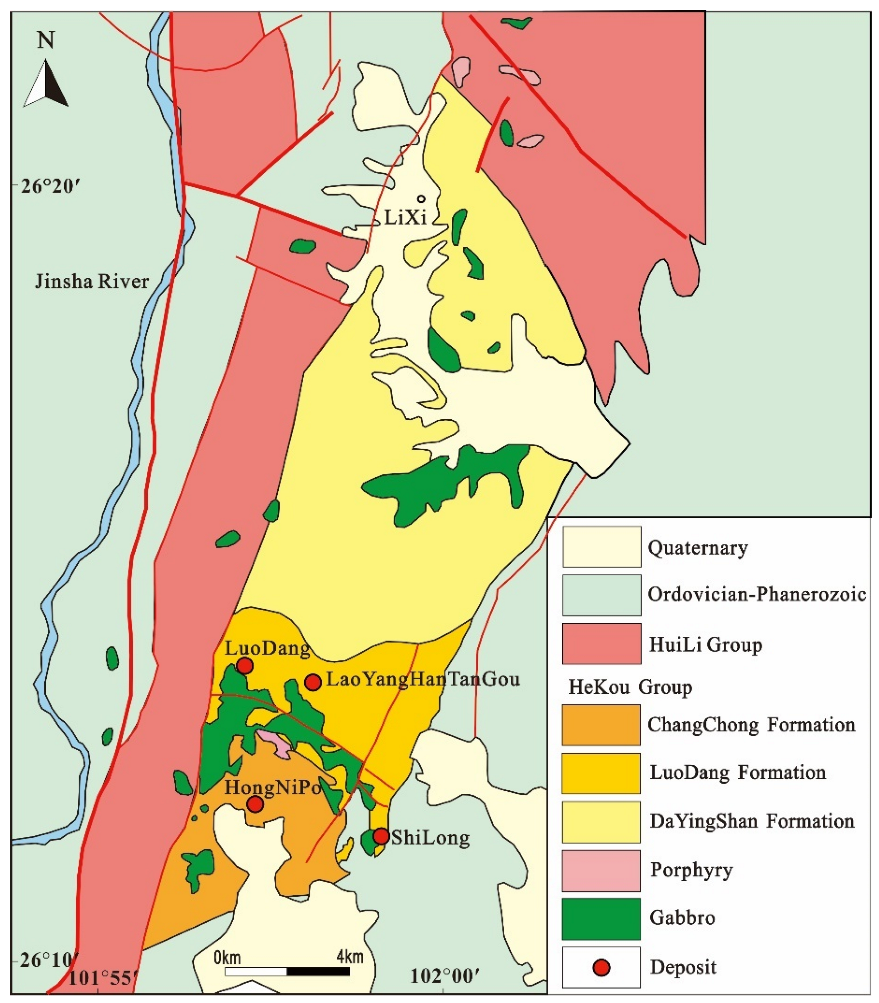
The Lala region is located on the eastern edge of the midsection of the Kangding–Yunnan Axis of the Yangtze Platform which extends from north to south, and north of the Huili–Eastern Sichuan Aulacogen, which stretches from east to west (Figure 2). Spreading across the border between China and Vietnam, the Kangding–Yunnan copper belt lies on the western fringe of the Yangtze Plate, with a length of about 300 km. A famous iron-oxide copper gold (IOCG) metallogenic area [25,26], the province has more than 50 IOCG deposits, the most representative of which are the Luodang Copper Mine and Hongnipo Copper Mine (Figure 3).

Figure 2.
Geotectonic location of the Lala area (modified from [24]).

Figure 3.
Distribution map of copper deposits in the Lala area (modified from [24,27]).
The strata in this region developed from the Early Proterozoic Erathem to the Cenozoic Erathem. Except for the Ordovician–Carboniferous strata, all other strata can be found here, with those of the Proterozoic Erathem and the Mesozoic Erathem most developed. Stratigraphic combinations in this region mainly cover the Pre-Sinian System, the Sinian to Silurian Systems, the Permian System, the Triassic to Cretaceous Systems, and the Cenozoic Erathem [24]. The Hekou Group and the Huili Group are the major ore-bearing strata, whereas the industrial ore bodies are mainly hosted in the middle and lower parts of the Luodang Subgroup of the Hekou Group.
This region is typical of frequent and intense magmatic activities, which feature multiple cycles and multiple stages—the major stages are Jinning, Chengjiang, Variscan, and Indosinian Periods. Due to its unique tectonic–magmatic conditions and relatively developed fluid activities, this region is abundant in metal minerals [24].
2.2. Deposit Geology
2.2.1. Luodang Copper Deposit
Comprising 32 ore bodies, the Luodang copper deposit is 1960 miles long from east to west and 900 miles wide from north to south, covering an area of 1.76 km2. The upper section of the volcanic sedimentary cycle—Luodang formation complex, in the middle of the Hekou Group—is the major ore-bearing stratum. The ore body is stratiform, stratiform-like, and lentoid, and is generated in an overlapping-imbricate shape [28]. The attitude of the ore body, basically resembling that of the surrounding rocks, is controlled by lithology and stratum position and fluctuates with the folds of the surrounding rocks. The ore body presents an overall trend from east to west and tilts southward with an angle of 15°–40° [29].
2.2.2. Hongnipo Copper Deposit
The Hongnipo deposit sits about 5 km south of the Luodang deposit, with the ore body hosted in the Hekou Group strata in the Early Proterozoic metamorphic–volcanic sedimentary sequence and controlled by stratum position and lithology to a large extent [30]. The Tianshengba Group is the primary ore-bearing stratum, followed by the Luodang Group. The ore body is stratiform, stratiform-like, and podiform, and is generated in a bedding mode. The ore-bearing surrounding rocks mainly comprise carbonaceous quartz albitite, dolomitic quartz albitite, and quartz albitite at the bottom of the lower section of the Tianshengba Group.
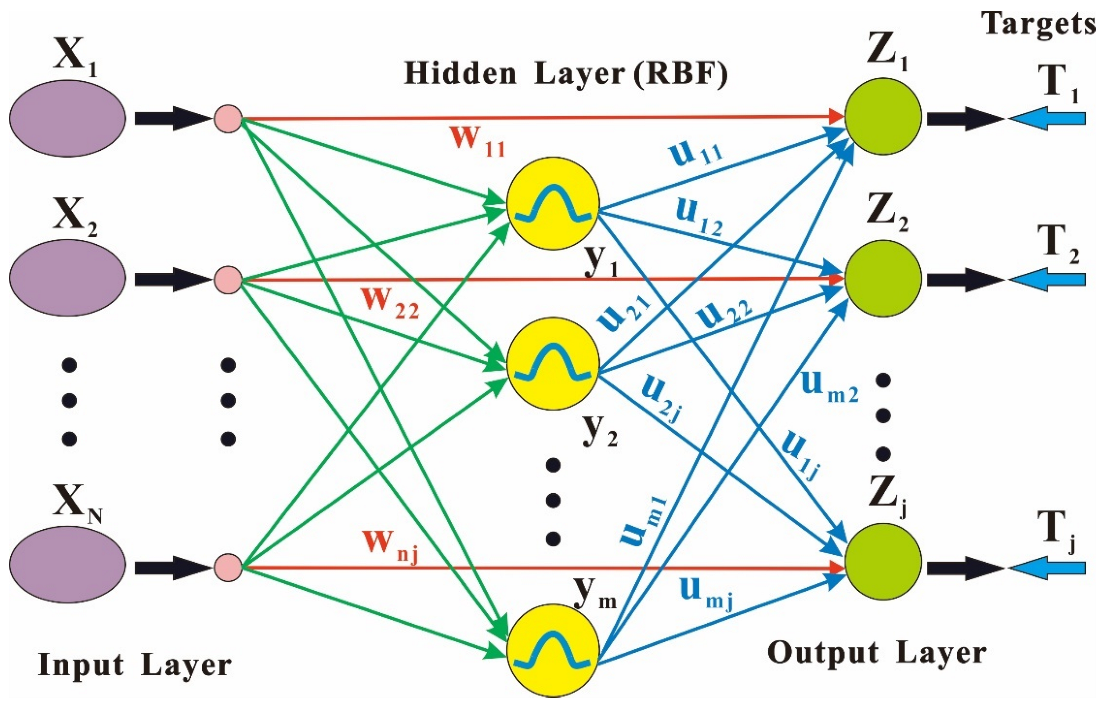
3. Radial Basis Functional Link Networks
RBFLN, proposed by Broomhead in 1988 [31], is a kind of ANN that can process complex nonlinear spatial datasets. RBFLN is of great importance in dealing with the nonlinear relationship between known deposits and evidence factor layers. Taking the known deposits and non-deposits as training samples [32,33,34], RBFLN identifies the RBF network relationship between these samples and evidence factors as a nonlinear neural network algorithm (NNA), comprising a three-layer feedforward structure: input layer, hidden layer, and output layer [35,36] (Figure 4). The RBFLN structure includes an input layer composed of N nodes which receive the input feature vector x and a hidden layer comprising M neurons, each of which is represented by a Gaussian RBF. Each neuron in the hidden layer receives the input feature vector x and outputs the value y. If is inputted into the mth neuron, the output value can be expressed as [37]:
where the value q ranges from 1 to N (N is the number of training samples), and the value M ranges from 1 to M (M is the number of neurons in the hidden layer). represents the nth input feature vector, refers to the center of the mth RBF in the hidden layer, which corresponds to the maximum likelihood point of the RBF, and represents the width or spread function of the mth neuron [34,38].

Figure 4.
Architecture diagram of RBFLN (modified from [34]).
The overall output feature vector z contributes to the linear combination of output weights. If the abovementioned is output to the jth output neuron, the formula can be expressed as [37]:
where represents the synaptic weight between the hidden layer and the input layer, whereas represents the synaptic weight between the input layer and the output layer. Additionally, the constant is added to the formula. The two synaptic weights were repeatedly modified through iteration processes until the output layer Z approached the target T.
4. Extraction and Integration of Geoscience Datasets
GIS technology was used to extract and process information on ore-forming anomalies based on the collected data of mineral geology (1:50,000), aeromagnetic anomalies (1:50,000), copper geochemistry in the Huili–Huidong area, comprehensive anomalies of chemical elements, and the remote sensing images presented in this paper.
The Beijing 54 projection coordinate system (PCS) was adopted in datasets, and the storage format was a grid (unit: m).
The information extraction of multivariate geoscience datasets in the study area is shown below:
- (1)
- Geological Information Extraction and Interpretation
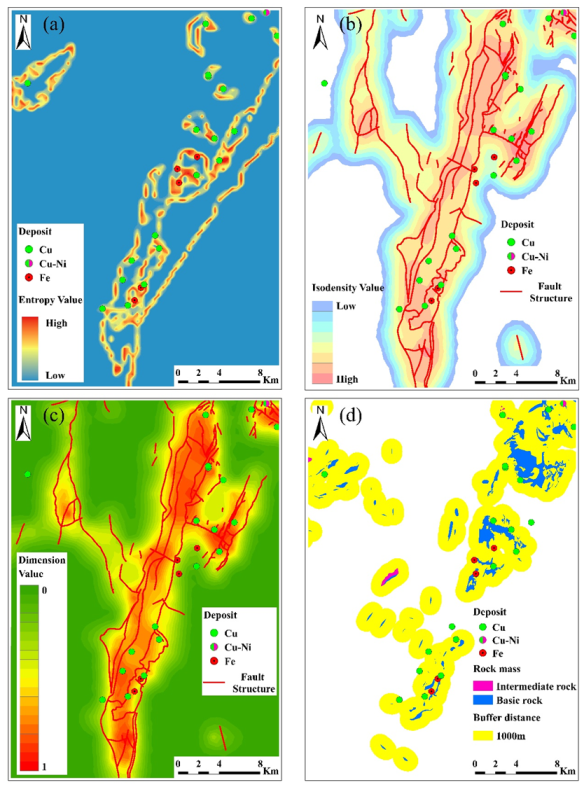
Using the mineral geological map (1:50,000) as a reference, we used MorPAS and ArcGIS software to extract four kinds of information on ore-forming anomalies: strata configuration entropy (Figure 5a), tectonic fracture isodensity (Figure 5b), tectonic fractal dimension (Figure 5c), and rock buffering (Figure 5d). Specifically, entropy can reflect the complexity of the structure. For instance, strata configuration entropy reveals the complexity of strata. There is a positive correlation between strata complexity and strata configuration entropy, and the latter changes with changes in the former [39]. From the perspective of space, tectonic fracture isodensity can be used to construct the development degree of information on anomalies in certain areas, which represents the cumulative sum of the tectonic length in a specific unit grid. Tectonic fractal dimension, an indicator to evaluate the complexity of fault structure, is positively correlated with the metallogenetic probability and has advantages over tectonic fracture isodensity. Magma intrusion is intense in this study area, and some magmatic rocks are occurrence ores. In addition, ores can be produced through magmatic rocks’ contact metasomatism with the surrounding rocks; thus, the peripheral parts of magmatic rocks are also favorable metallogenic sites.
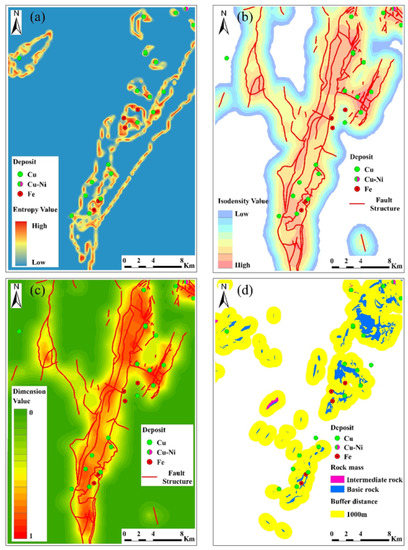
Figure 5.
(a) Formation combination entropy; (b) isodensity map of structural faults; (c) dimension value map of structural faults; (d) rock mass buffer distribution map.
- (2)
- Geophysical Information Extraction and Interpretation
According to the aeromagnetic anomaly data (1:50,000), information on the aeromagnetic ore-forming anomalies of the study (Figure 6) area was extracted. In our research, we collected physical property data measured by our predecessors in this study [26], providing an important reference for interpreting magnetic anomalies. From the aeromagnetic isoline map, most deposits were located in the zero-line area at the junction of positive and negative anomalies. In terms of the magnetic field characteristics, we found that the gentle negative magnetic fields in the study area were a comprehensive reflection of a weak magnetic basement and sedimentary cover; the strong magnetic arched, beaded, and disordered magnetic anomalies were a reflection of basic volcanic rocks; and some relatively regular strong magnetic anomalies were a reflection of basic and intermediate-basic intrusive rocks.
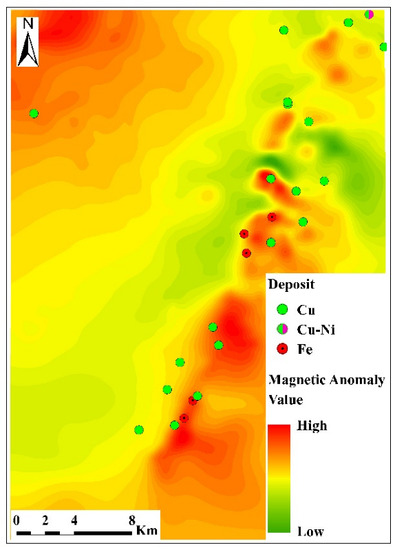
Figure 6.
Aeromagnetic anomaly map.
- (3)
- Geochemical Information Extraction and Interpretation
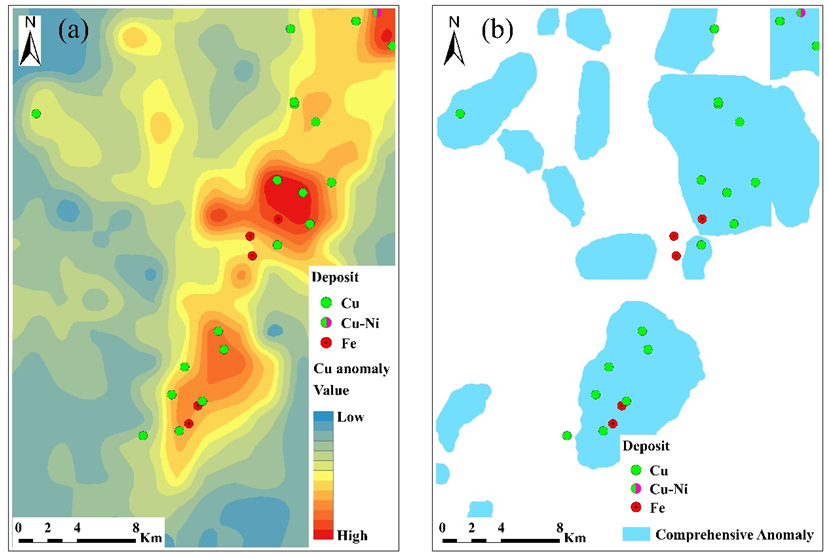
The Cu element anomaly map (Figure 7a) and the comprehensive anomaly map (Figure 7b) of Cu–Co–Mo elements in this study area were provided by the Development and Research Center of the National Geological Archives of China. The Cu anomaly directly indicated the existence of Cu deposits or mineralization, and the comprehensive Cu–Co–Mo anomaly indirectly indicated the existence of Cu deposits or mineralized zones.
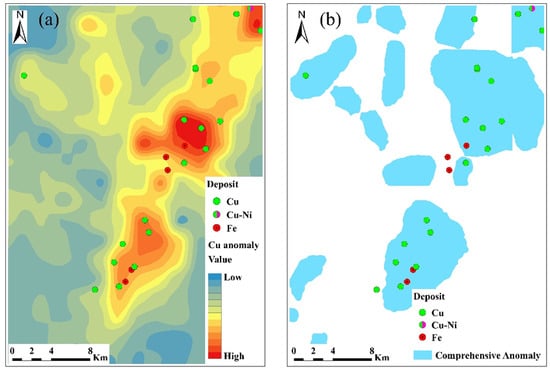
Figure 7.
(a) Map of Cu anomalies; (b) map of comprehensive anomalies.
- (4)
- Remote Sensing Information Extraction and Interpretation
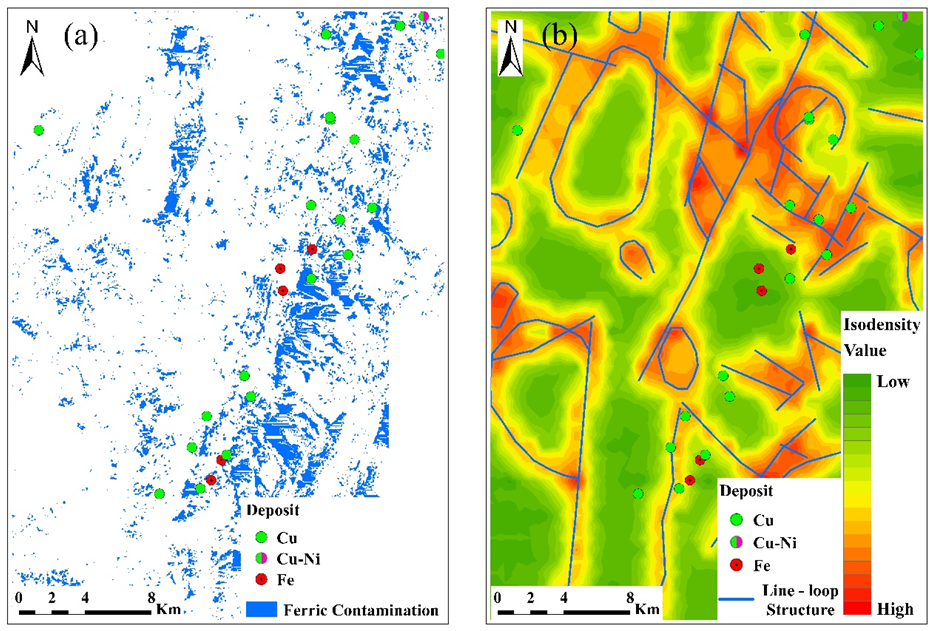
Different surface features of the earth display various spectral characteristics, and the altered surrounding rocks characterizing the existence of deposits and mineralized zones are no exception. Remote sensing technology can detect the altered surrounding rocks (if any) exposed on the earth’s surface. The abnormal data of remote sensing alteration information are also an important basis for indicating mineralization. The distribution map of iron-stained alterations (Figure 8a) and remote sensing tectonic information in this study area were provided by the Development and Research Center of the National Geological Archives of China. In ArcGIS, we first divided the study area into grids, in accordance with a certain grid size. After that, we counted the total degree of linear fracture in each grid, and we assigned this value to the center point of the grid. Finally, we spatially interpolated the point data, and we obtained the isodensity map of the line–ring structure (Figure 8b).
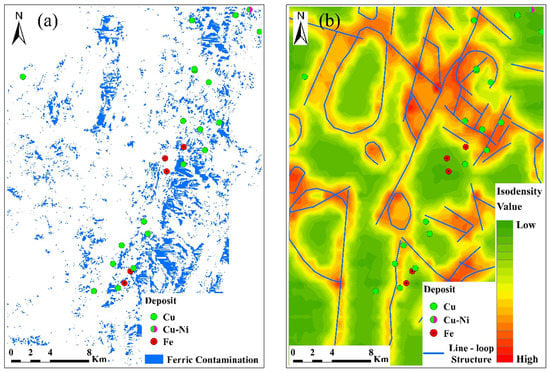
Figure 8.
(a) Distribution map of iron-stained alteration information; (b) iso-density map of line–loop structure.
5. Application of RBFLN in the Lala Copper Deposit
5.1. Training and Classification
According to the aforementioned geology–geophysics–geochemistry–remote sensing ore-forming information, we used GeoXplore 5.1 software, the SDM module of ArcGIS 10.5 software, which were both developed by Environmental Systems Research Institute (ESRI), and the RBFLN model to perform metallogenic prospect predictions in the study area.
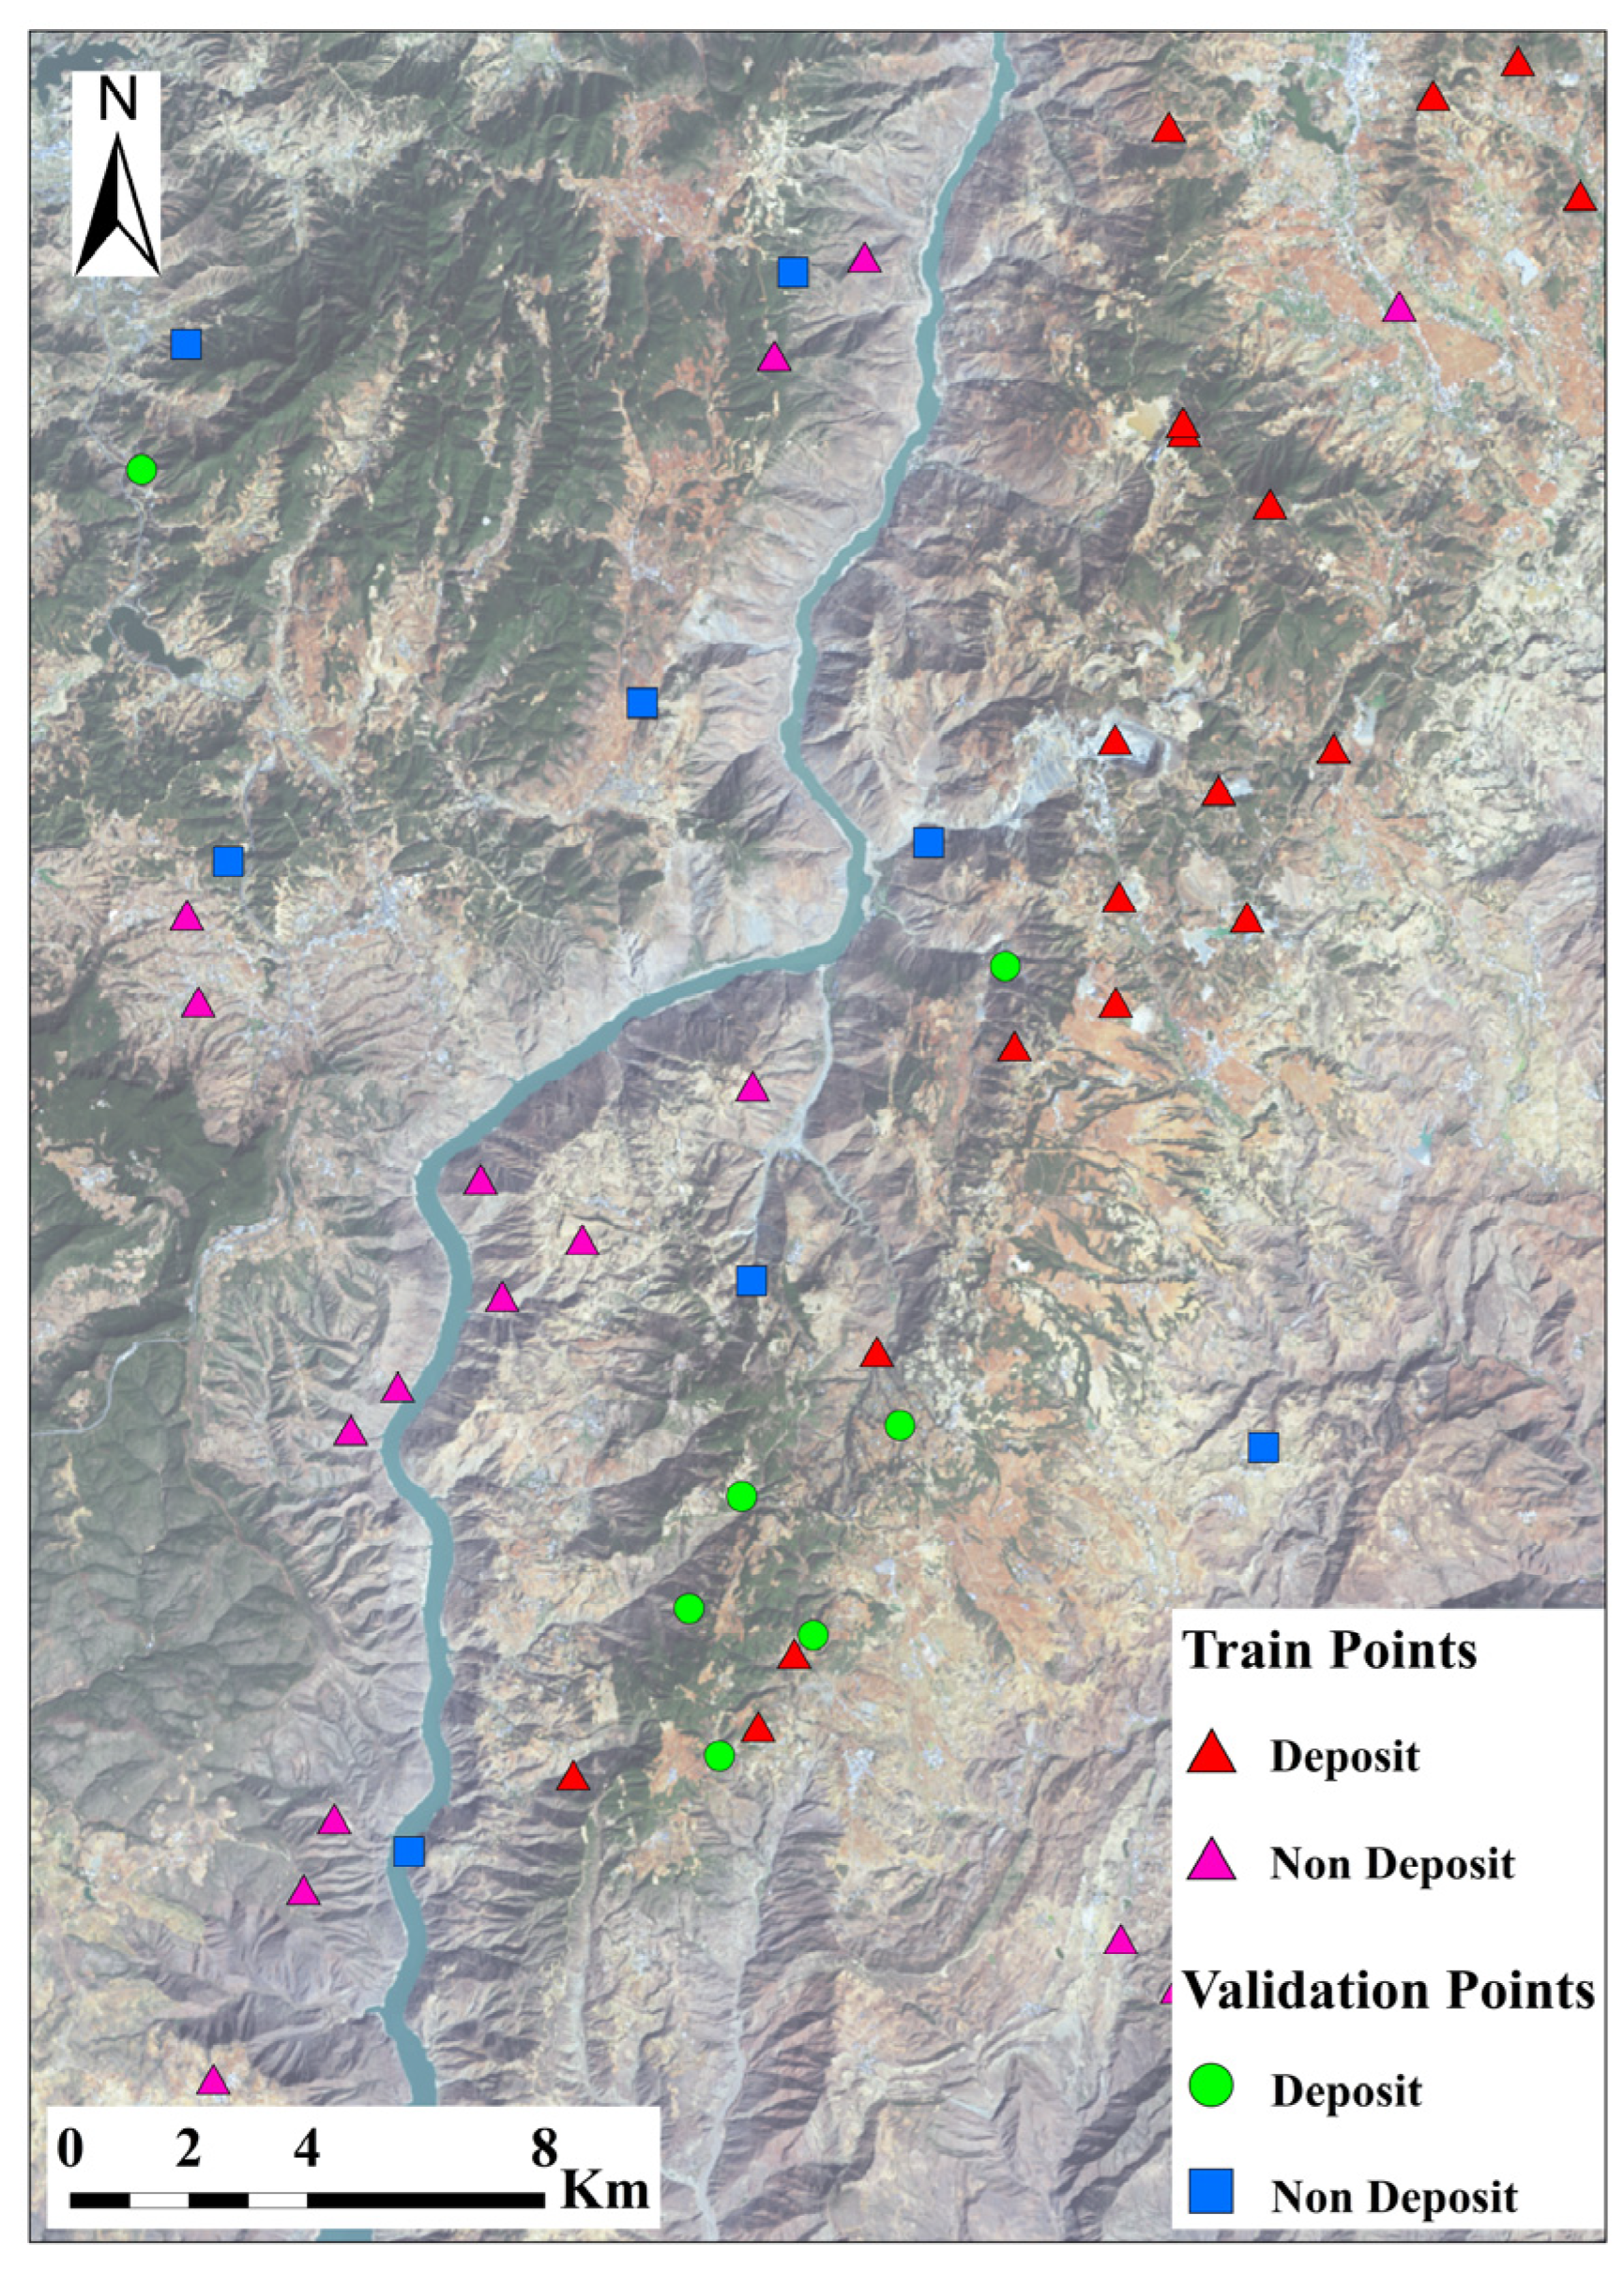
Twenty-five deposit sites and twenty-four non-deposit sites were involved in this research. A common way to evaluate the trained RBFLN was to use one-third of the training sites for verification and use the rest of the training sites to evaluate the network performance. Therefore, seven deposits and eight non-deposits were selected for verification, and eighteen deposits and sixteen non-deposits were chosen for training (Figure 9).
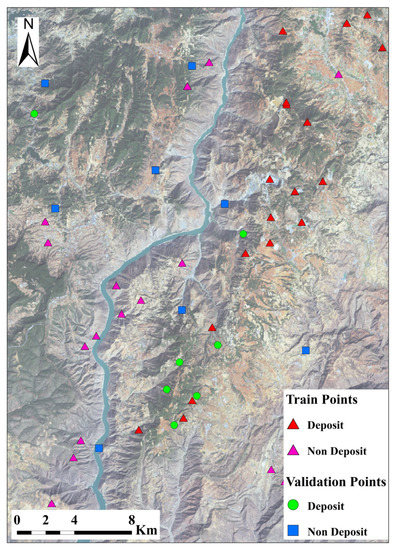
Figure 9.
Location map of deposits and non-deposit training and validation sites used for training the neural networks.
The nine abovementioned geoscience layers were combined by rasterization and reclassification, thus forming a unique grid. We divided the study area into a 100 m × 100 m grid scale, and the cumulative number of grids was 33,864. Each pixel in the grid data comprised feature vectors X (X1, X2, X3, X4, X5, X6, X7, X8, and X9) in the nine-dimensional space, which served as the input layer of the RBFLN model.
In the training stage, the number of RBFs and the number of iterations were changed to obtain the minimum sum of squared error (SSE) between the output result and the target vector [34]. SSE represented the mismatch degree between the output result and the target vector, and a smaller value contributed to a higher matching degree. With the gradual increase in the number of iterations, SSE showed a downward trend and tended to be stable (Figure 10). When the number of iterations increased by more than 160, the network seemed to be affected by over-learning, which led to overfitting [32,34].
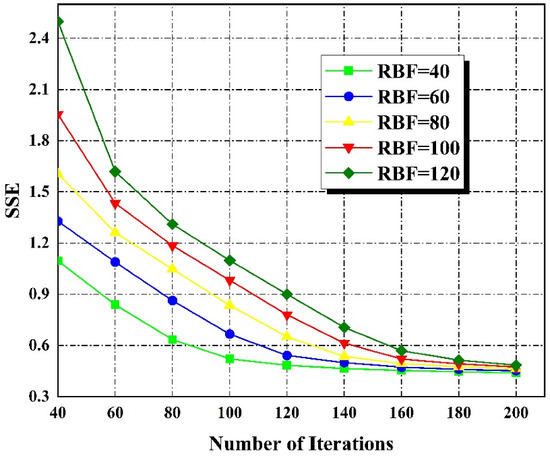
Figure 10.
Number of iterations versus SSE for selected number of RBFs.
5.2. Validation
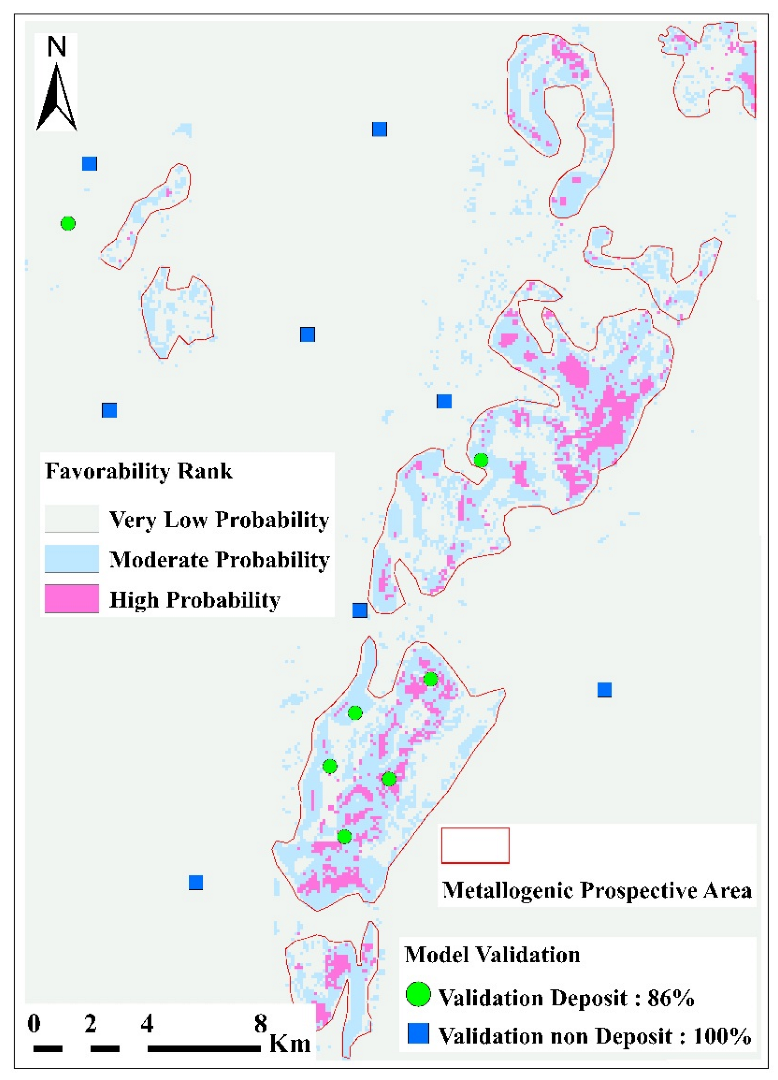
Accordingly, the results obtained through the RBFLN model with 40 RBFs and 120 iterations were selected to generate a probability output table with a value range of 0–1.577, which was normalized between 0 and 1. A relation graph of probability values and cumulative percentages of the study area was drawn (Figure 11), and the inflection points on the graph were calibrated to define the category intervals. Specifically, the posterior probability interval of the higher metallogenic target area was p ≥ 0.65, whereas that of the medium metallogenic target area was 0.49 < p < 0.65. Based on the features of the abovementioned intervals and the geological characteristics of the Lala concentration area, eight ore-prospecting prospective areas were delineated in this paper (Figure 12).
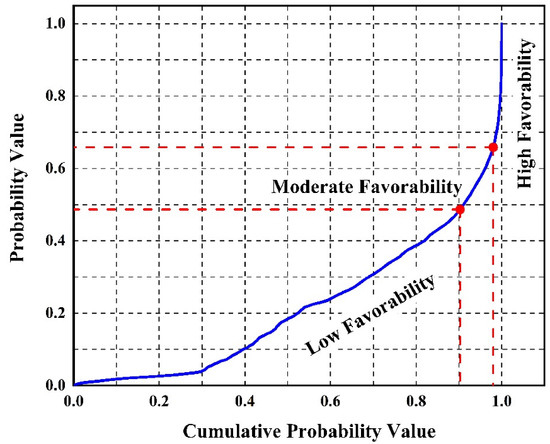
Figure 11.
The probability values and the cumulative percentages for the study area.
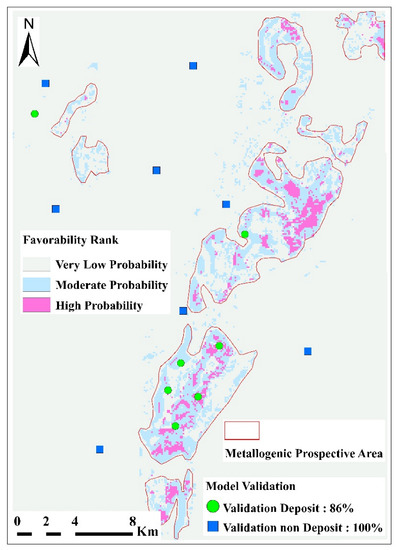
Figure 12.
Prospective map of mineralization.
The validation data in the previous section were used to evaluate the performance of the RBFLN. The results demonstrated that five of the seven verification deposits were delineated in high prospective areas, indicating that the classification accuracy of unknown features was 71%. Additionally, one verification deposit and all non-verification deposits were delineated in low prospective areas, and one verification deposit was delineated in a medium prospective area. The comprehensive verification manifested that 86% of the verification deposits were in high and medium prospective areas (Figure 12).
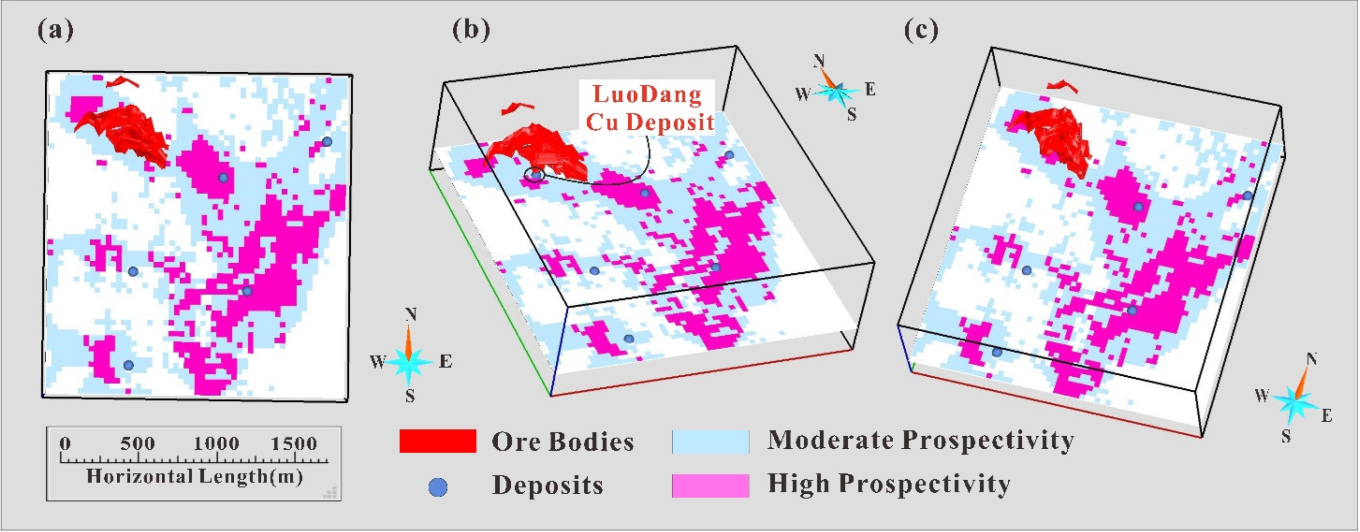
Moreover, 3D visualization technology can be used to verify the prediction results and the existing ore bodies in the Luodang mining area, further proving the performance of the RBFLN model (Figure 13). The results showed that the distribution range of ore bodies was consistent with the prediction results of the RBFLN model.
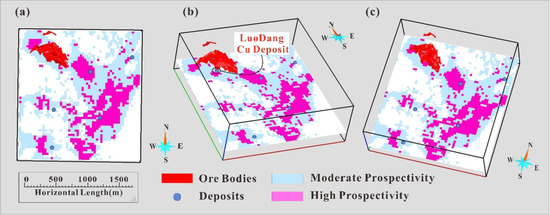
Figure 13.
Superposition map of the ore body model and metallogenic prospect area. (a) Top View; (b) Left view; (c) Right view.
6. Conclusions
- (1)
- We established a multivariate comprehensive ore-prospecting information model of geology–geophysics–geochemistry–remote sensing in the study area based on GIS technology, and we determined the existence of several ore-prospecting indicators (strata configuration entropy, tectonic fracture isodensity, tectonic fractal dimension, rock buffering 1 km, Cu geochemical anomalies, Cu–Co–Mo composite anomalies, aeromagnetic anomalies, alteration information, etc.). We adopted the RBFLN algorithm to conduct the metallogenic prediction of the Lala ore concentration area in Sichuan Province. Consequently, we successfully divided the secondary intervals of the higher metallogenic target area and medium metallogenic target area, and we determined eight ore-prospecting prospective areas by taking the above variables as predictors;
- (2)
- The distribution of high and middle prospective areas in the metallogenic prospective map revealed that the metallogenic conditions would be more favorable and the possibility of deposits would be higher if the strata were more complex, the fracture intersection was denser, and the aeromagnetic anomaly was higher;
- (3)
- In contrast to traditional metallogenic prediction methods, the RBFLN algorithm can solve complex nonlinear classification problems effectively and quickly. This algorithm features a simple calculating process, a rapid training speed, and an optimum approximation ability, which is conducive to processing a large amount of geological data and carrying out metallogenic prediction research;
- (4)
- The cross-validation of multivariate geoscience information in favorable ore-prospecting areas was made possible by 3D visualization technology, which provides a better reference for ore prospecting in deep areas. However, the disadvantage of this research lies in the absence of on-site verification. No on-the-spot investigations have been conducted because of the impacts of the COVID-19 pandemic. Therefore, the reliability of the RBFLN model results should be further verified through field exploration.
Author Contributions
Conceptualization, X.L. (Xiumei Lv); methodology, X.L. (Xiumei Lv); software, X.L. (Xiumei Lv) and X.L. (Xiaoning Liu); validation, W.Y. and G.W.; writing—original draft preparation, X.L. (Xiumei Lv); writing—review and editing, G.W. All authors have read and agreed to the published version of the manuscript.
Funding
This research received no external funding.
Data Availability Statement
Data sharing is not applicable.
Conflicts of Interest
The authors declare no conflict of interest.
References
- Xiao, K.; Xiang, J.; Fan, M.; Xu, Y. 3D Mineral Prospectivity Mapping Based on Deep Metallogenic Prediction Theory: A Case Study of the Lala Copper Mine, Sichuan, China. J. Earth Sci. 2021, 32, 348–357. [Google Scholar] [CrossRef]
- Journel, A.G.; Huijbregts, C.J. Mining Geostatistics; The Blackburn Press: New York, NY, USA, 1991; pp. 77–218. [Google Scholar]
- Matheron, G. Principles of geostatistics. Econ. Geol. 1963, 58, 1246–1266. [Google Scholar] [CrossRef]
- Matheron, G. The theory of regionalized variables and its appplication. Les Cah. Cent. Morphol. Mathématigue Fontainebleau. 1971, 5, 212. [Google Scholar]
- Verly, G.; David, M.; Journel, A.G.; Marechal, A. Geostatistics for Natural Resources Characterization; D. Reidel Publishing Company: Dordrecht, The Netherlands, 1984. [Google Scholar]
- Journel, A.G. Nonparametric estimation of spatial distributions. Math. Geol. 1983, 15, 445–468. [Google Scholar] [CrossRef]
- Yu, C.; Jiang, Y. The dynamic mechanisms of primary metal-zoning of cassiterite-sulfide deposits in the gejiu ore district, yunnan province. Acta Geol. Sin. 1990, 44, 226–237. (In Chinese) [Google Scholar]
- Xiao, K. The new development of minerogenetic regulation and prediction -the comprehensive information methods. Adv. Earth Sci. 1994, 9, 18–23. (In Chinese) [Google Scholar]
- Leite, E.P.; Filho, C.R.D.S. Probabilistic neural networks applied to mineral potential mapping for platinum group elements in the Serra Leste region, Carajás Mineral Province, Brazil. Comput. Geosci. 2009, 35, 675–687. [Google Scholar] [CrossRef]
- Wang, G.; Zhang, S.; Yan, C. 3D geological modeling with multi-source data integration in polymetallic region: A case study of Luanchuan, Henan Province, China. Earth Sci. Front. 2009, 16, 166–167. [Google Scholar]
- Yousefi, M.; Kreuzer, O.P.; Nykänen, V.; Hronsky, J.M. Exploration information systems—A proposal for the future use of GIS in mineral exploration targeting. Ore Geol. Rev. 2019, 111, 103005. [Google Scholar] [CrossRef]
- Chi, S.; Zhao, P.; Li, J. Application of GIS to Geo-anomaly-Based Delineation of Mineral Resources. J. China Univ. Geosci. 2000, 11, 164–167. [Google Scholar]
- Bonham-Carter, G.F.; Agterberg, F.P.; Wright, D.F. Integration of geological datasets for gold exploration in Nova Scotia. Photogramm. Eng. Remote Sens. 1988, 54, 1585–1592. [Google Scholar] [CrossRef] [Green Version]
- Wyborn, L.; Gallagher, R.; Raymond, O. Using GIS for mineral potential evaluation in areas with few known mineral occurrences. Second National Forum on GIS in the Geosciences-Forum Proc., Australian Geol. Surv. Organ. AGSO Record. 1995, 46, 199–211. [Google Scholar]
- Silva, E.C.E.; Silva, A.; Toledo, C.L.B.; Mol, A.G.; Otterman, D.W.; de Souza, S.R.C. Mineral Potential Mapping for Orogenic Gold Deposits in the Rio Maria Granite Greenstone Terrane, Southeastern Para State, Brazil. Econ. Geol. 2012, 107, 1387–1402. [Google Scholar] [CrossRef]
- Zhang, Z.; Zhang, J.; Wang, G.; Carranza, E.J.M.; Pang, Z.; Wang, H. From 2D to 3D Modeling of Mineral Prospectivity Using Multi-source Geoscience Datasets, Wulong Gold District, China. Nonrenew. Resour. 2020, 29, 345–364. [Google Scholar] [CrossRef]
- Li, R.; Wang, G.; Carranza, E.J. GeoCube: A 3D mineral resources quantitative prediction and assessment system. Comput. Geosci. 2016, 89, 161–173. [Google Scholar] [CrossRef]
- Li, R.; Wang, G.; Zhang, S.; Qu, J.; Zhu, Y.; Huang, L.; Yan, C.; Song, Y.; Han, J.; Ma, Z. Three dimensional quantitative ex-traction and intergration for geosciences information: A case study of the Luanchuan Mo ore district. Geol. Bull. China 2014, 33, 883–893. (In Chinese) [Google Scholar]
- Wang, G.; Zhang, S.; Yan, C.; Song, Y.; Sun, Y.; Li, D.; Xu, F. Mineral potential targeting and resource assessment based on 3D geological modeling in Luanchuan region, China. Comput. Geosci. 2011, 37, 1976–1988. [Google Scholar] [CrossRef]
- Köhler, M.; Hanelli, D.; Schaefer, S.; Barth, A.; Knobloch, A.; Hielscher, P.; Cardoso-Fernandes, J.; Lima, A.; Teodoro, A.C. Lithium Potential Mapping Using Artificial Neural Networks: A Case Study from Central Portugal. Minerals 2021, 11, 1046. [Google Scholar] [CrossRef]
- Skabar, A.A. Mapping Mineralization Probabilities using Multilayer Perceptrons. Nonrenew. Resour. 2005, 14, 109–123. [Google Scholar] [CrossRef]
- Behnia, P. Application of Radial Basis Functional Link Networks to Exploration for Proterozoic Mineral Deposits in Central Iran. Nonrenew. Resour. 2007, 16, 147–155. [Google Scholar] [CrossRef]
- Abedi, M.; Norouzi, G.-H.; Bahroudi, A. Support vector machine for multi-classification of mineral prospectivity areas. Comput. Geosci. 2012, 46, 272–283. [Google Scholar] [CrossRef]
- Chen, H.; Lin, L.; Pang, Z.; Cheng, Z.; Xue, J.; Tao, W.; Gong, L.; Shen, H. Construction and demonstration of an ore prospecting model for the Lala copper deposit in Huili, Sichuan. Earth Sci. Front. 2021, 28, 309–327. (In Chinese) [Google Scholar]
- Zhao, X.; Zhou, M. Fe-Cu deposits in the Kang dian region, SW China:a Proterozoic IOCG (iron-oxide-copper-gold) metallo-genic province. Miner. Deposita. 2011, 46, 731–747. [Google Scholar] [CrossRef]
- Zhu, Z.; Sun, Y. Direct re-os dating of chalcopyrite from the lala iocg deposit in the kangdian copper belt, China. Econ. Geol. 2012, 108, 871–882. [Google Scholar]
- Zhou, M.; Zhao, X.; Chen, W.; Li, X.; Wang, W.; Yan, D.; Qiu, H. Proterozoic Fe-Cu metallogeny and supercontinental cycles of the southwestern Yangtze Block, southern China and northern Vietnam. Earth Sci. Rev. 2014, 139, 59–82. [Google Scholar] [CrossRef]
- Shen, H.; Gong, L.; Chen, H.; Lin, L.; Deng, Y.; Zeng, L. A disscussion on the genetic model of the copper deposit in Lala copper orefied, Sichuan Province. Geol. Bull. China 2020, 39, 1233–1246. (In Chinese) [Google Scholar]
- Zhu, Z.; Tan, H.; Liu, Y.; Li, C. Multiple episodes of mineralization revealed by Re-Os molybdenite geochronology in the Lala Fe-Cu deposit, SW China. Miner. Depos. 2018, 53, 311–322. [Google Scholar] [CrossRef]
- Lin, L.; Chen, R.; Pang, Z.; Chen, H.; Xue, J.; Jia, H. Sulfide Rb-Sr, Re-Os and In Situ S Isotopic Constraints on Two Mineralization Events at the Large Hongnipo Cu Deposit, SW China. Minerals 2020, 10, 414. [Google Scholar] [CrossRef]
- Broomhead, D.S.; Lowe, D. Multivariable functional interpolation and adaptive networks. Complex Syst. 1988, 2, 321–355. [Google Scholar]
- Porwal, A.; Carranza, E.J.M.; Hale, M. Artificial Neural Networks for Mineral-Potential Mapping: A Case Study from Aravalli Province, Western India. Nonrenew. Resour. 2003, 12, 155–171. [Google Scholar] [CrossRef]
- Nykänen, V. Radial basis functional links nets used as a prospectivity mapping tool for orogenic gold deposits within the Central Lapland Greenstone Belt, Northern Fennoscandian Shield. Nat. Resour. Res. 2008, 17, 29–48. [Google Scholar] [CrossRef]
- Tessema, A. Mineral Systems Analysis and Artificial Neural Network Modeling of Chromite Prospectivity in the Western Limb of the Bushveld Complex, South Africa. Nonrenew. Resour. 2017, 26, 465–488. [Google Scholar] [CrossRef]
- Niros, A.D.; Tsekouras, G.E. A novel training algorithm for RBF neural network using a hybrid fuzzy clustering approach. Fuzzy Sets Syst. 2012, 193, 62–84. [Google Scholar] [CrossRef]
- Ghezelbash, R.; Maghsoudi, A.; Carranza, E.J.M. Performance evaluation of RBF- and SVM-based machine learning algorithms for predictive mineral prospectivity modeling: Integration of S-A multifractal model and mineralization controls. Earth Sci. Inform. 2019, 12, 277–293. [Google Scholar] [CrossRef]
- Looney, C.G. Radial basis functional link nets and fuzzy reasoning. Neurocomputing 2002, 48, 489–509. [Google Scholar] [CrossRef]
- Maepa, F.; Smith, R.S.; Tessema, A. Support vector machine and artificial neural network modelling of orogenic gold prospectivity mapping in the Swayze greenstone belt, Ontario, Canada. Ore Geol. Rev. 2021, 130, 103968. [Google Scholar] [CrossRef]
- Chi, S.; Zhao, P. Application of combined-entropy anomany of geological ormations to delineation of preferable ore-finding area. Mod. Geol. 2000, 14, 423–428. (In Chinese) [Google Scholar]


Publisher’s Note: MDPI stays neutral with regard to jurisdictional claims in published maps and institutional affiliations. |
© 2022 by the authors. Licensee MDPI, Basel, Switzerland. This article is an open access article distributed under the terms and conditions of the Creative Commons Attribution (CC BY) license (https://creativecommons.org/licenses/by/4.0/).