Article

UAV, GIS, and Petrographic Analysis for Beachrock Mapping and Preliminary Analysis in the Compressional Geotectonic Setting of Epirus, Western Greece

by
Konstantinos G. Nikolakopoulos
*,
Ioannis K. Koukouvelas
and
Paraskevi Lampropoulou
Department of Geology, University of Patras, 265 04 Patras, Greece
*
Author to whom correspondence should be addressed.
Minerals 2022, 12(4), 392; https://doi.org/10.3390/min12040392
Submission received: 14 February 2022 / Revised: 17 March 2022 / Accepted: 20 March 2022 / Published: 23 March 2022
(This article belongs to the Special Issue Application of UAV and GIS for Geosciences)

Abstract

:
Beachrocks are generally mapped on the coastline surface and/or in a low depth in the subtidal zone in coastlines and are cemented chiefly by carbonate material. Their outcrops may vary from a tenth of meters to a tenth of kilometers in length. Along the Epirus coast, in Greece, beachrocks outcrops are laying on the coastline for more than ten kilometers. In the present work, we used Unmanned Aerial Vehicles (UAVs), in situ sampling, and the Geographical Information System (GIS) to map three beachrock areas with a length of 500 m to 600 m each. In synergy with extended mineralogical and petrographic analyses, we provide preliminary data about the geographical distribution and the mineralogical differences of these beachrocks. Furthermore, for the first time, we tried to investigate the correlation between the geotectonic setting of the broader area and the beachrock extent, shape, and petrographic parameters. The laboratory analyses proved that the beachrocks belong to a similar depositional zone of a marine–vadose environment. Despite variations in the textural petrographic, features among the specimen’s analyses permit us to consider these sedimentary rocks as not a uniform outcrop. It is indicated that the beachrock formation and the cementation progress in the study area are both controlled by active reverse faults and diapiric or tectonic anticlines.

1. Introduction

The earth’s coastal systems changed at the end of the Pleistocene, and their study brings critical information for understanding future changes [1,2,3,4,5]. Since that era, and as the planet became warmer in the early and middle Holocene, the sea surface has risen more than 100 m and has notably contributed to the formation of the current coastal zone. Almost 4000 years ago, the quick uplift of the sea-level surface slowed down or was almost brought to its end [6]. From that time, the evolution of the coastal zone was influenced mainly by natural processes together with the influence of more and more intense human activities. The changes due to those two factors are, significantly, of lower magnitude than those provoked by the eustatic changes of the sea surface in the duration of millennia; however, they can be marked and measured as they are quite worthy of attention. The beachrocks, which can be formatted in the interval of some centuries, are considered a true mark of the former seawater surface and the changes of coastal configuration for sea-level studies of lithifying, thus preserving shoreline facies if the tidal range is small [7,8,9].
Beachrocks are usually formatted through the rapid merging of sediments gathered nearby the shoreline. Beachrocks are generally mapped on the coastline surface and/or in a low depth in the subtidal zone in tropical and/or subtropical coastlines and are cemented chiefly by carbonate material [10,11,12,13,14,15,16]. In some cases, beachrock formations have been reported in higher latitudes, such as Scotland and Northern Ireland [17,18,19]. They consist of sediments of different sizes and of inorganic and/or biogenic origin [12,18,20]. The length of a beachrock may vary from a tenth of meters to a tenth of kilometers, while their width is smaller. The beachrocks’ width varies between some decades of centimeters to almost 400 m. The thickness varies from a few centimeters to 2–3 m. The beachrocks are deposited in plane layers, and they present low slopes following the general inclination of the beach [21] or even higher slopes than the broader beach [22,23]. As the beachrocks are formatted in the equilibrium zone between the inland and saltwater, they are used as indicators of past coastlines. There are hundreds of studies about beachrock worldwide as their existence is a sign of sea-level rise or retreat [7,13,24].
Even if there are many studies on the beachrock sediment analysis [25,26,27,28] and beachrock dating of sediments [29,30], there are very few studies on the use of diverse remote sensing data [31,32,33,34] and only two studies using Unmanned Aerial Vehicles (UAVs) for beachrock mapping [35,36].
Using a Landsat TM image, [31] discovered and mapped a beachrock that formed a former shoreline at 25 m below the sea surface in Northeastern Brazil. The spatial distribution of beachrocks and old shorelines was extracted by remote sensing image processing [32]. Using small videos collected every daylight hour and feature detection algorithms, [33] mapped an underwater beachrock located about 50 m to 80 m offshore. Aerial images with a spatial resolution of 50 cm were processed in order to delimit a beach rock with a 1.4 km length located on the coast of South Africa [34]. A small commercial UAV and a small compact camera were used for the beachrock mapping and the classification of the broader coastline area in Indonesia [36]. The synergy of data derived from a small commercial UAV, an Unmanned Surface Vehicle, and measurements performed with a Global Navigation Satellite System (GNSS) for the mapping of a beachrock were used in Syros Island, Greece [35].
Over the last decades, several research papers highlighted the change of the coastal geomorphology during the past 4000 years worldwide and in the East Mediterranean [1]. Particularly, based on abundant archaeological remains and literary and historical references from the last few millennia, these changes are more profound along the coasts of the Mediterranean Basin [37,38,39,40]. However, the costal geomorphology analysis is not a simple task since across these environments there is the interplay of deposition or erosion occurring along with tectonic movements, eustatic sea-level changes, and anthropogenic influences.
In the present work, we used Unmanned Aerial Vehicles (UAVs) and Geographical Information System (GIS) to map three areas across the Epirus coast, Greece, trying to provide preliminary data about the geographical distribution and the mineralogical differences of beachrocks across the east shoreline of the Ionian Sea. Furthermore, for the first time, we tried to investigate the correlation between the geotectonic status of the Epirus coastal area and the beachrock extent, shape, and composition.

2. Geological Setting of the Study Area

Epirus is the northwestern province of Greece, bound to the east by the predominant Pindos Mountains chain and to the west by the Ionian Sea. A simplified geotectonic map of Greece modified after [41] is presented in (Figure 1). The landscape of this area includes a series of compressional alpine tectonic events, beginning in the Jurassic and continuing through today, forming the pervasive NW-SE structure of the Hellenides orogenic belt [42,43]. In parallel with this structure, ranges and basins develop in Epirus bound by compression faults (Figure 2) [44,45]. Thus, the relief variation in Epirus between the ranges and basins is a function of the fault array crossing through the area and in addition to the different lithologies, such as limestone and flysch or Neogene sediments [44]. Shorter scale E-W trending structures are strike-slip or transfer character faults bordering NW-trending thrust faults and play a crucial role in the formation of post-Alpine basins [44]. Post-Alpine basins in the area include marine to terrestrial sediments and a well-developed alluvial zone close to river beds and present-day coastlines (Figure 2). Present-day seismicity across the coast of Epirus is associated with a compression stress regime [43,45,46,47,48,49].
The post-Alpine basins exposed in the broader study area comprise marine to terrestrial sediments and a well-developed alluvial zone close to river beds and present-day coastlines (Figure 2). In addition, the study area comprises an assemblage of palaeo- and present-day coastal landforms and incising rivers suggesting active deformation. A prominent active reverse fault and two anticlines affecting the Pliocene–Pleistocene rocks in the study area run parallel with the coastline (Figure 2). Furthermore, this coastline from the south (Kanalia village) to the north (Loutsa village) shows varying geomorphic characteristics that allow for the separation of the coast into two distinct segments on the basis of topographic, geomorphologic, and geodynamic characteristics. From south to north, the segments are the Kanalia embayment and the Loutsa segment. These two coast segments are separated by the Kastrosykia headland (Figure 2).
In the Kanalia embayment, the coastal geomorphic features are superimposed over Pliocene-Pleistocene rocks with rugged topography. In the south, a coastal alluvial plain comprising Quaternary sediments is present landward. In the north segment, the prominent feature is the presence of rocky cliffs along the coastline and a narrow coastal zone. The existence of the rocky coast is in direct relation with a linear diapiric dome and steeply westward inclined Pliocene- Pleistocene rocks. In these two coastal segments, we selected four sites to collect our samples and mapped three of them (Figure 2). These coastal sites are sandy and develop seaward of Pliocene to Pleistocene deposits. In the Kanalia embayment, there is also the estuary of the Arethonas River. In all sampling sites, beachrocks are inclined primarily seawards (westwards) except in the Kanalia site where there are beachrocks also dipping inland. Particularly, in the Kanalia site, the beachrock developed on fine-grained mash deposits, while in the remaining areas, the basement of the beachrock outcrops was not exposed. Sampling was performed, and photos were taken in the three study areas. In Figure 3, Figure 4 and Figure 5, photos from the study areas are presented.

3. Mapping and Sampling Methods

We took all our samples and acquired all UAV photos at the low tide, i.e., between 09:00 and 10:00 in the morning. Furthermore, we have measurements of the tide height through different online websites (https://www.worldtides.info/, last accessed on 13 February 2022; https://tides4fishing.com/gr/ionian-islands/antipaxos, last accessed on 13 February 2022 http://www.ioc-sealevelmonitoring.org/station.php?code=prev, last accessed on 13 February 2022) and the overall tide height was measured at less than ±15 cm, and it was negligible.
For the beachrock mapping, three UAV flight campaigns were performed using a lightweight DJI UAV (Phantom 4 pro v2). The Phantom 4 pro v2 was equipped with a 20 MP camera resulting in photos of 5472 × 3648 pixels. The camera has a global shutter. The flights were performed at an altitude of 80 m above ground level, and the captured photos have a pixel size of 2.2 cm. Each flight campaign was scheduled with a 90% along and 75% across the track overlap of photos. In the field, two kinds of ground control targets were placed onshore and offshore in order to be detected and used as ground control points. As presented in Figure 6, black and white targets were placed on the beach, while large rectangular aluminum targets were deployed in the shallow water along the beach rock formations. The targets were measured with a Real-Time Kinematic Global Navigation Satellite Sensor (Leica GS08, Leica Geosystems AG Heerbrugg, Switzerland). The aluminum targets have specific dimensions and four holes at the corners in order to be used for the precise measurement with the GNSS sensor in the shallow water. In Figure 7, the aluminum target is presented on the final orthophoto. As it can be seen in Figure 7, the target is clearly detected in the shallow water. Measurements of the ground control points onshore and offshore assured the great accuracy of the final orthophotos and Digital Surface Models derived from the UAV data. The photogrammetric processing of the UAV data was performed on Agisoft PhotoScan (version 1.7.4 build 13028) software as described in more detail in previous studies [35,51].
Extended sampling was performed, and the samples were analyzed in the laboratory as described in the next paragraphs. With regards to the collected samples KAN2, KAN2-1, and KAN2-3 derived from the south region (near Kanalia village), KAN1 and 3 were collected from the middle study area, whilst L1 and LY1 belong to the northern sampling site.
The orthophotos were imported in an ARCMap, and the extent of the beach rocks was calculated. The beach rock in area I has a length of 581 m, while its width ranges from 6 m to 87 m.
The beach rock in area II has a length of 580 m, while its width ranges from 4.6 m to 76 m. It is fragmented into several small pieces of less than 2 square meters’ extent.
The beachrock in area III has a length of 608.5 m, while its width ranges from 6.6 m to 22.5 m. About half of the beach rock is laid on the beach outside of the seawater.

4. Mineralogical and Petrographic Analyses

4.1. Analytical Methods

Selected samples of three different areas were analyzed according to their petrographic features by combined methods. Mineralogical study of specimens was determined by XRD analysis using a Bruker D8 system (Billerica, MA, USA) with Ni-filtered and CuKα radiation, accelerating at 40 kV, 40 mA. The random powder prepared samples were analyzed after scanning at the area of 2–70°2θ. The minerals were detected by the DIFFRACplus EVA 12® software (Bruker-AXS, Billerica, MA, USA) based on the ICDD Powder Diffraction File of PDF-2, 2006, while for the semi-quantitative analysis, the TOPAS4® software was used (TOPAS MC Inc., Oakland, CA, USA) based on the Rietveld method. Moreover, polished thin sections of samples were studied under a petrographic polarizing microscope (Leica Microsystems Leitz Wetzlar, Germany). The study on textural and mineralogical characteristics of samples was completed by the use of a scanning electron microscope, SEM JEOL 6300 (Tokyo, Japan), equipped with an Energy Dispersive Spectrometer (EDS) (accelerating at 20 kV) and gold-coated, randomly broken surfaces of samples, as well as carbon-coated thin sections.

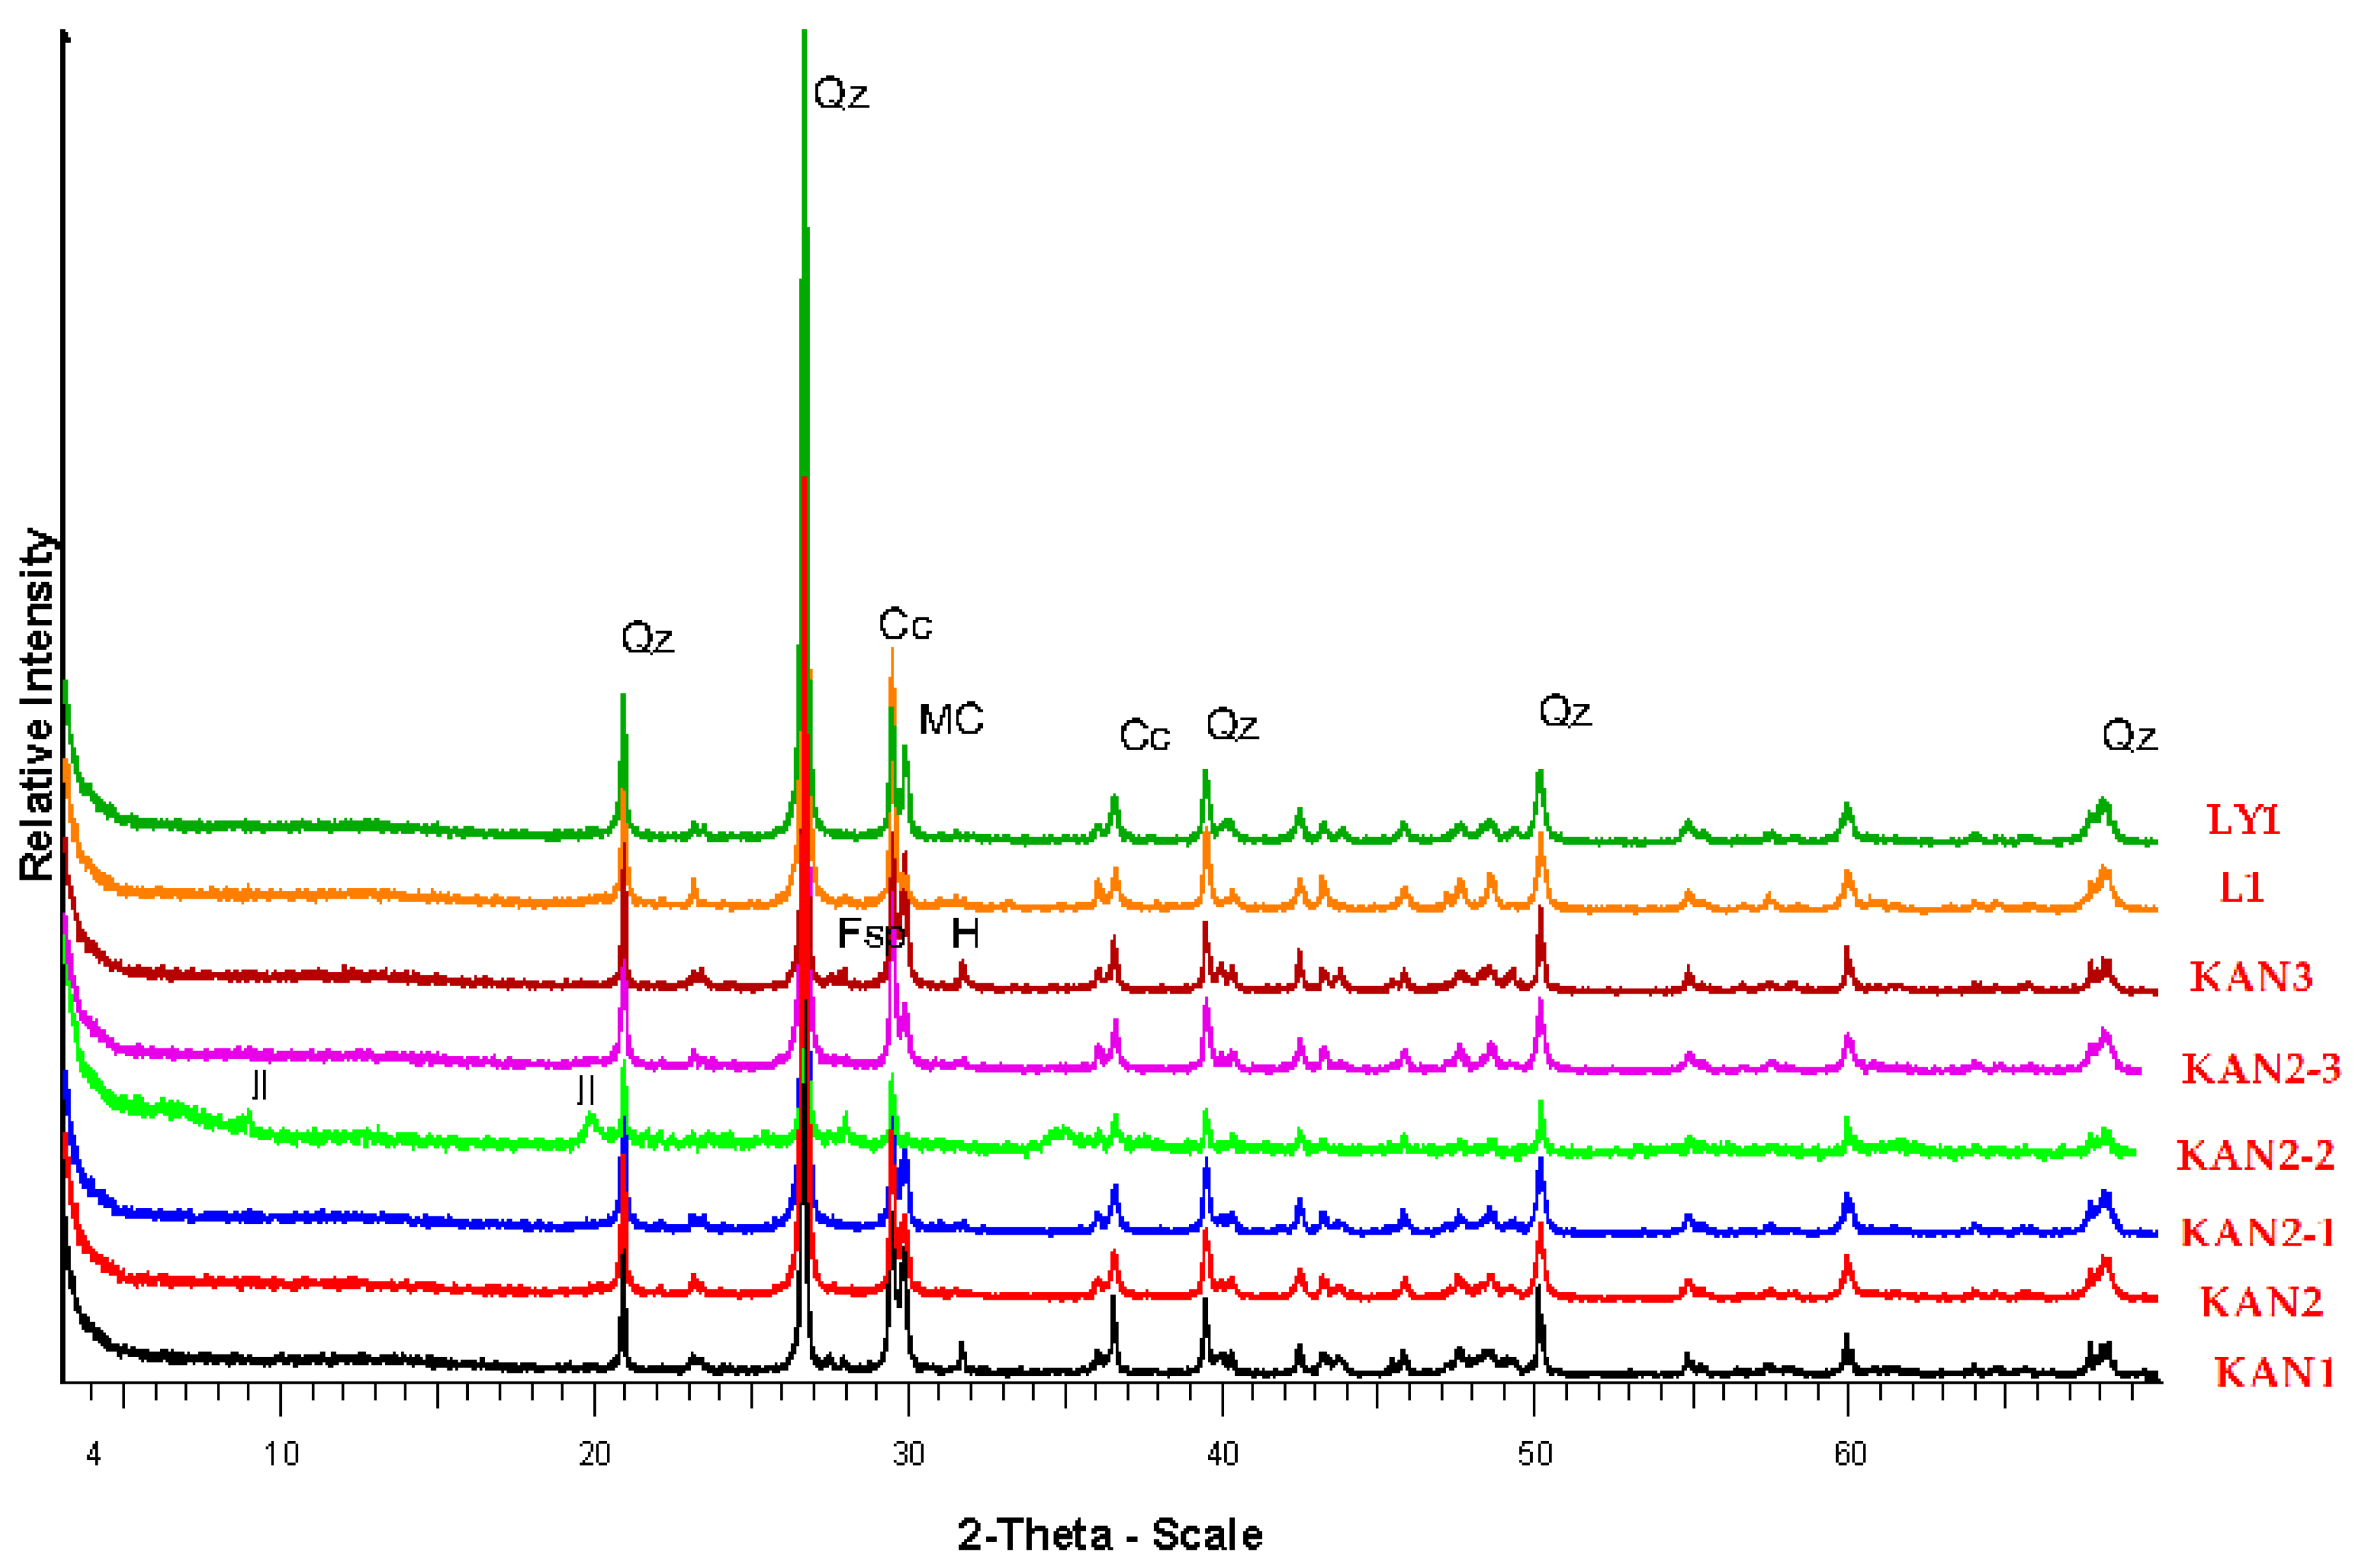
4.2. Mineralogical Analyses and Microstructures Representative XRD Analysis

According to the XRD results, the collected samples (Figure 8) present similar qualitative mineral compositions, whilst quantitative calculations indicate some variations (Table 1). They are comprised of quartz, carbonates (calcite and Mg-calcite), alkali feldspars (albite), ±illite, and ±halite, reflecting their source from similar rock lithologies over the broad area (mainly rocks of the Ionian unit, see Figure 1). The major phase of quartz in analyzed beachrocks varied from 51 wt% (sample KAN2-2) to 73 wt% (sample LY1), while carbonates ranged from 10 wt% (sample KAN2-2) to 41 wt% (sample KAN-3). Calcite mineral’s content ranged from 10 wt% (sample KAN2-2) to 21 wt% (sample KAN1), while Mg-calcite ranged between 0 wt% (sample KAN2-2) and 29 wt% (sample KAN3). These variations could be attributed to several factors, such as the composition of initial rock sources, the clastic material’s transportation way to the deposition environment, and the dynamic conditions of the coastal environment. In the KAN2-2 sample with the lower content of quartz and calcite, significant amounts of illite were detected (36 wt%) compared to the other without or with minor analyzed clays.

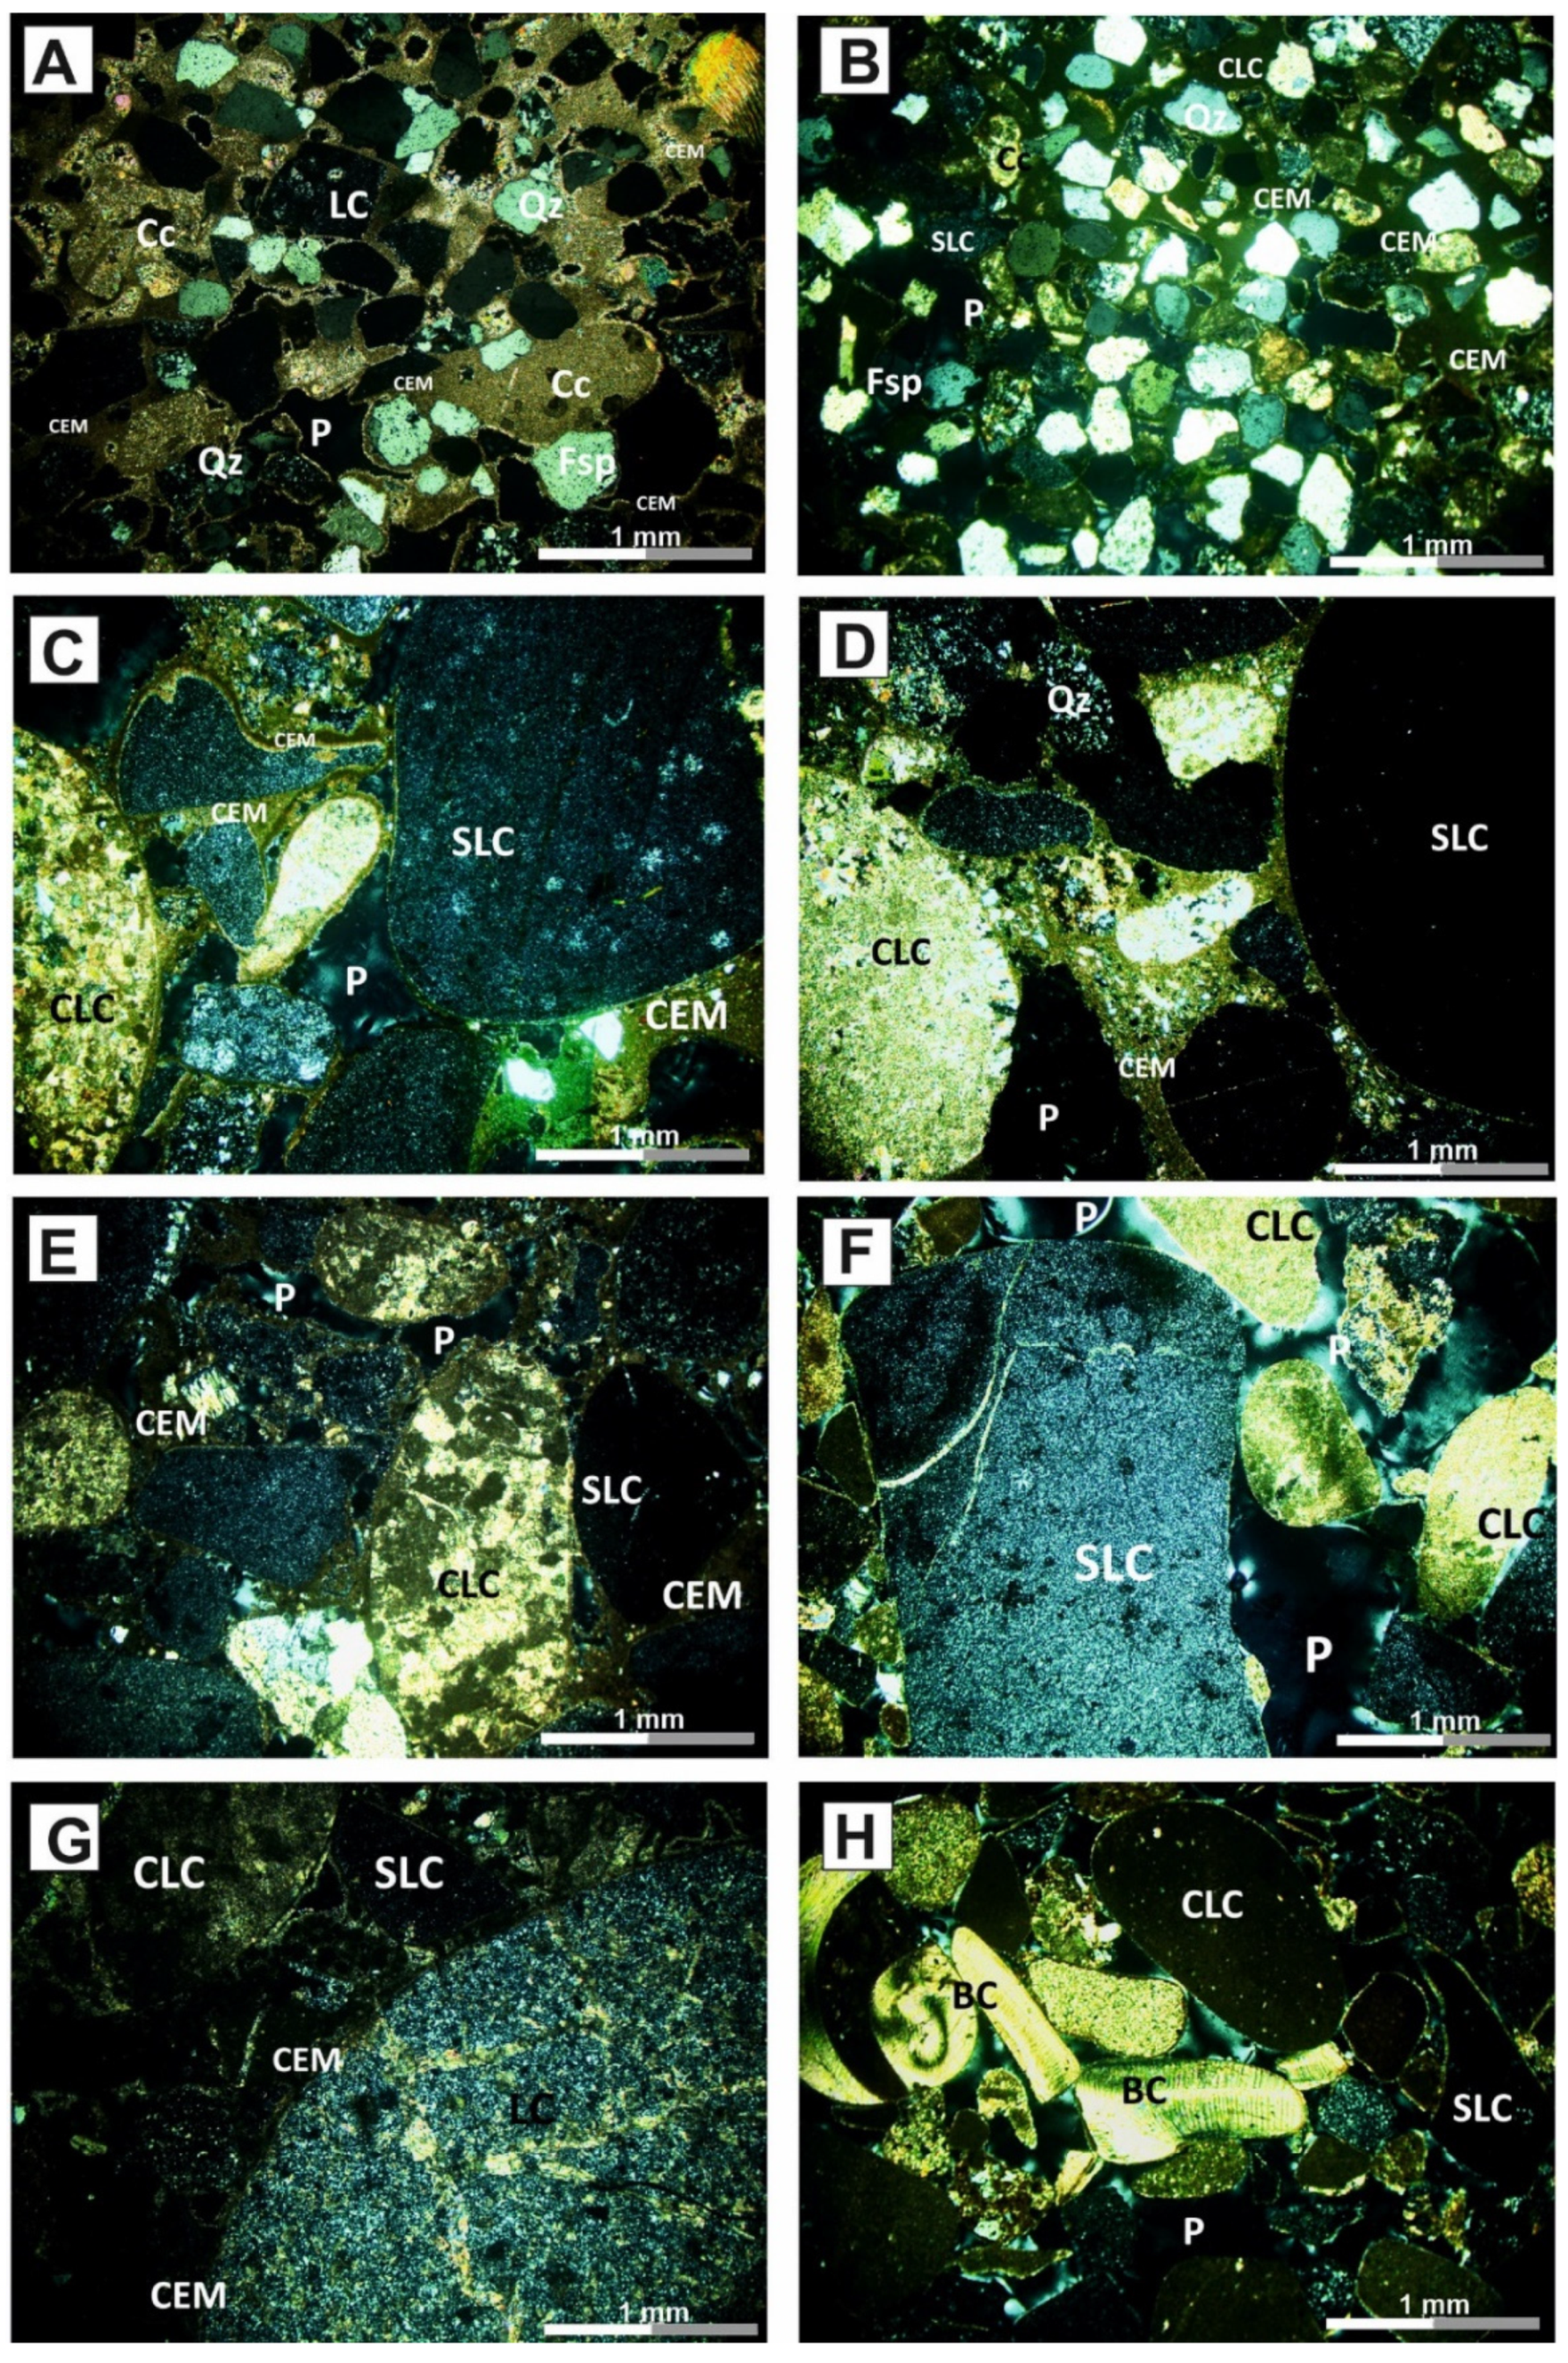
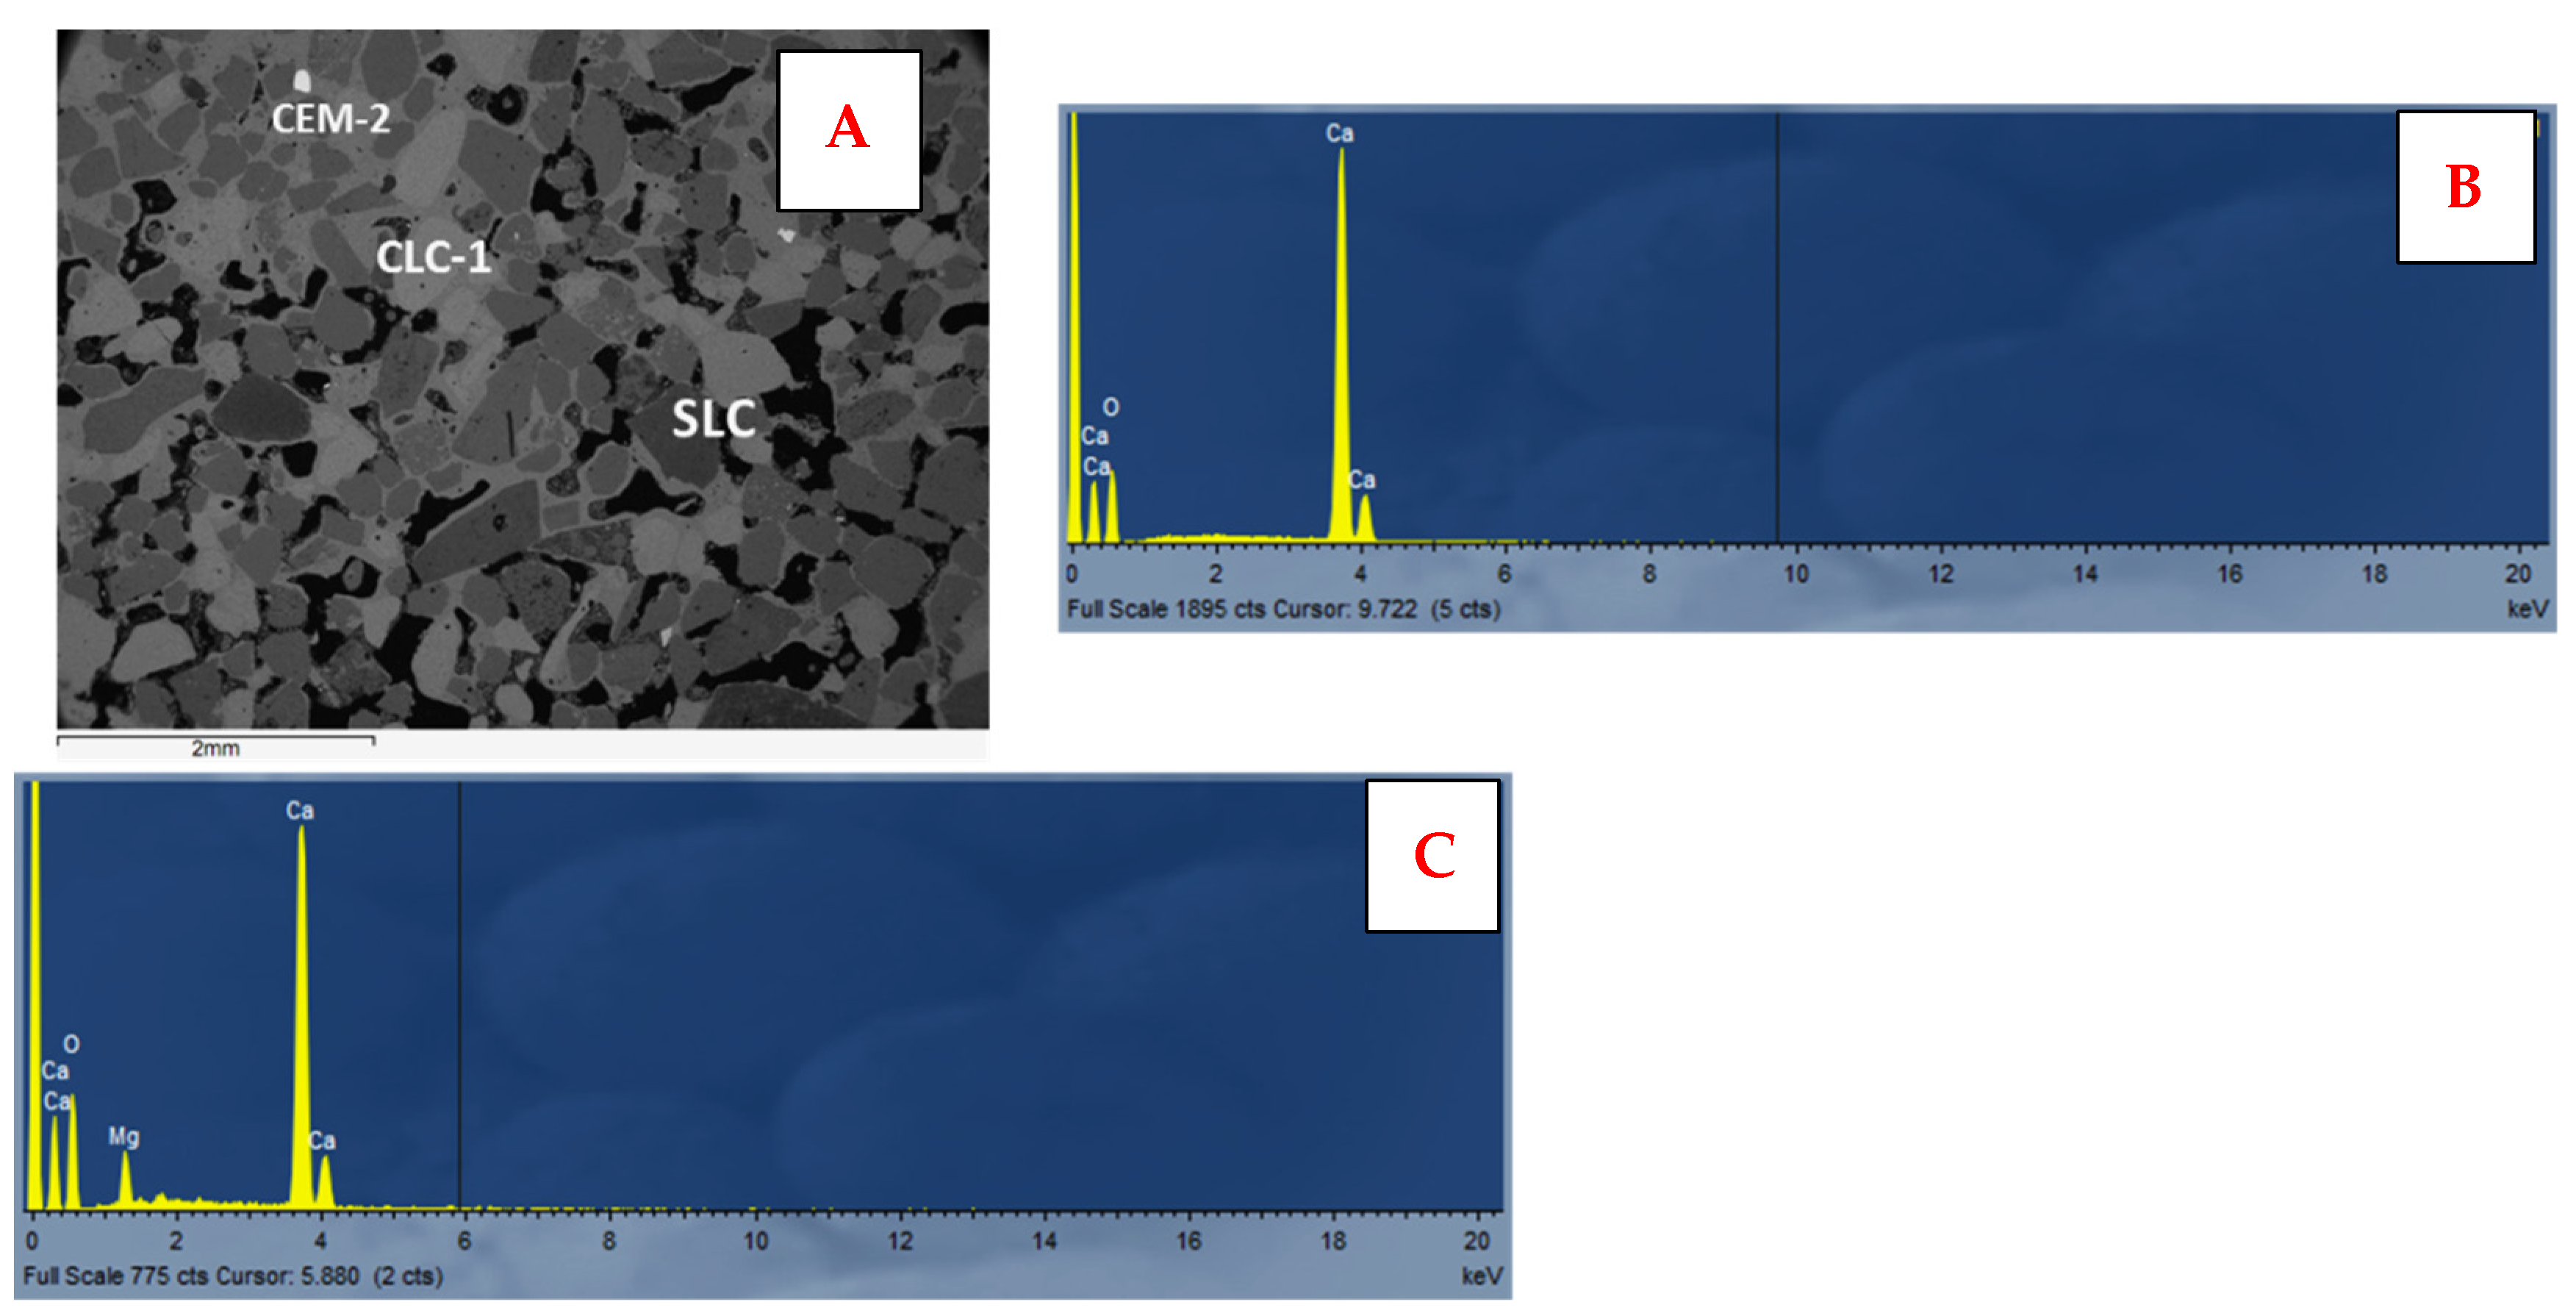
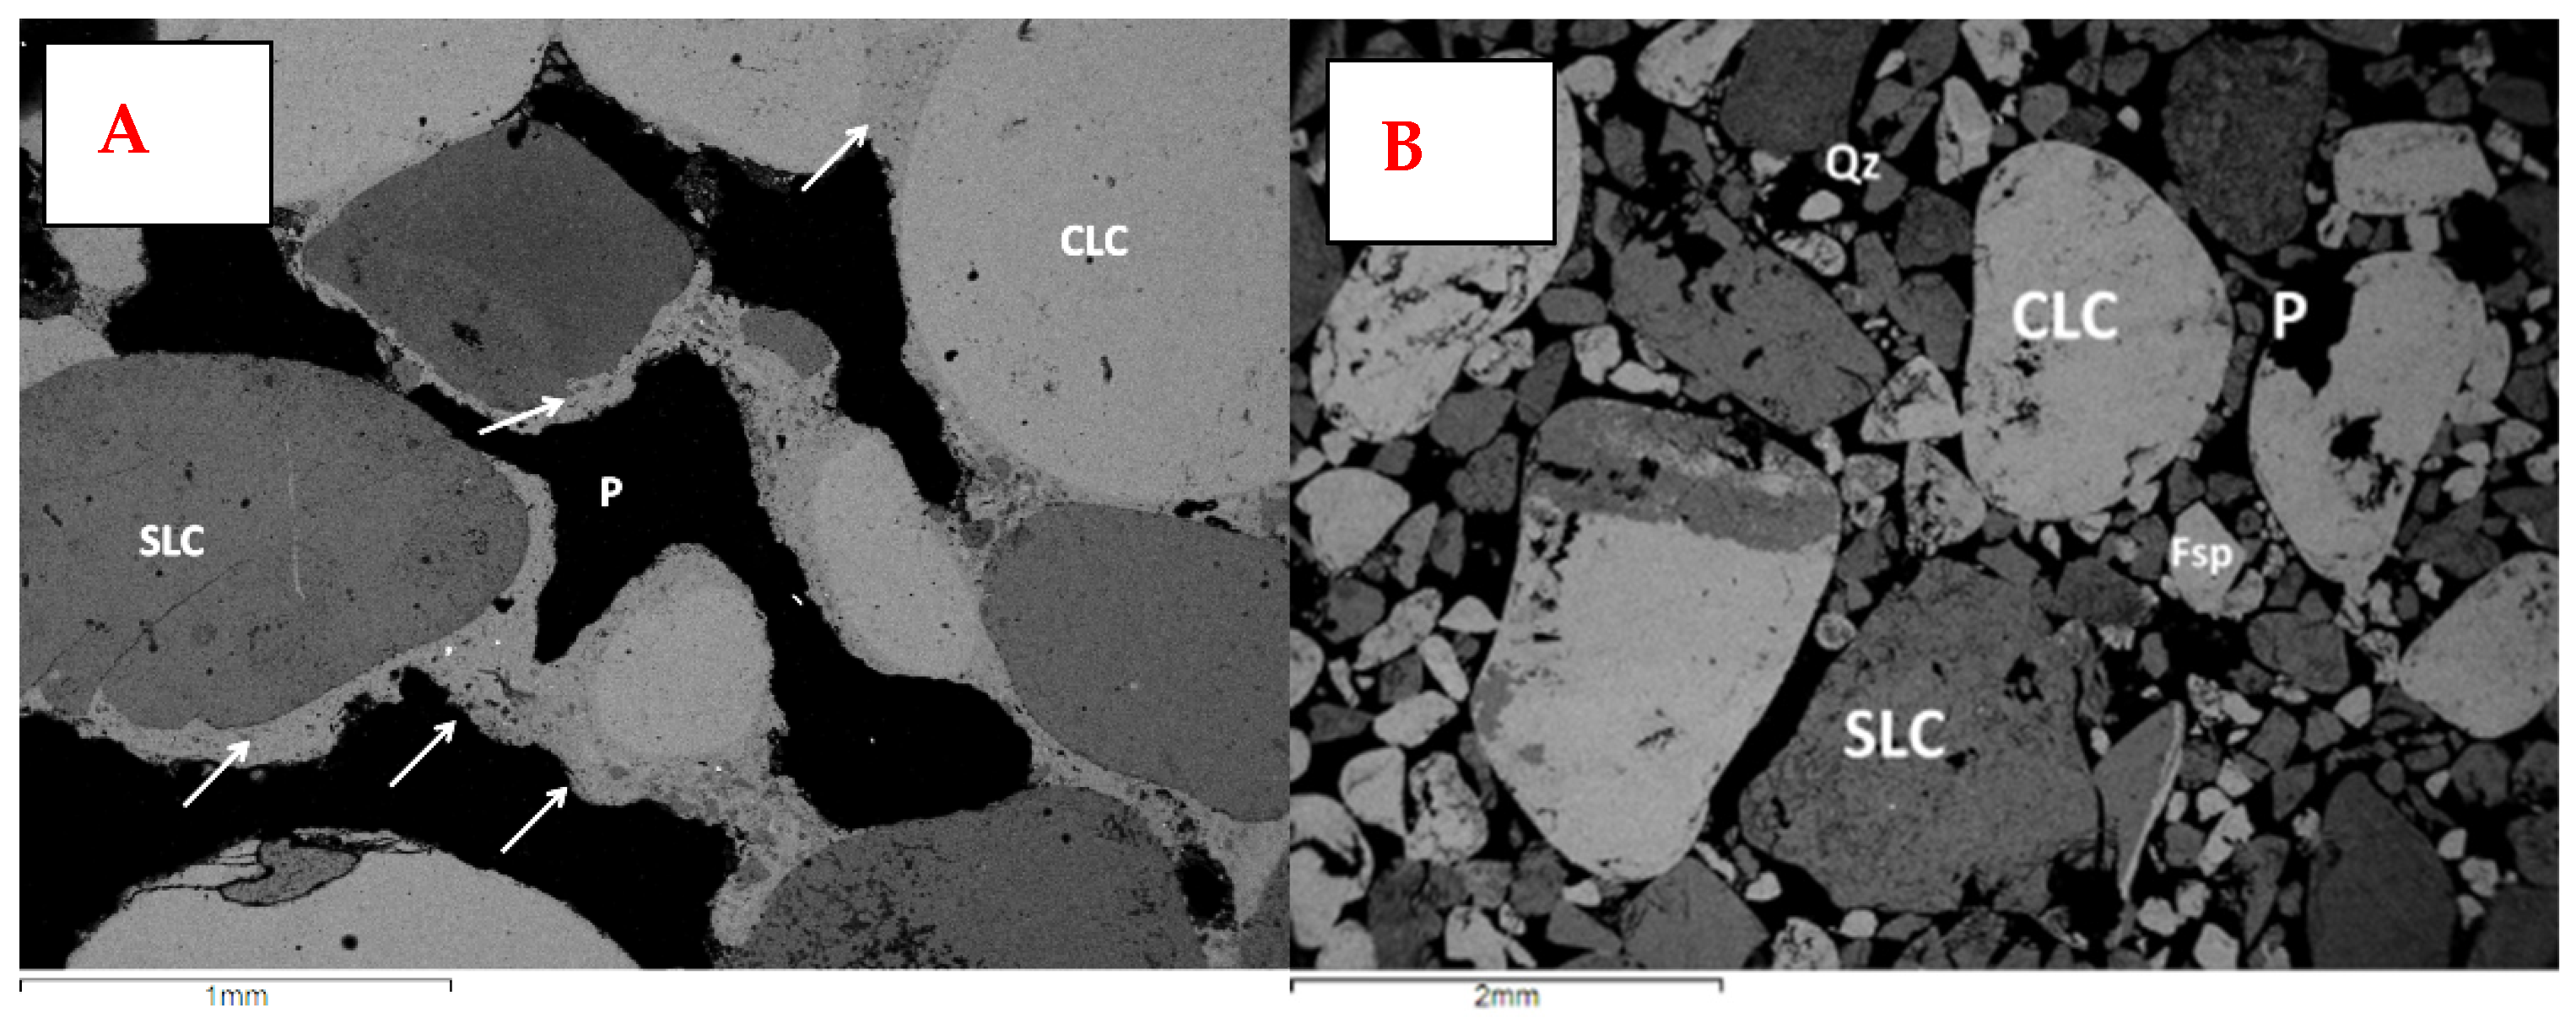
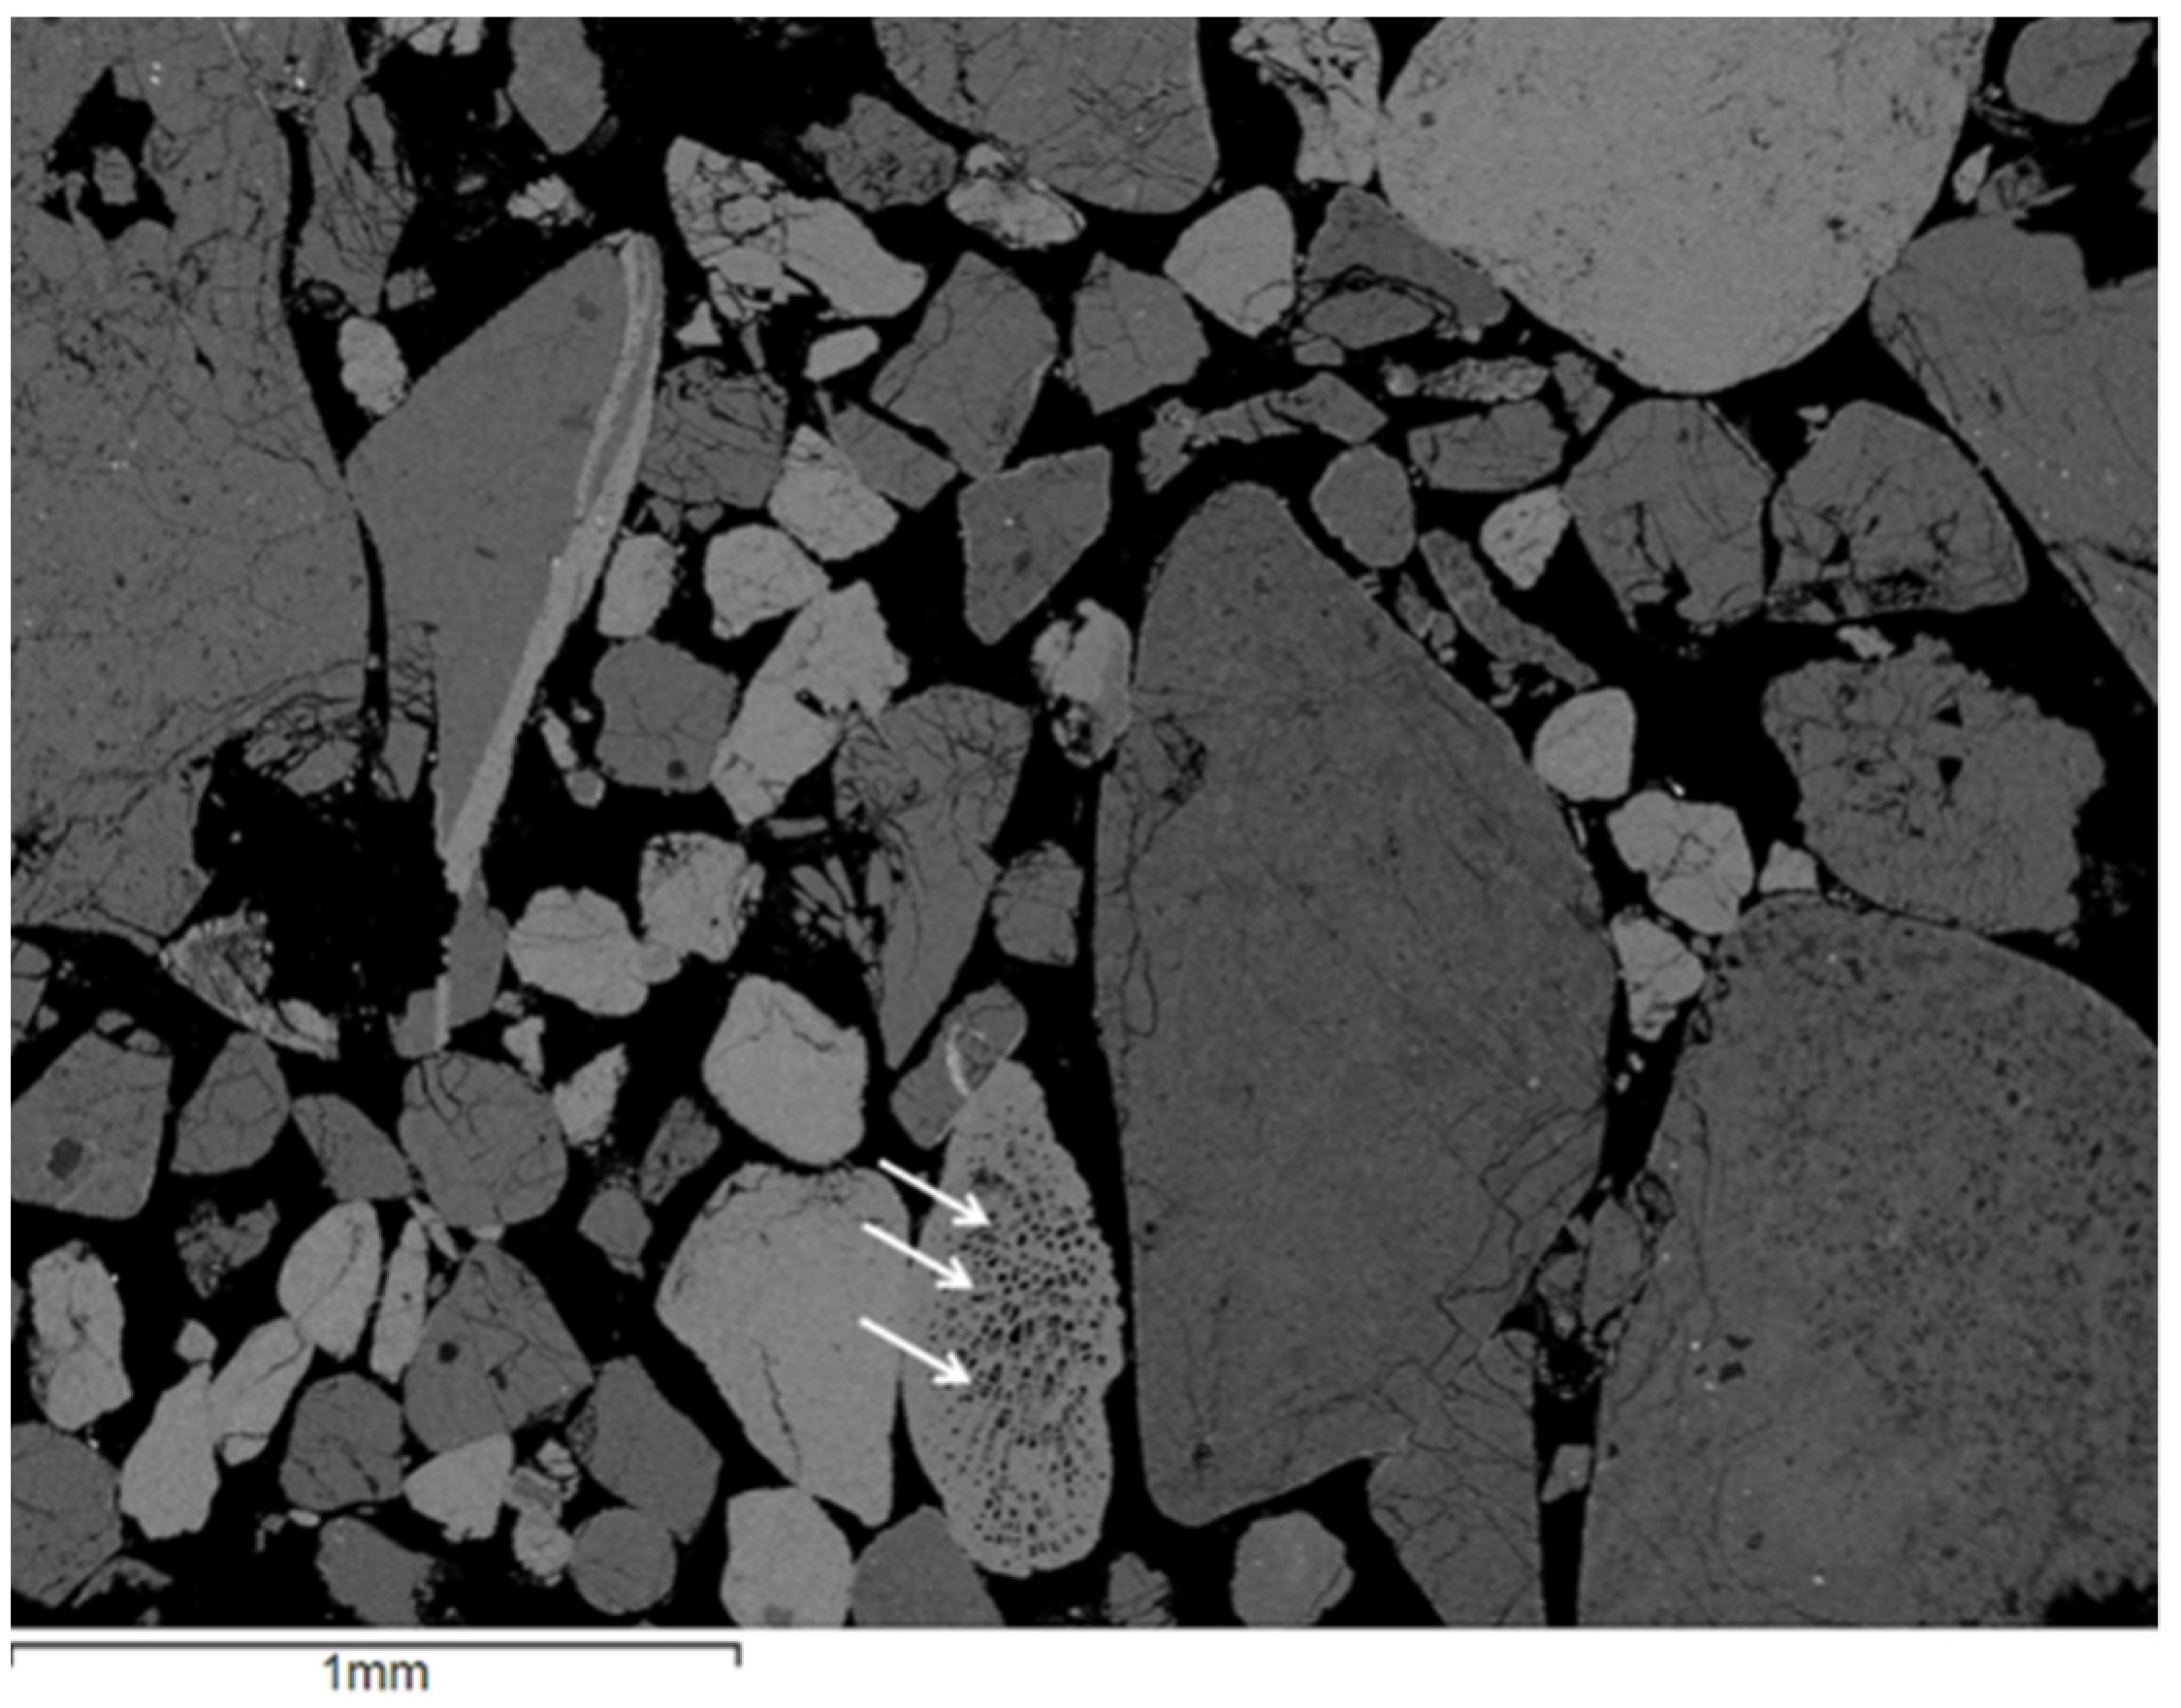
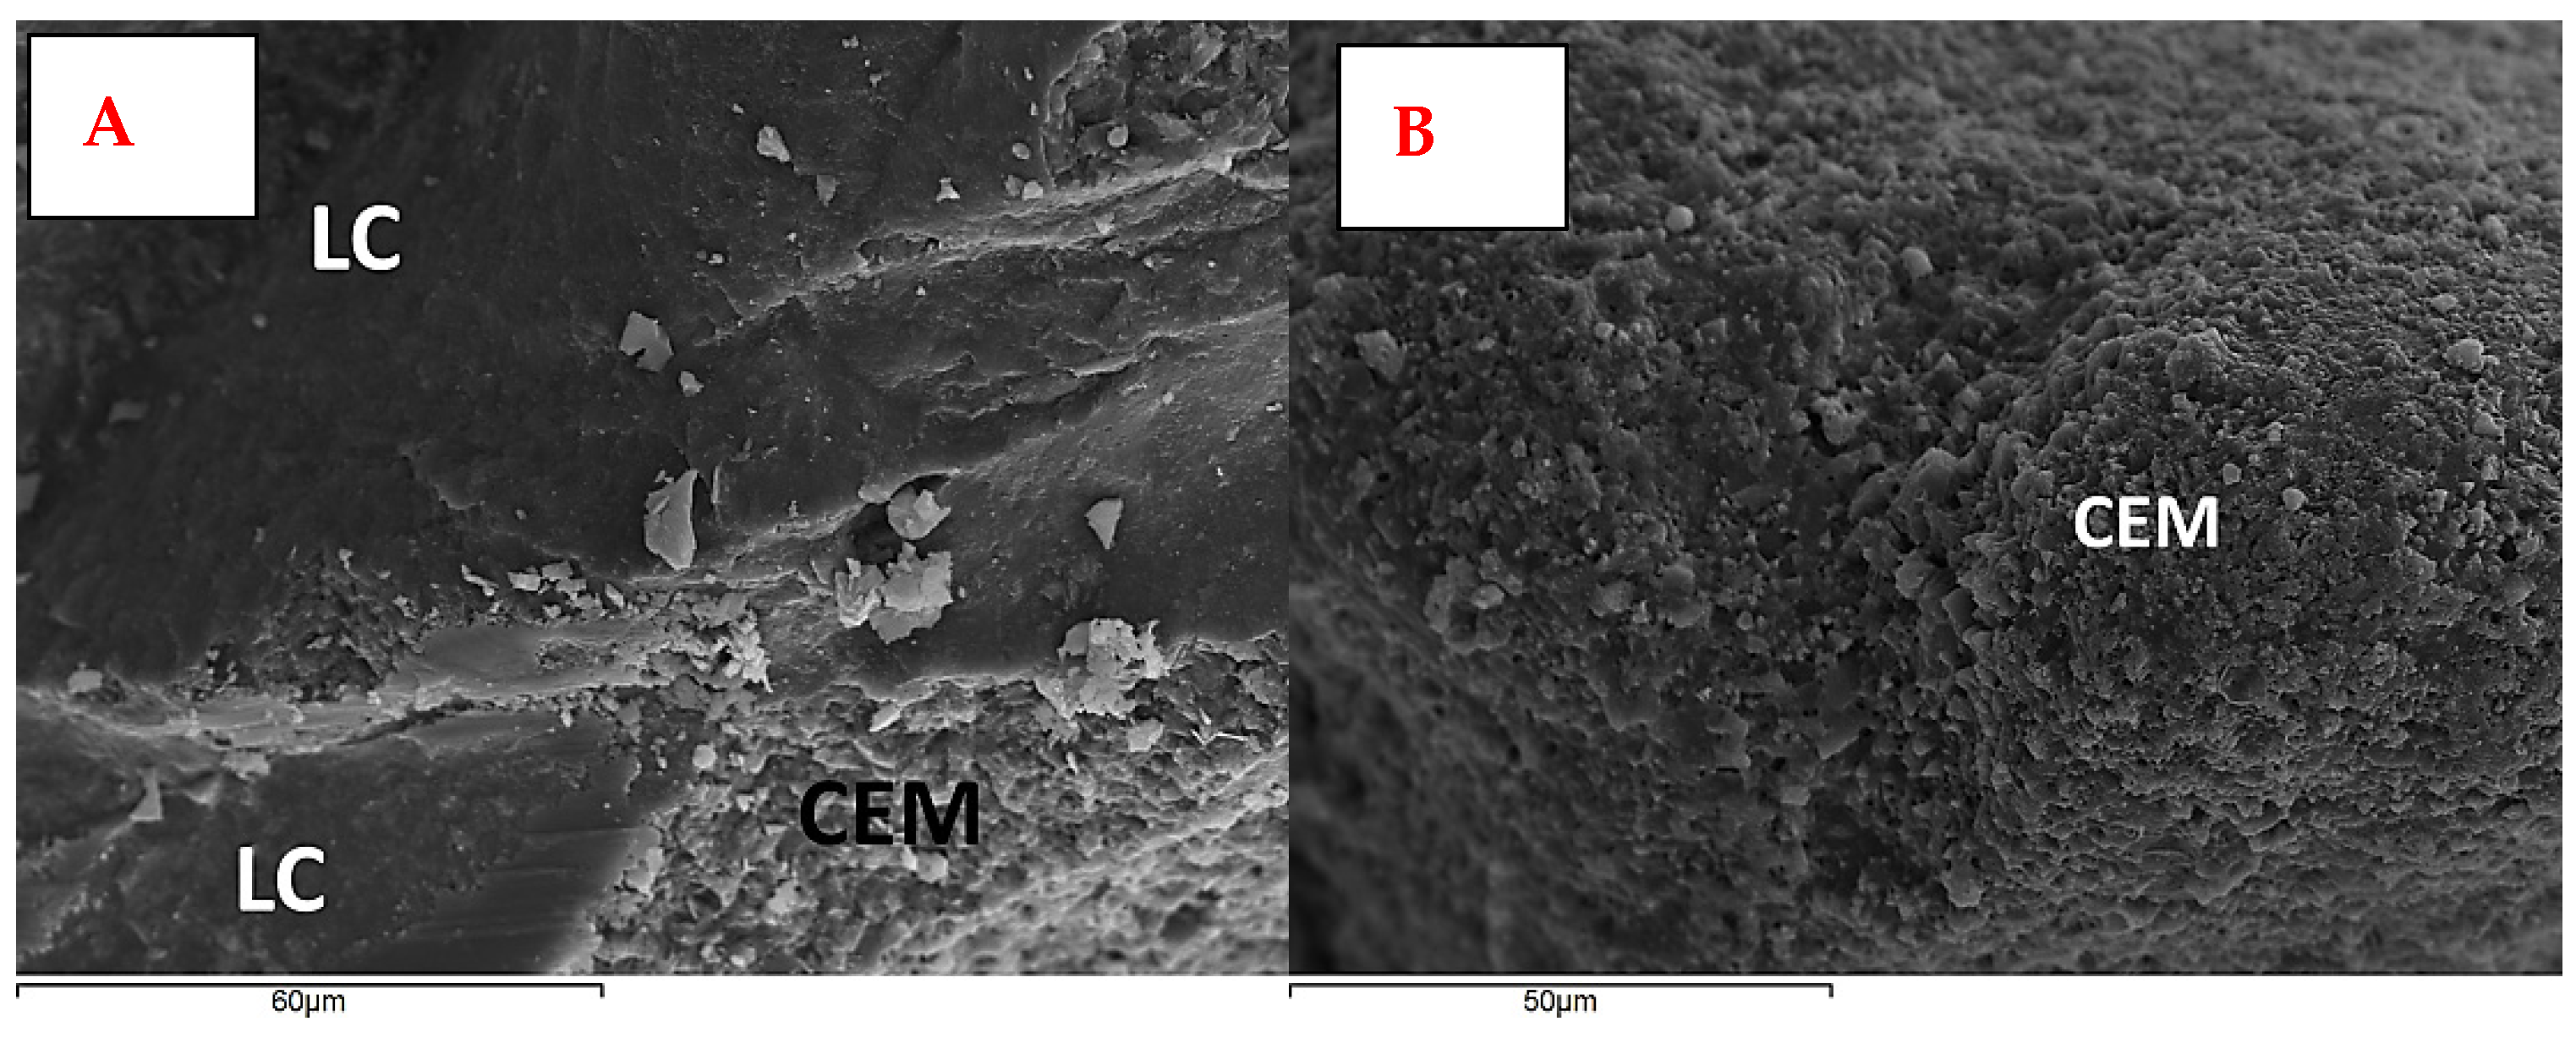
4.3. Petrography under Polarizing Microscope and SEM Analysis

The beachrock sample named KAN1 is a fine to medium grain sized sandstone. It presents medium sorting with sub-angular to sub-rounded siliceous and carbonate grains or lithoclasts (fragments of cherts or limestones) cemented mainly by micritic material (Figure 9A). The minerals of quartz, calcite, and feldspar are clearly observed under microscopy, confirming the XRD results (Table 1 and Figure 9A). Impregnated micro areas with oxides are also presented in the groundmass. Sometimes carbonate grains indicate sparitic or peloidal texture. Micritic cement material coats most of the grains, fills pores, and connects grains via micro-bridges. The sandstone of KAN3 (Figure 9B) is slightly differentiated from the KAN1 specimen, while it indicates the finest texture compared to the KAN1. Mineralogical similarities with KAN1,3 beachrocks present most of the rest of the studied samples, while there are some structural variations, as indicated in the next paragraphs.
KAN2, KAN2-1, KAN2-3 samples are presented in Figure 9C–E. In the case of KAN2 and KAN2-1 samples, they exhibit coarser grain textures and higher micro-channel porosity compared with the KAN1,3 samples (Figure 9A,B). Despite this, the high degree of grain roundness in the samples permits us to consider that the sources of clastic material are not very neighboring to the sampling site. Micritic rims of grains are usually thinner compared to the other beachrock outcrops due to the lower surface energy [35]. KAN2-3 sample in Figure 9E is characterized as a medium grain sized sandstone presenting a more homogeneous and compact texture compared to the aforementioned rocks and a good degree of sorting, whilst micro-channel porosity is still existing in its structure.
Since sample KAN2-2 contains high amounts of the clayey matrix (Table 1), it exhibits a strong brittle behavior preventing the preparation of thin sections and its study under polarizing microscopy.
L1 and LY1 rock types exhibit coarse textures (Figure 9F,G, respectively). L1 is characterized as a poor sorted clastic rock material with high porosity and sizes of sub-rounded grains (quartz, calcite) and lithoclasts (cherts and limestones) ranging from coarse sand to fine gravel, while low amounts of micritic material coat the grains reflecting the low degree of cementation (Figure 9F). The LY1 sample exhibits the coarser texture among the studied samples whilst the grains and lithoclasts are presented sub-rounded (Figure 9G). The LY1 microstructure presents higher amounts of micritic cement and consequent lower porous matrix compared to that in L1. Remained bioclasts were clearly distinguished in L1 and LY1 samples too (Figure 9H).
Representative cement textures of studied samples are presented in SEM images of Figure 10, Figure 11 and Figure 12. They reveal that micritic carbonate materials prefer to coat grains forming isopachous rims, connect grains and fragments via meniscus bridges, or fill pores, enhancing further the lithification. Moreover, the morphology of cement in fracture surfaces of samples is presented in representative Figure 13, which shows micritic calcite bond grains in KAN1 (Figure 13A) and LY1 (Figure 13B) samples. According to SEM image analyses, participation of biogenetic material in the new cement phase of studied beachrocks is not easily recognized, whilst some evidence of remaining microfossils in carbonate detrital material is presented (Figure 12). Such microorganisms maybe contributed to the micritization via dissolution of carbonate grains and saturation with cations in the solutions, or via nucleation producing peloids in the cement phase [52,53].
Representative microanalyses results of the cement phase are presented in Table 2. The results show that the cement phase consists of Mg-calcite minerals in all analyzed samples (Figure 10 and Figure 14). It should be noticed that the participation of magnesium in calcite lattice is favored only in the case of the cement phase and not at all in the detrital carbonates grains, which consisted of pure calcite (Figure 10). The mean values of % moles MgCO3 in the micritic cement phase of analyzed thin sections range from 15 (KAN1, KAN2-1, L1) to 20% (KAN2-3). According to these concentrations, the cement phase of studied samples could be characterized as high Mg-calcite (HMC) [13]. An exception consists of the sample KAN2-2. It is differentiated strongly from the rest of the samples, where clay minerals are the dominant cement phase of clastic materials in its matrix (Figure 15), assuming the XRD results and reflecting a more clayey source.

5. Discussion

In all our sampling sites, beachrocks are dipping seaward up to 19°. The tide gouge in the area is relatively low, and the sampling and UAV mapping of the studied sites is best exposed early in the morning when we executed our flight and sampling.
The combination of the beachrock bedding inclination, the existence of notches in the rocky beaches just north of the study area (Figure 16A,B), and recent seismicity indicate that the study area is under active deformation and uplift. This uplift is probably correlated with the location of the study area at the northeasternmost tip of the Kephalonia Transform Fault (KTF) (Figure 1). Furthermore, the structural proximity of the Lygia and Loutsa sites with an evaporitic dome, an anticline, and a reverse fault indicate coast uplift. Considering this geotectonic setting and local data, the geomorphic diversity in the area attest to structurally controlled vertical movements and complicated geomorphic history, similar to what is considered for the Amvrakikos Bay to the south of the study area [37]. In the Amvrakikos area, there has been a remarkable sea-level fluctuation over the last 6000 years corresponding with tectonic movements, along with eustatic sea-level changes [37].
According to the petrographic study, the initial rocks of the broader area, after erosion and weathering, feed with clastic material the studied sea coasts, developing beach rocks with similar qualitative mineralogical compositions. Petrographicaly, it is worth mentioning the high degree of roundness in all samples. We interpret this as indicating the high workability of clastic materials during transformation and/or at a deposition in a high energy coastal environment. Additionally, variation in the grain sizes of the analyzed rocks indicates a different distance of the clastic’s source. The source of the finer KAN 1,3 beachrocks could be considered further away compared to the other samples, while closer sources of the other analyzed samples are possible. Since KAN1 and KAN3 samples are sited in the estuary of Arethonas River, the feeding with clastic material of these beachrocks has been facilitated by the increased dynamic of water flow combined with the high relief of that area, while the alluvial fans of Figure 4 are possibly the main feed source of the coarse LY1 since it is sited nearby (in a distance of some meters). The variation content of the cement phase seems to vary among the different outcrops reflecting the youngest beachrock formation in the north and oldest in the south. Under microscopy, L1 presents the lower amounts of cement phase and KAN3 the higher. This suggestion is not, at present, supported by carbon dating analyses; it is a working hypothesis. Furthermore, other parameters are involved in the cementation process, such as the energy of the coastal environments of the different beachrock outcrops. Nevertheless, this hypothesis appears realistic based on the geological setting of the north coast that is at structural proximity with an active reverse fault and the diapiric dome. Particularly, the north area is strongly uplifted, related to the south rugged area. This suggestion is supported by the narrow coast and the relatively narrow zone with beachrocks. It is worth mentioning that the width of the beach rock in the northern area is only 22.5 m; thus, it is almost three to four times narrower than the beachrocks in the other two sites.
The influence of the broader tectonic activity on the beachrock formation is discussed in a previous study [54]. As discussed in that study, local tectonic movements of variable intensity could interpret the mapped differences between beachrock formations in Mykonos-Delos-Rhenia (Cyclades, Greece) and the southern coast of Turkey.
Moreover, in the north sampling area, the lower degree of lithification by the cement phase of the L1 sample, compared to the LY1, could be attributed to the factor of the high energetic coast environment where dynamic sea waves could delay the progress of cementation in coarse grains sediments [13].
Characteristics of the carbonate cement material that bonds the clastic grains in beachrocks reveal the diagenetic environment and forming conditions of such lithotypes [21,55,56,57]. Diagenesis of these sea-coast sediments includes several abiotic and/or biotic processes, such as dissolution, precipitation, and recrystallization, which are controlled by different parameters (e.g., salinity of the water, temperature, ph, Mg abundance, and microbial activity) [58]. The morphological characteristics of cement material, as well as its composition, are strongly related to the mechanism of beachrocks formation. In our study, the dominant precipitation of micritic calcite in the beachrock’s fabrics reveals that micritic carbonate materials commonly coat grains at isopachous rims connect lithoclasts via meniscus bridges or pore fill. Although these results permit us to attribute the predominant mechanism of calcite precipitation to the inorganic physicochemical conditions, high-resolution techniques are needed for the detection or not of low amounts of bio-organisms in the cement phase [52,53,59].
The micro-analyses of the cement phase show high Mg-calcite minerals in all analyzed samples. This result, along with the aforementioned morphological types of cement in the studied beachrocks, indicates a marine-vadose depositional environment [16,60,61].

6. Conclusions

The petrographic study of our work considers that the majority of the beachrocks on this coast belong to a similar depositional zone of a marine–vadose environment. The rocks formed under a rather inorganic mechanism of micritic HMC precipitation. In addition, the clastic material derives from similar lithotypes of the broader area. Despite these, variations in the textural petrographic features among the specimens permit us to consider these sedimentary rocks as not a uniform outcrop. These results indicate that the geomorphological complexity along the coast is comparable with lithologic differentiation due to inherit and active structures interacting.
It is indicated that the beachrocks formation and the cementation progress in the study area are both controlled by its geotectonic setting at the near tip area of the KTF (Figure 1) and active reverse faults and diapiric or tectonic anticlines (Figure 2). However, it is highly probable that the overall evolution of the beachrocks is also related to climatic factors. Nevertheless, the southern beachrocks exhibit advanced lithification compared to the northern ones suggesting that all parameters controlling the beachrock formation and evolution are acting synthetically.
UAVs proved to be a valuable tool for the very accurate 3D mapping of the beachrocks, while the aluminum targets seem to be a very efficient tool as ground control points in shallow waters.
Future work regarding the mapping of the rest of the beachrocks will include the underwater mapping of the beachrock with ROV and sampling for dating. The adequate radiocarbon dating (total sample or cement) will be decided based on the detailed analysis of samples [54,62].

Author Contributions

Conceptualization, K.G.N.; methodology, K.G.N. and I.K.K.; validation, I.K.K. and K.G.N.; formal analysis, P.L., K.G.N. and I.K.K.; data curation, P.L., K.G.N. and I.K.K., writing—original draft preparation, P.L., K.G.N. and I.K.K.; writing—review and editing, P.L., K.G.N. and I.K.K.; project administration, K.G.N. and I.K.K. All authors have read and agreed to the published version of the manuscript.

Funding

This research received no external funding.

Data Availability Statement

Data available on request due to restrictions. The data presented inthis study are available on request from the corresponding author.

Conflicts of Interest

The authors declare no conflict of interest.

References

  1. Lambeck, K.; Chappell, J. Sea Level Change through the Last Glacial Cycle. Science 2001, 292, 679–686. [Google Scholar] [CrossRef] [PubMed]
  2. Yokoyama, Y.; Lambeck, K.; De Deckker, P.P.J.; Fifielf, L.K. Timing of the last glacial maximum from observed sea-level minima. Nature 2000, 406, 713–716. [Google Scholar] [CrossRef]
  3. Peltier, W.; Fairbanks, R. Global glacial ice volume and Last Glacial Maximum duration from an extended Barbados sea level record. Quat. Sci. Rev. 2006, 25, 3322–3337. [Google Scholar] [CrossRef]
  4. Siddall, M.; Rohling, E.J.; Almogi-Labin, A.; Hemleben, C.; Meischner, D.; Schmelzer, I.; Smeed, D.A. Sea-level fluc-tuations during the last glacial cycle. Nature 2003, 423, 853–858. [Google Scholar] [CrossRef] [PubMed]
  5. Kakroodi, A.A.; Kroonenberg, S.B.; Hoogendoorn, R.M.; Mohammadkhani, H.; Yamani, M.; Ghasssemi, M.R.; Lahijani, H.A.K. Rapid Holocene sea-level changes along the Iranian Caspian coast. Quat. Int. 2012, 263, 93–103. [Google Scholar] [CrossRef]
  6. Kraft, J.C.; Chrzastowski, M.J. Coastal Stratigraphic Sequences. In Coastal Sedimentary Environments; Springer Science and Business Media LLC: New York, NY, USA, 1985; pp. 625–663. [Google Scholar] [CrossRef]
  7. Hopley, D. Beachrock as sea-level indicator. In Sea-Level Research: A Manual for the Collection and Evaluation of Data; van der Plassche, O., Ed.; Geo Books: Norwich, UK; pp. 157–173.
  8. Kelletat, D. Beachrock as Sea-Level Indicator? Remarks from a Geomorphological Point of View. J. Coast. Res. 2006, 226, 1558–1564. [Google Scholar] [CrossRef]
  9. Cooper, A. Sea Level Studies|Sedimentary Indicators of Relative Sea-Level Changes—High Energy. In Encyclopedia of Quaternary Science; Elsevier BV: Amsterdam, The Netherlands, 2013; pp. 385–395. [Google Scholar] [CrossRef]
  10. Russell, R.J.; McIntire, W.G. Southern Hemisphere Beach Rock. Geogr. Rev. 1965, 55, 17. [Google Scholar] [CrossRef]
  11. Stoddart, D.R.; Cann, J.R. Nature and origin of beach rock. J. Sediment. Res. 1965, 35, 243–247. [Google Scholar] [CrossRef]
  12. Cooper, J.A.G. Beachrock formation in low latitudes: Implications for coastal evolutionary models. Mar. Geol. 1991, 98, 145–154. [Google Scholar] [CrossRef]
  13. Vousdoukas, M.I.; Velegrakis, A.F.; Plomaritis, T.A. Beachrock occurrence, characteristics, formation mechanisms and impacts. Earth Sci. Rev. 2007, 85, 23–46. [Google Scholar] [CrossRef]
  14. Arrieta, N.; Goienaga, N.; Martínez-Arkarazo, I.; Murelaga, X.; Baceta, J.; Sarmiento, A.; Madariaga, J. Beachrock formation in temperate coastlines: Examples in sand-gravel beaches adjacent to the Nerbioi-Ibaizabal Estuary (Bilbao, Bay of Biscay, North of Spain). Spectrochim. Acta Part A Mol. Biomol. Spectrosc. 2011, 80, 55–65. [Google Scholar] [CrossRef] [PubMed]
  15. Danjo, T.; Kawasaki, S. Characteristics of Beachrocks: A Review. Geotech. Geol. Eng. 2014, 32, 215–246. [Google Scholar] [CrossRef]
  16. Mauz, B.; Vacchi, M.; Green, A.; Hoffmann, G.; Cooper, A. Beachrock: A tool for reconstructing relative sea level in the far-field. Mar. Geol. 2015, 362, 1–16. [Google Scholar] [CrossRef]
  17. Clark, B.B. Geomorphological features of Mother Ivey’s Bay near Padstow, with an account of the under-cliff bank and intertidal reef of cemented limesand at Little Cove. Trans. R. Geol. Soc. Corn. 1968, 30, 69–79. [Google Scholar]
  18. Kneale, D.; Viles, H. Beach cement: Incipient CaCO3-cemented beachrock development in the upper intertidal zone, North Uist, Scotland. Sediment. Geol. 2000, 132, 165–170. [Google Scholar] [CrossRef]
  19. Cooper, J.; Green, A.; Wiles, E. Beachrock morphology and genesis on a paraglacial beach. Sediment. Geol. 2017, 360, 47–53. [Google Scholar] [CrossRef]
  20. Neumeier, U. Experimental modelling of beachrock cementation under microbial influence. Sediment. Geol. 1999, 126, 35–46. [Google Scholar] [CrossRef]
  21. Moore, C.H. Intertidal carbonate cementation Grand Cayman, West Indies. J. Sediment. Res. 1973, 43, 591–602. [Google Scholar]
  22. Beier, J.A. Diagenesis of Quaternary Bahamian Beachrock: Petrographic and Isotopic Evidence. J. Sediment. Res. 1985, 55, 755–761. [Google Scholar] [CrossRef]
  23. Chowdhury, S.Q.; Fazlul Haq, A.T.M.; Hasan, K. Beachrock in St. Martin’s Island, Bangladesh: Implication of Sea Level Changes on Beachrock cementation. Mar. Geod. 1997, 20, 89–104. [Google Scholar] [CrossRef]
  24. Tatumi, S.; Kowata, E.; Gozzi, G.; Kassab, L.; Suguio, K.; Barreto, A.; Bezerra, F. Optical dating results of beachrock, eolic dunes and sediments applied to sea-level changes study. J. Lumin. 2003, 102–103, 562–565. [Google Scholar] [CrossRef]
  25. Alexandrakis, G.; Ghionis, G.; Poulos, S. The Effect of Beach Rock Formation on the Morphological Evolution of a Beach. The Case Study of an Eastern Mediterranean Beach: Ammoudara, Greece. J. Coast. Res. 2013, 69, 47–59. [Google Scholar] [CrossRef]
  26. Ghandour, I.M.; Al-Washmi, H.A.; Khan, A.A.; Mannaa, A.A.; Aljahdali, M.H.; Jones, B.G. Depositional Setting and Cementation Pattern of Al-Mejarma Beachrocks, Saudi Arabia: A Proxy for the Late Quaternary Red Sea Coastal Evolution. J. Mar. Sci. Eng. 2021, 9, 1012. [Google Scholar] [CrossRef]
  27. Saitis, G.; Karkani, A.; Evelpidou, N.; Maroukian, H. Palaeogeographical Reconstruction of Ancient Diolkos Slipway by Using Beachrocks as Proxies, West Corinth Isthmus, Greece. Quaternary 2022, 5, 7. [Google Scholar] [CrossRef]
  28. Saitis, G.; Karkani, A.; Koutsopoulou, E.; Tsanakas, K.; Kawasaki, S.; Evelpidou, N. Beachrock Formation Mechanism Using Multiproxy Experimental Data from Natural and Artificial Beachrocks: Insights for a Potential Soft Engineering Method. J. Mar. Sci. Eng. 2022, 10, 87. [Google Scholar] [CrossRef]
  29. Malta, J.V.; Castro, J.W.A.; Cabral, C.L.; Fernandes, D.; Cawthra, H.C. Genesis and age of beachrocks on the Rio de Janeiro coastline, Southeast—Brazil. Mar. Geol. 2021, 442, 106649. [Google Scholar] [CrossRef]
  30. Alexandrakis, G.; Petrakis, S.; Kampanis, N. Integrating Geomorphological Data, Geochronology and Archaeological Evidence for Coastal Landscape Reconstruction, the Case of Ammoudara Beach, Crete. Water 2021, 13, 1269. [Google Scholar] [CrossRef]
  31. Vianna, M.; Cabral, A.P.; Gherardi, D.F.M. TM-Landsat imagery applied to the study of the impact of global climate change on a tropical coastal environment during the last deglaciation. Int. J. Remote Sens. 1993, 14, 2971–2983. [Google Scholar] [CrossRef] [Green Version]
  32. Chen, F.; Fan, Y.; Chun, X.; Madsen, D.B.; Oviatt, C.G.; Zhao, H.; Yang, L.; Sun, Y. Preliminary research on Megalake Jilantai-Hetao in the arid areas of China during the Late Quaternary. Sci. Bull. 2008, 53, 1725–1739. [Google Scholar] [CrossRef] [Green Version]
  33. Velegrakis, A.F.; Trygonis, V.; Vousdoukas, M.; Ghionis, G.; Chatzipavlis, A.; Andreadis, O.; Psarros, F.; Hasiotis, T. Automated 2D shoreline detection from coastal video imagery: An example from the island of Crete. In Proceedings of the Third International Conference on Remote Sensing and Geoinformation of the Environment (RSCy2015), Paphos, Cyprus, 16–19 March 2015; Volume 9535, pp. 495–501. [Google Scholar] [CrossRef]
  34. Hastie, W.W.; Mthembu, A.T.; Green, A.N.; Bergh, J.V.D. Linking fracturing and rock mechanic properties to the erosion of a beachrock shore platform. Mar. Geol. 2021, 441, 106616. [Google Scholar] [CrossRef]
  35. Nikolakopoulos, K.G.; Lampropoulou, P.; Fakiris, E.; Sardelianos, D.; Papatheodorou, G. Synergistic Use of UAV and USV Data and Petrographic Analyses for the Investigation of Beachrock Formations: A Case Study from Syros Island, Aegean Sea, Greece. Minerals 2018, 8, 534. [Google Scholar] [CrossRef] [Green Version]
  36. Daryono, L.R.; Nakashima, K.; Kawasaki, S.; Titisari, A.D.; Barianto, D.H.; Suyanto, I.; Rahmadi, A. Shoreline mapping based on beachrocks identification in Krakal-Sadranan beach, Yogyakarta, Indonesia. Bull. Eng. Geol. Environ. 2021, 80, 2825–2844. [Google Scholar] [CrossRef]
  37. Poulos, S.; Kapsimalis, V.; Tziavos, C.; Pavlakis, P.; Leivaditis, G.; Collins, M. Sea-level stands and Holocene geo-morphological evolution of the northern deltaic margin of Amvrakikos Gulf (western Greece). Z. Geomorphol. Suppl. Issues 2005, 137, 125–145. [Google Scholar]
  38. Kolaiti, E.; Mourtzas, N.; Kissas, K.; Antonioli, F.; Lambeck, K. New insights into the uplifted Roman harbour at Mavra Litharia (N Peloponnese, Greece) in the geodynamic context of the southern margin of the Corinth Gulf. Quat. Int. 2019, 508, 23–35. [Google Scholar] [CrossRef]
  39. Koukouvelas, I.K.; Zygouri, V.; Papadopoulos, G.A.; Verroios, S. Holocene record of slip-predictable earthquakes on the Kenchreai Fault, Gulf of Corinth, Greece. J. Struct. Geol. 2017, 94, 258–274. [Google Scholar] [CrossRef]
  40. Koukouvelas, I.K.; Piper, D.J.; Katsonopoulou, D.; Kontopoulos, N.; Verroios, S.; Nikolakopoulos, K.; Zygouri, V. Earthquake-triggered landslides and mudflows: Was this the wave that engulfed Ancient Helike? Holocene 2020, 30, 1653–1668. [Google Scholar] [CrossRef]
  41. Koukouvelas, I.K. Geology of Greece. In Liberal Books; Athens Publishing: Athens, Greece, 2019; p. 343. [Google Scholar]
  42. Doutsos, T.; Koukouvelas, I.K.; Xypolias, P. A new orogenic model for the External Hellenides. In Tectonic Development of the Eastern Mediterranean Region; Robertson, A.H.F., Mountrakis, D., Eds.; Special Publication; Geological Society of London: London, UK, 2006; Volume 260, pp. 507–520. [Google Scholar]
  43. Valkaniotis, S.; Briole, P.; Ganas, A.; Elias, P.; Kapetanidis, V.; Tsironi, V.; Fokaefs, A.; Partheniou, H.; Paschos, P. The Mw = 5.6 Kanallaki Earthquake of 21 March 2020 in West Epirus, Greece: Reverse Fault Model from InSAR Data and Seismotectonic Implications for Apulia-Eurasia Collision. Geoscience 2020, 10, 454. [Google Scholar] [CrossRef]
  44. IGRS & IFP. Étude Géologique de L’Epire (Grèce Nord-Occid.); Technip: Paris, France, 1966; 306p. [Google Scholar]
  45. King, G.; Sturdy, D.; Whitney, J. The landscape geometry and active tectonics of the northwest Greece. Geol. Soc. Am. Bull. 1993, 105, 137–161. [Google Scholar] [CrossRef]
  46. Doutsos, T.; Kontopoulos, N.; Frydas, D. Neotectonic evolution of northwestern-continental Greece. Geol. Rundsch. 1987, 76, 433–450. [Google Scholar] [CrossRef]
  47. Hatzfeld, D.; Kassaras, L.; Panagiotopoulos, D.; Amorese, D.; Makropoulos, K.; Karakaisis, G.; Coutand, O. Micro-seismicity and strain pattern in northwestern Greece. Tectonics 1995, 14, 773–785. [Google Scholar] [CrossRef]
  48. Kokkalas, S.; Xypolias, P.; Koukouvelas, I.K.; Doutsos, T. Post-Collisional Contractional and Extensional Deformation in the Aegean Region. In Post-Collisional Tectonics and Magmatism in the Mediterranean Region and Asia; Dilek, Y., Pavlides, S., Eds.; Geological Society of America Special Paper: Washington, DC, USA, 2006; Volume 409, pp. 97–123. [Google Scholar]
  49. Tselentis, G.-A.; Sokos, E.; Martakis, N.; Serpetsidaki, A. Seismicity and Seismotectonics in Epirus, Western Greece: Results from a Microearthquake Survey. Bull. Seism. Soc. Am. 2006, 96, 1706–1717. [Google Scholar] [CrossRef] [Green Version]
  50. Geological Map of Greece 1/50.000 Kanalakion Sheet, Editions; Institute of Geology and Mineral Exploration: Athens, Greece, 1962–1963.
  51. Kyriou, A.; Nikolakopoulos, K.; Koukouvelas, I. How Image Acquisition Geometry of UAV Campaigns Aff-ects the Derived Products and Their Accuracy in Areas with Complex Geomorphology. ISPRS Int. J. Geo-Inf. 2021, 10, 408. [Google Scholar] [CrossRef]
  52. McCutcheon, J.; Nothdurft, L.D.; Webb, G.E.; Paterson, D.; Southam, G. Beachrock formation via microbial dissolution and re-precipitation of carbonate minerals. Mar. Geol. 2016, 382, 122–135. [Google Scholar] [CrossRef] [Green Version]
  53. McCutcheon, J.; Nothdurft, L.D.; Webba, G.E.; Shuster, J.; Nothdurfta, L.; Patersone, D.; Southama, G. Building biogenic beachrock: Visualizing microbially-mediated carbonate cement precipitation using XFM and a strontium tracer. Chem. Geol. 2017, 465, 21–34. [Google Scholar] [CrossRef] [Green Version]
  54. Desruelles, S.; Fouache, É.; Ciner, A.; Dalongeville, R.; Pavlopoulos, K.; Kosun, E.; Coquinot, Y.; Potdevin, J.-L. Beachrocks and sea level changes since Middle Holocene: Comparison between the insular group of Mykonos–Delos–Rhenia (Cyclades, Greece) and the southern coast of Turkey. Glob. Planet. Chang. 2009, 66, 19–33. [Google Scholar] [CrossRef]
  55. Vieira, M.M.; De Ros, L.F. Cementation patterns and genetic implications of Holocene beachrocks from northeastern Brazil. Sediment. Geol. 2006, 192, 207–230. [Google Scholar] [CrossRef]
  56. Meyers, J.H. Marine Vadose Beachrock Cementation by Cryptocrystalline Magnesian Calcite—Maui, Hawaii. J. Sediment. Res. 1987, 57, 558–570. [Google Scholar] [CrossRef]
  57. Harris, P.M.; Kendall, C.G.S.C.; Lerche, I. Carbonate Cementation—A Brief Review. In Carbonate Cements: Based on a Symposium Sponsored by the Society of Economic Paleontologists and Mineralogists; Schneidermann, N., Harris, P.M., Eds.; SEPM Society for Sedimentary Geology: Washington, DC, USA, 1985. [Google Scholar]
  58. Giannikopoulou, A.; Evelpidou, N.; Baziotis, I.; Karkani, A. Coastal geomorphological study of St. George bay, Western Naxos, Greece. Zeitschrift Geomorphologie 2021, 63, 33–41. [Google Scholar] [CrossRef]
  59. Ramachandran, A.L.; Polat, P.; Mukherjee, A.; Dhami, N.K. Understanding and creating biocementing beachrocks via biostimulation of indigenous microbial communities. Appl. Microbiol. Biotechnol. 2020, 104, 3655–3673. [Google Scholar] [CrossRef]
  60. Longman, M.W. Carbonate diagenetic textures from near surface diagenetic environments. AAPG Bull. 1980, 64, 461–487. [Google Scholar]
  61. Calvet, F.; Cabrera, M.; Carracedo, J.; Mangas, J.; Pérez-Torrado, F.; Recio, C.; Travé, A. Beachrocks from the island of La Palma (Canary Islands, Spain). Mar. Geol. 2003, 197, 75–93. [Google Scholar] [CrossRef]
  62. Çiner, A.; Desruelles, S.; Fouache, E.; Koşun, E.; Dalongeville, R. Beachrock formations on the Mediterranean Coast of Turkey: Implications for Holocene sea level changes and tectonics. Geol. Bull. Turk. 2009, 52, 257–296. [Google Scholar]
Figure 1. Simplified geotectonic map of Greece modified after [41]. Key: rectangle indicates the study area shown in Figure 2; KTF = Kephalonia Transform Fault, IT = Ionian Thrust, PT = Pindos Thrust, TT = Tripolis Thrust.
Minerals 12 00392 g001
Figure 2. The geological map of the broader area and three insets in the lower part presenting orthophoto of each study area. The cross section AB presents a major reverse fault in the study area. The geological map and the cross section are modified from [50].
Minerals 12 00392 g002
Figure 3. The southern study area in Kanalia. Figure presents a well cemented beachrock outcrop. In the inset photo, a detailed view of the sample is presented.
Minerals 12 00392 g003
Figure 4. The middle study area in Lygias showing moderately seaward inclined alluvial fan conglomerates and slightly inclined beachrocks. Rectangle indicates the close up view of the beachrocks shown in the Figure 5.
Minerals 12 00392 g004
Figure 5. Details of the beachrocks in Lygia swimming coast.
Minerals 12 00392 g005
Figure 6. (a) Classical black and white target and (b) aluminum target with scale and predefined wholes at the corners for the GNSS measurements in the shallow water.
Minerals 12 00392 g006
Figure 7. Orthophoto showing beachrocks of the second study area and the beachrock boundaries. At the inset you can see clearly one of the aluminum targets used for the accuracy assessment.
Minerals 12 00392 g007
Figure 8. XRD analyses of mineral compositions of studied samples. Cc: calcite, MC: Mg-calcite; Fsp: feldspar; H: halite; Il: illite; Qz: quartz.
Minerals 12 00392 g008
Figure 9. Photomicrographs of studied samples in cross polarized light (XPL). (A): Clastic texture in KAN1 sample. Sub-angular to sub-rounded grains or lithoclasts (fragments of cherts or limestones) cemented mainly by micritic material; (Β): Micritic cement forms rims of grains and bridges or fills pores in the finer microstructure of KAN3 sample between the studied ones; (C,D): Grain textures of KAN2 and KAN2,1 samples. Note the high degree of grains roundness as well as the micro-channel porosity. Thin micritic rims usually coat the grains whilst cement form bridges too; (E): The medium grain sized sandstone of KAN2-3 sample; (F,G): Coarse textures of L1 and LY1 samples. Note the low amounts of cement (thin micritic rims around the grains) and the high porosity in L1 matrix. Higher amounts of peloid/micritic cement fills pores or coat the grains in LY1; (H): Presence of bioclasts in L1 sample; BC: bioclast (mollusk shell); CEM: cement; Cc: calcite; CLC: calcareous rich lithoclast; Fsp: feldspar; LC: lithoclast; P: pore; Qz: quartz, SLC: siliceous rich lithoclast.
Minerals 12 00392 g009
Figure 10. (A): BSE-SEM image indicating textural characteristics of KAN3 sample; (B,C): EDS spectra corresponded to the detrital carbonate grain (see CLC-1 of (A)) and cement phase (see CEM-2 of (A)). Dark gray: siliceous material; Light gray: detrital carbonates; intermediate gray: cement; Black: pore; CEM: cement; CLC: calcareous lithoclast.
Minerals 12 00392 g010
Figure 11. BSE-SEM image of: (A): KAN2-1 sample indicating cement to form meniscus bridge and to coat grains (see arrows); (B): Texture of L1 beachrock indicating the low degree of cementation and empty pore spaces; CEM: cement; CLC: calcareous lithoclast; Fsp: feldspar; P: pore; Q: quartz; SLC: siceous rich lithoclast.
Minerals 12 00392 g011
Figure 12. BSE-SEM image indicating evidences of carbonate material dissolution by microorganisms (see arrows) in L1 sample.
Minerals 12 00392 g012
Figure 13. SE images of fracture surfaces of: (A): KAN 1 sample; cement binds siliceous clastic grains; (B): Homogeneous micritic cement envelopes clastic material in LY1 groundmass. CEM: cement; LC: lithoclast.
Minerals 12 00392 g013
Figure 14. (A): BSE-SEM image indicating the cement phase to bond siliceous grains in matrix of sample. (B): Elemental mapping of (A) for Si, Ca, Mg, presenting homogenous magnesium distribution in carbonate cement. Si: green color; Ca: blue color; Mg: red color; CEM: cement; SLC: siliceous rich lithoclast.
Minerals 12 00392 g014
Figure 15. SE image indicating the predominant clayey cement material of KAN2-2 sample which causes its brittle behavior.
Minerals 12 00392 g015
Figure 16. Photo showing the uplift of the coastline in the broader area. The notches in all the photos are higher compared to the present sea level. Yellow arrows show the notches. (A) Photo width is 10 m., and is taken looking northwest. (B) A small island at the north part of the study area, showing clearly a notch. (C) Uplifted wave cut notch in a coast just north of the study area. Remarkable is, in the west end of the outcrop, the wave cut notch in direct proximity with the evaporitic dome. The width of the outcrop is about 150 m and the photo is taken looking north.
Minerals 12 00392 g016
Table 1. Semi-quantitative mineralogical results of studied samples (error of each phase <1; GOF: Goodness of fit; tr: traces).
Sample Phases wt% GOF
QuartzCalciteMg-CalciteIlliteFeldspar (Albite)Halite
KAN1552119-321.86
KAN2671219-1tr1.30
KAN2-1711117-1tr1.38
KAN2-251100363-1.37
KAN2-3691515-1tr1.38
KAN3541229-321.48
L1701910-1tr1.47
LY1731115trtrtr1.40
Table 2. Representative micro analysis of cement in studied samples and the respect % mole ΜgCO3 in calcite lattice.
SampleKAN1KAN2KAN2-1KAN2-3KAN3L1LY1
Oxide (wt %)
MgO6.206.466.159.306.326.227.24
CaO49.8149.3949.4546.5649.449.6148.59
total56.0155.8555.655.8655.7255.8355.83
Mg0.1540.1600.1530.2310.1570.1540.180
Ca0.8880.8810.8820.8300.8810.8850.866
* Max % mole MgCO3 in HMC16181924171720
* Min % mole MgCO3 in HMC13161216141316
* Mean% mole MgCO3 in HMC15171520161518
* Max, min, and mean values of % moles of MgCO3 in cement of each sample derived from results of ~10-15BSE-EDS cement microanalysis in each sample.
Publisher’s Note: MDPI stays neutral with regard to jurisdictional claims in published maps and institutional affiliations.

