Review

Indicator Minerals, Pathfinder Elements, and Portable Analytical Instruments in Mineral Exploration Studies

CSIR—National Geophysical Research Institute, Hyderabad 500007, India
*
Author to whom correspondence should be addressed.
Minerals 2022, 12(4), 394; https://doi.org/10.3390/min12040394
Submission received: 17 February 2022 / Revised: 16 March 2022 / Accepted: 21 March 2022 / Published: 23 March 2022
(This article belongs to the Section Mineral Exploration Methods and Applications)

Abstract

:
Until recently, the classic approach to mineral exploration studies was to bring the field samples/drill cores collected during field studies to the laboratory, followed by laborious analysis procedures to generate the analytical data. This is very expensive, time-consuming, and difficult for exploring vast areas. However, rapid technological advances in field-portable analytical instruments, such as portable visible and near-infrared spectrophotometers, gamma-ray spectrometer, pXRF, pXRD, pLIBS, and µRaman spectrometer, have changed this scenario completely and increased their on-site applications in mineral exploration studies. LED fluorimeter is a potential portable tool in the hydrogeochemical prospecting studies of uranium. These instruments are currently providing direct, rapid, on-site, real-time, non-destructive, cost-effective identification, and determination of target elements, indicator minerals and pathfinder elements in rock, ore, soil, sediment, and water samples. These portable analytical instruments are currently helping to obtain accurate chemical and mineralogical information directly in the field with minimal or no sample preparation and providing decision-making support during fieldwork, as well as during drilling operations in several successful mineral exploration programs. In this article, the developments in these portable devices, and their contributions in the platinum group elements (PGE), rare earth elements (REE), gold, base metals, and lithium exploration studies both on land and on the ocean bed, have been summarized with examples.

1. Introduction

The improvement in the living standards of a country is directly related to the country’s ability to find, exploit, and manage its mineral resources. The exploration and mining industry requires new methods and tools to address the challenges of declining mineral reserves and increasing discovery costs. As the lucrative ore targets located in easily accessible metalliferous environments are depleting fast, the attention of exploration scientists is being shifted to the highly under-explored and often problematic and inaccessible areas. Mineral exploration is a multidisciplinary team effort involving experts from different areas, such as geology, geophysics, geochemistry, petrology, and engineering, where geochemical techniques, in particular, have significantly contributed to the discoveries of several mineral deposits. Statistical data from China reveals that 71% of the total mineral deposits were discovered by geochemical methods during the period 1981–2000 (Figure 1), which demonstrates the power of geochemical exploration techniques. A large variety of approaches, such as lithogeochemistry, stable and radiogenic isotopes, indicator minerals, hyperspectral scanning, biogeochemistry, hydrochemistry, and sediment geochemistry, are utilized for understanding geochemical vectoring [1,2,3,4]. The use of isotopic data in exploration geochemistry has still not become routine as getting such data is still difficult and expensive [5].
In mineral exploration studies normally, geochemistry can help us with three aspects: (i) lithology, particularly mobile element geochemistry, (ii) alteration related to mineralogy, and (iii) direct detection of mineralization with multi-element geochemistry. During the last half-century, the world has witnessed rapid advancements in analytical instruments for geochemical studies with the introduction of a series of new analytical techniques and technological advancements in allied areas [6]. As a result, there have been significant developments in the accuracy and precision obtainable by even field-portable analytical instruments, such as portable X-ray fluorescence spectrometers (pXRF), portable X-ray diffractometers (pXRD), portable near-infrared and short-wave infrared spectrometers (pNIR-SWIR spectrometers), μRaman spectrometers, portable laser-induced breakdown spectrometers (pLIBS), LED fluorimeters, core scanners, and portable gamma spectrometers, used for mineral exploration studies. Although portable spark optical spectrometers are commercially available, their usefulness for geochemical analysis is not demonstrated yet. With the capability to generate rapid and high-quality data, these analytical techniques have been making the most significant contributions to relatively less expensive geochemical exploration studies leading to new discoveries. Though portable techniques such as pXRF existed earlier, in recent times, they have become more versatile, incorporating lightweight rechargeable batteries, global positioning systems (GPS), wireless computer technology, Bluetooth, remote control, operation capability, and have become more accurate and helping the mineral exploration and mining industry in a big way. For example, most exploration geochemists use GPS to establish field/sample locations and these systems are now being integrated into all these field-portable instruments. This article discusses the utility of the information on indicator minerals and pathfinder elements obtained by various portable instruments for identifying different ore deposits both on land and the ocean floor. The basic principles on which these portable instruments work, their strengths and limitations, and evaluation of their performance using some practical examples are also presented.

2. Indicator Minerals

Magmatic and hydrothermal minerals, such as zircon, apatite, titanite and rutile, are resistant to weathering and so end up in the soil, till, or stream sediments, indicating their presence in the bedrock of a specific type of mineralization, hydrothermal alteration, or lithology, and these minerals are increasingly targeted in mineral exploration studies [8]. These are called indicator minerals, which provide information of source magma chemistry, including crystallization temperatures, degree of fractionation, water content, and oxidation state. Indicator minerals have become important in the exploration of gold, diamond, rare earth elements (REE), platinum group elements (PGE), base metals, and lithium deposits in the past four decades and now. Currently, suites of indicator minerals for different types of deposits have been identified by several studies (Table 1). For example, an indicator mineral survey in a glacial dispersal terrain containing highly elevated concentrations of sphalerite grains and minor galena helped to discover the prospect of base metal deposits hosted within the Cretaceous shale bedrock of northern Alberta, Canada [1]. Fayalite (Fe2SiO4), a reddish-brown to black mineral, the iron-rich end-member of the olivine solid-solution series, which can be found worldwide in igneous and abyssal rocks, is mainly mined for use as a gemstone and also for sandblasting. Fayalite crystals in the sediment of granite-like magma can contain large amounts of HREE [9]. Hence, fayalite helps to locate untapped REE deposits. Porter et al. [10] described the use of the chemistry of detrital rutile as an indicator of mineralizations and identified some trace elements that uniquely distinguish rutile grains derived from mineralizations from those sourced from barren rocks. For example, rutile minerals sourced from Au deposits and enriched in Sb can be distinguished from rutile from pegmatites, which are enriched in Nb, Ta and Sn. Rutile minerals from barren rocks can be identified using W and Fe contents. Nzulu et al. [11], in their gold exploration studies in the Kubi Gold Project in the central region of Ghana with XRD studies, observed that the major pathfinding minerals for gold were quartz, magnetite, and hematite. On the other hand, the contributions from minerals such as pyrite, arsenopyrite, iridosmine, scheelite, tetradymite, garnet and gypsum were found to be insignificant.

3. Pathfinder Elements

During exploration studies, pathfinder elements together with indicator minerals (Table 1) provide a means to evaluate large areas for their mineral potential by eliminating likely barren areas from the areas under consideration. For example, mercury has been recognized as an indicator element for both noble and base metal deposits [26]. In addition, As, Mo, Ag, Sn, Sb, Te, W, and Bi are also found to act as pathfinder elements for gold [27]. Though the use of As, Sb, and Bi in stream sediments as pathfinder elements for base metal mineralization is well known, the influence of groundwater pH on the hydromorphic dispersion patterns of As, Sb, and Bi are required to be considered during data interpretation [18]. Somarin and Steinhage [28] used Ni and Cu as pathfinder elements in the exploration study of PGE. These two elements were easily detected by pXRF and also showed positive correlations with the precious metals, indicating that they can be used as pathfinders. Thus, the indicator minerals and pathfinder elements together provide a powerful and cost-effective means to evaluate large areas for their mineral potential. Sometimes the strongest signal came from the pathfinder element, such as Tl, and the target elements Pb and Ag gave only a weak signal [29]. Nude et al. [12], in their gold exploration studies in the Wa-Lawra Belt, Northwest Ghana, using a multivariate statistical approach, found that Fe and Mn are strongly associated with gold, and alongside Pb, Ag, As, and Cu, these elements could be used as pathfinders for gold in the area, with ferruginous zones as targets. Kadel-Harder et al. [30], in their study identifying pathfinder elements for gold in the Cripple Creek alkaline igneous rock-related, low-sulfidation epithermal gold telluride deposit in Colorado, US, found that Ag, As, Bi, Te, and W are the best pathfinders, and tellurides, fluorite, quartz, carbonates, roscoelite, tennantite-tetrahedrite, pyrite, sphalerite, muscovite, monazite, bastnäsite, and hübnerite are the indicator minerals to gold mineralization in low-grade disseminated ores.

Element Ratios

Sometimes, the element ratios may be useful to evaluate litho-geochemical data as a guide to different types of mineralization in rocks that either display alteration or have no recognizable alteration. For example, K/Rb values of 4.8 indicated highly fractionated bedrock and, therefore, a possible target for Li during lithium exploration studies [31]. These ratios can be used for the identification and assessment of granitic parent rock fertility with respect to the hosting potential of pegmatites. Lithium-bearing pegmatites are commonly referred to as lithium-cesium-tantalum (LCT) pegmatites due to the enrichment in the incompatible elements of Li, Cs, Sn, Rb, and Ta. Fertile granites exhibit elevated Rb, Cs, Sn, and Ta, as well as lower K/Rb ratios than typical granites. Granites associated with mineralization commonly show a high Rb/Sr ratio as a result of fractionation, and an increase in Rb/Sr values has been reported from the periphery to the core of a porphyry copper deposit [32]. Recently Mg/Fe, Cr/Al and Ca/Na ratios were used in order to understand the chemical and mineralogical expressions of large- and local-scale processes and to make detailed interpretations relevant for the genesis of mineralizations and metal distributions in chromite, orthopyroxene, and plagioclase in drill cores from Merensky Reef and UG-2 [33]. Cao et al. [34] used the whole-rock Ba, V/Ti, and Cu/S determined by pXRF, and plagioclase, olivine, and clinopyroxene compositions measured by bench-top scanning electron microscope-energy-dispersive spectrometer (SEM-EDS) to explore PGE deposits.

4. Portable Techniques for Mineral Exploration Studies

As most of the surface and near-surface mineral deposits have already been identified, the current emphasis is to look for deposits in unexplored or under-explored areas, inaccessible regions, and also low-grade ore regions. After identifying surface expressions, it is necessary to take advantage of the help of the techniques that have the ability to locate deeply buried mineral deposits, and drilling is required to confirm the deposits later on. However, currently, satellite images and aerial photographs provide clear information on the geological structures and mineral alteration patterns by which potential areas for mineral exploration can be identified. In addition, both multispectral and hyperspectral sensors play a greater role in mineral exploration studies as they can cover larger areas. Several studies [35,36] have demonstrated that geostatistical analysis techniques of bedrock and stream sediments were successful in determining the background and threshold values and identifying Au and pathfinder anomalies. In addition, the number of faults and folds, in particular their junctions, also help because those faults, fracture systems, and permeability together enhance an easier and faster flow of hydrothermal fluids towards the surface, which results in the formation of geochemical anomalies. For example, critical aspects, such as the geological setting, rock types, minerals, pathfinder element enrichments, the drainage patterns, and the geophysical signatures, must favor identifying a deposit. Recent studies indicated that groundwater is an important medium for the geochemical exploration of different styles of mineralization, including those of PGE, gold, and uranium [37,38,39]. Modern commercial miniature devices are commonly lighter than two kilograms and can be used in the field with ease [40]. Crocombe [41] gave a very comprehensive summary of portable instruments, which includes their history, technologies used, applications, and current developments. Some of the most important portable analytical techniques used for the determination of indicator minerals and pathfinder elements will be discussed in the following in a more detailed manner.

4.1. Portable Vis-NIR-SWIR Macro-Spectroscopy

Hyperspectral imagery (HSI) or reflective spectroscopy using field-portable visible–near-infrared–short-wave infrared (Vis-NIR-SWIR) spectroscopy is a valuable tool in the mineral exploration industry. Short-wavelength infrared (SWIR) spectrometers, which provide high spectral and spatial resolution data that may be used to map a broad range of mineral species associated with alteration and mineralization, help in increasing exploration throughputs. Infrared spectrometry is used to determine the mineral species, mineral composition, and crystallinity of some common clay, carbonate, and sulfate minerals present in rock samples. This technology measures the wavelengths of infrared light absorbed by the different chemical bonds to identify minerals present in a sample [42]. Each of the target minerals has a characteristic IR absorption pattern using which the mineral can be identified in addition to chemical variations and degree of crystallinity of minerals. These features can assist the exploration geologist in the interpretation of the style of the mineral system under investigation and also understand mappable vectors toward zones that may host higher grades of the target commodity. The HSI remote sensing technique is applied from airborne and spaceborne platforms directly to map a wide range of minerals in large areas. While satellite or airborne based his platforms are advantageous for large-scale regional mapping, ground-based or drone-borne HSI can provide structural and mineralogical maps of outcrops with mm to cm precision. Earlier instruments covered visible (Vis) and near-infrared (NIR) spectral ranges, but current instruments can cover the short-wave infrared (SWIR) and thermal infrared (TIR) ranges also. Figure 2 presents a portable UV–Vis–NIR (250–2500 nm range) spectrometer used for field geology. These field spectrometers with powerful sensors allow data capture over a wide spectral range and provide information about the abundance and spatial location of ore and pathfinder minerals in drill-core, hand samples, and outcrops with mm to cm precision in small, selected areas. Recently, Booysen et al. [43] were able to identify lithium-bearing pegmatites at Uis, Namibia, by hyperspectral imaging of mineralized outcrops. Later, these findings were validated by drill-core data generated by XRD analysis and LIBS measurements. Many of the alteration minerals, such as quartz, adularia, chlorite, illite, calcite, and pyrite, can only be identified using XRD or SWIR reflectance spectroscopy. Reflectance spectroscopy analyses are mostly made in the field using portable instruments directly on the rock sample that permits the collection of large datasets of closely spaced samples and require no sample preparation, unlike XRD. XRD can detect a wider range of minerals; on the other hand, SWIR spectroscopy is a very rapid, low-cost technique and permits the collection of large datasets of closely spaced samples, which is not possible by XRD [44]. For example, VNIR-SWIR spectra of muscovite/white mica spectrum are shown in Figure 3. HSI can be used to identify various surficial rock-forming minerals, as well as rare earth elements (REE). Neodymium (Nd) has some of the most pronounced absorption features among the REE and, therefore, can be used as a key pathfinder element for total REE. Nd has characteristic absorption features in the visible to near-infrared (VNIR) range of the electromagnetic spectrum at 580, 750, and 800 nm. Booysen et al. [45] carried out REE exploration studies using an innovative and non-invasive unmanned aerial vehicle (UAV)-based hyperspectral methodology for the first time, demonstrating the direct mapping of REE with lightweight hyperspectral UAV platforms. Recently, Barton et al. [46] used a drone and tripod-based field hyperspectral imaging for large-scale mineral mapping in and around the active Lisbon Valley copper mine, demonstrating the utility of hyperspectral imaging as a technique for general mineral characterization in mining applications. Stuart et al. [47] went a step further and introduced a low-cost smartphone-based hyperspectral imaging system that can convert a standard smartphone camera into a visible wavelength hyperspectral sensor and obtained a dataset of an obsidian flow-banded ash tuff, clearly highlighting the individual flow bands with the key reflectance feature spectral curve for sulfur at ca. 500 nm. In the case of lithium exploration, two of the major pathfinder minerals for lithium are lepidolite and spodumene (Table 1). A sample can be identified as lepidolite with distinct features at 580, 2190, and 2340 nm. A spodumene sample could show absorption features at 550, 1980, and 2320 nm by a NIR field spectrometer covering the 350–2500 nm range. Soil spectroscopy by portable instruments also minimizes the number of soil samples collected for laboratory studies, which also require extensive sample pre-treatment procedures, such as drying and grinding. The near-infrared spectroscopy can distinguish the crystallinity of single minerals (clay minerals, chlorite, serpentine, etc.), containing hydroxy silicate minerals (epidote, amphibole, etc.), sulfate minerals (alunite, pyrite potassium alum, gypsum, etc.), and carbonate minerals (calcite, dolomite, etc.) in the layered silicate. Liancun et al. [48] used a portable near-infrared spectrometer to acquire characteristic spectra of altered minerals, and to establish the relationship between altered minerals and ore-forming.

4.2. Portable Fourier Transformed Infrared Spectrometer (FTIR)

In the pursuit of the search for valuable minerals and obtaining insight into the distribution of mineral grades, yet another low-cost and rapid technique called portable Fourier transformed infrared spectrometer (FTIR) was developed, which is based on the absorption of light from the spectrum of a light source. The first portable Fourier transform infrared (FT-IR) spectrometer, with the size of a briefcase, was introduced by SensIR in about 2000 [41]. IR spectroscopy absorbs a monochromatic IR light at a time and draws the spectrum, whereas in FTIR, multi-chromatic (a beam from several frequencies of light) takes a summarized absorption of light and distributes it to create a spectrum using FTIR. Dispersion or Fourier transform is used for spectral analysis. FT-IR is a faster, more effective, and non-destructive technique that provides information about the chemical composition, mineralogical, and structural features of a geological sample and requires little or no sample preparation. In general IR, mineralogical techniques can be applied to crystalline, non-crystalline, organic, and inorganic materials. Near-IR band (pNIR) or the middle IR band (pMIR) of the electromagnetic spectrum can be used to determine the presence of certain minerals by identifying features in a transmitted or reflected spectrum. Figure 4 presents a photo of a commercial portable FTIR spectrometer and its schematic diagram. These instruments usually operate in diffuse reflectance, but attenuated total reflection (ATR) can also be used for spot surficial measurements for identifying a variety of minerals, as well as organic compounds [49]. Near-infrared (NIR), as well as hyperspectral visible to near-infrared (VNIR), have been considered as potential tools for ore sorting. Silicate, carbonate, and hydroxide minerals are known to be active in the middle infrared (MIR) range and display a unique reflectance feature due to fundamental stretching and vibrational motions [50]. FTIR is a rapid, non-destructive, and low-cost method that requires little sample preparation (samples are crushed and pelletized before measuring the reflectance spectra) or no sample preparation, and the modal mineralogy data obtained often complement the elemental analysis by pXRF and LIBS for target identification and delineation.

4.2.1. FTIR Spectroscopy in Copper Mining and Metallurgy

Dehaine et al. [52] used portable FTIR spectroscopy to measure the mineralogy of drill core samples from the sediment-hosted Cu-deposits of the Democratic Republic of Congo. The type of mineral assemblages and gangue mineralogy will have a bearing on the extraction process (i.e., leaching vs. flotation) to be used for the extraction of Cu and Co. A comprehensive understanding of the variation of ore mineralogy and texture in the deposit is essential in order to optimize resource efficiency and reduce technical risks and environmental impacts.

4.2.2. FTIR Spectroscopy in Limestone Industry

With the current focus in the mining industry on reducing costs while simultaneously improving ore quality, FTIR is a tool that can potentially assist companies to meet both challenges. Changes in the nature of infrared spectra are strongly influenced by changes in mineralogy, which is a key input variable for exploration and mining. Carbonate rocks mostly contain calcium magnesium carbonate (MgCa(CO3)2) and calcium carbonate (CaCO3), and are particularly used in the construction sectors as cement raw materials or used in the production of fertilizers. Thus, they can be classified into two dominant minerals: dolomite (MgCa(CO3)2) and limestone (CaCO3) in the form of calcite, vaterite, or aragonite. Bawa et al. [53] successfully used FTIR, as well as XRD, for the identification of the limestone from Chadawanka (Tahoua, Niger).

4.2.3. Characterization of Different Minerals in River Sand

FTIR spectroscopy was utilized for the identification of different minerals in the river sand samples collected from Ponnai river, Tamil Nadu, India. IR peaks observed for quartz, feldspar, kaolinite, calcite, gibbsite, and organic carbon were confirmed by XRD technique, as well as energy-dispersive X-ray spectrometry (SEM/EDS) analysis [54].

4.2.4. FTIR in Hydrocarbon Exploration

Several studies had demonstrated the capability of FTIR spectroscopy and microscopy for the identification of clay minerals in reservoir rocks, non-destructive and express analysis of the chemical structure, and distribution of organic matter in rocks, including the study of kerogen composition and its maturity in organic-rich shales for guiding regional oil exploration [55,56,57].

4.3. Radiometric Surveys

Radiometric or gamma-ray spectrometry surveys have been widely used in studies related to mineral exploration, geological mapping, and environmental radiation monitoring. One of the most significant advances in uranium exploration has been the development of gamma-ray spectrometric techniques beyond several other applications, including geothermal exploration [58,59]. Using the natural radioactivity of certain elements/isotopes (e.g., 40K, 234Th, 238U), the concentrations of these elements can be determined by using hyperspectral remote sensing γ-ray spectrometry (e.g., Geiger–Müller counter), fluorimetry, and other geochemical techniques by drone and handheld instruments for the generation of precise mapping of these radioactive elements in selected areas. The radiometric methods are capable of detecting these elements at the surface of the ground, in drill holes, and even on outcrops. The common radioactive minerals are uraninite, monazite, thorianite, rubidium-rich feldspars in a granitic pegmatite, muscovite, and sylvite in acid igneous rocks. The earliest detectors on logging tools were Geiger–Müller counters, but these have been replaced by crystal scintillation detectors in most modern tools. These techniques are especially valuable in studies related to uranium exploration [60]. Maden and Akaryali [61] used potassium as a pathfinder element along with magnetic data to identify gold mineralization zones associated with the K alteration in the eastern Pontide orogenic belt of the Alpine-Himalayan system. The deposit has a high level of altered rock surrounding the deposits, which usually have a distinct radioelement signature useful for exploration studies. Portable gamma-ray spectrometry surveys are particularly well suited to REE exploration studies as the ores of REE may contain traces of anomalous concentrations of radioactive elements, K, U, and Th [62].

4.4. pXRF

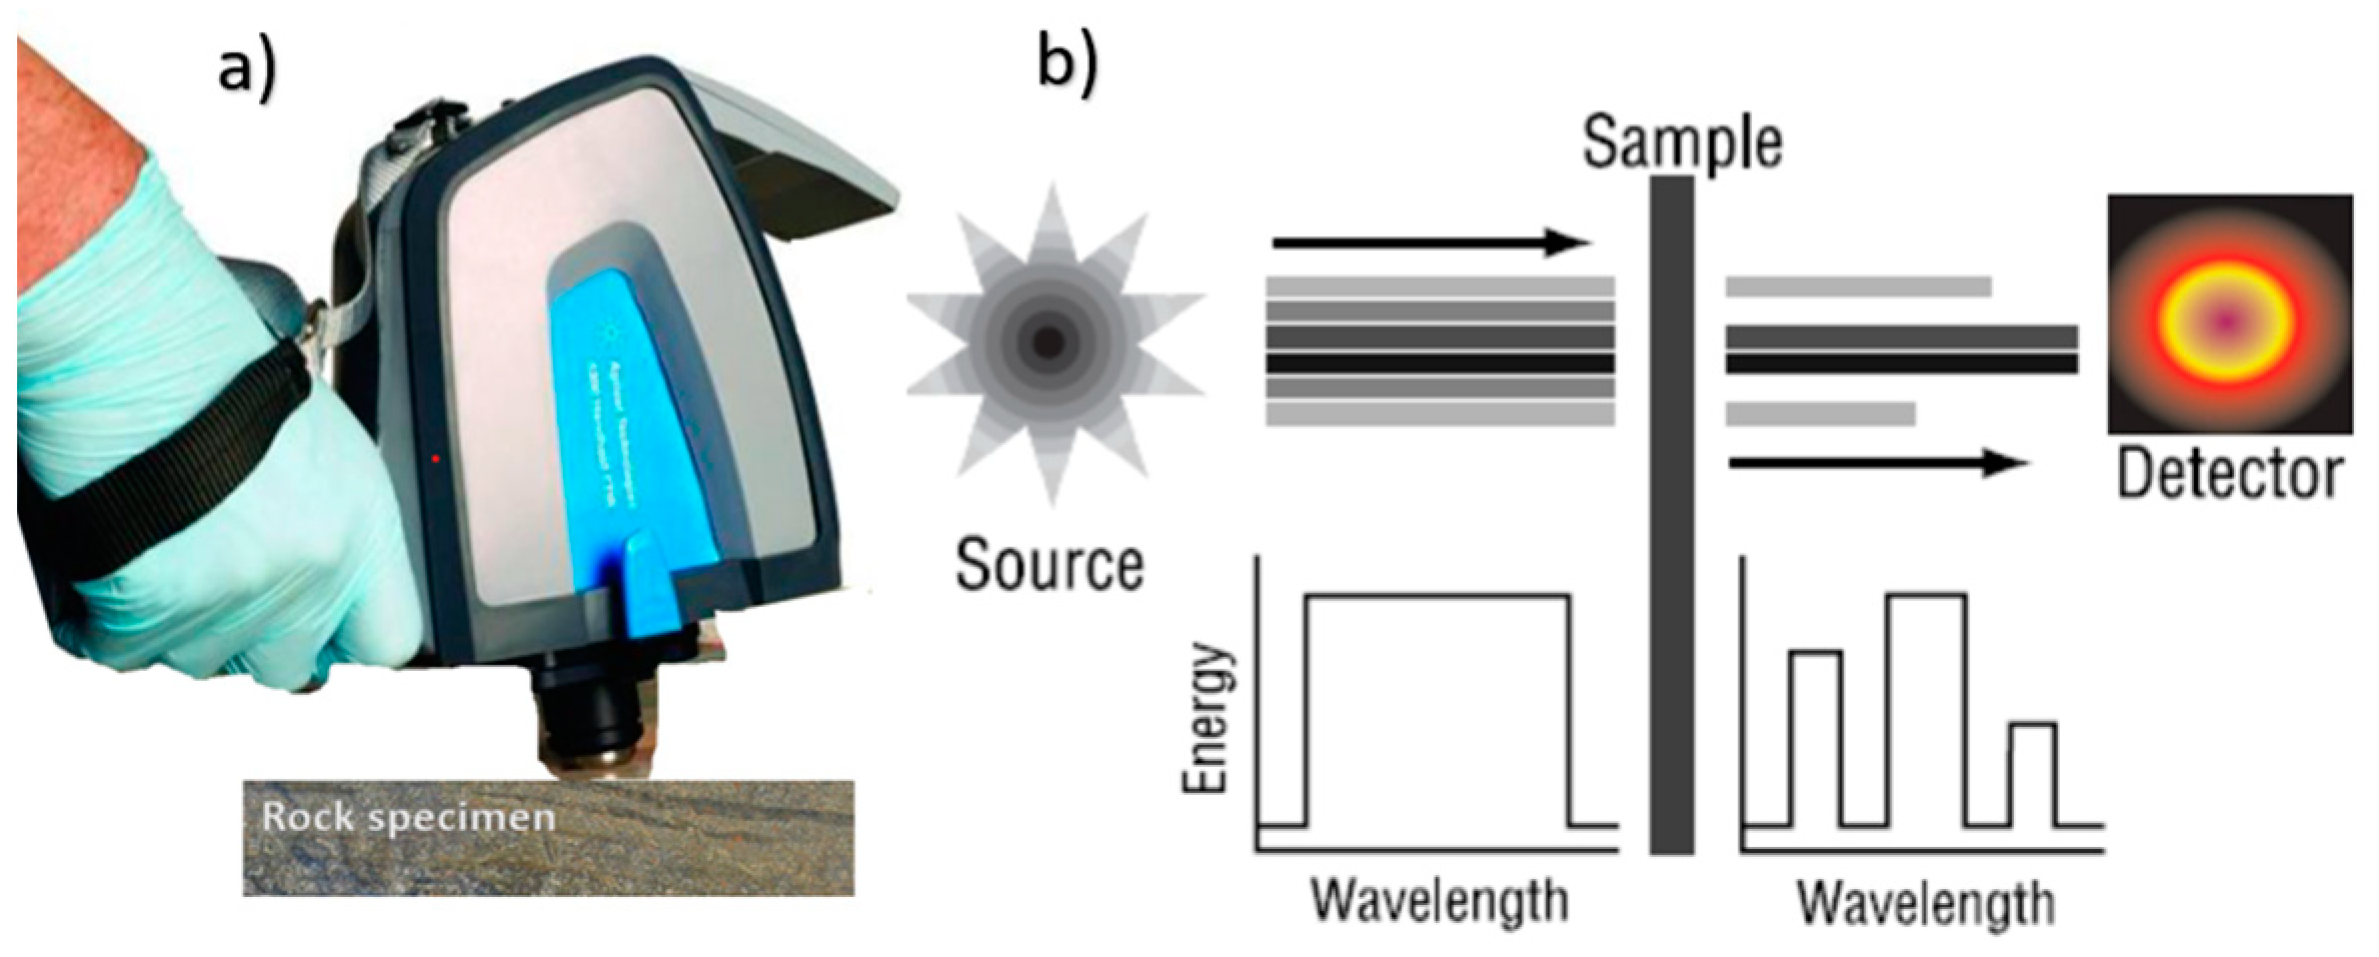
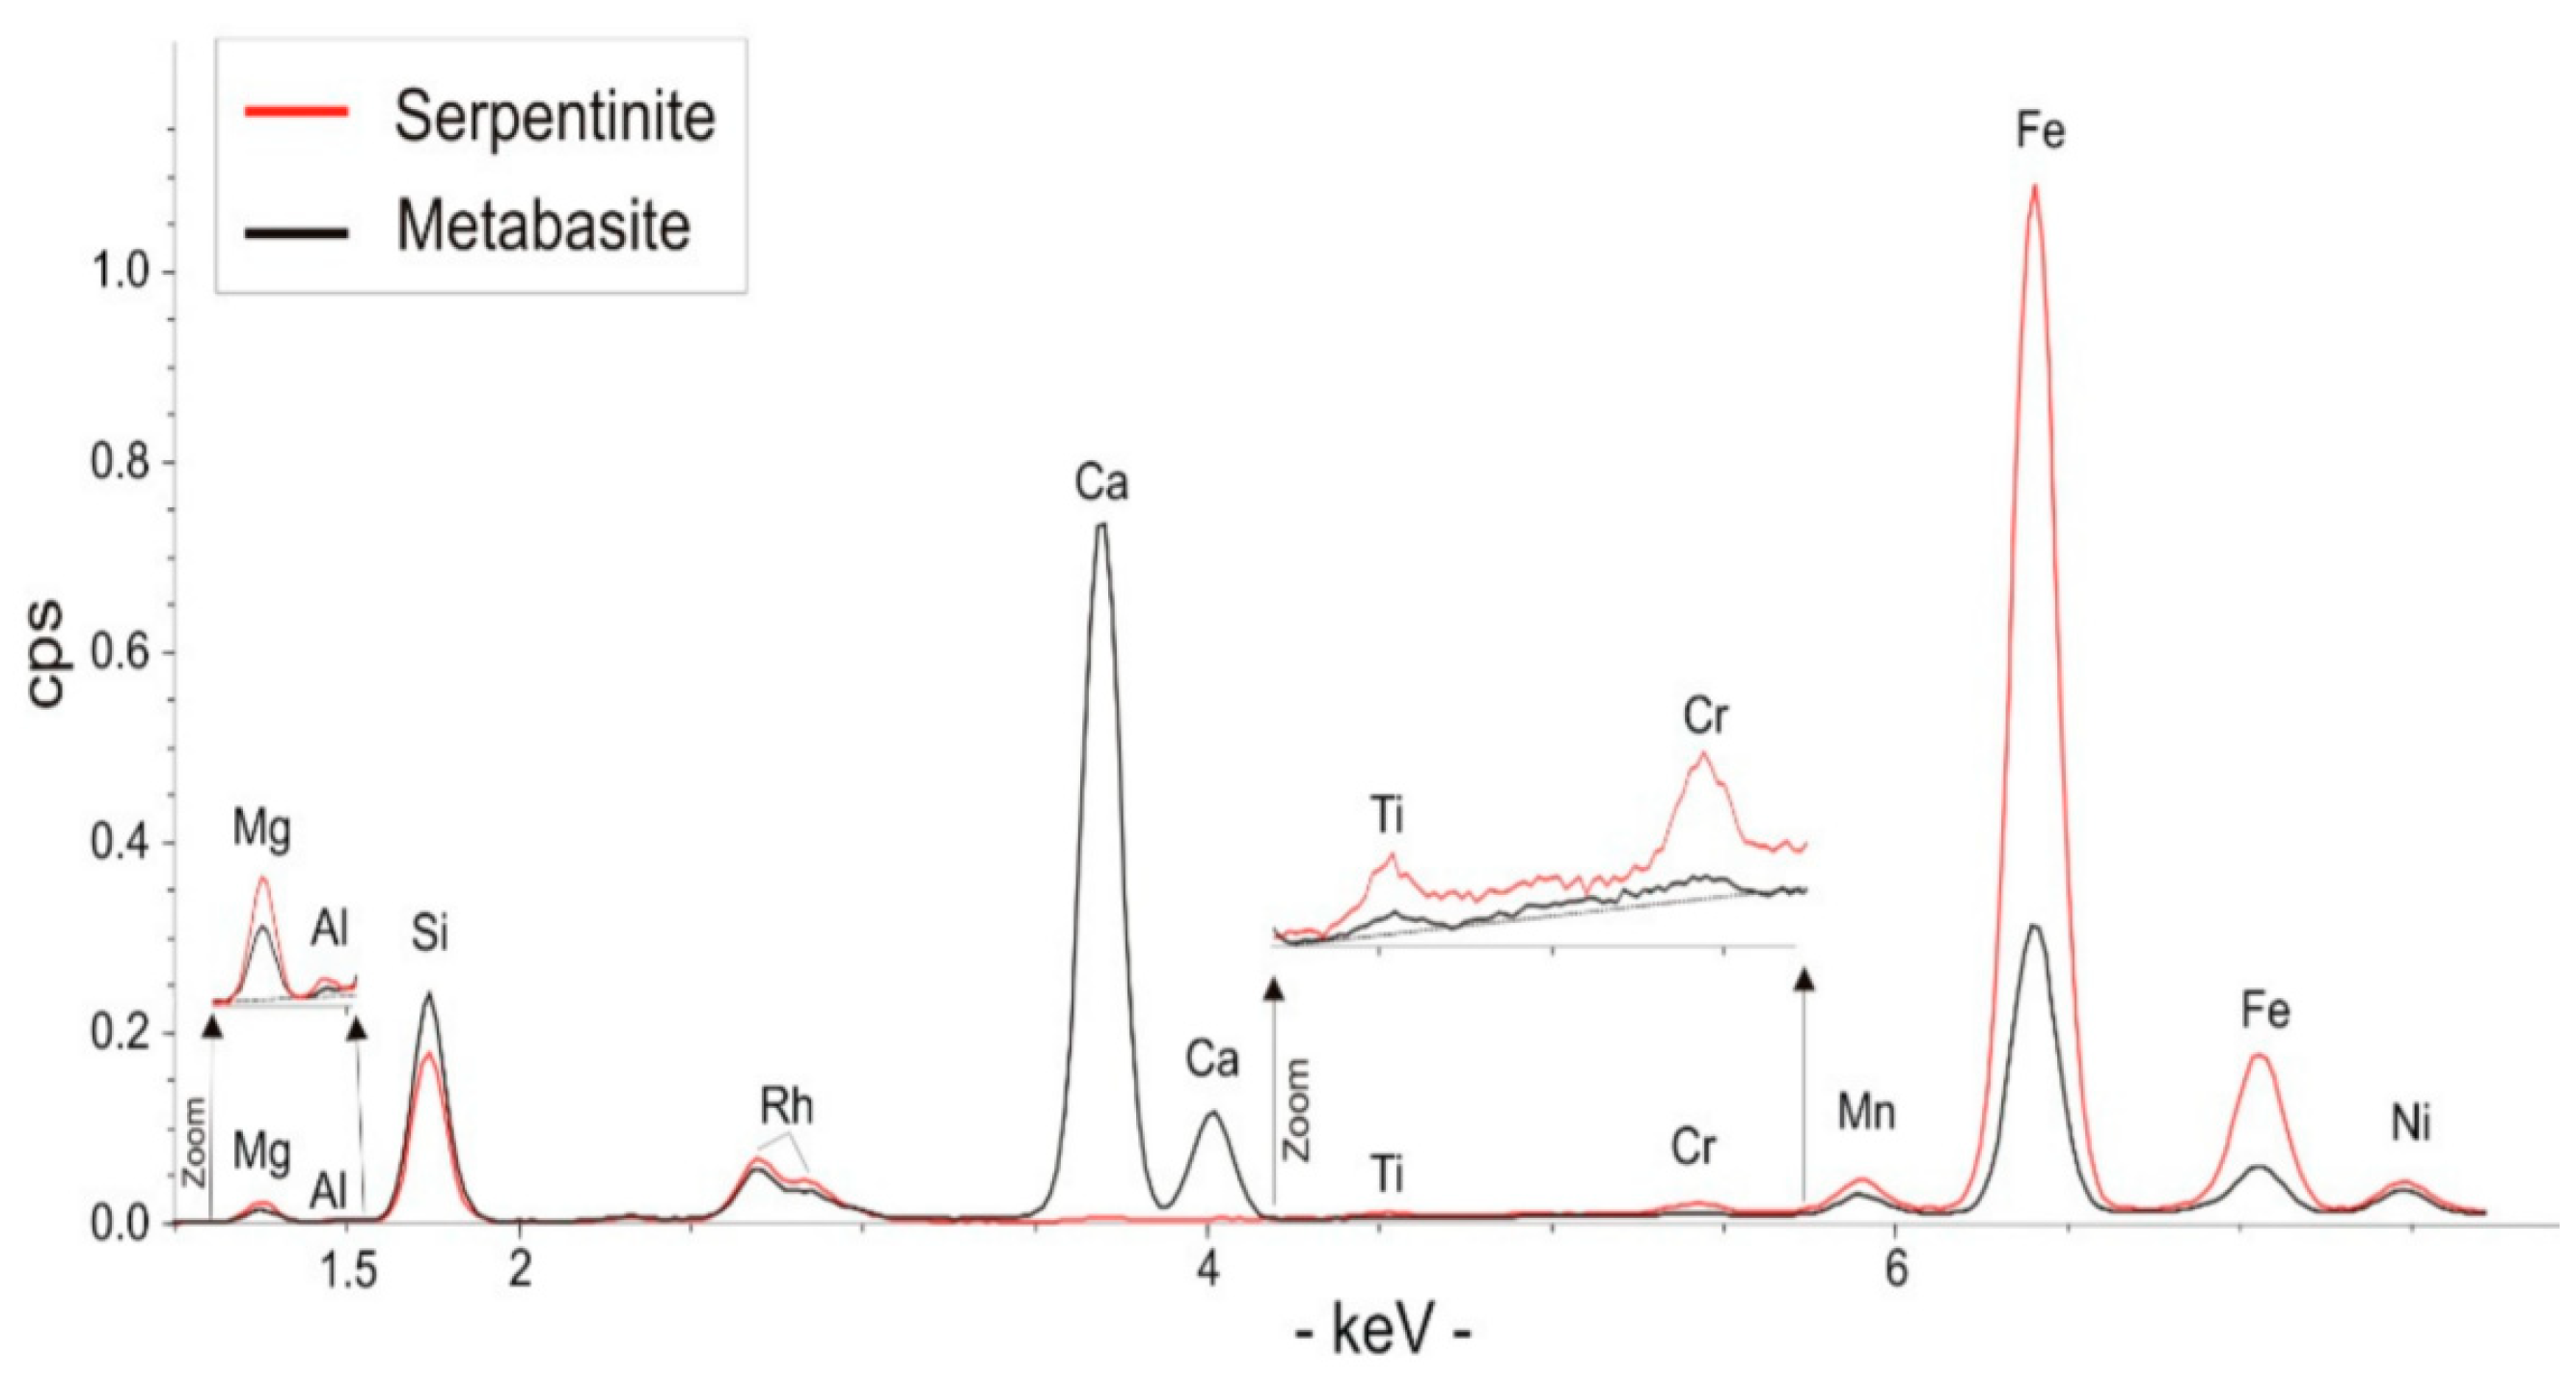
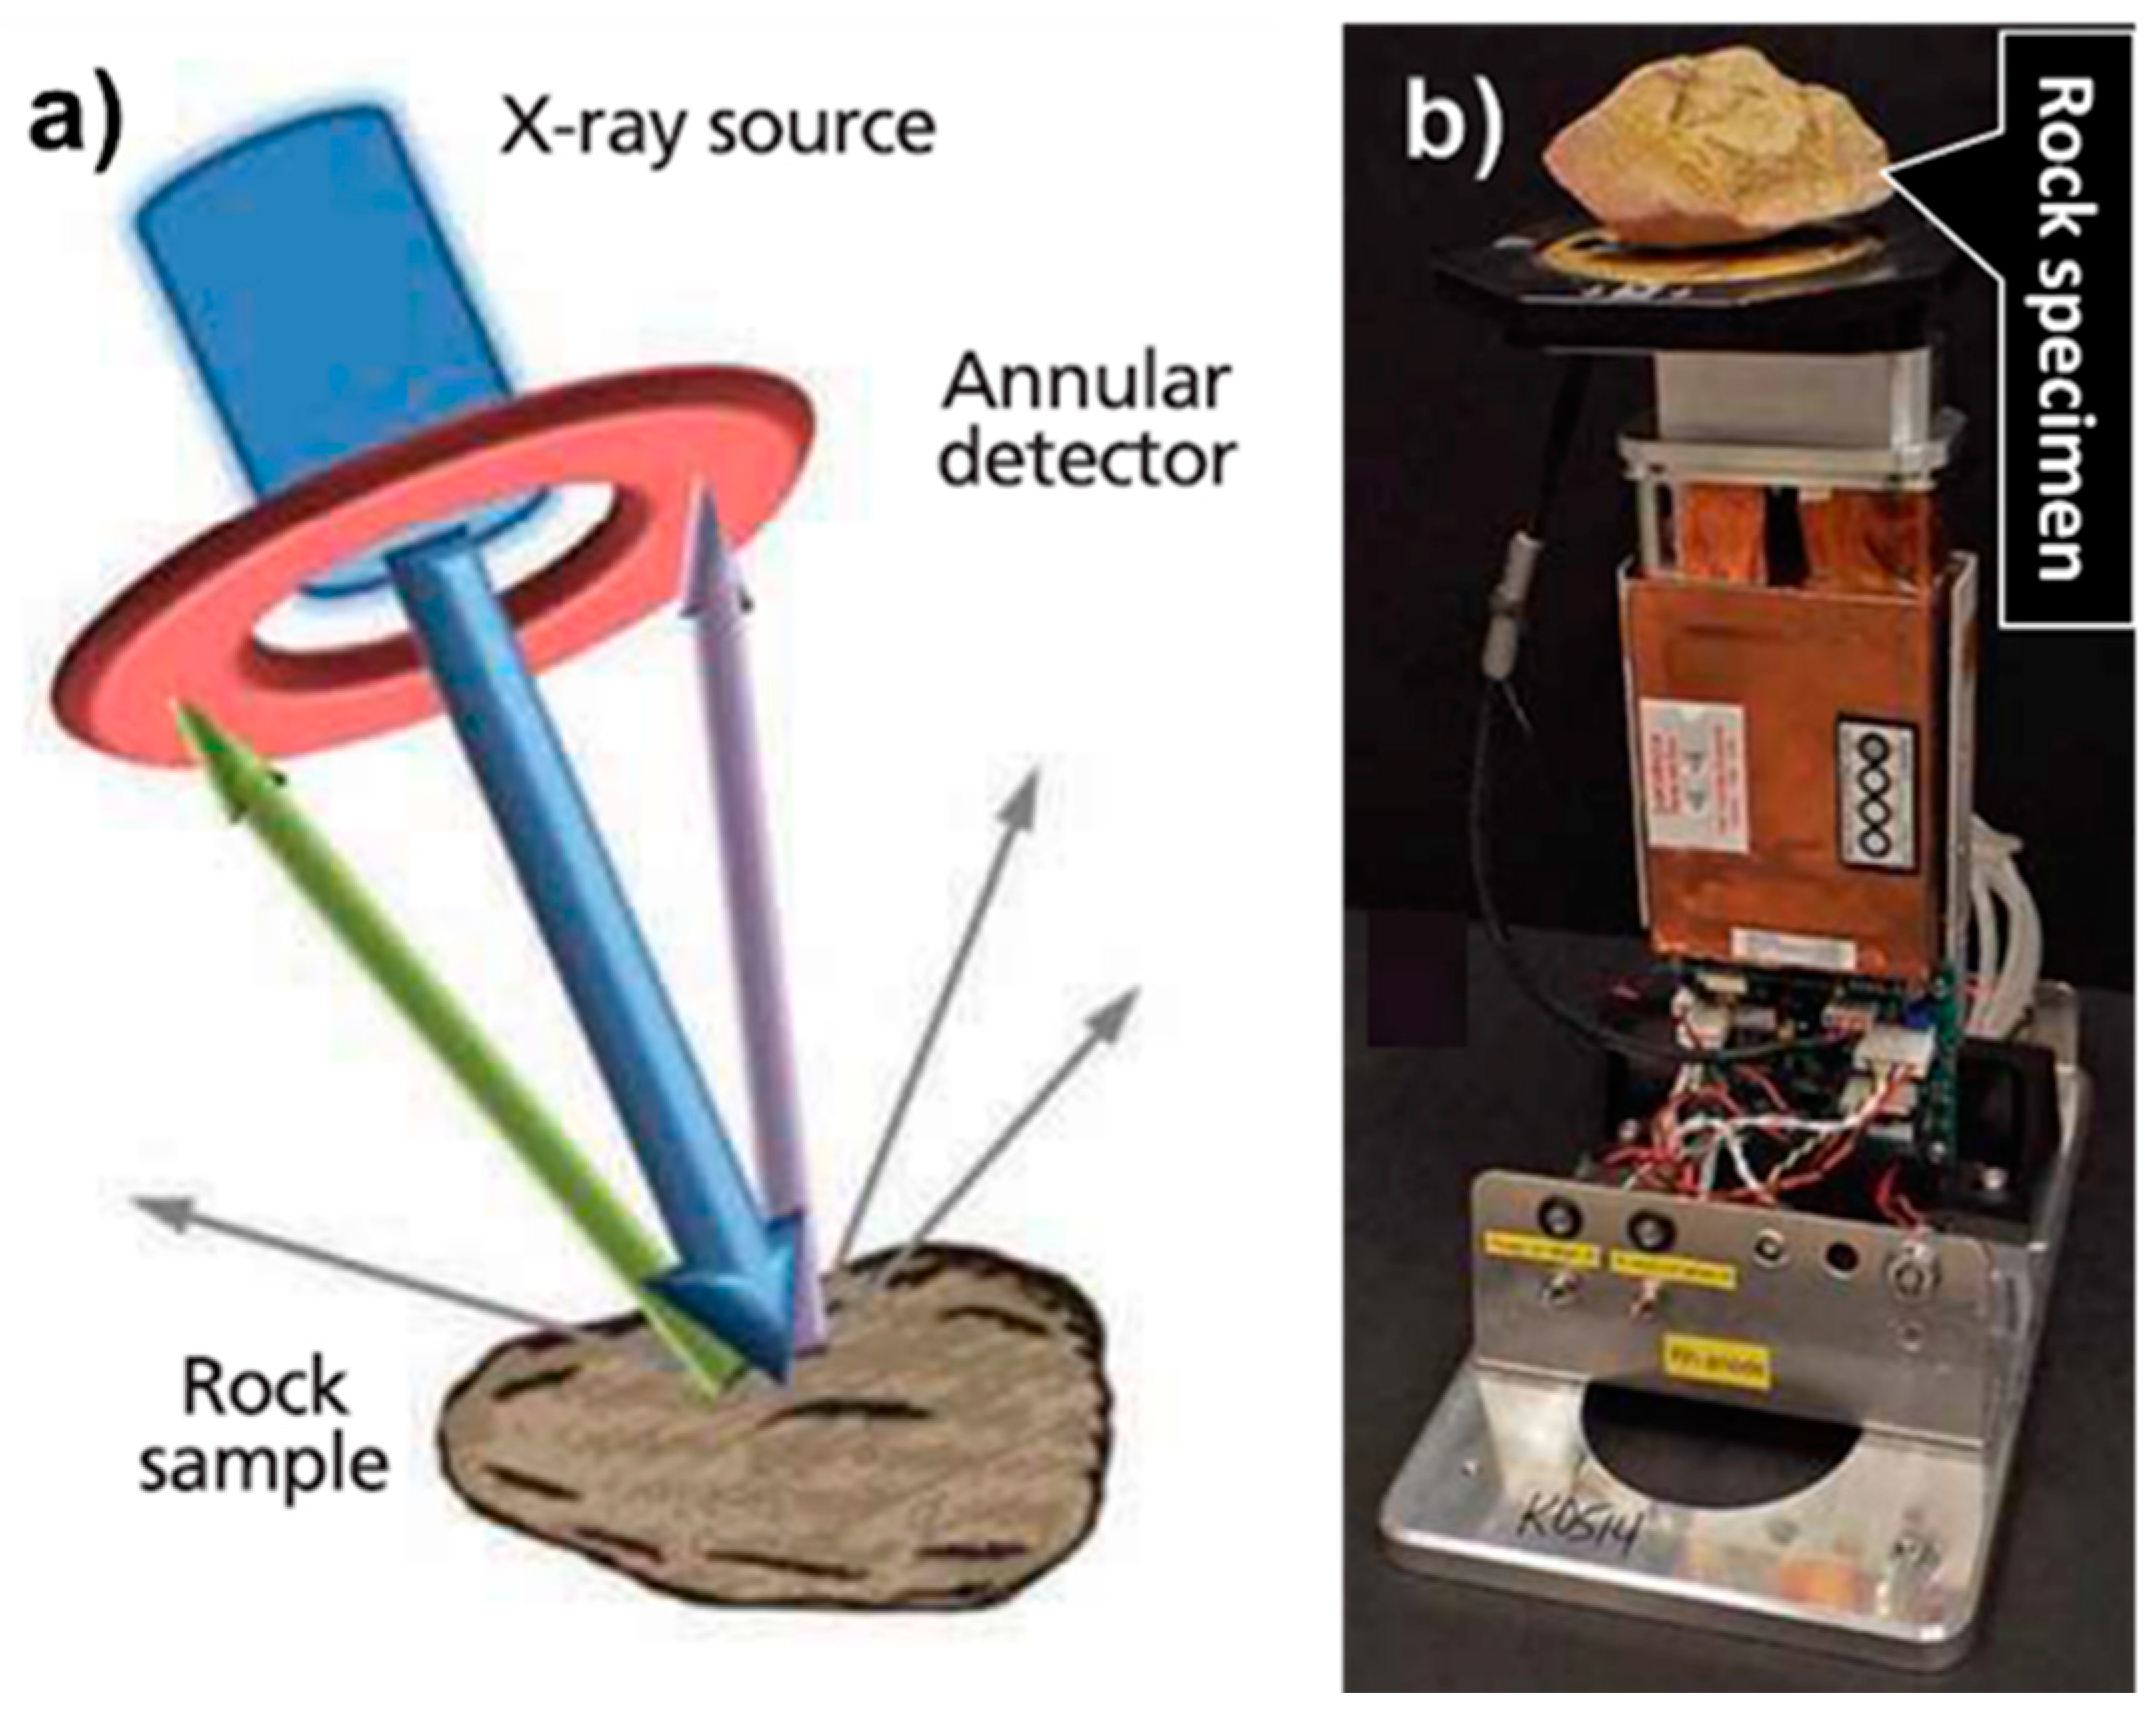
Portable XRF (pXRF) is fast becoming an important toolkit for geochemical exploration studies. Bosco [63] described the history and instrumental developments and general applications of pXRF instruments. When a sample is bombarded with an X-ray beam with spot sizes of 0.5 to 2 mm, electrons get displaced from the inner shell of an atom, and the vacancy from the inner shell then gets replaced with an electron from an outer shell. As this electron fills the vacancy of the inner shell, it releases energy in the form of a secondary X-ray fluorescence, which is characteristic of each element. By measuring these characteristic radiations at a particular wavelength or energy, it is possible to determine the elements (both qualitative and quantitative) present in the sample. The detection and measurement of emitted X-rays are performed in two different ways: (a) wavelength dispersive XRF (WD-XRF) employs a crystal, a kind of diffraction grating to disperse the spectrum according to X-ray wavelength—rather like a prism that splits visible light into the colors of the rainbow, and (b) energy-dispersive XRF (ED-XRF) determines the energies of different X-rays in the spectrum directly. Portable XRF (pXRF) is a miniature version of ED-XRF. A schematic diagram showing the configuration of a typical handheld XRF analyzer is presented in Figure 5. A portable XRF is simple to use, can easily be carried and operated using only one hand and can provide an on-site non-destructive chemical analysis of over 30 elements ranging in concentration from about 10 µg/g to 100%, in less than a minute with detection limits ranging from 5 to 10 µg/g in the field (Table 2). Figure 6 depicts a spectrum of serpentinite and meta basaltic rocks obtained by portable XRF. Recent developments in microelectronics and advanced chips helped to drastically reduce the size of specialist components of sophisticated analytical instrumentations in general [64,65,66,67]. The triboluminescent X-ray generation technology eliminated the high-voltage power supply and has a profound impact on current day XRF technologies, enabling cost and size reductions at a scale not possible with conventional technology [68]. These advancements made new generation pXRF instruments very powerful. Some important features include the rapid collection of data on a large number of samples and replicate analyses, the acquisition of higher data density compatible with geostatistics, lower detection limits for several elements, most inter-element interferences are automatically corrected for different elements across the periodic table, and these instruments do not require a laboratory environment for proper functioning. However, pXRF has limitations, such as matrix interferences on the elements that can be measured; for example, the interferences from the REE on transition elements can affect the data, which cannot be completely corrected [69].
An XRF is capable of analyzing elements from Mg to U, and its use in the exploration for specialty metals, such as gold, REE, PGE, Nb, Zr, and Ta, has achieved varying degrees of success. Among a number of advantages of pXRF, the possibility to perform on-site measurements with minimum sample preparation is important. Measuring samples in the field will often require some kind of sample preparation, such as preparation of a flat smooth sample surface each time before acquiring the data to ensure accuracy, repeatability, and reliability. However, when sample preparation is not possible, multiple scans with multiple data points are necessary to produce some potential averages. Mini pulverizers and pelletizing kits are also commercially available for grinding small amounts of samples and making quick-pressed sample pellets for the on-spot measurements.

4.4.1. pXRF in Mineral Exploration Using Surface Sediments

pXRF methods of exploration were tested in northern Finland using surface till as a sample material for gold, Ni, and PGE using pathfinder elements (Al, Fe, and Mg) of hydrothermal alteration (Sarala, 2009). The pXRF analyses of some major (Ca, Fe) and most of the base metals (such as As, Cr, Cu, Mn, Ni, Pb, Zn) correlate well with the aqua regia geochemical data of the same elements. The distribution of these elements was comparable to the lithological changes in the underlying bedrock, demonstrating the utility of pXRF in collecting the geochemical data for tracing sources of multi-metal mineralization. For gold exploration studies by pXRF, indicator elements, such as As, Bi, Cu, Mn, and Sb, have to be used instead of Au because of its high detection limit (Table 2) for gold [73]. Somarin et al. [74] demonstrated that a pXRF can produce data of good correlation with the laboratory analysis while utilizing the technique for Ta-Nb-Sn-W ore exploration studies.

4.4.2. pXRF in Li Exploration

Unfortunately, Li and Be are not accessible by this technique as lighter elements have fluorescent X-ray energy levels that are low enough to not reach the detector without being absorbed. Even if they escape the sample, some of them will not be able to penetrate the air between the sample, and the instrument to reach the detector. There must be a recognizable peak within the background noise for the element concentration to be calculated, and with the low-energy light elements, this is a challenge. Though pXRF cannot determine Li, it can accurately detect several pathfinder elements of lithium, such as Cs, Ta, Nb, Sn W, Km and Rb (Table 1), and thus can be extremely useful in the LCT pegmatite exploration studies. van de Ven [75] used pXRF for obtaining an internally consistent geochemical dataset of LCT-pathfinder elements (e.g., Li, Cs, Ta, Nb, Be, Sn, W, K, and Rb) for an effective exploration strategy for LCT pegmatites in New Zealand to identify prospective pegmatites in an 1831 km2 licensed area.

4.4.3. pXRF in REE Exploration

Sedimentary phosphate deposits are the main sources of raw materials for the phosphate fertilizer industry. However, in recent times, these phosphate deposits have been identified as potential sources for REE. Portable XRF was used in the first stage of an orientation survey for sedimentary phosphate occurrences containing REE in South-eastern British Columbia, Canada. The data was used to identify zones of phosphate rocks enriched in REE [76]. Uranium and thorium concentrations can also be monitored by pXRF to eliminate zones containing high concentrations of these elements for the fertilizer industry as these radioactive elements can potentially get accumulated in agricultural soils and even eventually get into the food crops in high concentrations.

4.4.4. Gold and PGE Exploration Studies Using pXRF

Portable XRF was found to be a powerful exploration tool for gold and PGE exploration studies. The determination of a low concentration of desired elements in ore samples is commonly challenging due to matrix effects and peak overlaps. However, in several cases, there is a very good correlation between the data obtained by pXRF in the field and the laboratory data obtained by established techniques, such as ICP-MS [28]. While pXRF instruments may not work well to detect low concentrations of precious metals, they can be excellent for detecting some pathfinder elements, such as Cu, Mg, and Ni. pXRF was successfully utilized to identify the anomalous zones of PGE and Au (target elements) using pathfinder elements Ni and Cu in the exploration of the Pilanesberg PGE deposit, Bushveld Complex, South Africa. Sixty-three core samples were analyzed using both pXRF and laboratory methods. In these samples, Pt < 8 µg/g, Pd < 5 µg/g, and Au < 1 µg/g, which were not detected by pXRF; however, Ni and Cu are up to 6540 and 3560 µg/g, respectively, which were easily detected by the same method. These elements show a positive correlation with the precious metals, indicating that they can be used as pathfinders. Sometime back, Robertson and Feather [77] developed an automated energy-dispersive XRF, which took the detection limit of gold to <1 µg/g. This is very competitive to the well-established fire-assay methods [78]. If this technology is made available for the current pXRF technology, it will be very handy for the gold mining industry in the future. Lemiere [79] provided a comprehensive review of pXRF applications for applied geochemistry studies related to real-time decisions on exploration, mining, site remediation, and waste management.

5. Portable X-ray Diffraction Spectrometer (pXRD)

pXRD provides geologists with reliable, qualitative, and quantitative mineralogical data in near real-time in the field. pXRD is a more definitive mineral identification technique that can identify and quantify a wider range of minerals compared to either SWIR reflectance spectroscopy or Raman spectroscopy. Borisov and Podberezskaya [80] presented the major stages of the development in single-crystal X-ray diffraction analysis. Etter and Dinnebier [81] gave a short overview of powder diffraction, beginning with the first powder diffraction experiment to the current state-of-the-art XRD instruments, which are nowadays supported by extensive software packages and manifold technological possibilities. Figure 7 depicts a schematic diagram and a prototype instrument of a handheld back-reflection ED-XRD technique. XRD is based on crystal constructive interference of monochromatic X-rays and a crystalline sample, following Bragg’s Law. When a monochromatic X-ray beam passes through the sample crystal lattice, some of the radiation is diffracted at an angle known as the Bragg angle and reaches the detector, which is equal to half the angle of the incident radiation. Each crystalline material has a characteristic atomic structure, which is seen in the X-ray diffraction pattern. The peak positions in an XRD spectrum provide information on the spacing of the unit cell, as well as its symmetry, which is crucial for crystal identification. Hansford and Thomas [82] presented a detailed account of the development of energy-dispersive XRD. The portable XRD allows rapid mineral identification in the field but can only analyze powdered rock samples. The technique can easily distinguish between minerals and recognizes them because of their differing crystal structures. The instrument only requires about 15 mg of powder sample and the sample preparation is also very easy; accurate mineral data can be obtained in a few minutes. From the diffractograms obtained (e.g., Figure 8), one can identify the minerals in the rock samples under testing. Modern XRD instruments are very compact in size and are rapid, accurate, and have the ability to perform automated mineral analysis providing useful information in exploration, mining and beneficiation studies. Current global lithium production is derived from lithium-bearing pegmatites, and lithium brines often concentrated in economic mining sites. pXRD can identify the number of Li-bearing minerals (Table 1) in LCT pegmatites [21]. Figure 8 depicts an XRD pattern of the lithium mineral petalite (95% quartz and 5% petalite). Pöllmann and König [83] calculated the lithium content from quantitative mineralogical analysis using pXRD, which led to a fast and reliable lithium determination in the ores and concentrates during lithium exploration studies. With several advancements in instrumental components, such as X-ray tubes, detectors, processors, and more powerful software packages, the pXRD has become a highly reliable qualitative and quantitative mineralogical tool with potential applications in exploration and mining.

6. pLIBS

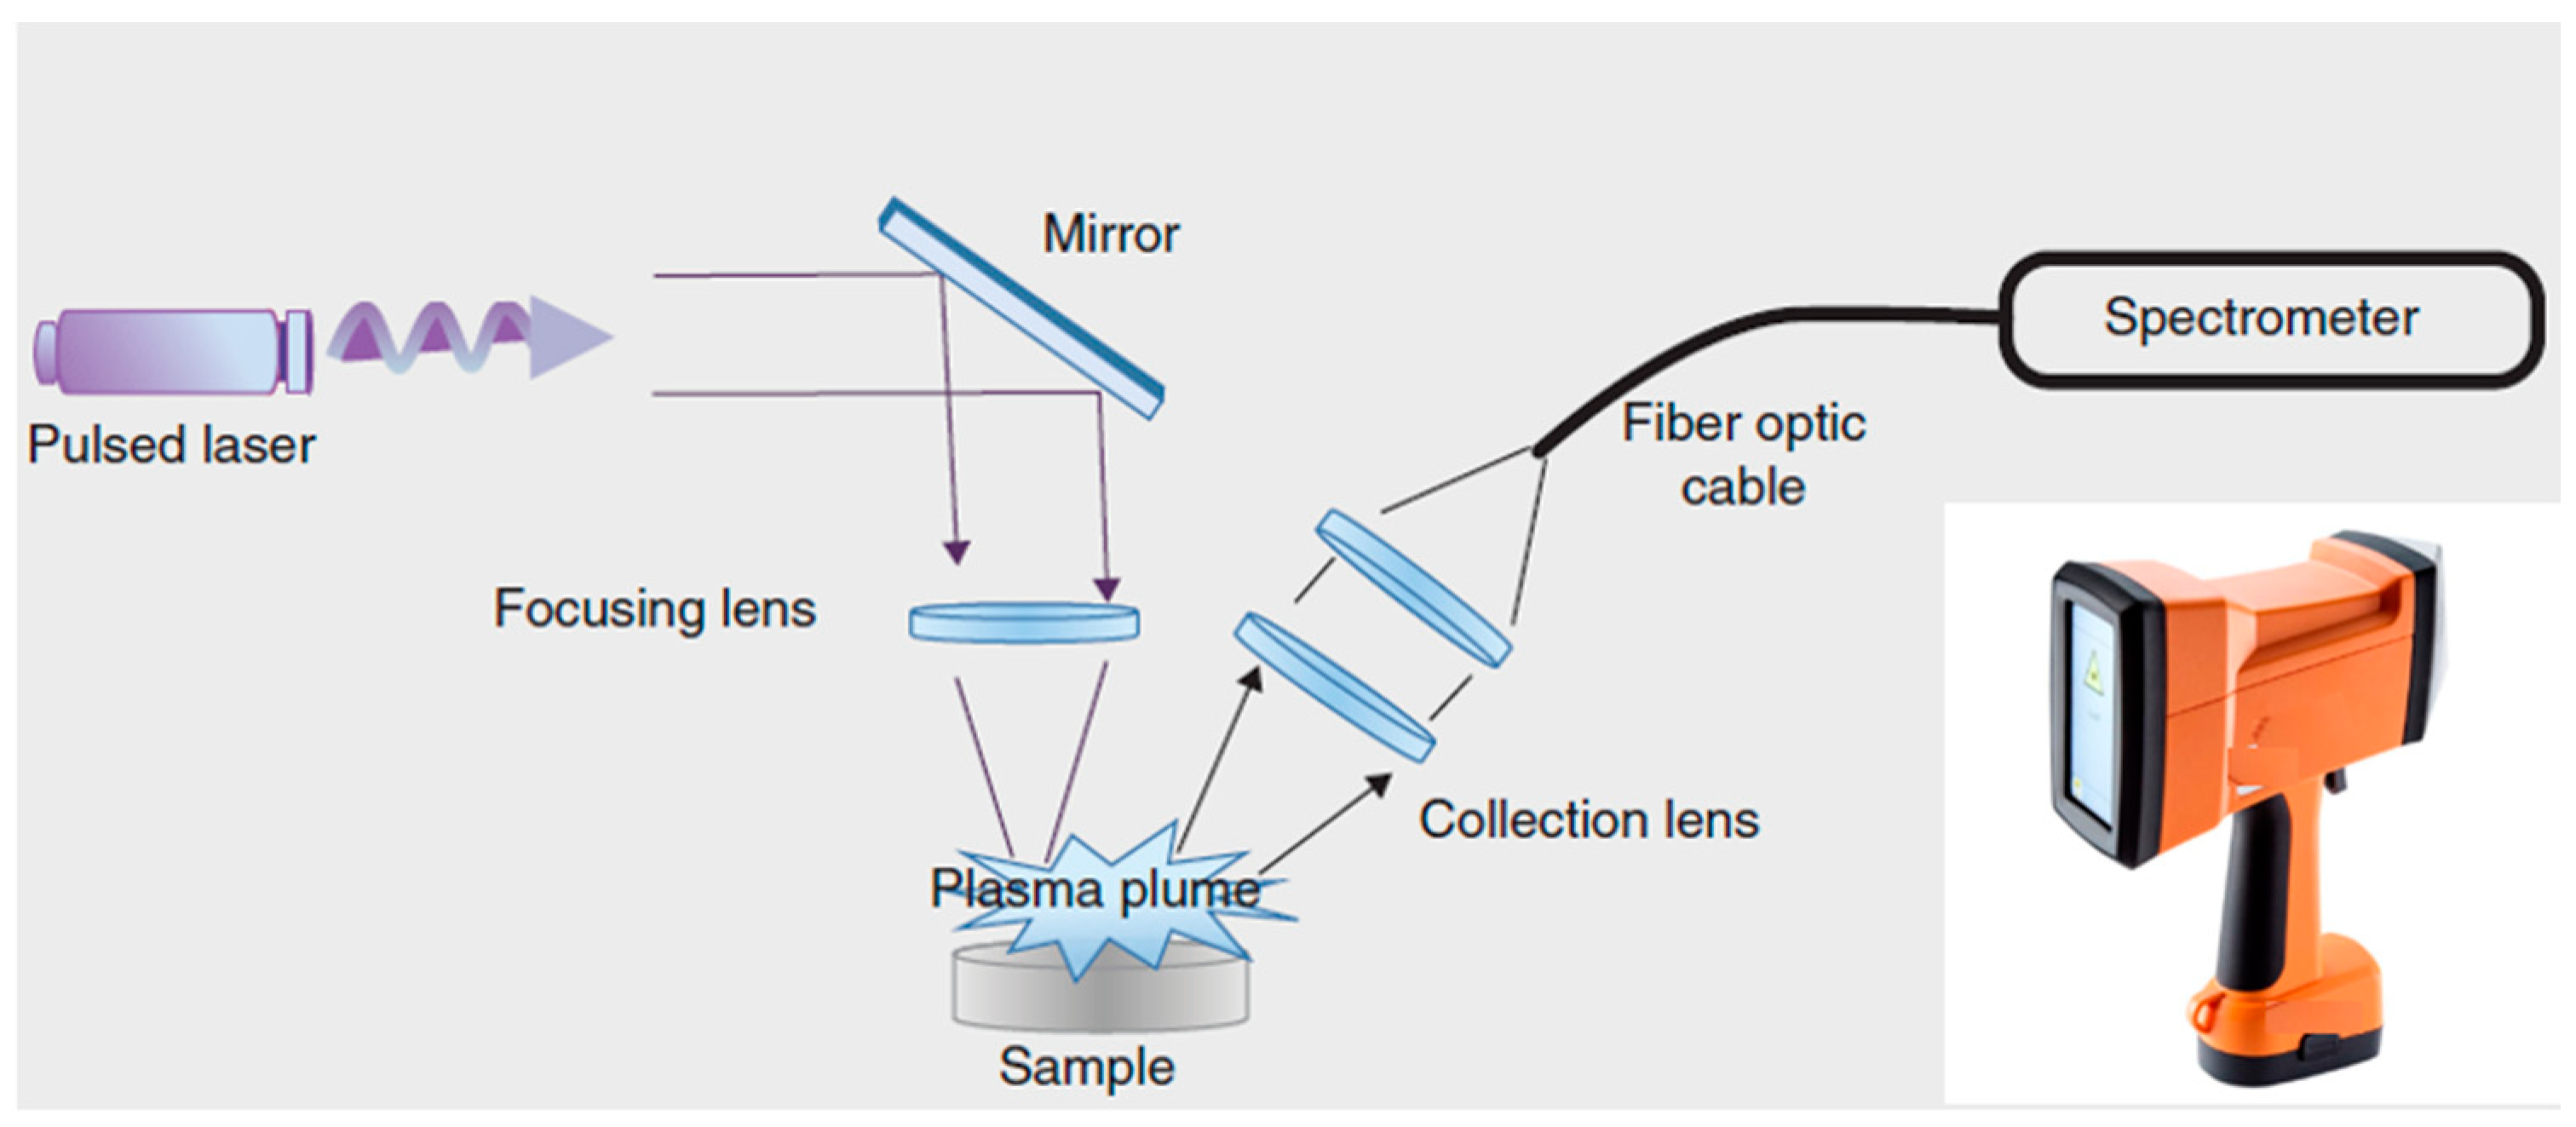
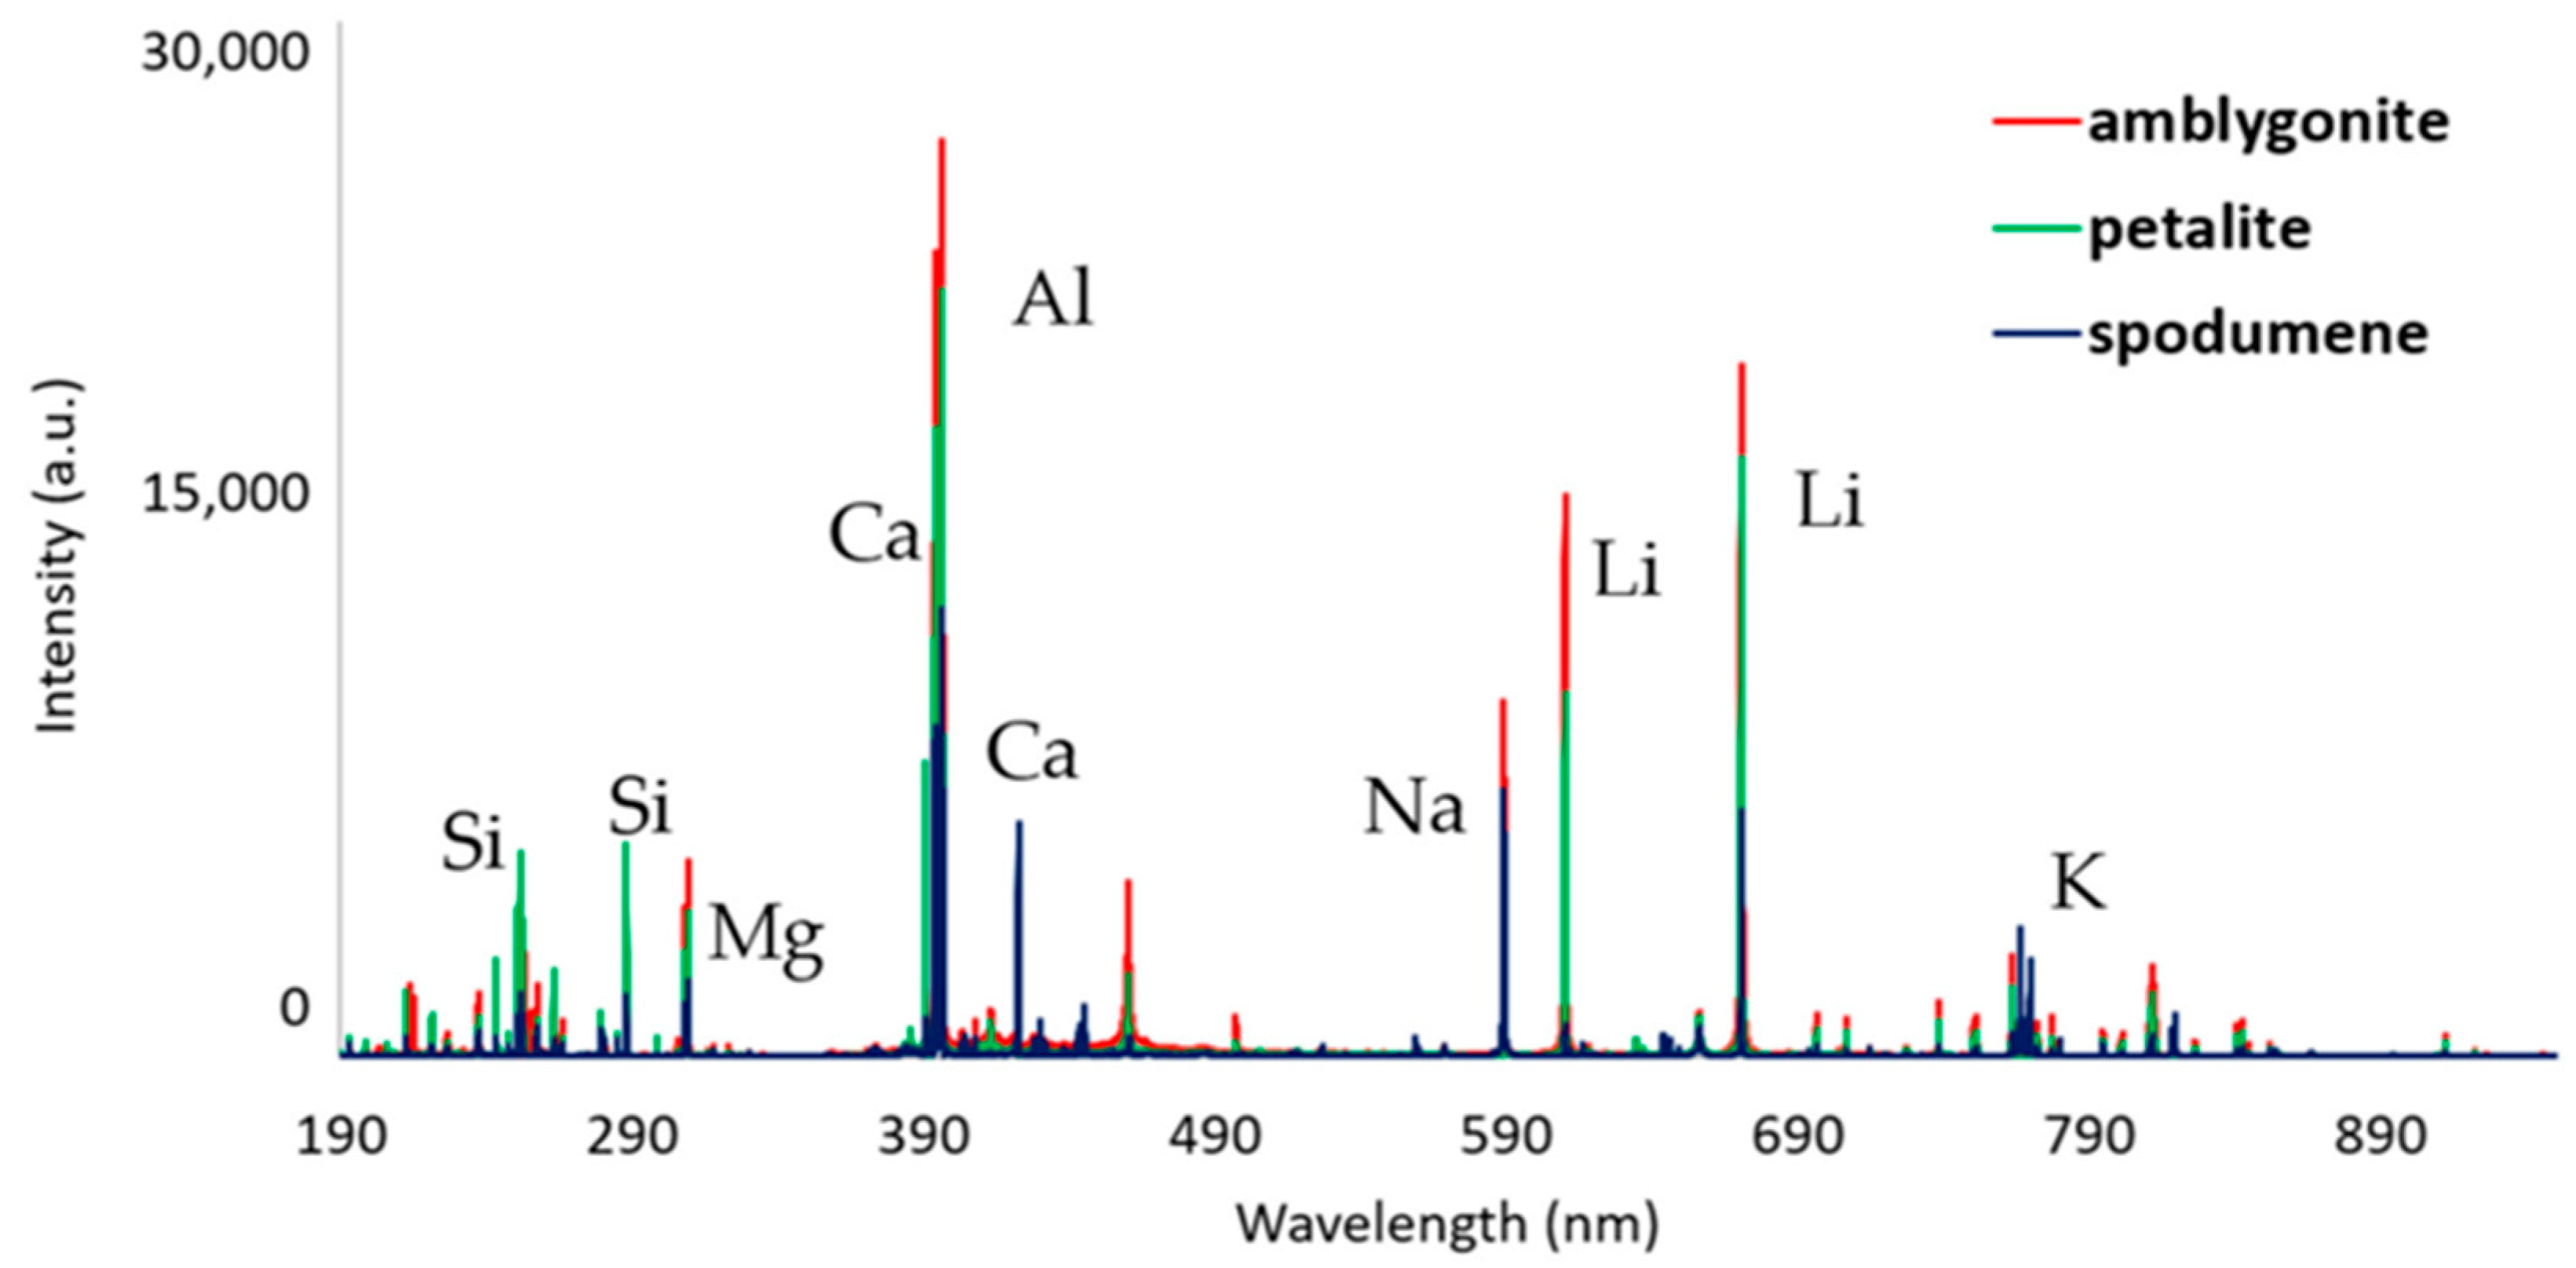
This instrument was developed commercially only around 2014 [84,85,86,87,88]. In recent years, there has been a surge in the application of LIBS technology as a result of the development of more compact, even portable, systems that enable in-field use. pLIBS is an emerging low-cost portable geochemical and mineral exploration analytical tool that can provide rapid, in situ, compositional analysis of a wide range of materials, including all kinds of geological samples at a level of precision of ~5–20% RSD [89]. The LIBS technology utilizes a short and high-energy laser to ablate the surface of the sample, creating a plasma of small amounts of ablated material. The interaction between focused laser pulses and the sample material creates plasma composed of ionized matter with laser ablation craters of the order of 30–400 µm diameter, depending on the laser wavelength, pulse duration of laser, chemical composition of the target material, and matrix effects. The extremely high temperatures within the plasma (>100,000 K) cause the ablated material to dissociate, atomize, and ionize, and during the cooling process, the characteristic atomic emission can provide “spectral signatures” of the chemical composition of the sample material (solid, liquid, or gas state), including lighter elements, such as Be and Li, which is not possible by pXRF. Each element of the periodic table produces a LIBS spectral peak unique to itself, which allows for simultaneous multi-elemental analysis of most elements in the periodic table, which can provide information of the chemical composition of a mineral or a rock, and also the geological processes associated with its formation [89]. By using a detector to measure the unique characteristics of light emitted, it is possible to detect what elements are present within the sample. It is a near non-destructive technique, as only a minute amount of the sample is ablated and removed from the sample specimen during analysis. LIBS also has the ability to provide depth profiles. A schematic diagram of LIBS is shown in Figure 9, which involves a laser source, spectrometer (usual range, 200–1100 nm with 0.1 nm resolution), and an intensified CCD (ICCD) detector or CMOS detectors with a minimum gate time of ~1 millisecond. Nd:YAG (yttrium aluminum garnet) is the most common laser used for pLIBS due to its relatively high efficiency and good thermal conductivity [90]. The sample can be a direct rock sample or a sample powder pellet, just as in the case of the laboratory XRF, and sample thickness should be a minimum of 40 μm (corresponding to common thin rock sections). For geochemical analysis by LIBS, 193 nm excimer lasers and 213 nm Nd:YAG lasers are normally preferred among nanosecond-duration lasers. pLIBS is capable of qualitative, semi-quantitative, and quantitative analysis of most of the elements in the periodic table [91,92]. Detection limits are typically in the low µg/g range (Figure 10) for most elements in the periodic table. However, the detection limits are highly dependent on the type of laser, spectrometer, and the sample matrix used for analysis. For example, higher absolute detection limits can be obtained by using femtosecond lasers, their high cost prohibits their use in portable LIBS instruments, and femtosecond lasers are usually used only in lab instruments [92]. A typical LIBS spectrum in the entire wavelength range obtained from different Li-rich minerals can be seen in Figure 11. Individual emission peaks of different elements are clearly seen. In most cases, solid samples can be directly analyzed by LIBS without any pretreatment. However, sometimes in order to obtain accurate, precise, and reliable data, minimal sample preparation is required. These approaches can be a simple mechanical separation of the test portion, cutting and polishing in order to access a homogeneous sampling region. More details on the sample preparation of solid, as well as liquid samples, for LIBS analysis are provided by Andrade et al. [93]. Because of these excellent performance characteristics, LIBS has wide potential to be utilized in mineral exploration, prospect evaluation, and mining studies. pXRF cannot measure elements lighter than Al (Z = 13), while there is no such limitation for pLIBS. The technique is particularly useful for the analysis of light elements of low ionization energy (e.g., Mg, Na, C, B, Be, and Li), some of which are important target elements as well as pathfinder elements for mineral exploration. Thus, these two analytical techniques are complementary for geochemical analysis. Harmon et al. [91] recently gave a detailed account of the application of LIBS and pLIBS for mineral exploration studies and also for unraveling the complex geological history of most ore systems. pLIBS can also do the analysis of mineral and element distribution mapping within a sample when the analyzer is set up to perform a small step raster pattern. The element maps can be created for various elements by integrating the peak area measured for a particular element for each physical location measured. More details are provided by Connors et al. [86].
Measurements of REE are sometimes difficult due to weak emission lines, but several authors showed examples of successful detection of the number of different REE in different geological materials [94]. Recently, a new type of LIBS system was developed without a built-in temporal gating, using an Nd-YAG laser beam as an excitation source and a highly temporally resolved optical detector system with a compact, low-cost optical multichannel analyzer (OMA) system. The practical analysis results on several types of samples, including geological materials, were encouraging [95]. Harmon et al. [91] described the recent advances in both laboratory and field-portable LIBS for mineral exploration studies through rapid, qualitative to quantitative geochemical analyses.
Figure 9. Schematic diagram explaining the principle of portable LIBS, with a photo of the instrument in the inset, modified from [96].
Minerals 12 00394 g009
Figure 10. Detection limits for different elements obtainable by a commercial LIBS system [92], Copyright 2022 Kimberly Scaffidi.
Minerals 12 00394 g010
Figure 11. LIBS spectra in the entire wavelength range obtained from different Li-rich minerals [22].
Minerals 12 00394 g011

6.1. pLIBS to Trace Gold Provenance

Handheld LIBS devices can be used for rapid in situ analysis of gold, thereby serving as a field-based decision-making tool. The best pathfinder element to trace gold mineralization is gold itself; because it is dense, chemically stable, and easily found in the erosional products of gold systems (i.e., alluvial gold from placers). Indeed, drainage sediment sampling, often the first step in a gold exploration strategy, is to detect the silver (Ag) content or its mineral inclusions at its most intense emission line at 546.58 nm, in order to establish a link between a secondary (placer) deposit and its potential primary deposit. (Pochon et al.) [97]. The results obtained in this study also demonstrated that it is possible to discriminate between distinct populations of gold in concentrates/gold bullion to trace the origin of gold from the area of French Guiana gold districts, which is affected by illegal mining. This is done by performing principal component analysis (PCA) on the dataset obtained on other elements commonly associated with native gold, such as Cu, Zn, Ag, Pb, As, Se, Sb, Sn, Hg, and Te. This feature of pLIBS has some advantages over laboratory-based laser ablation-ICP-MS (LA-ICP-MS) for tracking illegal gold mining in addition to several other advantages, such as it is less expensive, faster, and more convenient than by the laboratory-based laser ablation-ICP-MS technique [98]. Such studies also help in distinguishing gold sources and potentially yield insights into geochemical processes operating during gold deposit formation [99]. Harhira et al. [100] obtained a practical detection limit of 0.75 µg/g in gold-bearing rocks and also in drill core samples demonstrating the potential of the techniques for gold exploration studies.

6.2. pLIBS in Li-Exploration Studies

Currently, lithium is in high demand due to the rapidly growing production of electric vehicles that use Li-ion batteries. It is produced from hard rock mines by countries such as Australia, and from brine mines of Argentina, Chile, and China. Li-exploration studies were carried out in the outcrops, mainly consisting of pegmatites. LCT pegmatites (containing Li–Cs–Ta) are an important source of Li. Such pegmatites can have varying degrees of enrichment in Li, Rb, Cs, Be, Sn, Ga, Ta > Nb, B, P, and F. The crustal abundance of Li is 17 µg/g, but the concentration in the mineralized rocks can go up to ~3% [101]. Though hyperspectral imaging data (HSI) generated by portable VNIR and SWIR spectrometer was also utilized for Li exploration studies, pLIBS is an ideal geochemical tool because it is the only technique that can measure Li concentration in minerals, rocks, soils, and brines in the field. Figure 11 presents the LIBS spectra of three Li-rich minerals obtained from different Li-rich minerals in the entire wavelength range [97]. Wise et al. [101] recently demonstrated the potential of pLIBS in the LCT pegmatites of the Carolina Tin-Spodumene Belt (CTSB) situated in the Kings Mountain Shear Zone, USA. pLIBS was utilized for the identification and quantification of lithium (detection limit < 100 µg/g), measurement of K/Rb ratios, lithium mapping, and depth profiling. The use of pLIBS drastically reduced the time necessary to acquire the required geochemical data during a Li pegmatite exploration program. Fabre et al. [102] used portable LIBS for the in situ determination of Li and other minor/trace elements, such as Be, Rb and Cs, in rare metal pegmatites and granites for Li exploration studies.

7. μRaman Analyzer

Ray et al. [103] presented the history and evolution of portable Raman spectrometers. Very recently, Mitsutake et al. [104] presented a historical review of Raman spectroscopy, including fundamentals and current developments. Since the development of the first commercial Raman spectrometer in 1953, advances in lasers and detectors have expanded the use of this technique in several areas. The first µRaman spectrometers were developed in 1974 and commercialized. Exploration scientists understood the potential of this innovative technique for mineral exploration studies to unearth the hidden mineral deposits and realized the remarkable capability of the µRaman spectrometer in obtaining chemical as well as mineralogical information [105]. Levitan et al. [106] realized the importance of Raman spectroscopy as it was very effective in distinguishing among the serpentine-group minerals, chrysotile, antigorite, and lizardite, which have similar XRD patterns. Thus, Raman spectrometers deliver both chemical composition and structural information in a single measurement. A μRaman spectrometer is also a non-destructive portable analytical technique, and out of the techniques described here, it is the only technique that can identify both inorganic and organic compounds without the need for any chemical or mechanical sample preparation. Figure 12 is a schematic diagram of a modern portable Raman spectrometer. A visible light or UV or IR from a laser source is delivered through a lens and a filter. The light is then reflected by a mirror and focused onto the sample through a microscope objective lens where the laser light interacts with molecular vibrations, phonons, or other excitations in the system, resulting in the energy of the laser photons being shifted up or down. This shift in energy is known as the “Raman effect”, which is detected by the detector providing information about the vibrational modes in the system (sample). Thus, the Raman spectrum can be regarded as the fingerprint of the molecule, and it is evidently a non-destructive technique. The typical spectral resolution of a handheld spectrometer is around 10 cm−1, which is contrasted to the typical values of 1–2 cm−1 for full-fledged laboratory spectrometers. Laboratory-based instruments were commercially available in the late 1980s, and currently, miniaturized instruments that can be taken to the field are also available. Visual identification based on their specific physical properties, such as color, hardness, and cleavage, as well as their crystal structure, can be relatively simple for some minerals in the field, but for detecting many common rock-forming minerals, special equipment, such as pXRD or µRaman spectrometer, is necessary. Sergeeva et al. [107], using a portable Raman spectrometer, discovered a complex mineral called ammoniovoltaite, (NH4)2Fe2+5Fe3+3Al (SO4)12(H2O)18, in a complex hydrated sulfate of the volatile group on the surface of the Severo-Kambalny geothermal field, Kamchatka, Russia. In another example, Raman micro-spectroscopy with a visible 532 nm wavelength excitation confirmed the biogenic presence of the cyanobacterial mat, which had a significant impact on the formation of the unique Nb-REE Tomtor deposit, Russia [108]. Figure 13 shows Raman spectra of some common heavy minerals of different origins. Generally, the identification of serpentine minerals in rocks carried out by scanning electron microscopy-energy-dispersive spectrometry (SEM-EDS) and transmission electron microscopy (TEM), are very expensive and require complicated sample preparation procedures. Groppo et al. [109] used less expensive micro-Raman spectroscopy to accomplish this task, which also requires no sample preparation. Recently, Orlando et al. [110] gave a comprehensive account along with various applications of Raman spectroscopy.
Carbonate rocks act as reservoirs in sedimentary rocks and can also be host rocks related to numerous metalliferous ore deposits in magmatic, hydrothermal, or sedimentary environments. Kim et al. [111] analyzed the spectral features associated with the identification and compositional variation of Ca-Mg-Fe-Mn natural carbonate minerals with a calcite structure (calcite, ankerite, dolomite, siderite, rhodochrosite, and magnesite) by using a portable Raman device with a 532 nm excitation laser and a portable infrared spectrometer with ATR (Attenuated Total Reflection). These authors demonstrated a strong correlation between Mg# acquired from a portable XRF device and the band positions from both a portable Raman and a portable IR spectrometer. Arbiol and Layne [112] applied both Raman and Vis-NIR-SWIR spectroscopy methods in a complementary fashion for the identification of four key hydrothermal alteration minerals (pyrophyllite, white mica, chlorite, and alunite) in situ that are common in precious metal epithermal systems, revealing the potential of these techniques for the application to other ore deposits of hydrothermal origin.

8. LED Fluorimeter

A portable LED fluorimeter can be taken to the field for the measurement of uranium concentration in water directly with a detection limit of 0.2 ng/mL, and this technique has been in use for environmental studies [115] and can be conveniently used even in uranium exploration studies. In general, the concept is based on the interaction between groundwater and the mineralized zone and the leaching of trace/heavy metals under favorable pH-Eh conditions. The sub-surface recharge of groundwater results in the greater likelihood of rock–water interaction with buried mineralization compared to surface geochemical methods [39]. LED fluorimetry comprises the steps of exciting the uranyl ion in the sample by using electromagnetic energy of suitable wavelengths and measuring the decay with time of the uranium phosphorescence after the termination of the incident electromagnetic radiation. The fluorescence yield varies for different complexes of uranium. Therefore, an inorganic reagent, Fluren (fluorescence enhancing reagent-5% sodium pyrophosphate solution), will be added to the water sample in the ratio of 1:10 to convert all the complexes into a single complex having the same fluorescence yield [116,117,118]. The measurement of fluorescence provides information about the concentration of uranium in the sample. Figure 14 shows a schematic diagram of the working principle together with a photo of a commercial LED fluorimeter. This instrument can be a valuable tool in uranium exploration using hydrogeochemical methods of prospecting, as uranium is the best pathfinder for uranium itself [119]. It has a large linear dynamic range up to 1000 ng/mL. LED fluorimeter is very rugged, works on a 12 V battery, is suitable for field applications, and requires minimum maintenance. Unfortunately, some of the well-known portable instruments such as pXRF and pLIBS cannot detect uranium at very low concentrations. On the other hand, µRaman spectrometer can also be taken to the field for the direct measurement of uranium in water samples, which offers detection of 0.2 ng/mL for uranium [115]. Though LED fluorimetry is capable of determining uranium at ng/mL levels and can be useful as a field technique, one has to be aware that this method suffers interferences from dissolved organic matter, manganese, iron, and high TDS [120]. Suitable dilutions can be performed in order to reduce these interference effects.

9. Core Scanners

Core scanner technologies are based on XRF, LIBS, and IR hyperspectral (HS) sensors to obtain petrophysical, mineralogical, and geochemical data in general [121,122,123]. These core scanners provide rapid scanning of drill cores that are extracted from a drill hole and provide high-resolution analytical data to identify sweet spots, mineralization, and alteration with minimum or no sample preparation at relatively high speed. LIBS is a promising technology for the fast detection of enriched areas in drill cores and is easy to apply to numerous core sections on the mining site, allowing detailed interpretations relevant for the genesis of mineralizations and metal distributions, based on a comprehensive dataset. The LIBS technique is much faster than other time-consuming methods, such as electron probe microanalyzer (EPMA) and LA-ICP-MS. Recently, LIBS, with its capability to provide both high-resolution and low-resolution data, has proven to be a high-performance and high-speed drill core scanner [123]. A LIBS-based core scanner was used to investigate continuous spatially resolved variations in the chemical and mineralogical composition of chromitite ore from Merensky Reef ore, Bushveld complex, South Africa, from the sub-millimeter to the meter scale, and could distinguish between several base metal sulfides, rock-forming minerals, and accessory minerals well [124]. LIBS technology also suffers from matrix effects, just like any other spectroscopy technique. Similar mineral phases will produce similar LIBS spectra with similar matrix effects and classification; therefore, it seems very effective for handling matrix effects in LIBS-based images of coarse-grained geological samples. The technique can provide semi-quantitative elemental data for well-defined phases using point counting, and the technique can also detect Pt and Pd when they occur in nuggets. Core scanners based on LIBS technology also provided elemental ratios, such as Mg/Fe, Cr/Al, and Ca/Na ratios, which were successfully validated by EPMA on multiple polished sections [33]. The new LIBS scanner can scan a drill core of about 4 m in less than 5 min, generate the mineral and chemical maps at representative resolutions, and provide high-resolution optical photographs [123]. Thus, core scanners based on LIBS technology provide on-site and real-time information and contribute to exploration success.
A core scanner, based on XRF technology (XRF-CS) originally designed for non-destructive determination of the chemical composition of marine bottom sediments on-board ships and at laboratories ashore, can provide rapid high-resolution (down to 1 mm) records of the chemical composition on split sediment cores. The range of applications has now broadened beyond sedimentology and paleoclimatology and extends into scanning samples of stalagmite, speleothems, corals, mumiyo mounds, rocks, sedimentary nodules, archaeological artifacts, tree sections, and melt segregations [125]. Other areas exploiting the capability of XRF core scanners are mineral exploration, geotechnical characterization, soil remediation studies, and carbon capture and storage research [126].
Hyperspectral (HS) IR scanners have rapidly developed to improve the reliability and efficiency of core logging in the characterization of ore deposits in mineral exploration studies. For example, Rosa et al. [122] used drill-core hyperspectral data for mineral quantification at the deposit scale in the Iberian Pyrite Belt VMS deposit. In another interesting study, Eichstaedt et al. [127] presented the results of predictive models for estimating chemistry grades for gold, copper, and iron in drill cores, based on the mineralogy data derived from the hyperspectral observations and using automated tools for gaining insights into the geochemistry to support exploration geologists in target detection. Table 3 provides a summary of all described portable instruments with their working principle, components, parameters, features, and applications.

10. Portable Multi-Analytical Devices and Micro Analytical Devices to Explore Terrestrial and Extra-Terrestrial Rocks

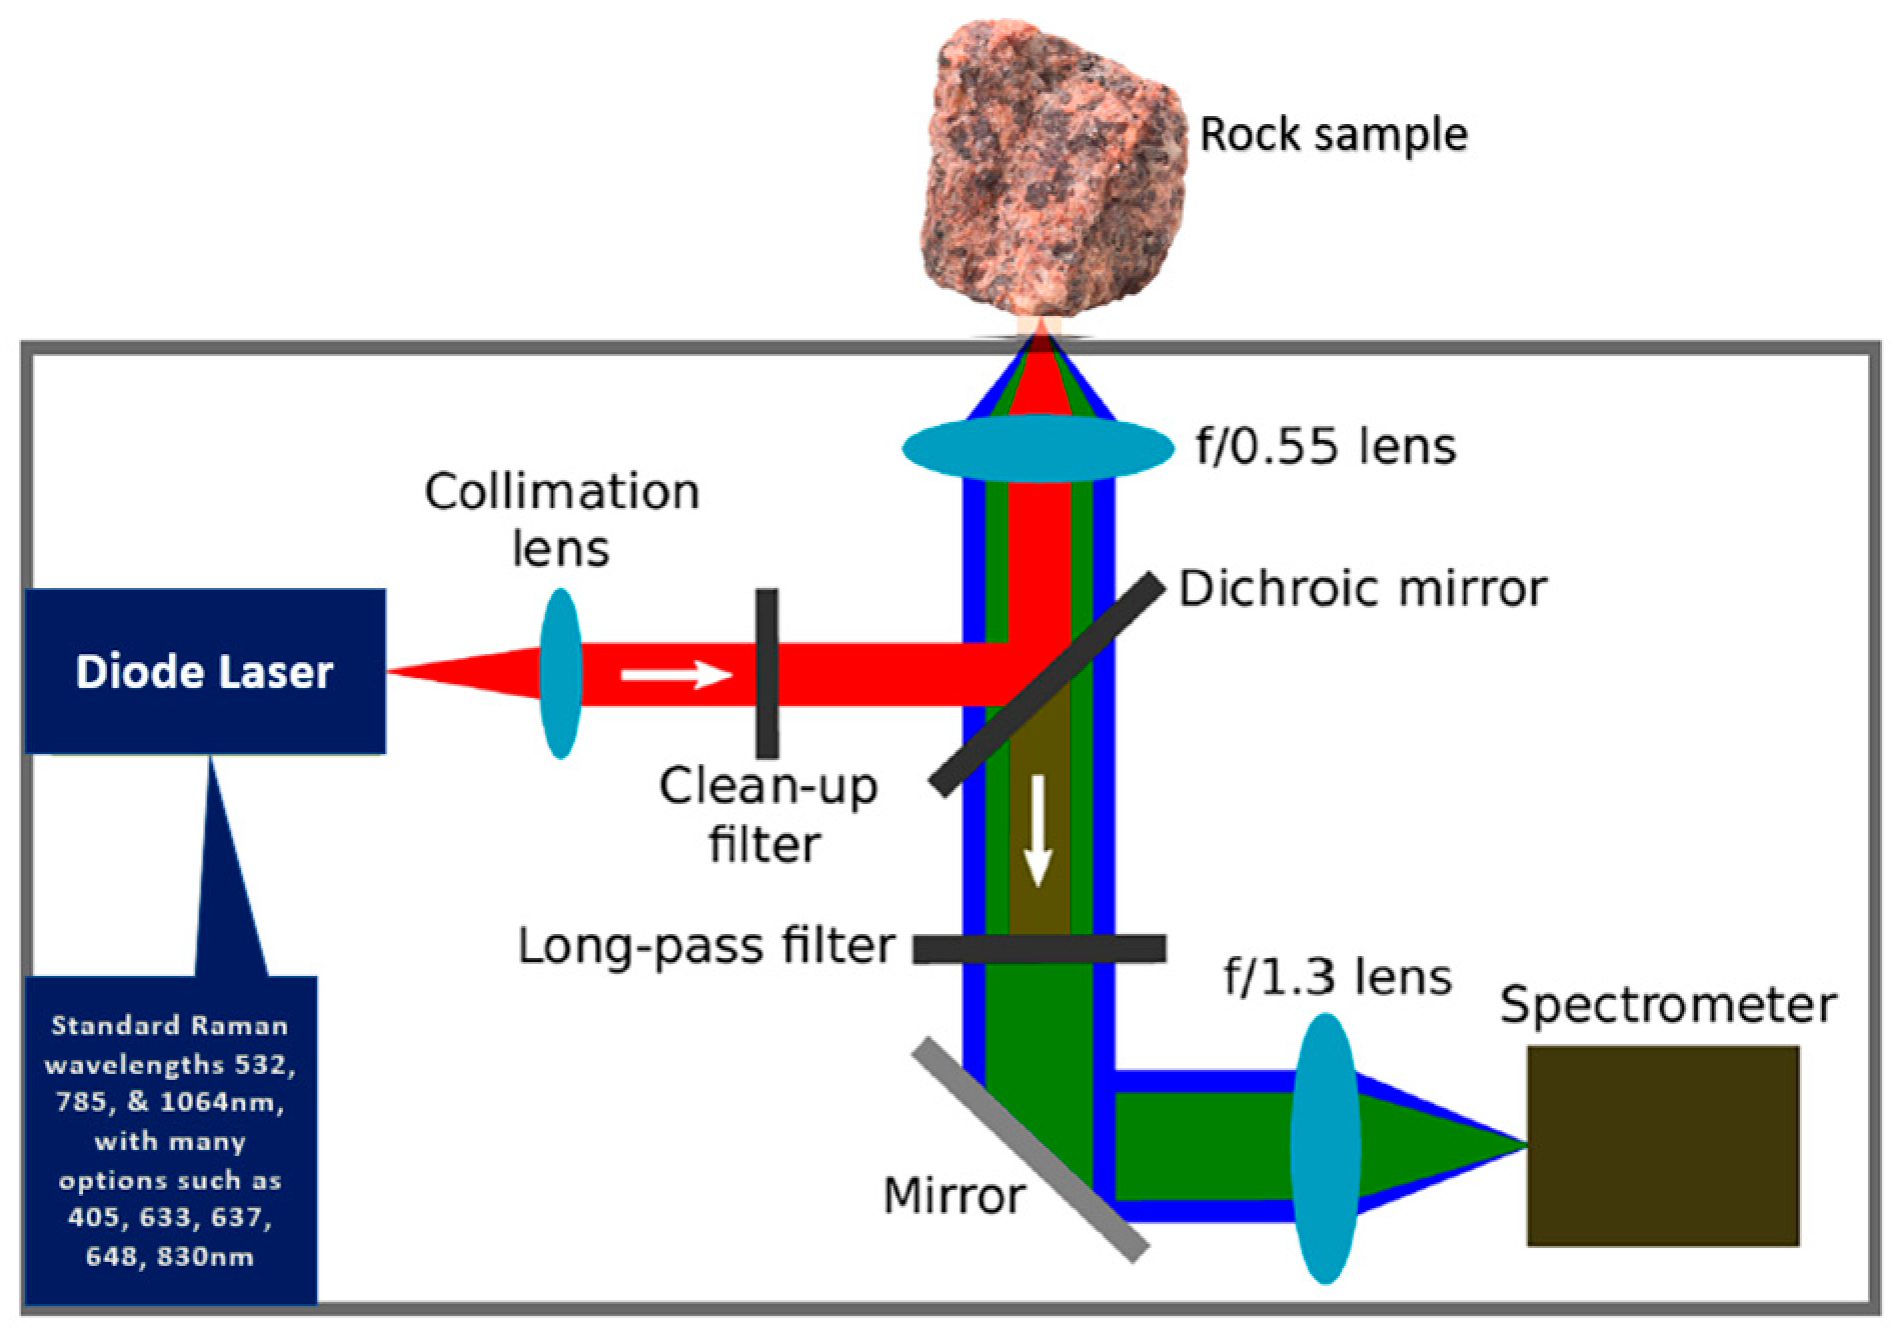
In order to study the surface rocks of Mars, the National Aeronautics and Space Administration (NASA), USA, sent the Perseverance Rover with a suit of miniature analytical instruments in different modules known as Mastcam-Z, MEDA, MOXIE, PIXL, RIMFAX, SHERLOC, and SuperCam, in which PIXL contains micro-XRF to determine the fine-scale elemental composition of Martian surface materials, and SHERLOC contains micro-UV Raman spectrometer to provide complementary measurements with other instruments in the payload [128]. In the earlier Curiosity Rover, there was a module known as ChemCam (Chemistry and Camera). ChemCam was actually two different instruments combined as one: a LIBS and a Remote Micro Imager (RMI) telescope. The purpose of the LIBS instrument was to provide elemental compositions of rock and soil, while the RMI would provide high-resolution images of the sampling areas of the rocks and soil that LIBS targets [129]. Now such combinations of miniature instruments are also available commercially for the study of terrestrial rocks. Recently, Qu et al. [130] tested a remote Raman system for its applications to study planetary materials. The results indicated that the instrument could acquire Raman spectra from a distance of 4 m and identified silicates, carbonates, sulfates, perchlorates, water/water ice, and organics that have been found or may exist on extra-terrestrial planets. One of the most popular and extremely valuable combinations for obtaining both geochemical and mineralogical information of geological materials is a micro-XRF and a micro-XRD in one instrument, which complement each other [131]. These kinds of instruments can be operated in single and/or multi-modes and provide more complementary information from the same sample in a shorter time leading to faster and sometimes more reliable results in the field than data obtained from traditional instrumental methods. For example, during Li-exploration studies, pXRD technology can detect most lithium minerals (Table 1) and provide a complete picture of the pegmatite mineralogy. A combination of pXRD and pXRF may be more useful where the crystal structures are similar but differ in their elemental composition, as pXRD is only sensitive to spacings. Bloise and Miriello, [71] used a portable multi-analytical device, which combines portable digital microscopy (p-DM), pXRF, and a μRaman analyzer to analyze serpentinite and metabasite rocks containing asbestos. The portable digital microscope enabled it to distinguish fibrous and other morphologies. pXRF was used to obtain the in situ rapid chemical discrimination of serpentinite and metabasite rocks. Finally, the chrysotile and tremolite asbestos were easily identified due to their characteristic Raman spectrum. Dhanada et al. [132] recently reviewed the development of different combinations of instruments having a laser as a source, such as LIBS, Raman spectroscopy, and laser-induced fluorescence spectroscopy (LIF) systems, in portable/miniature assemblies in the future. Thus, this kind of combination provided remarkable improvements and advantages over conventional techniques during the last three decades and significantly broadened their applications in the analysis of geological materials [66]. In fact, such combination instruments normally increase our ability to interpret the data collected and help in successful exploration programs.

11. Role of Portable Analytical Tools/Sensors in Deep-Sea Exploration

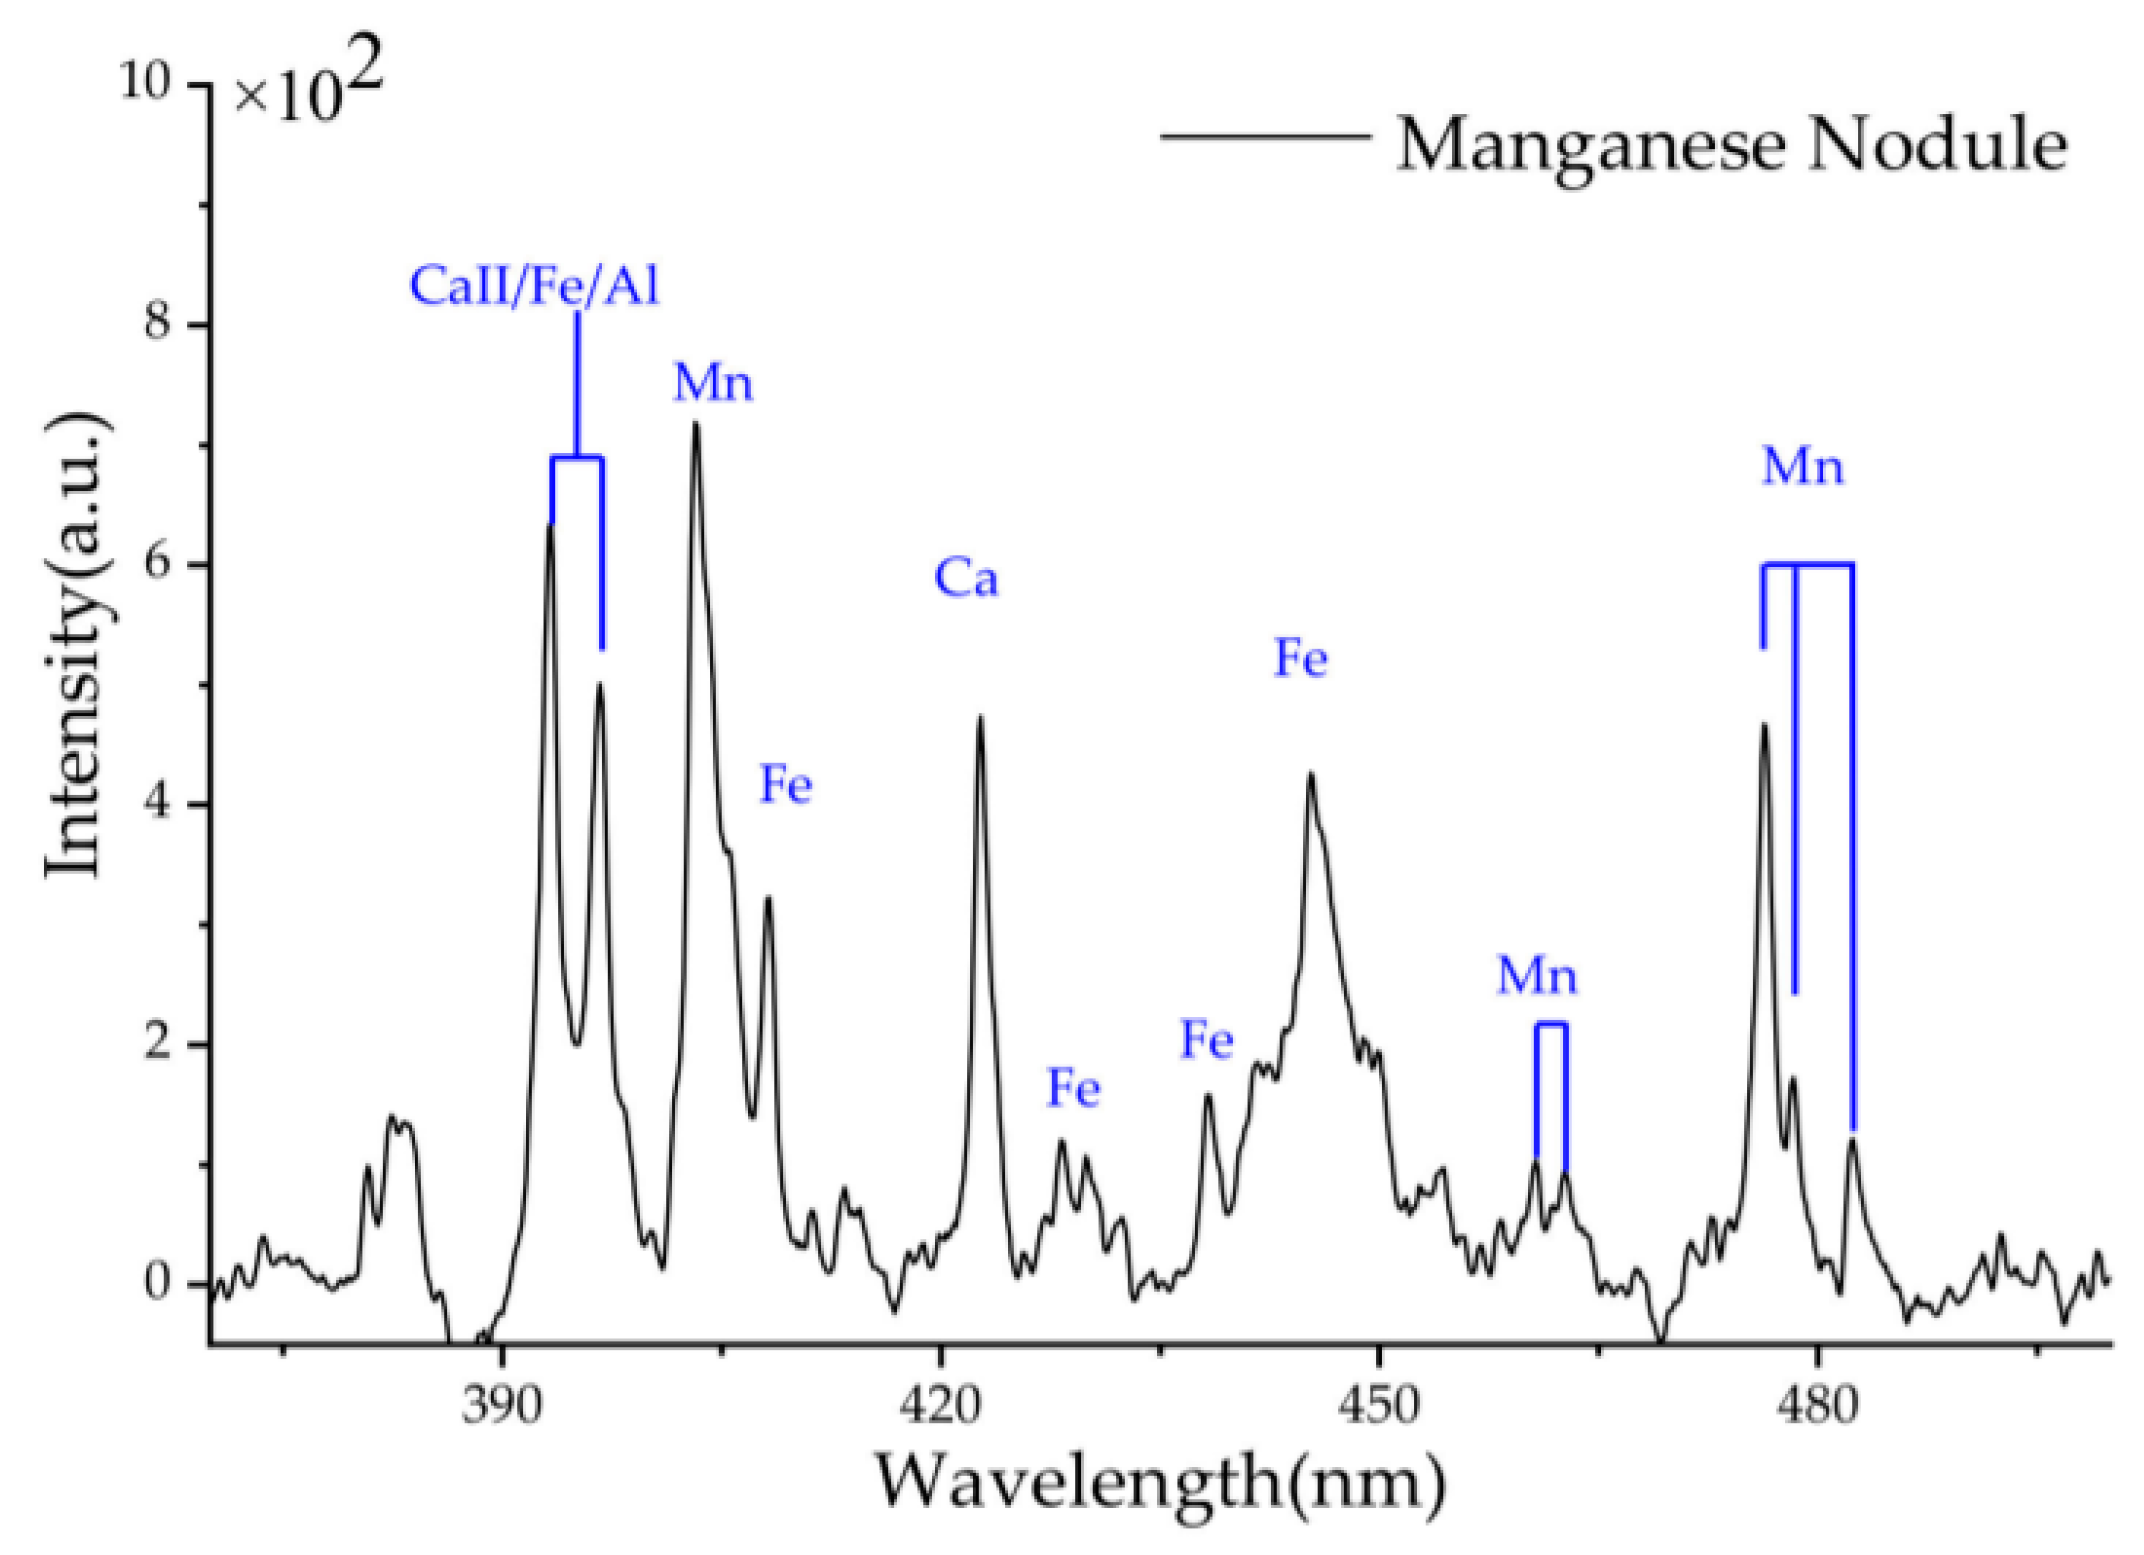
As the land-based mineral deposits are producing lower grades at higher production costs and new discoveries are becoming harder to locate, exploration scientists started looking towards oceans for the critical minerals and metals. Deep-sea hydrothermal areas, polymetallic nodules and crusts, and marine mud, which are widely distributed all over the world, contain an abundance of metal resources that have become the focus of marine research in recent years. Though the deep-sea mining companies have not started their operations on a commercial scale in international waters due to environmental concerns, some feel that deep-sea mining becomes investable in the future for the supply of minerals/metals for the green energy revolution [133]. However, a lot of exploration studies are going on worldwide. Seafloor REE deposits occur in environments with low sedimentation rates, from shallow continental shelves to deep abyssal plains, where they are typically adsorbed onto iron-manganese nodules, crusts, or muds [134]. Spectroscopic techniques, especially the miniaturized devices, are currently expanding their horizon from Mars in the solar system to the deep oceans. pXRF devices for the characterization of REE are extremely valuable for offshore quantification and strategies during expedition cruises [135]. In addition, the emergence of underwater remotely operated vehicles (ROV) equipped with chemical sensors, such as LIBS, Raman spectrometers, near IR spectrometers, and laser-induced fluorescence spectrometers, for in situ detection started showing their potential to be used in deep-sea geological explorations. Because of the highly sensitive and selective detection capabilities, some of these miniaturized spectroscopic techniques are getting deployed in ROVs in deep marine environments to perform in situ multi-element geochemical analysis of both seawater and mineral deposits on the ocean beds. In fact, for instruments such as Raman spectrometers and LIBS, underwater environments pose a lot of challenges, such as plasma quenching effects due to the nearly incompressible fluid medium, which can significantly degrade the quality of the signals obtained. To overcome this, underwater LIBS systems will utilize the double-pulse technique [136]; more details are provided by Thornton et al. [137]. Figure 15 shows the typical spectrum of a manganese nodule sample from the deep sea in Jiaozhou Bay, China; after background subtraction processing, the characteristic lines of major metallic elements of Fe and Mn can be clearly observed. A comparison of the data of seawater composition determined in situ by LIBS and in the laboratory can be seen in Table 4. These results on the simultaneous determination of major elements (Na, Mg, Ca, K) and Li over a range of concentrations demonstrate that the deep-sea LIBS instrument has sufficient sensitivity and accuracy relevant to oceanic applications. Oceanic in situ sensors based on spectroscopic technology have many advantages, such as simultaneous detection of multiple components, non-contact, high-speed analysis, wide adaptability, strong flexibility, and are becoming one of the hot topics in marine research [138]. The demand for REE is increasing day-by-day with ever-increasing applications of these metals in high technology products, and the exploration activities for finding new resources have increased greatly in recent years [139]. The most enriched REE mud has occurred in pelagic deep-sea regions more than 2000 km from mid-ocean ridges, at depths greater than 4000 m. In an effort to find out an efficient way to explore the ocean floor for REE deposits, Obhođaš et al. [140] developed two nuclear techniques for the in situ measurements of REE in deep-sea sediments: (i) passive measurement of 176Lu radioactivity, which is appropriate if long-term in situ measurements are possible, and (ii) the use of the neutron sensor attached to an ROV for rapid in situ measurement of gadolinium by thermal neutron-capture. As lutetium and gadolinium show a strong linear correlation to the ∑REE concentrations in deep-sea sediments, it is possible to deduce the total REE content by measuring just Lu or Gd concentrations.
Milinovic et al. [135] used a pXRD for studying the mineral composition of marine sediments on-board ocean exploration cruises. The results were validated later on by using the conventional laboratory instruments after the exploration mission. It was shown that mineralogy could be efficiently assessed during the cruises at sea, i.e., within 20 h, it was possible to analyze a batch of up to 24 gravity corer sediment samples. Milinovic et al. [141] demonstrated that by using the portable infrared mineral analyzer (PIMA) using SWIR spectral analysis, it is possible to get both qualitative and quantitative results of mineral components and geochemistry (e.g., La, Ce, Pr, Nd, Sm, Gd, Dy, Er, Yb, and Y) on board in previously studied ocean-floor areas, with high sensitivity. This instrument can also replace the destructive wet chemical sample digestion and extraction and analysis by conventional ICP-MS [142]. Thus, obtaining empirical SWIR-reflectance data by SWIR spectral analysis in near real-time can be valuable for the exploration of geochemical deposits in the ocean floor, particularly to make any changes in exploration strategies.

12. Comparison of Performances of Field-Portable Instruments versus Laboratory Instruments

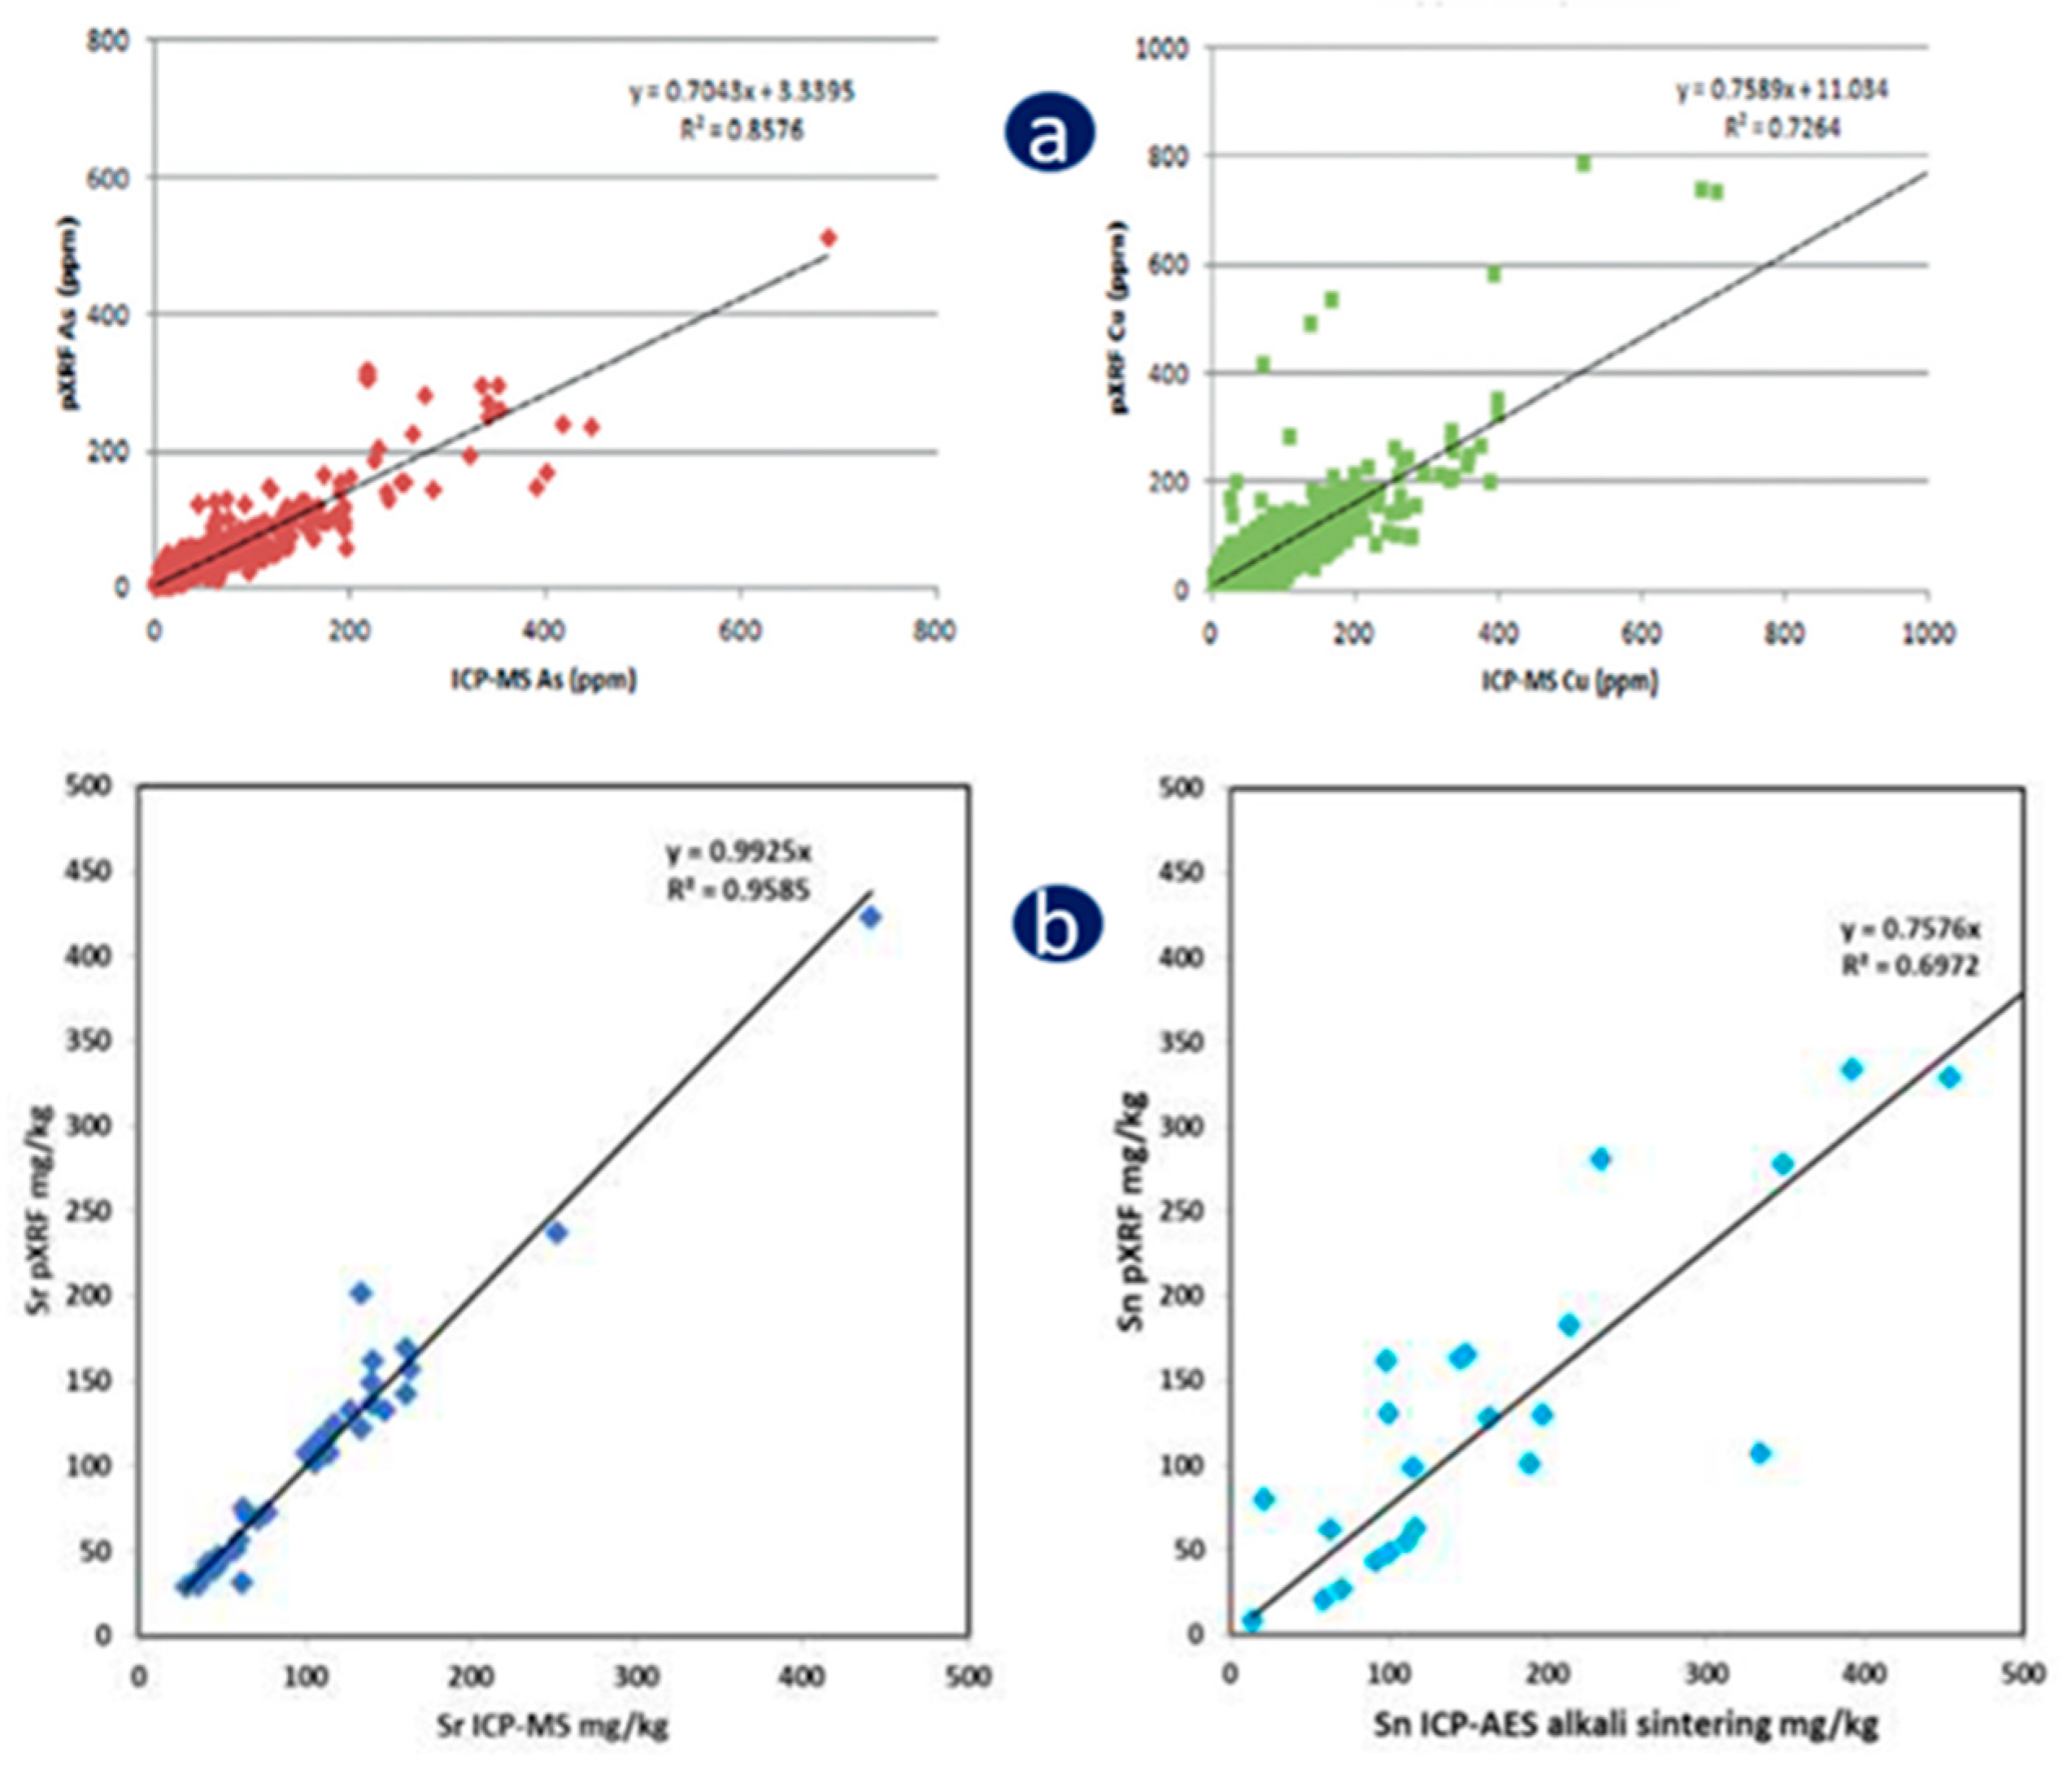
In general, the laboratory instruments, such as atomic absorption spectrometry (AAS), XRF, ICP-OES, and ICP-MS, have a long history of providing consistent and very accurate results for various major, minor, trace, and ultra-trace elements in different geological materials [66,143]. Though the field-portable instruments have come later on, the recent rapid progress in technology and their application in mineral exploration studies has increased manifold. These instruments offer a possibility of cost-effective, non-destructive, real-time, direct, on-site measurements of a wide range of both inorganic and organic analytes in gaseous, liquid, and solid samples, and are slowly gaining acceptance as a complement to traditional laboratory analytics, especially in mineral exploration studies [49,144]. In several exploration studies, these portable instruments are used for screening purposes to select the few most appropriate samples for more precise laboratory studies. Since the quality of data produced by field instruments varies with field conditions, rock/soil composition, and sample preparation procedure, the samples are brought to the laboratory for more careful analysis and comparison of the results and confirmation many times. In addition, quality assurance and quality control protocols usually require that a number of field samples are split and sent to a laboratory for confirmatory analysis. While pXRF and pLIBS are the most frequently used analytical techniques for on-site measurements, laboratory analyses are usually performed by XRF, ICP-OES, and ICP-MS. In favorable cases, field measurements and these laboratory analyses show a good correlation (Figure 16). These confirmatory analyses can provide valuable information on the effectiveness of the field methodology adopted using portable instruments. Arne et al. [145] made a comparison of pXRF data from unsieved samples in the field with those obtained by ICP-MS from the <100-μm grain size fraction digested in aqua regia in gold exploration studies. The data showed a good correlation between field data by pXRF and ICP-MS data obtained in the laboratory for selected elements, such as As and Cu (Figure 16). However, a poor correlation was obtained between pXRF and laboratory data for elements such as Sb and Fe, which may reflect the heterogeneity in the samples, as well as incomplete digestion of all Fe-bearing minerals in an aqua regia digestion for some samples (e.g., chromite). Table 5 presents a comparison of pXRF (in field) and laboratory XRF results for the four reference samples [146], proving that these portable instruments can generate analytical data of dependable quality. Several other studies proved that these portable techniques can provide acceptable results with adequate precision and accuracy [147].

13. Challenges in Data Quality and Ways to Overcome

Traditional laboratory-based instruments, such as WD-XRF, ICP-MS, and Raman spectrometers, are normally housed in stationary locations with a controlled environment and temperature. On the other hand, portable instruments, such as pXRF, pLIBS, and µRaman spectrometers, are normally used in variable temperature conditions and rugged environments in the field. For example, Iceland offers a range of environments, including volcanically active regions, extensive lava fields, geothermal springs, and large swaths of ice-covered terrains, and in some counties across the globe, the temperature can go beyond 45 °C. Bower et al. [149] combined pLIBS, pRaman, and UV/VIS/NIR spectroscopy to characterize the mineral assemblages, hydrated components, and biomolecules in rock and sediment samples collected from some sites in the volcanically active Kverkfjöll-Vatnajökull region. However, the results obtained in the field do not always match with those obtained in the laboratory due to several reasons: (i) the differences in environment, including dust, (ii) temperature differences, (iii) differences in sample preparation (sample geometry, density, grain size, and moisture), and (iv) technical limitations of portable instruments (e.g., sensitivity). Laboratory sample preparation procedures ensure sample representativity, which can be taken care of to some extent through grid or multiple measurements in field conditions. Thus, if these aspects are completely understood and proper attention is given to careful sample preparation, and following appropriate quality procedures, the portable instruments can also provide reliable data in field conditions [150]. In the case of pXRF, it is a surface/near-surface technique that is assumed to penetrate down a few micrometers to several millimeters depending on the nature of the sample matrix and only measures the portion of the sample directly in front of the window. On several occasions, comparable data can be obtained by pXRF and laboratory instruments, such as ICP-MS, on the same samples for certain elements, such as As, Cu, and Pb (Figure 16). However, for elements such as Sb, the agreement was not good because the concentrations of Sb were close to the lower limit of detection by pXRF [145]. This much accuracy may be sufficient in exploration studies, particularly when looking for trends rather than very accurate values. However, in other activities, such as mining and grade control, greater care in sample preparation, instrument calibrations, and quality control protocols are required for obtaining more reliable information. For LIBS element detection, the signal is usually sufficient for identification even if the sample is not strictly flat (for the scale of the window 3 × 4 mm). For µRaman spectroscopy work, instrumental parameters, such as focal plane precision, exposure time, and ambient light conditions in the field can affect the acquisition and interpretation of spectroscopic data from the specimens [151]. The real-time chemical and mineralogical analyses on drill cores by pXRF, pFTIR spectrometer, XRD, and Raman spectrometer are challenging because of the drill core surface condition and sample heterogeneities. A study by Duée et al. [152] revealed that the surface condition has minor influence on the results of the portable instruments. Their study also showed that a multi-technique approach was the best to overcome the drawbacks of the variations in the core texture.
There is no replacement for proper sample preparation, testing protocol, and following rigorous quality assurance and quality control (QA and QC) protocols by utilizing international matrix matching certified reference materials (CRMs) for obtaining accurate quantitative data [153,154]. This method minimizes matrix effects due to the compatibility between sample chemical and physical characteristics and calibration standards. Other traditional calibration strategies, such as standard addition (SA) and internal standardization (IS), can be utilized to reduce matrix effects [6]. To minimize the influence of the matrix elements on a particular element, matrix-matched international CRMs are analyzed, and correction factors are applied to get the most accurate data, even in field conditions. Durance et al. [72] used laboratory-based whole-rock analyses of representative samples from a project area and matrix-matching international CRMs to derive correction factors from applying to the pXRF data in order to ensure that the data are both accurate and precise. Then, the results obtained by these portable instruments can match the data obtained by laboratory-based instruments provided the user is sufficiently experienced and generates the data with sufficient care, and then the data can constitute powerful data sets. Despite these facts, portable techniques are getting established and producing data with comparable accuracy to those of well-established laboratory-based analytical techniques [155]. Fuchs et al. [156] developed a data library consisting of high-resolution spectral information in the visible to near-infrared range (350–1080 nm), which will deal with spectral overlap effects and be useful for the identification of some elements, such as REE.
Users must also understand the dangers of X-rays and lasers and know the fundamentals of radiation protection. Although LIBS and Raman instruments do not emit ionizing radiation, they do have open beam lasers, with consequent concerns about the eye’s safety [41]. pXRF requires licensing and operator safety training as it has an open beam X-ray source.

14. Conclusions and Future

Exploration geoscientists and mining companies are currently facing challenges of declining mineral reserves and increasing discovery costs. Geochemical exploration techniques, both laboratory-based and field-based, can provide an excellent support system in this endeavor in the future to help the new discovery of ore bodies at reduced environmental and exploration costs. Especially, the development of low-cost field-portable analytical instruments, such as portable short-wave infrared (SWIR) spectrometers, pXRF, pXRD, pLIBS and µRaman spectrometers, are allowing the possibility of obtaining geochemical and mineralogical information while engaged in field investigations over the last couple of decades, allowing real-time decisions to be made with reasonable confidence. The striking advantages of these instruments are: (i) rapid analysis; (ii) low purchase and maintenance costs compared to laboratory-based instruments; (iii) rechargeable battery operation; (iv) requirement of no or little sample preparation; (v) GPS, Bluetooth, wireless computer technology, internet connectivity, and remote control operation; (vi) safety for the operator; and (vii) easy operation. These instruments are extremely valuable not only in exploration, mining, and processing studies but also in quality control, trading, and safeguarding the environment.
Recent success in the discoveries of new mineral deposits using these portable techniques has made these techniques very popular. The ability of these portable techniques, combined with the GPS and Bluetooth facilities, enables even more exciting applications, such as physical mineral mapping across large areas in the field and instant data transmission back to a central database. In situ analytical techniques are more appropriate and useful for the successful exploration, mining of deep-sea minerals, and to understand the ecosystem. They can be used for the analysis of rocks and soils with varied compositions with no or minimal sample preparation. However, a clear understanding of the matrix interferences is extremely important for obtaining optimum results. The application of multivariate methods may be helpful, especially for heterogeneous samples.
Portable XRF technology is currently established in exploration, mining, and metallurgical studies. Portable LIBS is one of the few techniques that can detect lithium as well as all the halogens in the field. Current developments in the on-site analysis together with sound QA and QC protocols are increasing the confidence levels of the exploration scientists. Laser technology is constantly improving with laser size reduction and pulse power enhancement, and with improved optics, it is expected that there will be further progress in these portable laser-based instruments in the future. In fact, these devices have already become a part of the equipment of many modern mineral exploration laboratories, especially in private mining companies.

Funding

This research received no external funding.

Acknowledgments

The authors thank the Director, CSIR-NGRI, Hyderabad, for the support and encouragement.

Conflicts of Interest

The authors declare no conflict of interest.

References

  1. Paulen, R.C.; Paradis, S.; Plouffe, A.; Smith, I.R. Base metal exploration using indicator minerals in glacial sediments, northwestern Alberta, Canada. In Proceedings of the 24TH International Applied Geochemistry Symposium, Fredericton, NB, Canada, 1–4 June 2009; pp. 557–560. [Google Scholar]
  2. Chakraborty, R.; Kereszturi, G.; Durance, P.; Pullanagari, R.; Ashraf, S.; Anderson, C. Biogeochemical Exploration of Gold Mineralization and its Pathfinder Elements Using Hyperspectral Remote Sensing. In Proceedings of the IGARSS 2020—2020 IEEE International Geoscience and Remote Sensing Symposium, Waikoloa, HI, USA, 26 September–2 October 2020; pp. 5119–5122. [Google Scholar] [CrossRef]
  3. Azmi, H.; Moarefvand, P.; Maghsoudi, A. Gold anomaly ranking based on stream sediment geochemistry in the Fariman–Kashmar axis, NE Iran. Acta Geochim. 2021, 40, 135–149. [Google Scholar] [CrossRef]
  4. Balaram, V.; Rahaman, W.; Roy, P. Recent Advances in MC-ICP-MS Applications in the Earth, Environmental Sciences: Challenges and Solution. Geosyst. Geoenvironm. 2022, 1, 100019. [Google Scholar] [CrossRef]
  5. Baumgartner, R.J.; Kunzmann, M.; Spinks, S.; Bian, X.; John, S.C.; Blaikie, T.N.; Hu, S. Zinc isotope composition of the Proterozoic clastic-dominated McArthur River Zn-Pb-Ag deposit, northern Australia. Ore Geol. Rev. 2021, 139, 104545. [Google Scholar] [CrossRef]
  6. Balaram, V. Strategies to overcome interferences in elemental and isotopic geochemical studies by quadrupole ICP-MS: A critical evaluation of the recent developments. Rapid Commun. Mass Spectrom. 2021, 35, e9065. [Google Scholar] [CrossRef]
  7. Xie, X.; Wang, X.; Zhang, Q.; Zhou, G.; Cheng, H.; Liu, D.; Cheng, Z.; Xu, S. Multi-scale geochemical mapping in China. Geochem. Explor. Environ. Anal. 2008, 8, 333–341. [Google Scholar] [CrossRef]
  8. McClenaghan, M.B. Indicator mineral methods in mineral exploration. Geochem. Explor. Environ. Anal. 2005, 5, 233–245. [Google Scholar] [CrossRef] [Green Version]
  9. Brandt, S.; Fassbender, M.L.; Klemd, R.; Macauley, C.; Felfer, P.; Haase, K.M. Cumulate olivine: A novel host for heavy rare earth element mineralization. Geology 2020, 49, 457–462. [Google Scholar] [CrossRef]
  10. Porter, J.K.; McNaughton, N.J.; Evans, N.J.; McDonald, B.J. Rutile as a pathfinder for metals exploration. Ore Geol. Rev. 2020, 120, 103406. [Google Scholar] [CrossRef]
  11. Nzulu, G.; Eklund, P.; Magnuson, M. Characterization and identification of Au pathfinder minerals from an artisanal mine site using X-ray diffraction. J. Mater. Sci. 2021, 56, 7659–7669. [Google Scholar] [CrossRef]
  12. Nude, P.M.; Asigri, J.M.; Yidana, S.M.; Arhin, E.; Foli, G.; Kutu, J.M. Identifying Pathfinder Elements for Gold in Multi-Element Soil Geochemical Data from the Wa-Lawra Belt, Northwest Ghana: A Multivariate Statistical Approach. Int. J. Geosci. 2012, 3, 62–70. [Google Scholar] [CrossRef] [Green Version]
  13. Korshunova, V.A.; Charykova, M. Mobile Forms of Gold and Pathfinder Elements in Surface Sediments at the Novye Peski Gold Deposit and in the Piilola Prospecting Area (Karelia Region). Minerals 2019, 9, 34. [Google Scholar] [CrossRef] [Green Version]
  14. McClenaghan, M.B.; Cabri, L.J. Review of gold and platinum group element (PGE) indicator minerals methods for surficial sediment sampling. Geochem. Explor. Environ. Anal. 2011, 11, 251–263. [Google Scholar] [CrossRef]
  15. Morgenstern, R.; Turnbull, R.E.; Hill, M.P.; Durance, P.M.J.; Rattenbury, M.S. Rare Earth Element Mineral Potential in New Zealand. GNS Sci. Consult. Rep. 2018, 23, 211. [Google Scholar]
  16. Hattori, K.H.; Cameron, E.M. Using the high mobility of palladium in surface media in exploration for platinum group element deposits: Evidence from the Lac des Iles region, northwestern Ontario. Econ. Geol. 2004, 99, 157–171. [Google Scholar] [CrossRef]
  17. Layton-Matthews, D.; McClenaghan, M.B. Current Techniques and Applications of Mineral Chemistry to Mineral Exploration; Examples from Glaciated Terrain: A Review. Minerals 2022, 12, 59. [Google Scholar] [CrossRef]
  18. Hale, M. Pathfinder Applications of Arsenic, Antimony and Bismuth in Geochemical Exploration. Dev. Econ. Geol. 1981, 15, 307–323. [Google Scholar] [CrossRef]
  19. Gale, G.H. Vectoring volcanogenic massive sulphide deposits using rare earth elements and other pathfinder elements at the Ruttan mine, Manitoba (NTS 63B5). In Report of Activities 2003, Manitoba Industry, Trade and Mines; Manitoba Geological Survey: Brandon, MB, Canada, 2003; pp. 54–73. [Google Scholar]
  20. McClenaghan, M.B.; Parkhill, M.A.; Pronk, A.G.; Sinclair, W.D. Indicator mineral and till geochemical signatures of the Mount Pleasant W-MoBi and Sn-Zn-In deposits, New Brunswick, Canada. J. Geochem. Explor. 2017, 172, 151–166. [Google Scholar] [CrossRef] [Green Version]
  21. Trueman, D.L.; Cerny, P. Exploration for Rare-Element Granitic Pegmatites. In Granitic Pegmatites in Science and Industry: Mineralogical Association of Canada Short Course Handbook; Cerny, P., Ed.; Scientific Research: Winnipeg, MB, Canada, 1982; Volume 8, pp. 463–494. [Google Scholar]
  22. Fabre, C.; Ourti, N.; Mercadier, J.; Cardoso-Fernandes, J.; Dias, F.; Perrotta, M.; Koerting, F.; Lima, A.; Kaestner, F.; Koellner, N.; et al. Analyses of Li-Rich Minerals Using Handheld LIBS Tool. Data 2021, 6, 68. [Google Scholar] [CrossRef]
  23. Makvandi, S.; Beaudoin, G.; McClenaghan, M.B.; Quirt, D.; Ledru, P. PCA of Fe-oxides MLA data as an advanced tool in provenance discrimination and indicator mineral exploration; case study from bedrock and till from the Kiggavik U deposits area (Nunavut, Canada). J. Geochem. Explor. 2019, 197, 199–211. [Google Scholar] [CrossRef]
  24. Joyce, N.J. Alteration Mineralogy and Pathfinder Element Inventory in the Footprint of the Mcarthur River Unconformity-Related Uranium Deposit, Canada. Master’s Thesis, Queen’s University, Kingston, ON, Canada, 2016. [Google Scholar]
  25. Cohen, N.E.; Brooks, R.R.; Reeves, R.D. Pathfinders in geochemical prospecting for uranium in New Zealand. Econ. Geol. 1969, 64, 519–525. [Google Scholar] [CrossRef]
  26. Plouffe, A. The glacial transport and physical partitioning of mercury and gold in till: Implications for mineral exploration with examples from central British Columbia, Canada. Geol. Soc. Lond. Spec. Publ. 2001, 185, 287–299. [Google Scholar] [CrossRef]
  27. Bayari, E.; Foli, G.L.; Gawu, S.K.Y. Geochemical and pathfinder elements assessment in some mineralized regolith profiles in Bole-Nangodi gold belt in north-eastern Ghana. Environ. Earth Sci. 2019, 78, 268. [Google Scholar] [CrossRef]
  28. Somarin, K.; Steinhage, I. Use of field-portable XRF in exploration of PGE-enriched zones in the Pilanesberg PGE deposit, Bushveld Complex, South Africa. Geochem. Explor. Environ. Anal. 2021, 21, geochem2020-075. [Google Scholar] [CrossRef]
  29. Johnsen, A.R.; Thomsen, T.B.; Thaarup, S.M. Test of vegetation-based surface exploration for detection of Arctic mineralisations: The deep buried Kangerluarsuk Zn-Pb-Ag anomaly. J. Geochem. Explor. 2020, 220, 106665. [Google Scholar] [CrossRef]
  30. Kadel-Harder, I.M.; Spry, P.G.; McCombs, A.L.; Zhang, H. Identifying pathfinder elements for gold in bulk-rock geochemical data from the Cripple Creek Au–Te deposit: A statistical approach. Geochem. Explor. Environ. Anal. 2021, 21, geochem2020-048. [Google Scholar] [CrossRef]
  31. Steiner, B.M. Tools and Workflows for Grassroots Li–Cs–Ta (LCT) Pegmatite Exploration. Minerals 2019, 9, 499. [Google Scholar] [CrossRef] [Green Version]
  32. Plimer, I.R.; Elliott, S.M. The use of Rb/Sr ratios as a guide to mineralization. J. Geochem. Explor. 1979, 12, 21–34. [Google Scholar] [CrossRef]
  33. Meima, J.A.; Rammlmair, D.; Junge, M. The use of Laser Induced Breakdown Spectroscopy for the mineral chemistry of chromite, orthopyroxene and plagioclase from Merensky Reef and UG-2 chromitite, Bushveld Complex, South Africa. Chem. Geol. 2022, 589, 120686. [Google Scholar] [CrossRef]
  34. Cao, Y.; Linnen, R.; Good, D.; Samson, I. Applications of the combined portable XRF-benchtop SEM methodology to PGE exploration. Ore Geol. Rev. 2018, 101, 32–53. [Google Scholar] [CrossRef]
  35. El-Makky, A.M. Statistical Analyses of La, Ce, Nd, Y, Nb, Ti, P, and Zr in Bedrocks and Their Significance in Geochemical Exploration at the Um Garayat Gold Mine Area, Eastern Desert, Egypt. Nat. Resour. Res. 2011, 20, 157–176. [Google Scholar] [CrossRef]
  36. Lindagato, P.; Li, Y.; Yang, G.; Duan, F.; Wang, Z. Application of geostatistical analyst methods in discovering concealed gold and pathfinder elements as geochemical anomalies related to ore mineralization. Geologos 2018, 24, 95–109. [Google Scholar] [CrossRef] [Green Version]
  37. Leybourne, M.I. Aqueous geochemistry in geochemical exploration. In Mineral Deposits of Canada: A Synthesis of Major Deposit-Types, District Metallogeny, Evolution of Geological Provinces, and Exploration Methods; Goodfellow, W.D., Ed.; Geological Association of Canada: St. John’s, NL, Canada, 2007; Volume 5, pp. 1007–1033. [Google Scholar]
  38. Narayanaswamy; Balaram, V.; Ramkumar, N.; Anjaiah, K.V. Concentrations of gold in natural waters from lateritic terrain, Wynad-Nilambur gold fields, Kerala, India and its possible role in exploration. J. Geol. Soc. India 1998, 52, 301–304. [Google Scholar]
  39. Balaram, V.; Satyanarayanan, M.; Anabarasu, K.; Rao, D.V.S.; Dar, A.M.; Kamala, C.T.; Charan, S.N. Hydro-Geochemical Prospecting for Platinum Group of Elements (PGE) in the Sittampundi Layered Ultramafic Complex, Tamil Nadu, India: Pd as an Indicator of Mineralization. J. Geol. Soc. India 2019, 94, 341–350. [Google Scholar] [CrossRef]
  40. Balaram, V. Current Advances in Miniaturization of Analytical Instruments—Applications in Cosmochemistry, Geochemistry, Exploration and Environmental Sciences. Spectroscopy 2016, 31, 40–44. [Google Scholar]
  41. Crocombe, R.A. Portable Spectroscopy. Appl. Spectrosc. 2018, 72, 1701–1751. [Google Scholar] [CrossRef]
  42. Francos, N.; Notesco, G.; Ben-Dor, E. Estimation of the Relative Abundance of Quartz to Clay Minerals Using the Visible–Near-Infrared–Shortwave-Infrared Spectral Region. Appl. Spectrosc. 2021, 75, 882–892. [Google Scholar] [CrossRef]
  43. Booysen, R.; Lorenz, S.; Thiele, S.T.; Fuchsloch, W.C.; Marais, T.; Nex, P.A.M.; Gloaguen, R. Accurate hyperspectral imaging of mineralized outcrops: An example from lithium-bearing pegmatites at Uis, Namibia. Remote Sens. Environ. 2022, 269, 112790. [Google Scholar] [CrossRef]
  44. Simpson, M.P.; Christie, A.B. Exploration of New Zealand mineral deposits and geothermal systems using X-ray diffraction (XRD) and reflectance spectrometry (SWIR): A comparison of techniques. GNS Sci. Rep. 2016, 61, 45. [Google Scholar] [CrossRef]
  45. Booysen, R.; Jackisch, R.; Lorenz, S.; Zimmermann, R.; Kirsch, M.; Nex, P.A.M.; Gloaguen, R. Detection of REEs with lightweight UAV-based hyperspectral imaging. Sci. Rep. 2020, 10, 17450. [Google Scholar] [CrossRef]
  46. Barton, I.F.; Gabriel, M.J.; Lyons-Baral, J.; Barton, M.D.; Duplessis, L.; Roberts, C. Extending geo-metallurgy to the mine scale with hyperspectral imaging: A pilot study using drone- and ground-based scanning. Min. Metall. Explor. 2021, 38, 799–818. [Google Scholar] [CrossRef]
  47. Stuart, M.B.; McGonigle, A.J.S.; Davies, M.; Hobbs, M.J.; Boone, N.A.; Stanger, L.R.; Zhu, C.; Pering, T.D.; Willmott, J.R. Low-Cost Hyperspectral Imaging with a Smartphone. J. Imaging 2021, 7, 136. [Google Scholar] [CrossRef] [PubMed]
  48. Liancun, X.; Zhizhong, Z.; Chunxia, C.; Yang, G. Mineral identification and geological mapping using near-infrared spectroscopy analysis. In Proceedings of the 2017 International Conference on Progress in Informatics and Computing (PIC), Nanjing, China, 15–17 December 2017. [Google Scholar] [CrossRef]
  49. Lemière, B.; Uvarova, Y.A. New developments in field portable geochemical techniques and on-site technologies and their place in mineral exploration. Geochem. Explor. Environ. Anal. 2019, 20, 205–216. [Google Scholar] [CrossRef]
  50. Salisbury, J.W.; Walter, L.S.; Vergo, N. Mid-InfraRed (2.1–25 μm) Spectra of Minerals: First Edition, 1st ed.; United States Geological Survey: Reston, VI, USA, 1986.
  51. Kakavand, A.; Adl-Zarrabi, B. Introduction of Possible Inspection Methods for Evaluating Thermal Aging Status of Existing Pre-Insulated District Heating Systems; University of Technology: Gothenburg, Sweden, 2015; pp. 1–29. [Google Scholar]
  52. Dehaine, Q.; Tijsseling, L.T.; Rollinson, G.K.; Buxton, M.W.N.; Glass, H.J. Geometallurgical Characterization with Portable FTIR: Application to Sediment-Hosted Cu-Co Ores. Minerals 2022, 12, 15. [Google Scholar] [CrossRef]
  53. Bawa, A.S.; Ousmane, M.S.; Mamane, O.S.; Yacoubai, A.C.; Natatou, I. XRD and Infrared study of limestone from Chadawanka (Tahoua, Niger). J. Mater. Environ. Sci. 2021, 12, 664–672. [Google Scholar]
  54. Chandrasekaran, A.; Kumar, C.K.S.; Sathish, V.; Manigandan, S.; Tamilarasi, A. Effect of minerals and heavy metals in sand samples of Ponnai river, Tamil Nadu, India. Sci. Rep. 2021, 11, 23199. [Google Scholar] [CrossRef]
  55. Khang, V.V.; Korovkin, M.V.; Ananyeva, L.G. Identification of clay minerals in reservoir rocks by FTIR spectroscopy. IOP Conf. Ser. Earth Environ. Sci. 2016, 43, 012004. [Google Scholar] [CrossRef] [Green Version]
  56. Zhang, J.; Cao, J.; Xiang, B.; Zhou, N.; Ma, W.; Li, E. Fourier-Transform Infrared Proxies for Oil Source and Maturity: Insights from the Early Permian Alkaline Lacustrine System, Junggar Basin (NW China). Energy Fuels 2019, 33, 10704–10717. [Google Scholar] [CrossRef]
  57. Spasennykh, M.; Chekhonin, E.; Leushina, E. A Summary of “Petrophysics and Geochemistry of Unconventional Reservoirs”. Geosciences 2021, 11, 453. [Google Scholar] [CrossRef]
  58. Killeen, P. Gamma ray spectrometric methods in uranium exploration—Application and interpretation. Geophys. Geochem. Search Met. Ores 1979, 31, 163–230. [Google Scholar]
  59. McCay, A.T.; Harley, T.L.; Younger, P.L.; Sanderson, D.C.W.; Cresswell, A.J. Gamma-ray Spectrometry in Geothermal Exploration: State of the Art Techniques. Energies 2014, 7, 4757–4780. [Google Scholar] [CrossRef] [Green Version]
  60. Bharti, R.; Kalimuthu, R.; Ramakrishnan, D. Spectral pathways for exploration of secondary uranium: An investigation in the desertic tracts of Rajasthan and Gujarat, India. Adv. Space Res. 2019, 56, 1613–1626. [Google Scholar] [CrossRef]
  61. Maden, N.; Akarya, E. Gamma ray spectrometry for recognition of hydrothermal alteration zones related to a low sulfidation epithermal gold mineralization (eastern Pontides, NE Türkiye). J. Appl. Geophys. 2015, 122, 74–85. [Google Scholar] [CrossRef]
  62. Shives, R.B.K. Using gamma ray spectrometry to find rare metals. In Symposium on Strategic and Critical Materials Proceedings, Nov. 2015, Victoria, British Columbia. British Columbia Ministry of Energy and Mines, British Columbia Geological Survey Paper; Simandl, G.J., Neetz, M., Eds.; British Columbia Geological Survey: Victoria, BC, Canada, 2015; Volume 3, pp. 199–209. [Google Scholar]
  63. Bosco, G.L. Development and application of portable, hand-held X-ray fluorescence spectrometers. Trends Anal. Chem. 2013, 45, 121–134. [Google Scholar] [CrossRef]
  64. Potts, P.J.; Webb, P.C. X-ray fluorescence spectrometry. J. Geochem. Explor. 1992, 44, 251–296. [Google Scholar] [CrossRef]
  65. Yellepeddi, R.; Thomas, R. New developments in wavelength dispersive XRF and XRD for the analysis of foodstuffs and pharmaceutical materials. Spectroscopy 2006, 21, 36–41. [Google Scholar]
  66. Balaram, V. Current and emerging analytical techniques for geochemical and geochronological studies. Geol. J. 2021, 56, 2300–2359. [Google Scholar] [CrossRef]
  67. Hall, G.E.M.; McClenaghan, M.B.; Pagé, L. Application of portable XRF to the direct analysis of till samples from various deposit types in Canada. Geochem. Explor. Environ. Anal. 2015, 16, 62–84. [Google Scholar] [CrossRef]
  68. Camara, C.G.; Escobar, J.V.; Hird, J.R.; Putterman, S.J. Correlation between nanosecond x-ray flashes and stick-slip friction in peeling tape. Nature 2008, 455, 1089–1092. [Google Scholar] [CrossRef]
  69. Gallhofer, D.; Lottermoser, B.G. The influence of spectral interferences on critical element determination with portable x-ray fluorescence spectrometer (pXRF). Minerals 2018, 8, 320. [Google Scholar] [CrossRef] [Green Version]
  70. Analytical Methods Committee AMCTB No. 89. Hand-held X-ray fluorescence spectrometry. Anal. Methods 2019, 11, 2498–2501. [Google Scholar] [CrossRef]
  71. Bloise, A.; Miriello, M. Multi-Analytical Approach for Identifying Asbestos Minerals in Situ. Geosciences 2018, 8, 133. [Google Scholar] [CrossRef] [Green Version]
  72. Durance, P.; Jowitt, S.M.; Bush, K. An assessment of portable X-ray fluorescence spectroscopy in mineral exploration, Kurnalpi Terrane, Eastern Goldfields Super terrane, Western Australia. Appl. Earth Sci. Trans. Inst. Min. Metall. B 2014, 123, 150–163. [Google Scholar] [CrossRef]
  73. Sarala, P. New advances in geochemical exploration in glaciated terrain—examplesfrom northern Finland. In Proceedings of the 24th International Applied Geochemistry Symposium, Fredericton, NB, Canada, 1–4 June 2009; Volume II, pp. 585–587. [Google Scholar]
  74. Somarin, A.; Zhou, L.; Steinhage, I. Application of handheld XRF on Ta-Nb-Sn-W ore: Factory calibration or user calibration? Geochem. J. 2021, 55, 149–158. [Google Scholar] [CrossRef]
  75. Van de Ven, M.; Gazley, M.; Sterk, R.; Aldrich, S.; Werner, E. Exploration for Lithium-Caesium-Tantalum (LCT) pegmatites in New Zealand. In Proceedings of the New Zealand Minerals Forum, Hamilton, New Zealand, 18 November 2020; pp. 87–91. [Google Scholar]
  76. Simandl, G.J.; Fajber, R.; Paradis, S. Portable X-ray fluorescence in the assessment of rare earth element enriched sedimentary phosphate deposits. Geochem. Explor. Environ. Anal. 2014, 14, 161–169. [Google Scholar] [CrossRef]
  77. Robertson, M.E.A.; Feather, C.E. Determination of gold, platinum and uranium in South African ores by high-energy XRF spectrometry. X-Ray Spectrom. 2004, 33, 164–173. [Google Scholar] [CrossRef]
  78. Balaram, V.; Subramanyam, K.S.V. Sample Preparation for Geochemical Analysis: Strategies and Significance. Adv. Sample Prep. 2022, 1, 100010. [Google Scholar] [CrossRef]
  79. Lemiere, B.A. Review of pXRF (Field Portable X-ray Fluorescence) Applications for Applied Geochemistry. J. Geochem. Explor. 2018, 188, 350–363. [Google Scholar] [CrossRef] [Green Version]
  80. Borisov, S.V.; Podberezskaya, N.V. X-ray diffraction analysis: A brief history and achievements of the first century. J. Struct. Chem. 2012, 53, 1–3. [Google Scholar] [CrossRef]
  81. Etter, M.; Dinnebier, R.E. A Century of Powder Diffraction: A Brief History. Z. Anorg. Allg. Chem. 2014, 640, 3015–3028. [Google Scholar] [CrossRef]
  82. Hansford, G.; Thomas, R. Handheld X-ray Diffraction for Remote, Field-Based Applications. Spectroscopy 2015, 30, 14–21. [Google Scholar]
  83. Pöllmann, H.; König, U. Monitoring of Lithium Contents in Lithium Ores and Concentrate-Assessment Using X-ray Diffraction (XRD). Minerals 2021, 11, 1058. [Google Scholar] [CrossRef]
  84. Cremers, D.A.; Radziemski, L.J. Handbook of Laser-Induced Breakdown Spectroscopy; John Wiley & Sons: Hoboken, NJ, USA, 2013. [Google Scholar]
  85. Radziemski, L.; Cremers, D. A brief history of laser-induced breakdown spectroscopy: From the concept of atoms to LIBS 2012. Spectrochim. Acta Part B At. Spectrosc. 2013, 87, 3–10. [Google Scholar] [CrossRef]
  86. Connors, B.; Somers, A.; Day, D. Application of Handheld Laser-Induced Breakdown Spectroscopy (LIBS) to Geochemical Analysis. Appl. Spectrosc. 2016, 70, 810–815. [Google Scholar] [CrossRef] [PubMed]
  87. Senesi, G.S.; Harmon, R.S.; Hark, R.R. Field-portable and handheld LIBS: Historical review, current status and future prospects. Spectrochim. Acta Part B At. Spectrosc. 2020, 175, 106013. [Google Scholar] [CrossRef]
  88. Harmon, R.S.; Senesi, G.S. Laser-Induced Breakdown Spectroscopy—A geochemical tool for the 21st century. Appl. Geochem. 2021, 128, 104929. [Google Scholar] [CrossRef]
  89. Hark, R.R.; Harmon, R.S. Geochemical Fingerprinting Using LIBS. In Laser Induced Breakdown Spectroscopy–Theory & Applications; Musazzi, S., Perini, U., Eds.; Springer: Berlin/Heidelberg, Germany, 2014; pp. 309–348. [Google Scholar]
  90. Mukhopadhyay, P. Development and Characterization of Diode Pumped Solid State Lasers. Saarbrucken; LAP LAMBERT Academic Publishing GmbH & Co. KG: Saarbrücken, Germany, 2011; pp. 1–184. [Google Scholar]
  91. Harmon, R.S.; Lawley, C.J.M.; Watts, J.; Harraden, C.J.; Somers, A.M.; Hark, R.R. Laser-Induced Breakdown Spectroscopy—An Emerging Analytical Tool for Mineral Exploration. Minerals 2019, 9, 718. [Google Scholar] [CrossRef] [Green Version]
  92. Buckley, S. Geochemical analysis using laser-induced breakdown spectroscopy. Spectroscopy 2021, 36, 9–14. [Google Scholar]
  93. Andrade, D.F.; Pereira-Filho, E.R.; Amarasiriwardena, D. Current trends in laser-induced breakdown spectroscopy: A tutorial review. Appl. Spectrosc. Rev. 2020, 56, 98–114. [Google Scholar] [CrossRef]
  94. Rethfeldt, N.; Brinkmann, P.; Riebe, D.; Beitz, T.; Köllner, N.; Altenberger, U.; Löhmannsröben, H.-G. Detection of Rare Earth Elements in Minerals and Soils byLaser-Induced Breakdown Spectroscopy (LIBS) Using Interval PLS. Minerals 2021, 11, 1379. [Google Scholar] [CrossRef]
  95. Idris, N.; Lahna, K.; Ramli, M.; Abidin, T.F.; Budi, W.S.; Suliyanti, M.M.; Kurniawan, K.H.; Tjia, M.O.; Kagawa, K. Characteristics of laser induced breakdown investigated by a compact, nongated optical multichannel analyzer system and its potential application. Heliyon 2020, 6, e05711. [Google Scholar] [CrossRef]
  96. Day, D. Handheld Laser Induced Breakdown Spectroscopy (HHLIBS). In Portable Spectroscopy and Spectrometry 1: Technologies and Instrumentation, 1st ed.; Richard, A., Crocombe, R.A., Leary, P.E., Kammrath, B.W., Eds.; John Wiley & Sons: Hoboken, NJ, USA, 2021; pp. 321–343. [Google Scholar]
  97. Pochon, A.; Desaulty, A.M.; Bailly, L. Handheld Laser-Induced Breakdown Spectroscopy (LIBS) as a fast and easy method to trace gold. J. Anal. At. Spectrom. 2020, 35, 254–264. [Google Scholar] [CrossRef]
  98. Walting, R.J.; Scadding, C.J.; May, C.D. Chemical fingerprinting of gold using laser ablation–inductively coupled plasma–mass spectrometry (LA-ICP-MS). J. R. Soc. West. Aust. 2014, 97, 87–96. [Google Scholar]
  99. Kerrich, R.; Wyman, D.A. Review of developments in trace-element fingerprinting of geodynamic settings and their implications for mineral exploration. Aust. J. Earth Sci. 1997, 44, 465–487. [Google Scholar] [CrossRef]
  100. Harhira, A.; Bouchard, P.; Rifai, K.; Haddad, J.E.; Sabsabi, M.; Blouin, A.; Laflamme, M. Advanced laser-induced breakdown spectroscopy (LIBS) sensor for gold mining. In Proceedings of the 56th Conference of Metallurgists COM, Vancouver, BC, Canada, 30 August 2017. [Google Scholar]
  101. Wise, M.A.; Harmon, R.S.; Curry, A.; Jennings, M.; Grimac, Z.; Khashchevskaya, D. Handheld LIBS for Li Exploration: An Example from the Carolina Tin-Spodumene Belt, USA. Minerals 2022, 12, 77. [Google Scholar] [CrossRef]
  102. Fabre, C.; Ourti, N.E.; Ballouard, G.; Mercadier, J.; Cauzid, J. Handheld LIBS analysis for in situ quantification of Li and detection of the trace elements (Be, Rb and Cs). J. Geochem. Explor. 2022, 236, 106979. [Google Scholar] [CrossRef]
  103. Ray, B.H.; Carron., K.T. From Portable Raman to Mobile Raman: The Progression of Raman Spectroscopy. In Next-Generation Spectroscopic Technologies XI; Druy, M.A., Crocombe, R.A., Barnett, S.M., Profeta, L.T.M., Eds.; SPIE: Bellingham, WA, USA, 2018; Volume 10657, p. 1065704. [Google Scholar] [CrossRef]
  104. Mitsutake, H.; Poppi, R.J.; Breitkreitz, M.C. Raman Imaging Spectroscopy: History, Fundamentals and Current Scenario of the Technique. Rev. J. Braz. Chem. Soc. 2019, 30, 11. [Google Scholar] [CrossRef]
  105. Balaram, V. Field-portable instruments in mineral exploration: Past, present and future. J. Appl. Geochem. 2017, 19, 382–399. [Google Scholar]
  106. Levitan, D.M.; Hammarstrom, J.M.; Gunter, M.E.; Ii, S.; Robert, R.; Chou, I.-M.; Piatak, N.M. Mineralogy of mine waste at the Vermont asbestos group mine, Belvidere Mountain, Vermont. Am. Mineral. 2009, 94, 1063–1066. [Google Scholar] [CrossRef] [Green Version]
  107. Sergeeva, A.V.; Zhitova, E.S.; Nuzhdaev, A.A.; Zolotarev, A.A.; Bocharov, V.N.; Ismagilova, R.M. Infrared and Raman Spectroscopy of Ammoniovoltaite, (NH4)2Fe2+5Fe3+ 3Al(SO4)12(H2O)18. Minerals 2020, 10, 781. [Google Scholar] [CrossRef]
  108. Moroz, T.N.; Edwards, H.G.M.; Zhmodik, S.M. Detection of carbonate, phosphate minerals and cyanobacteria in rock from the Tomtor deposit, Russia, by Raman spectroscopy. Spectrochim. Acta Part A Mol. Biomol. Spectrosc. 2021, 250, 119372. [Google Scholar] [CrossRef]
  109. Groppo, C.; Rinaudo, C.; Cairo, S.; Gastaldi, D.; Compagnoni, R. Micro-Raman spectroscopy for a quick and reliable identification of serpentine minerals from ultramafics. Eur. J. Miner. 2006, 18, 319–329. [Google Scholar] [CrossRef]
  110. Orlando, A.; Franceschini, F.; Muscas, C.; Pidkova, S.; Bartoli, M.; Rovere, M.; Tagliaferro, A. A Comprehensive Review on Raman Spectroscopy Applications. Chemosensors 2021, 9, 262. [Google Scholar] [CrossRef]
  111. Kim, Y.; Caumon, M.C.; Barres, O.; Sall, A.; Cauzid, J. Identification and composition of carbonate minerals of the calcite structure by Raman and infrared spectroscopies using portable devices. Spectrochim. Acta Part A Mol. Biomol. Spectrosc. 2021, 261, 119980. [Google Scholar] [CrossRef] [PubMed]
  112. Arbiol, C.; Layne, G.D. Raman Spectroscopy Coupled with Reflectance Spectroscopy as a Tool for the Characterization of Key Hydrothermal Alteration Minerals in Epithermal Au–Ag Systems: Utility and Implications for Mineral Exploration. Appl. Spectrosc. 2021, 75, 1475–1496. [Google Scholar] [CrossRef] [PubMed]
  113. Lundsgaard-Nielsen, S.M.; Pors, A.; Banke, S.O.; Henriksen, J.E.; Hepp, D.K.; Weber, A. Critical-depth Raman spectroscopy enables home- use non-invasive glucose monitoring. PLoS ONE 2018, 13, e0197134. [Google Scholar] [CrossRef] [PubMed] [Green Version]
  114. Ando, S.; Garzanti, E. Raman spectroscopy in heavy-mineral studies, 2014. In Sediment Provenance Studies in Hydrocarbon Exploration and Production; Scott, R.A., Smyth, H.R., Morton, A.C., Richardson, N., Eds.; Geological Society: London, UK, 2013; Volume 386. [Google Scholar] [CrossRef]
  115. Balaram, V.; Rani, A.; Rathore, D.P.S. Uranium in groundwater in parts of India and world: A comprehensive review of sources, impact to the environment and human health, analytical techniques, and mitigation technologies. Geosystems Geoenvironment 2022, 1, 100043. [Google Scholar] [CrossRef]
  116. Rathore, D.P.S. Advances in technologies for the measurement of uranium in diverse matrices. Talanta 2008, 77, 9–20. [Google Scholar] [CrossRef] [PubMed]
  117. Mehra, R.; Gupta, D.; Jakhu, R. Risk Assessment for Natural Uranium Present in Ground Water of Mahendragarh district of Haryana. J. Radiat. Nucl. Appl. 2017, 2, 67–73. [Google Scholar] [CrossRef]
  118. Kale, A.; Bandela, N.; Kulkarni, J. Spatial distribution and risk assessment of naturally occurring uranium along with correlational study from Buldhana district of Maharashtra, India. J. Radioanal. Nucl. Chem. 2021, 327, 771–787. [Google Scholar] [CrossRef]
  119. Winterburn, P.A.; Noble, R.R.P.; Lawie, D. Advances in Exploration Geochemistry, 2007 to 2017 and beyond. Geochem. Explor. Environ. Anal. 2017, 20, 495–505. [Google Scholar] [CrossRef] [Green Version]
  120. Gopal, L.; Hanuman, V.V.; Chakrapani, G. Separation Cum Pre-Concentration Technique for Determination of Uranium in Sea, Brine and Ground Water at Nano to Sub nanogram Levels. Int. J. Sci. Res. Sci. Technol. 2020, 7, 1–11. [Google Scholar] [CrossRef]
  121. Dunlea, A.G.; Murray, R.W.; Tada, R.; Alvarez-Zarikian, C.A.; Anderson, C.H.; Gilli, A.; Giosan, L.; Gorgas, T.; Hennekam, R.; Irino, T.; et al. Intercomparison of XRF core scanning results from seven labs and approaches to practical calibration. Geochem. Geophys. Geosystems 2020, 21, e2020GC009248. [Google Scholar] [CrossRef]
  122. Rosa, R.D.L.; Khodadadzadeh, M.; Tusa, L.; Kirsch, M.; Tornos, F.G.; Delgado, R.T.; Gloaguen, R. Mineral quantification at deposit scale using drill-core hyperspectral data: A case study in the Iberian Pyrite Belt. Ore Geol. Rev. 2021, 139, 104514. [Google Scholar] [CrossRef]
  123. Paradis, M.C.M.; Doucet, F.R.; Rifai, K.; Özcan, L.Ç.; Azami, N.; Vidal, F. ECORE: A New Fast Automated Quantitative Mineral and Elemental Core Scanner. Minerals 2021, 11, 859. [Google Scholar] [CrossRef]
  124. Meima, J.A.; Rammlmair, D. Investigation of compositional variations in chromitite ore with imaging Laser Induced Breakdown Spectroscopy and Spectral Angle Mapper classification algorithm. Chem. Geol. 2020, 532, 119376. [Google Scholar] [CrossRef]
  125. Guo, F.; Clemens, S.; Liu, X.; Long, Y.; Li, D.; Tan, L.; Liu, C.; Yan, H.; Sun, Y. Application of XRF scanning to different geological archives. Earth Space Sci. 2021, 8, e2020EA001589. [Google Scholar] [CrossRef]
  126. Munteanu, M.; Sädbom, S.; Paaso, J.; Bergqvist, M.; Arvanitidis, N.; Arvidsson, R.; Kolacz, J.; Bakalis, E.; Ivanov, D.; Grammi, K.; et al. X-MINE project (H2020): Testing the capabilities of X-ray techniques in drill core scanning and ore sorting. In Proceedings of the EGU General Assembly Conference Abstracts, Online, 4–8 May 2020. [Google Scholar] [CrossRef]
  127. Eichstaedt, H.; Ho, C.Y.J.; Kutzke, A.; Kahnt, R. Performance measurements of machine learning and different neural network designs for prediction of geochemical properties based on hyperspectral core scans. Aust. J. Earth Sci. 2022, 2017344. [Google Scholar] [CrossRef]
  128. Rull, F.; Veneranda, M.; Manrique-Martinez, J.A.; Sanz-Arranz, A.; Saiz, J.; Medina, J.; Lopez-Reyes, G. Spectroscopic study of terrestrial analogues to support rover missions to Mars—A Raman-centred review. Anal. Chim. Acta 2021, 339003. [Google Scholar] [CrossRef]
  129. Rammelkamp, K.; Gasnault, O.; Forni, O.; Bedford, C.C.; Dehouck, E.; Cousin, A.; Lasue, J.; David, G.; Gabriel, T.S.J.; Maurice, S.; et al. Clustering supported classification of ChemCam data from Gale crater, Mars. Earth Space Sci. 2021, 8, e2021EA001903. [Google Scholar] [CrossRef]
  130. Qu, H.; Ling, Z.; Qi, X.; Xin, Y.; Liu, C.; Cao, H. A Remote Raman System and Its Applications for Planetary Material Studies. Sensors 2021, 21, 6973. [Google Scholar] [CrossRef]
  131. Gonzalez-Fernandez, O.; Rivero, L.; Queralt, I.; Viladevall, M. Distribution of metals in vadose zone of the alluvial plain in a mining creek inferred from geochemical, mineralogical and geophysical studies: The Beal Wadi Case (Cartagena–La Union Mining District, SE Spain). Water Air Soil Pollut. 2011, 221, 45–61. [Google Scholar] [CrossRef]
  132. Dhanada, V.S.; George, S.D.; Kartha, V.B.; Chidangil, S.; Unnikrishnan, V.K. Hybrid LIBS-Raman-LIF systems for multi-modal spectroscopic applications: A topical review. Appl. Spectrosc. Rev. 2020, 56, 463–491. [Google Scholar] [CrossRef]
  133. Miller, K.A.; Brigden, K.; Santillo, D.; Currie, D.; Johnston, P.; Thompson, K.F. Challenging the Need for Deep Seabed Mining from the Perspective of Metal Demand, Biodiversity, Ecosystems Services, and Benefit Sharing. Front. Mar. Sci. 2021, 8, 706161. [Google Scholar] [CrossRef]
  134. Takaya, Y.; Yasukawa, K.; Kawasaki, T.; Fujinaga, K.; Ohta, J.; Usui, Y.; Nakamura, K.; Kimura, J.I.; Chang, Q.; Hamada, M.; et al. The tremendous potential of deep-sea mud as a source of rare-earth elements. Sci. Rep. 2018, 8, 5763. [Google Scholar] [CrossRef] [PubMed] [Green Version]
  135. Milinovic, J.; Rodrigues, F.J.L.; Barriga, F.J.A.S.; Murton, B.J. Ocean-Floor Sediments as a Resource of Rare Earth Elements: An Overview of Recently Studied Sites. Minerals 2021, 11, 142. [Google Scholar] [CrossRef]
  136. Nyga, R.; Neu, W. Double-pulse technique for optical emission spectroscopy of ablation plasmas of samples in liquids. Opt. Lett. 1993, 18, 747–749. [Google Scholar] [CrossRef]
  137. Thornton, B.; Takahashi, T.; Sato, T.; Sakka, T.; Tamura, A.; Matsumoto, A.; Nozaki, T.; Ohki, T.; Ohki, K. Development of a deep-sea laser-induced breakdown spectrometer for in situ multi-element chemical analysis. Deep. Sea Res. 2015, 95, 20–36. [Google Scholar] [CrossRef] [Green Version]
  138. Liu, C.; Guo, J.; Tian, Y.; Zhang, C.; Cheng, K.; Ye, W.; Zheng, R. Development and Field Tests of a Deep-Sea Laser-Induced Breakdown Spectroscopy (LIBS) System for Solid Sample Analysis in Seawater. Sensors 2020, 20, 7341. [Google Scholar] [CrossRef]
  139. Balaram, V. Rare Earth Elements: Sources and Applications, in Environmental Technologies to Treat Rare Earth Elements Pollution: Principles and Engineering; Arindam, S., Piet, N.L., Eds.; IWA Publishers: London, UK, 2022; pp. 75–114. [Google Scholar] [CrossRef]
  140. Obhođaš, J.; Sudac, D.; Meric, I.; Pettersen, H.E.S.; Uroić, M.; Nađ, K.; Valković, V. In-situ measurements of rare earth elements in deep sea sediments using nuclear methods. Sci. Rep. 2018, 8, 4925. [Google Scholar] [CrossRef] [Green Version]
  141. Milinovic, J.; Barriga, F.J.; Murton, B.J. Analysis of deep-ocean sediments from the TAG hydrothermal field (MAR, 26° N): Application of short-wave infrared reflectance (SWIR) spectra for offshore geochemical exploration. J. Soils Sediments 2020, 20, 3472–3486. [Google Scholar] [CrossRef]
  142. Balaram, V. Recent trends in the instrumental analysis of rare earth elements in geological and industrial materials. Trends Anal. Chem. 1996, 15, 475–486. [Google Scholar] [CrossRef]
  143. Broekaert, J.A.C. Analytical Atomic Spectrometry with Flames and Plasmas; John Wiley & Sons: Hoboken, NJ, USA, 2002; pp. 1–375. [Google Scholar]
  144. Gałuszka, A.; Migaszewski, Z.M.; Namieśnik, J. Moving your laboratories to the field—Advantages and limitations of the use of field portable instruments in environmental sample analysis. Environ. Res. 2015, 140, 593–603. [Google Scholar] [CrossRef] [PubMed]
  145. Arne, D.C.; Mackie, R.A.; Jones, S.A. The use of property-scale portable X-ray fluorescence data in gold exploration: Advantages and limitations. Geochem. Explor. Environ. Anal. 2014, 14, 233–244. [Google Scholar] [CrossRef]
  146. Sarala, P.; Taivalkoski, A.; Valkama, J. Portable XRF: An Advanced On-Site Analysis Method in Till Geochemical Exploration, in Novel Technologies for Greenfield Exploration; Special Paper, 57, Sarala, P., Eds.; Geological Survey of Finland: Espoo, Finland, 2015; pp. 63–86. [Google Scholar]
  147. Burlakovs, J.; Kaczala, F.; Orupõld, K.; Bhatnagar, A.; Vincevica-Gaile, Z.; Rudovica, V.; Kriipsalu, M.; Hogland, M.; Stapkevica, M.; Hogland, W.; et al. Field-portable X-ray fluorescence spectrometry as rapid measurement tool for landfill mining operations: Comparison of field data vs. laboratory analysis. Intern. J. Environ. Anal. Chem. 2015, 95, 609–617. [Google Scholar] [CrossRef]
  148. Sarala, P. Comparison of different portable XRF methods for determining till geochemistry. Geochem. Explor. Environ. Anal. 2016, 16, 181–192. [Google Scholar] [CrossRef]
  149. Bower, D.M.; Yang, C.S.C.; Hewagama, T.; Nixon, C.A.; Aslam, A.; Whelley, P.L.; Eigenbrode, J.L.; Jin, F.; Ruliffson, J.; Kolasinski, J.R.; et al. Spectroscopic characterization of samples from different environments in a Volcano-Glacial region in Iceland: Implications for in situ planetary exploration. Spectrochim. Acta Part A Mol. Biomol. Spectrosc. 2021, 263, 120205. [Google Scholar] [CrossRef]
  150. Laperche, V.; Lemière, B. Possible Pitfalls in the Analysis of Minerals and Loose Materials by Portable XRF, and How to Overcome Them. Minerals 2021, 11, 33. [Google Scholar] [CrossRef]
  151. Vıtek, P.; Jehlicka, J.; Edwards, H.G.M. Practical Considerations for the Field Application of Miniaturized Portable Raman Instrumentation for the Identification of Minerals. Appl. Spectrosc. 2013, 67, 767–778. [Google Scholar] [CrossRef]
  152. Duée, C.; Orberger, B.; Maubec, N.; Laperche, V.; Capar, L.; Bourguignon, A.; Bourrat, X.; El Mendili, Y.; Chateigner, D.; Gascoin, S.; et al. Impact of heterogeneities and surface roughness on pXRF, pIR, XRD and Raman analyses: Challenges for on-line, real-time combined mineralogical and chemical analyses on drill cores and implication for “high speed” Ni-laterite exploration. J. Geochem. Explor. 2018, 198, 1–17. [Google Scholar] [CrossRef]
  153. Balaram, V. Assessment of ICP-MS method using the interlaboratory QA study of two Polish soil RMS. Accredit. Qual. Assur. 2000, 5, 325–330. [Google Scholar] [CrossRef]
  154. Balaram, V.; Patil, M.L.; Agrawal, A.K.; Rao, D.V.S.; Charan, S.N.; Satyanarayanan, M.; Mathur, R.; Kapilavastu, K.; Sarma, D.S.; Gowda, M.S.; et al. Preparation and certification of high-grade gold geochemical reference material. Accredit. Qual. Assur. 2006, 11, 329–335. [Google Scholar] [CrossRef]
  155. Bhatt, C.R.; Jain, C.J.; Gouegue, C.L.; McIntyre, D.L.; Singh, J.P. Determination of Rare Earth Elements in Geological Samples Using Laser-Induced Breakdown Spectroscopy (LIBS). Appl. Spectrosc. 2017, 72, 114–121. [Google Scholar] [CrossRef] [PubMed]
  156. Fuchs, M.C.; Beyer, J.; Lorenz, S.; Sharma, S.; Renno1, A.D.; Heitmann, J.; Gloaguen, R.A. Spectral library for laser-induced fluorescence analysis as a tool for rare earth element identification. Earth Syst. Sci. Data 2021, 13, 4465–4483. [Google Scholar] [CrossRef]
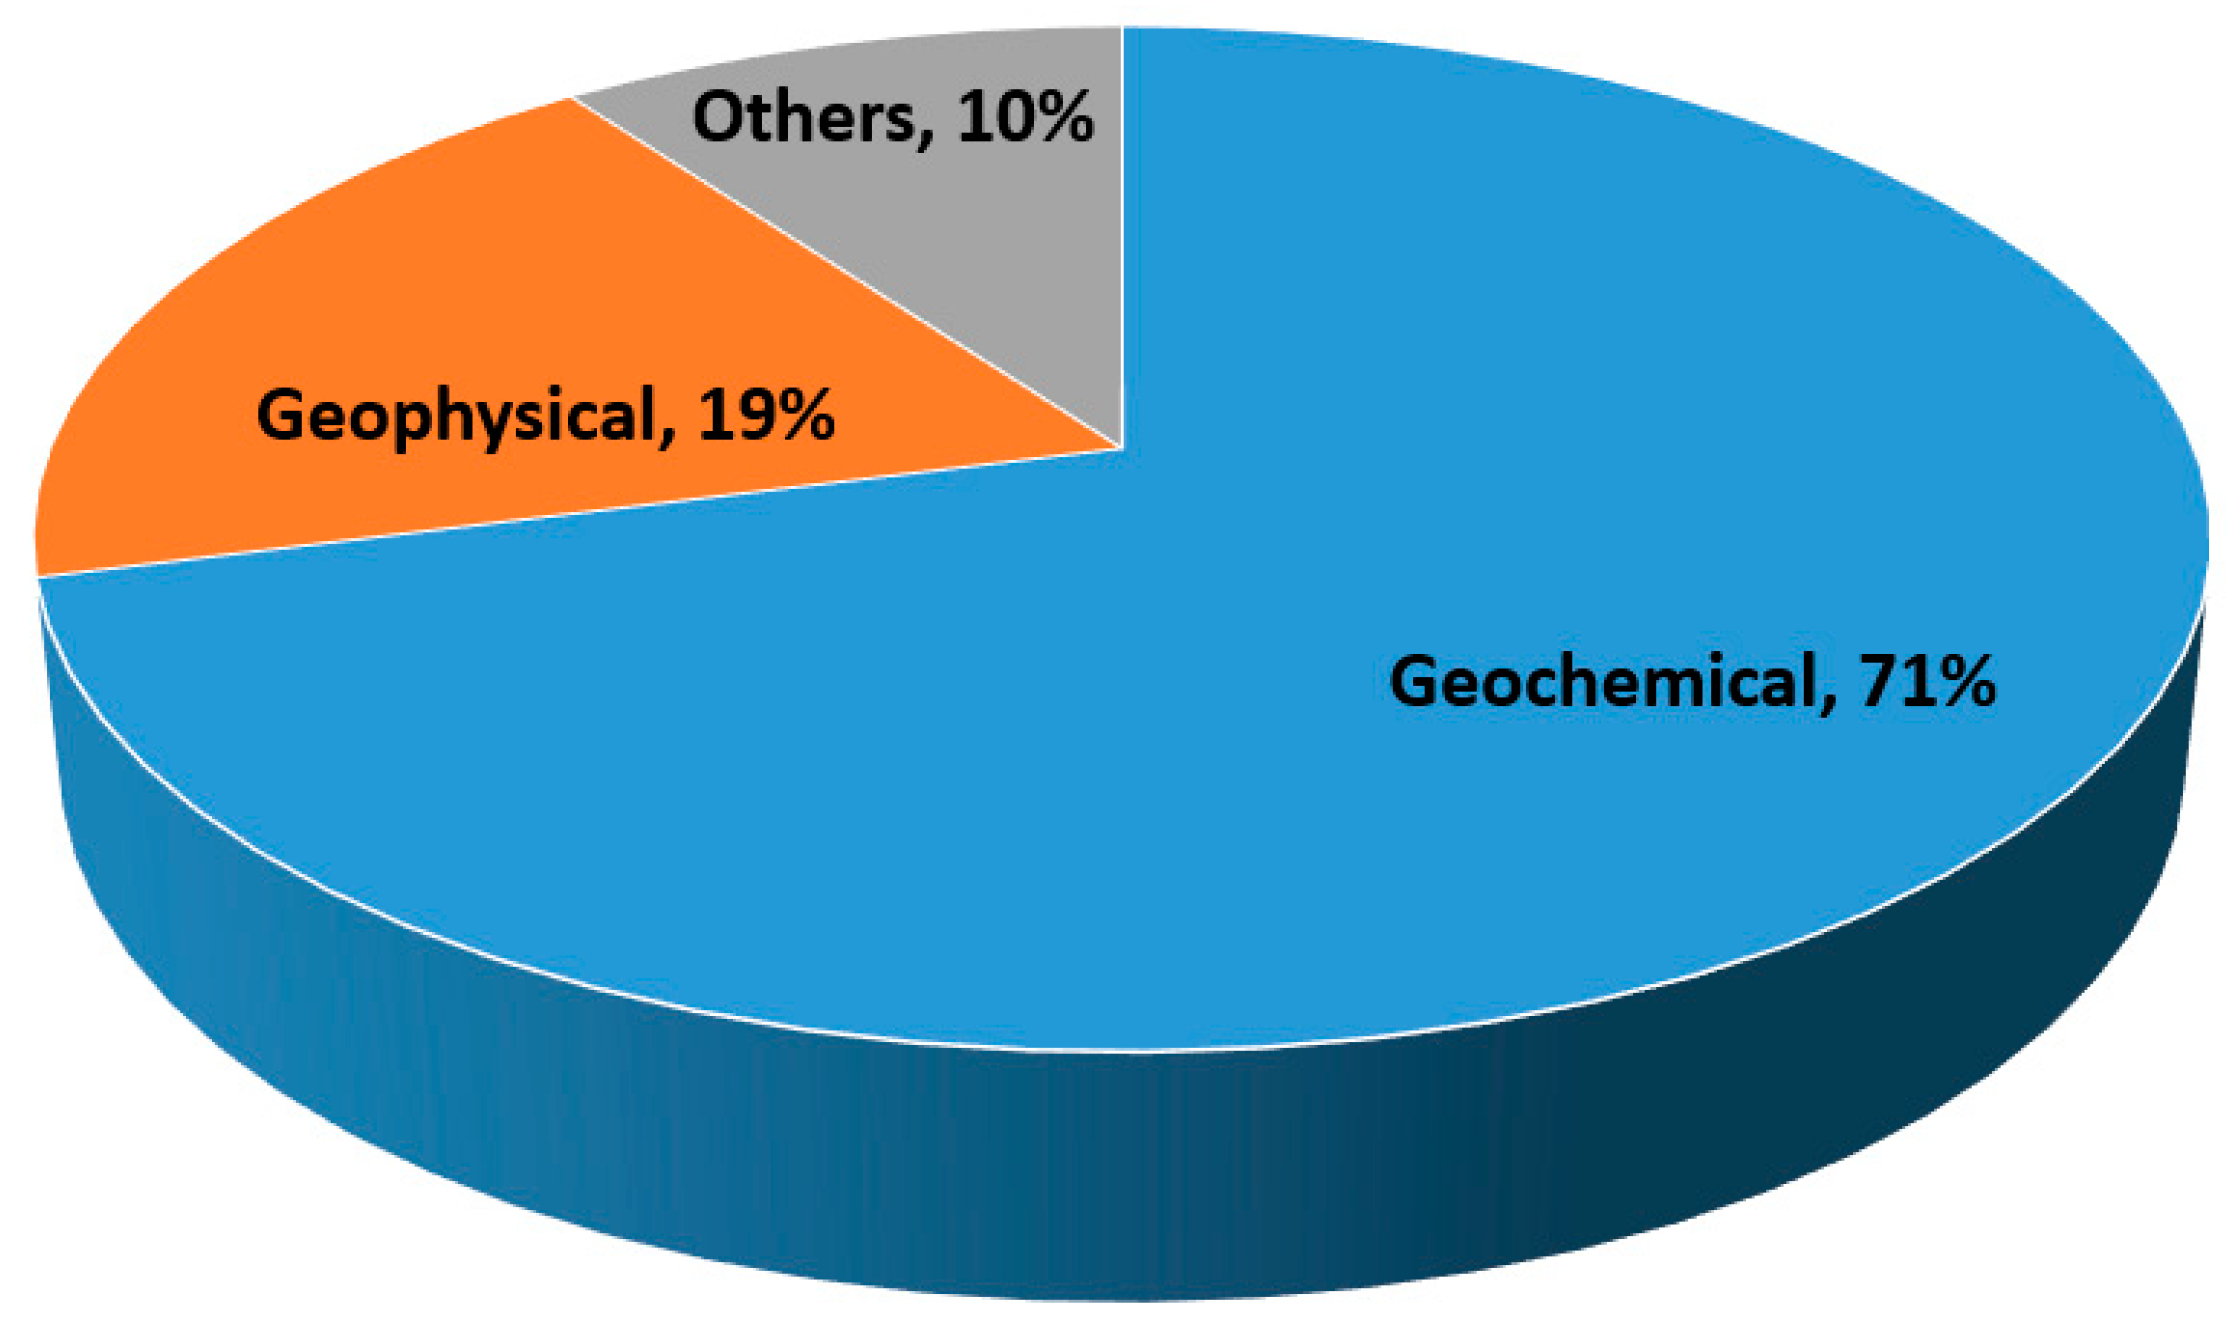
Figure 1. Geochemical methods have played an important role in the discoveries of 817 new mineral deposits in China during the period 1981–2000, modified from [7].
Minerals 12 00394 g001
Figure 2. A portable UV–Vis–NIR (250–2500 nm range) spectroradiometer for field geology, reproduced from [41], Copyright 2022 Portable Spectrosopy.
Minerals 12 00394 g002
Figure 3. VNIR-SWIR spectra of muscovite/white mica spectrum, reproduced from [43], Copyright 2022 Elsevier.
Minerals 12 00394 g003
Figure 4. (a) Portable FTIR spectrometer, (b) a schematic diagram of a portable spectrometer, modified from [51].
Minerals 12 00394 g004
Figure 5. Schematic diagram showing the configuration of a typical handheld XRF analyzer with a commercial unit in the inset, modified from [70].
Minerals 12 00394 g005
Figure 6. Portable XRF spectra of serpentinite and metabasaltic rocks, reproduced from [71].
Minerals 12 00394 g006
Figure 7. (a) Schematic diagram of a handheld back-reflection EDXRD technique, (b) photograph of the handheld back-reflection EDXRD system, reproduced from [82].
Minerals 12 00394 g007
Figure 8. XRD pattern of lithium mineral, petalite (95% quartz and 5% petalite) [83].
Minerals 12 00394 g008
Figure 12. Schematic diagram of a typical handheld Raman spectrometer system, modified from [113].
Minerals 12 00394 g012
Figure 13. Raman spectra of some common heavy minerals of different origin, reproduced with permission from [114].
Minerals 12 00394 g013
Figure 14. Schematic diagram depicting the working principle and a photo of commercial LED fluorimeter, modified from [117].
Minerals 12 00394 g014
Figure 15. Typical LIBS spectra of a manganese nodule sample from deep sea in Jiaozhou Bay, China [138].
Minerals 12 00394 g015
Figure 16. Good correlation between field data (pXRF) and laboratory data (ICP-MS) on the same sample splits for different trace elements, modified from (a) [145] and (b) [49].
Minerals 12 00394 g016
Table 1. Different types of deposits, pathfinding minerals, and elements.
Deposits of InterestType of DepositMain Pathfinder MineralsMain Pathfinder ElementsReference
Gold Pyrite, chalco-pyrite, arsenopyrite, bismuthinite magnetite, tellurides, tetrahedrite, pyrite, sphalerite, muscovite, monazite, bastnäsite, quartz, scheelite, wolframite, cassiterite.Fe, Mn, Cu, Co, Ni, Sb, Zn, As, Bi, Te, Sn, Se, Tl, Ag, Hg, Pb, Mo and W.[12,13,14]
REECarbonatite rocksBastnäsite group, ancylite,
monazite, (fluor)apatite,
pyrochlore, xenotime, florencite.
Na, Mg, Fe, P, Ba, F, S, Sr, Ca, Nb, Th, U, Zr, Cu, Ta, Ti, V, Mn, Pb.[15]
Igneous rocks (including hydrothermal upgrade)Bastnäsite group, aegirine, eudialyte, loparite, allanite, monazite, fergusonite, zircon, xenotime, fluorapatite, ancylite, gadolinite, euxenite, mosandrite.Na, K, Fe, Al, Zr, Ti, Nb, Ta, Li, F, Cl, Si, Th, U, P, Cs, Rb, Sn, W, Mo, Be, Ga, Hf, Mn, B.
Placers and palaeoplacersMonazite, xenotime,
allanite, euxenite.
Ti, Nb, Zr, Au, Sn, Th, U, Pb, F.
LateritesMonazite, apatite,
pyrochlore, crandallite
group, bastnäsite group, churchite, rhabdophane,
plumbogummite, zircon,
florencite, xenotime,
cerianite.
Fe, Al, Nb, Zr, Ti, Sn, Mn, P, low Si, negative Ce anomaly.
Ion-adsorptionClay minerals (mainly
kaolinite and halloysite).
High Si (>75%), low P.
Iron oxide-associated (including IOCG) depositsBastnäsite, synchysite,
monazite, xenotime,
florencite, britholite.
Fe, Cu, U, Au, Ag, Ba, F, P, S.
Seafloor deposits, such as manganese nodules, ferromanganese crust, phosphorite.Vernadite, todorokite, Fe-oxyhydroxide, carbonate fluorapatite, francolite.Mn, Fe, P, Cu, Ni, Co.
Cu-Ni-PGE pentlandite, chalcopyrite, pyrite,
millerite, PGM, chromite, Cr-diopside,
enstatite, olivine, Cr-andradite.
Ni, Cu, Pd, As, Cr, Co, S, PGE[16,17]
Volcanogenic
massive sulphide (VMS) deposits (Cu, Pb, Zn, Ag, Au)
Galena, sphalerite, chalcopyrite,
pyrrhotite, gold, pyrite, gahnite,
staurolite, cassiterite, spessartine,
sillimanite, andalusite, beudantite,
jarosite, barite, tourmaline, hogcomite,
nigerite.
Cu, Zn, Pb, Ag, Mo, Sn, Ba As, Sb, In, Te, Bi, and Tl[17,18,19]
W-Mo-Bi, and Sn-Zn-In deposits Cassiterite, wolframite, molybdenite, topaz, chalcopyrite, galena, sphalerite, arsenopyrite, pyrite, loellingite, beudantite, anglesite, plumboferrite, plumbogummite.Ag, As, Cd, Cu, Pb, Re, Te, Tl[20]
Li Spodumene, petalite, amblygonite, quartz, K-feldspar, albite, or montebrasite, lepidolite, zinnwaldite, eucryptite, cassiterite, lithiophilite, holmquisite, triphylite, quartz, muscovite, apatite, tourmaline tantalite-columbite, beryl. K, Ca, Rb, Sr, Y, Nb, Sn, Cs, Ta, Sb, W, Bi, As, Ga, Tl, and
the REE
[21,22]
Kimberlite-hosted
diamonds
-Cr-pyrope, Cr-diopside, eclogitic garnet,
Mg-ilmenite, chromite, olivine, diamond.
C[17]
U Uraninite (pitchblende), thorianite, tourmaline, sulphides, monazite, allanite, zircon, baddelyite, niccolite, U-Th anatase, U-Th rutile, brannerite, magnetite.Cu, Ag, As, Cr, Pb, Zn, Ni, Co, Re, Be, P, Mo, Mn, REE and radiogenic Pb isotopes[23,24,25]
Table 2. Limits of detection (LOD) for some important elements (in µg/g) across the periodic table by portable XRF [72].
Element.pXRF LODElementpXRF LODElementpXRF LODElementpXRF LOD
Ag<10Cr<10Pb<0.05Ti<10
As<5Cu<10Rb<5V<10
Au<10Fe<10S<200W<10
Ca<50K<50Sn<20Y<5
Cl<200Mn<10Sr<5Zn<5
Co<10Mo<5Th<5Zr<5
Table 3. A summary of all described portable instruments with their working principle, components, parameters, features, and applications.
S. NoName of the Portable InstrumentWorking
Principle
ComponentsFeaturesApplications
1Short-wavelength infrared (SWIR) spectrometerCan measure reflectance in the short wavelength infrared range of 1300–2500 nm based on the interaction between light and molecular bonds of minerals present in the sample.Czerny–Turner, Echelle and Transmission Optical Spectrographs,
NIR covers from 780 to 1400 nm, and SWIR from 1400 to 3000 nm.
Operates in absorption/transmission/reflection modes. High sensitivity over the NIR and SWIR range. Spectral analysis can identify several
minerals, most minerals can be detected up to 0.01 wt.%.
Used for
mapping both mineral assemblages and changes in mineral composition, as well as providing data to aid lithological
characterization and the development of alteration maps and help to develop three-dimensional deposit models.
2FTIRFTIR spectroscopy is a dispersed method in which measurements are performed over a broad spectrum instead of a narrow band of frequencies. The interferogram signal is transmitted through or bounces from the sample surface, where specific energy wavelengths are absorbed. The beam eventually passes through the detector and is further passed on to the processing computer for Fourier transformation of energy signals.Different components of FTIR are the IR source, interferometer, and a detector.It is a non-destructive technique for obtaining molecular information, offers high precision, accuracy, speed, enhanced sensitivity, and ease of operation.To determine the mineral species, mineral composition.
3Instruments for Radiometric surveys (Geiger–Müller counter)It detects ionizing radiation, such as alpha particles, beta particles, and gamma rays, using the ionization effect produced in a Geiger–Müller tube.A G–M counter has two main parts—a sealed tube, or chamber filled with gas, and an information display.The sensitivity of the GM tube is such that any particle capable of ionizing a single atom of the filling gas of the tube will initiate an avalanche of ionization in the tube.It can detect radioactive isotopes such as 40K, 234Th, and 238U in rocks, minerals, and soils in the course of mineral prospecting.
4XRFWhen X-ray radiation strikes the sample, the inner shell electrons of the atoms of elements within the sample with sufficient energy to cause an electron in the K and L-shells to be displaced. The atom reestablishes equilibrium by another electron dropping into the vacated electron position. This return to atomic stability emits a photon of energy that is characteristic of each element present in the sample.Comprises an X-ray excitation source, X-ray detector, and a data acquisition and analysis unit.Detection limits of 5 to 30 µg/g for most trace elements, low background noise, high temperature stability, high resolution at high count rates, and fast processing times.Used for the determination of the elemental composition of rocks, sediments, and other geological materials.
5XRDThe diffraction patterns result from constructive interference between X-rays scattered by successive parallel atomic planes of the crystal structure.Portable XRD houses a 2.7 W Rh anode transmission X-ray tube source and a 10 mm2 silicon drift detector (SDD).The limit of detection in XRD is in the 1–5% range, which depends on the sample matrix.XRD can perform qualitative and quantitative identification of minerals in rocks, soils, and other geological materials.
6LIBSWhen an intense and highly focused laser pulse interacts with a sample (solids, liquids, and even gases), a small plume of plasma consisting of electronically excited atoms and ions is created. As these atoms and ions decay back into their ground states, they emit characteristic wavelengths of light, which are isolated and detected.A unit to generate a pulsed laser (typically an Nd-YAG 1064 nm laser) with a focusing system to vaporize a small portion of the sample, a spectrometer to capture the emitted light and isolate the light of the desired wavelength, and a detector. No need for sample preparation, can detect all elements present in any type of sample using a single laser shot.Determination of major, minor, and trace elements in rocks and other geological samples for pure and applied geochemical studies, ability to determine provenance
using multivariate analysis, also can be used as a screening tool for selecting important samples for more precise analysis in a laboratory.
7Raman SpectrometerWhen light energy in the form of a laser interacts with molecules in a gas, liquid, or solid, which results in the energy of the laser photons being shifted up or down, the shift in energy gives information about the chemical composition of the sample.There are three primary components to any Raman spectrometer: An excitation source, a sampling apparatus, and a detector.Chemical identification,
spontaneous and stimulated, detection of minerals up to 1 µg/g concentration. This instrument was also used in the deep ocean to identify different minerals on the ocean floor.
Can provide chemical and structural fingerprint information for earth materials (solids, powders, and liquids), can deliver both chemical composition and structural information in a single measurement.
8LED fluorimeterThe uranyl ion is excited in the sample by using electromagnetic energy of suitable wavelengths and the decay is measured with the time of the uranium phosphorescence after the termination of the incident electromagnetic radiation.Light source of suitable wavelength, excitation filter,
sample holder,
dichroic beam splitter, and
emission filters.
Low cost, easy to operate, offers very low detection limit for uranium.Mostly used in water quality monitoring, potential tool for uranium exploration studies, especially by hydrogeochemical prospecting methods.
9Core scanner based on XRF technologyWorks on the principle much similar to a portable XRF.An X-ray generator, a filter to reduce background noise, optics, and a detector.Requires an XRF core scanner to be positioned accurately above the sediment surface, provides rapid high-resolution (down to 1 mm) records of chemical composition on split sediment cores.Offers fast, non-destructive closely spaced analysis of major, minor, and some trace elements in drill cores by scanning the surface of split sediment cores.
10Core scanner based on LIBS technologyThe laser-induced plasma emission is collected by achromatic lenses and the optical signal is then spectrally resolved by a spectrometer that covers 220 to 990 nm with the detection of intensity light at selected wavelengths by a
CMOS detector.
The laser source, the spectrometer, the 2-axis drill
core translation table, and the ablation chamber in a fully automated configuration.
LIBS core scanners work in the full 220–990 nm range and a camera that can read 1000 full frames per second.It can be
used for both high-resolution mineralogical imaging and low-resolution core scanning.
11Core scanner based on IR hyperspectral technologyHyperspectral imaging is a chemical imaging technique by reflectance spectroscopy to identify minerals based on their spectral response to infrared light.A tray table for carrying the core wooden tray under the field-of-view of the imaging spectrometer and a sensor to cover the IR regions of the electromagnetic spectrum. The entire setting is installed in a transportable
Container.
The mineral liberation, texture, and grain information can be provided by the scanning and mapping of drill core samples, acquires data from
hundreds of meters of core per day without any sample preparation.
It helps in mineral identification and quantification of the entire borehole from small samples, with high resolution mineralogical
information strategically selected throughout the deposit.
All these devices will have a rechargeable battery each, which will last up to 6 to 8 h of work.
Table 4. Comparison of seawater composition determined by in situ determination by LIBS probe and analysis of the samples in the vicinity by ICP-AES in a laboratory [137].
DescriptionNa (mmol/kg)K (mmol/kg)Ca (mmol/kg)Li In (µmol/kg)
In situ determination by LIBS470 ± 210.3 ± 0.29.7 ± 1.025 ± 9
In lab determined by ICP-AES45210.29.443.2
Table 5. Comparison of pXRF (in field) and laboratory XRF results for the four reference till samples [148].
Element/Sample IdentityPOS$-2012-41.10POS$-2012-70.10POS$-2012-92.10POS$-2012-102.10
pXRFLab XRFpXRFLab XRFpXRFLab XRFpXRFLab XRF
Mg %<LOD0.95<LOD1.04<LOD1.07<LOD1.02
Al %6.67.9568.016.38.046.38.08
Si %35.732.731.932.434.632.333.732.2
P %<LOD0.075<LOD0.072<LOD0.072<LOD0.075
K %2.282.182.262.182.362.252.272.18
Ca %1.481.651.481.671.431.621.521.67
Ti %0.30.3120.310.3360.320.3360.320.336
Mn (µg/g)420372432411419418453411
Fe %2.903.102.953.413.23.403.043.38
S %<LOD0.028<LOD0.026<LOD0.035<LOD0.029
Cl %<LOD0.008<LOD0.009<LOD0.011<LOD0.009
V (µg/g)7870757075757474
Cr (µg/g)7648825881578756
Ni (µg/g)16<20<LOD<20<LOD2229<20
Cu (µg/g)2630293036444030
Zn (µg/g)4153415550663866
As (µg/g)37202821332538<20
Rb (µg/g)79.69071.99783.810076.8100
Sr (µg/g)185229172236199232195238
Y (µg/g)1518112616211326
Zr (µg/g)225198198187223193219191
Mo (µg/g)<LOD<0.001<LOD<0.001<LOD<0.001<LOD<0.001
Sn (µg/g)<LOD<0.002<LOD<0.002<LOD<0.002<LOD<0.002
Sb (µg/g)<LOD<0.01<LOD<0.01<LOD<0.01<LOD<0.01
Pb (µg/g)10<20102413218<20
Bi (µg/g)<LOD<3030<30<LOD<30<LOD<30
Th (µg/g)<LOD0.001<LOD0.001<LOD<0.001<LOD0.001
U(µg/g)<LOD<0.001<LOD<0.001<LOD<0.001<LOD<0.001
Publisher’s Note: MDPI stays neutral with regard to jurisdictional claims in published maps and institutional affiliations.