
Identification and Evolution of Different Genetic Types of Deep Karst Caves Controlled by Faults—A Case Study in Huanjiang Sag, Guangxi Province, South China

 ,
,
Abstract
:1. Introduction
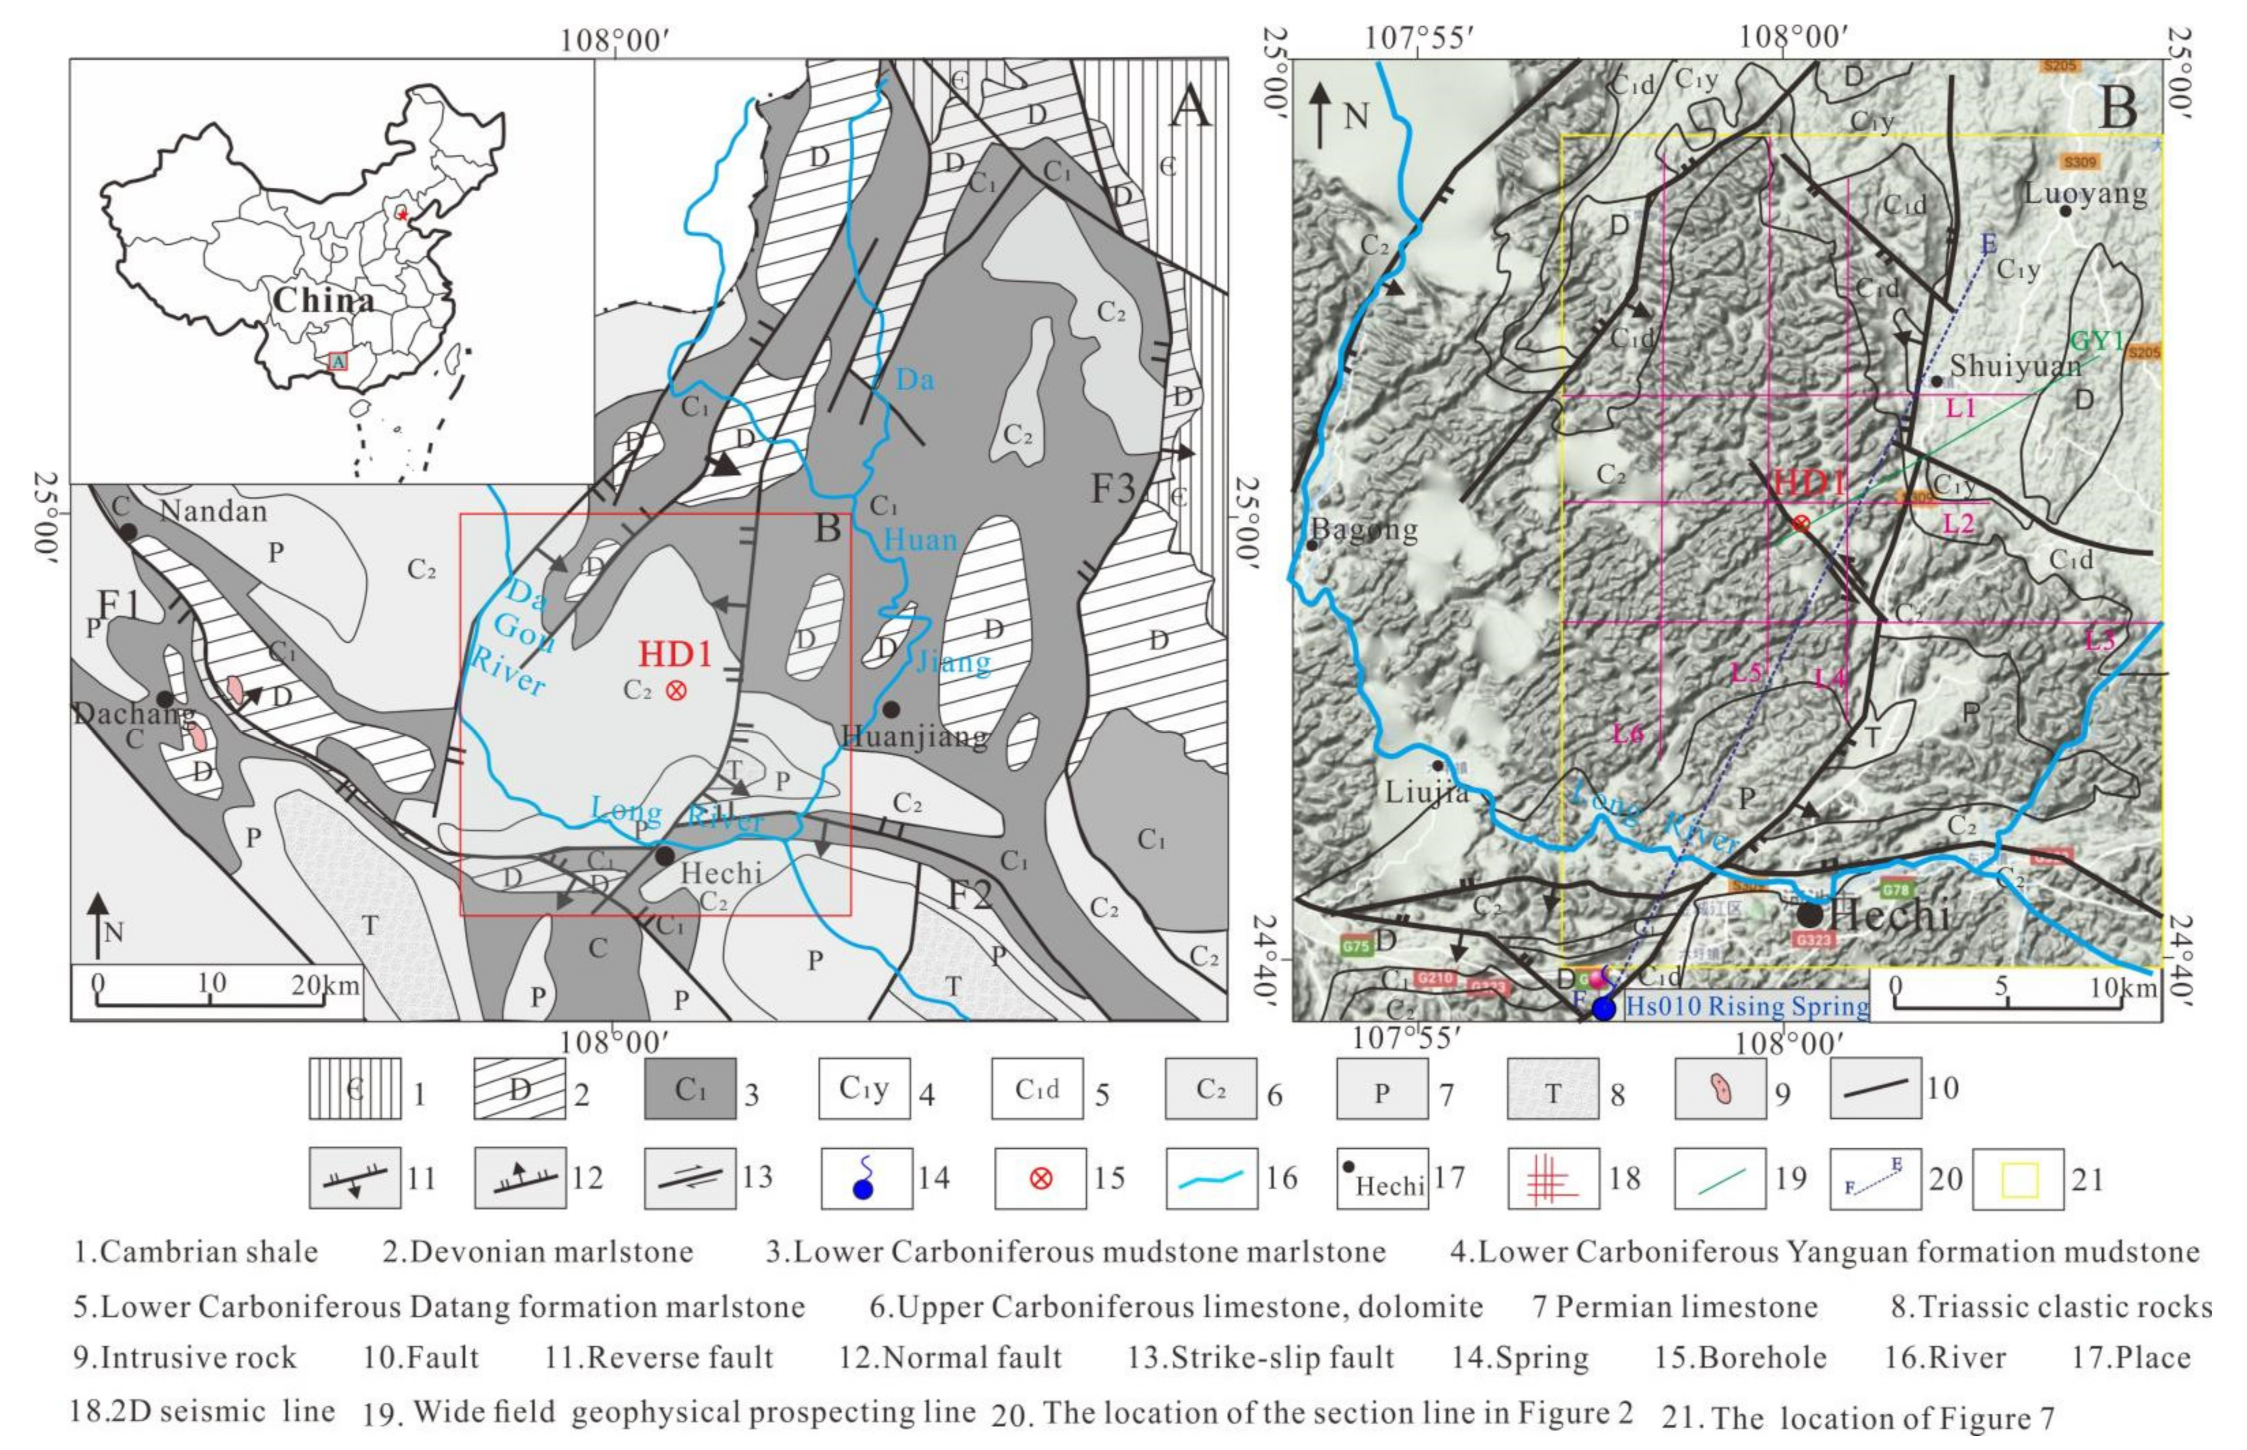
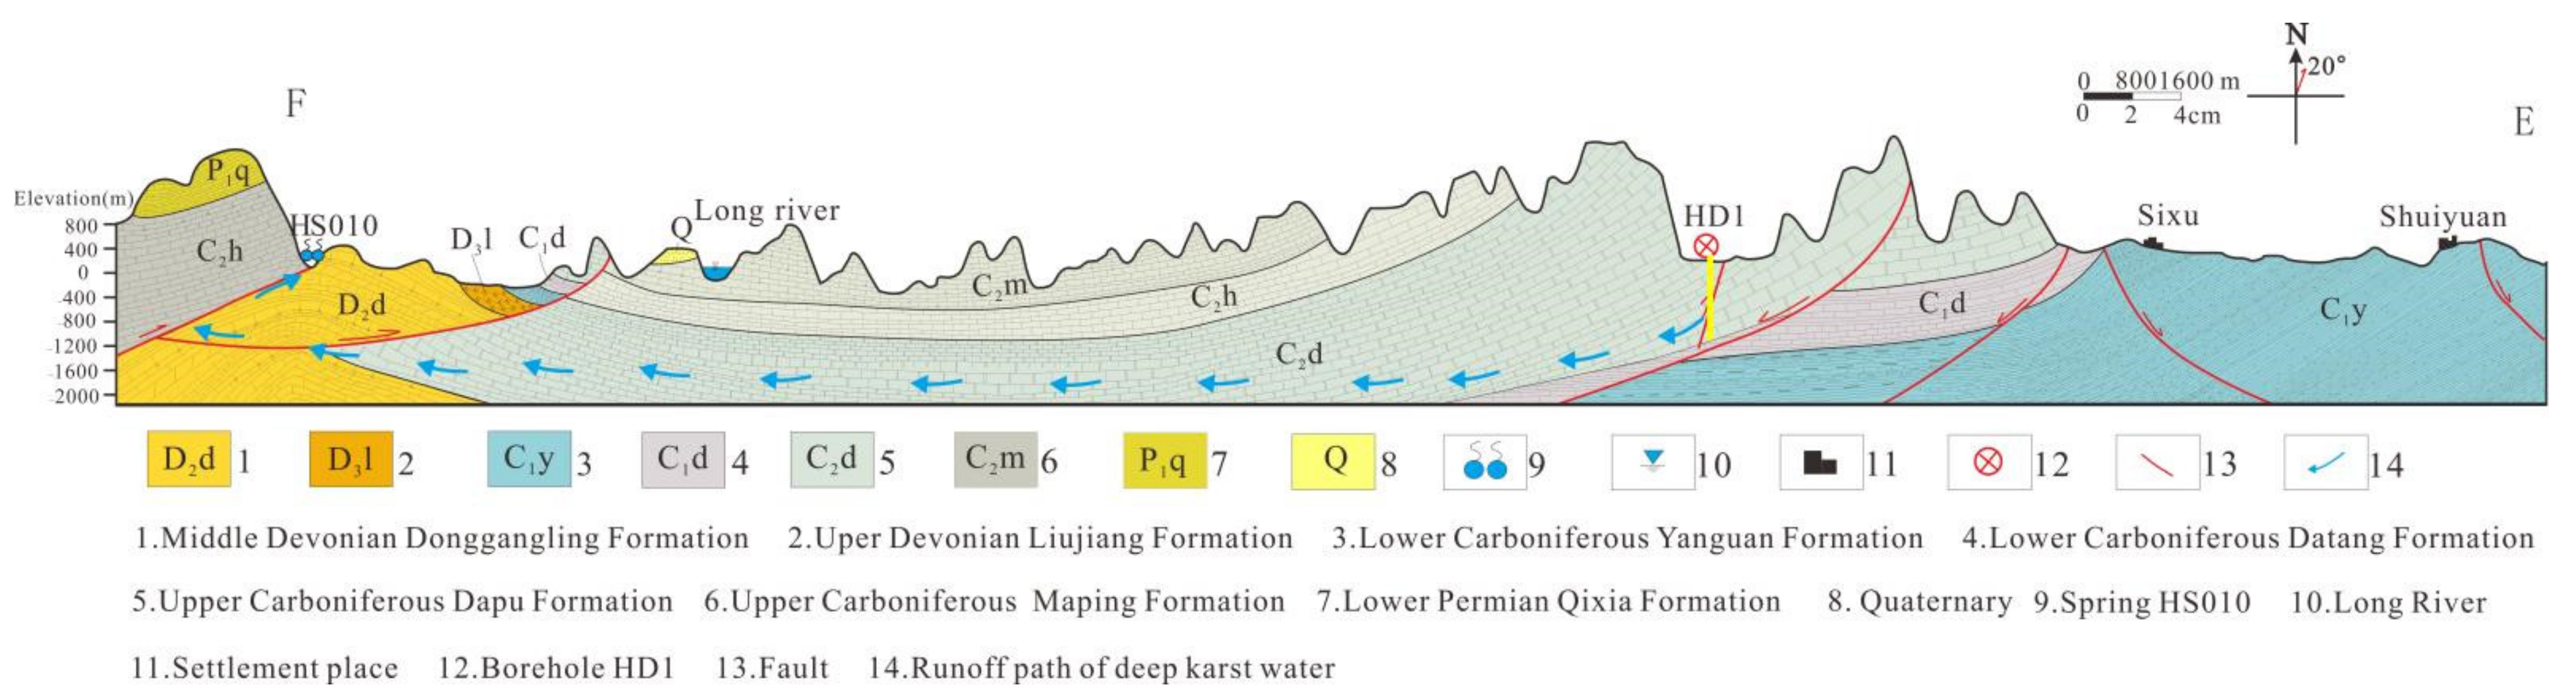
2. Geologic Setting
3. Methods and Test
3.1. Karst Morphological Analysis Method for Deep Karst
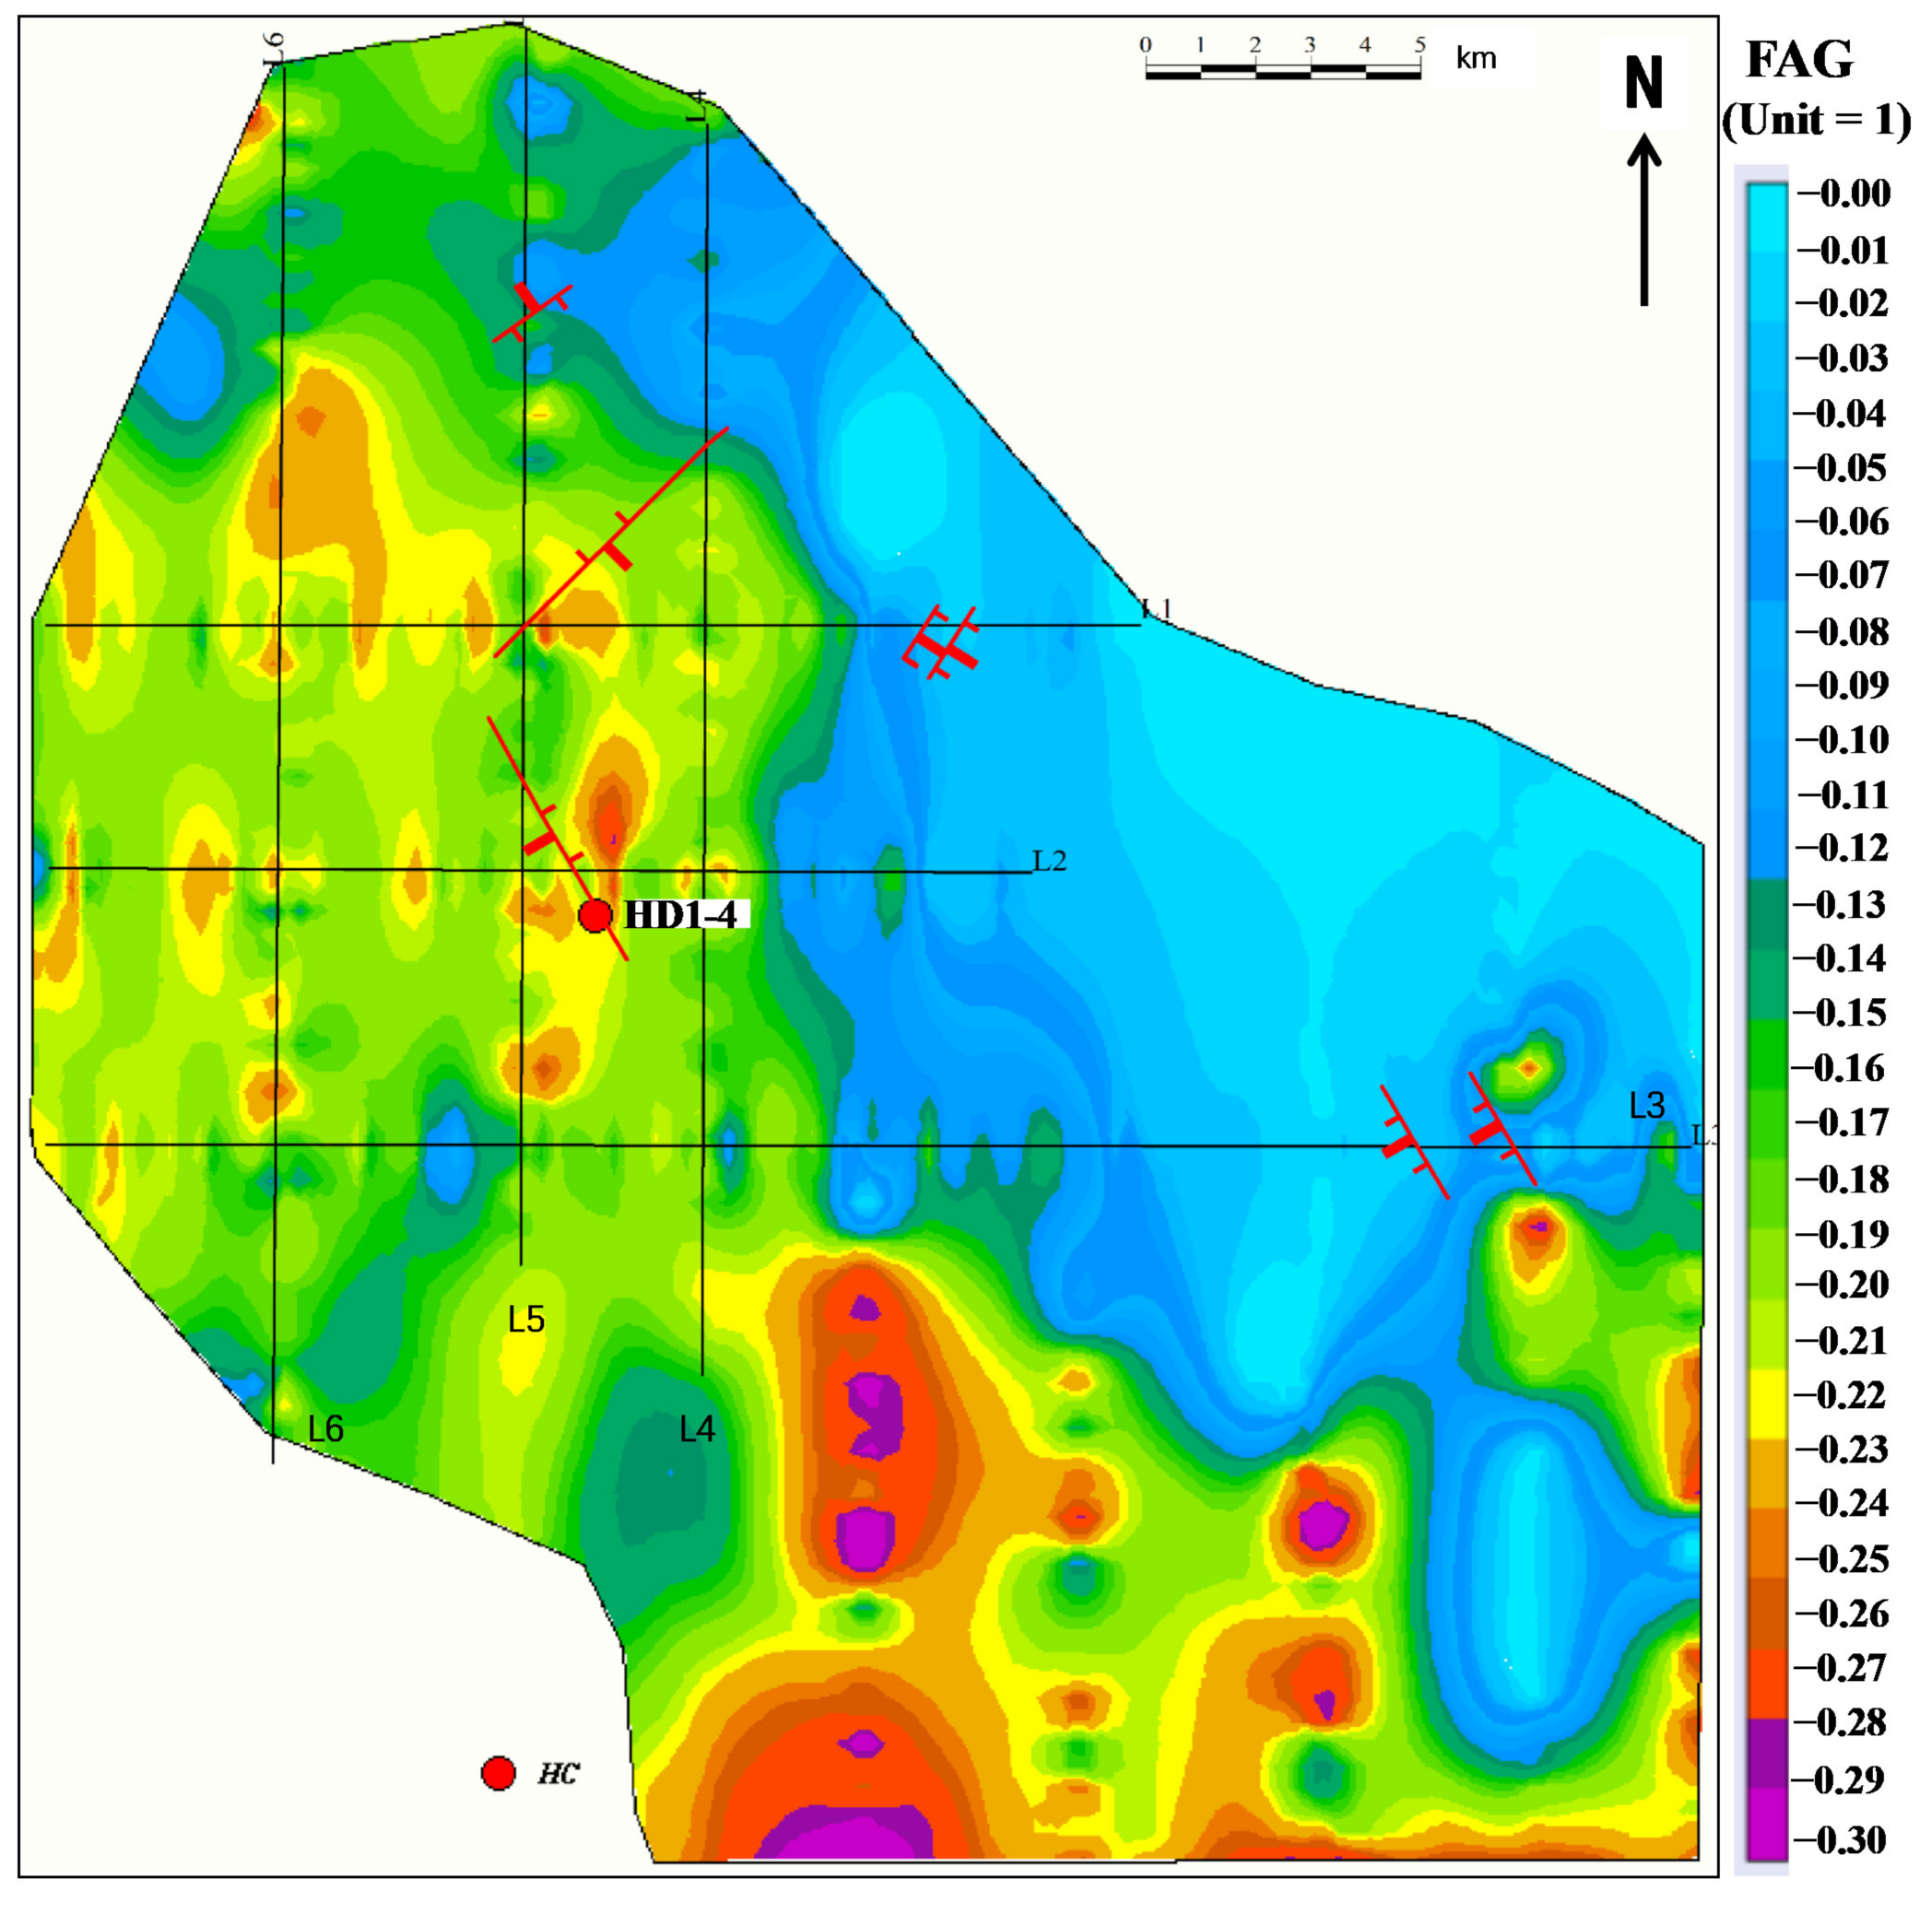
3.2. Geophysical Exploration and Identification Method
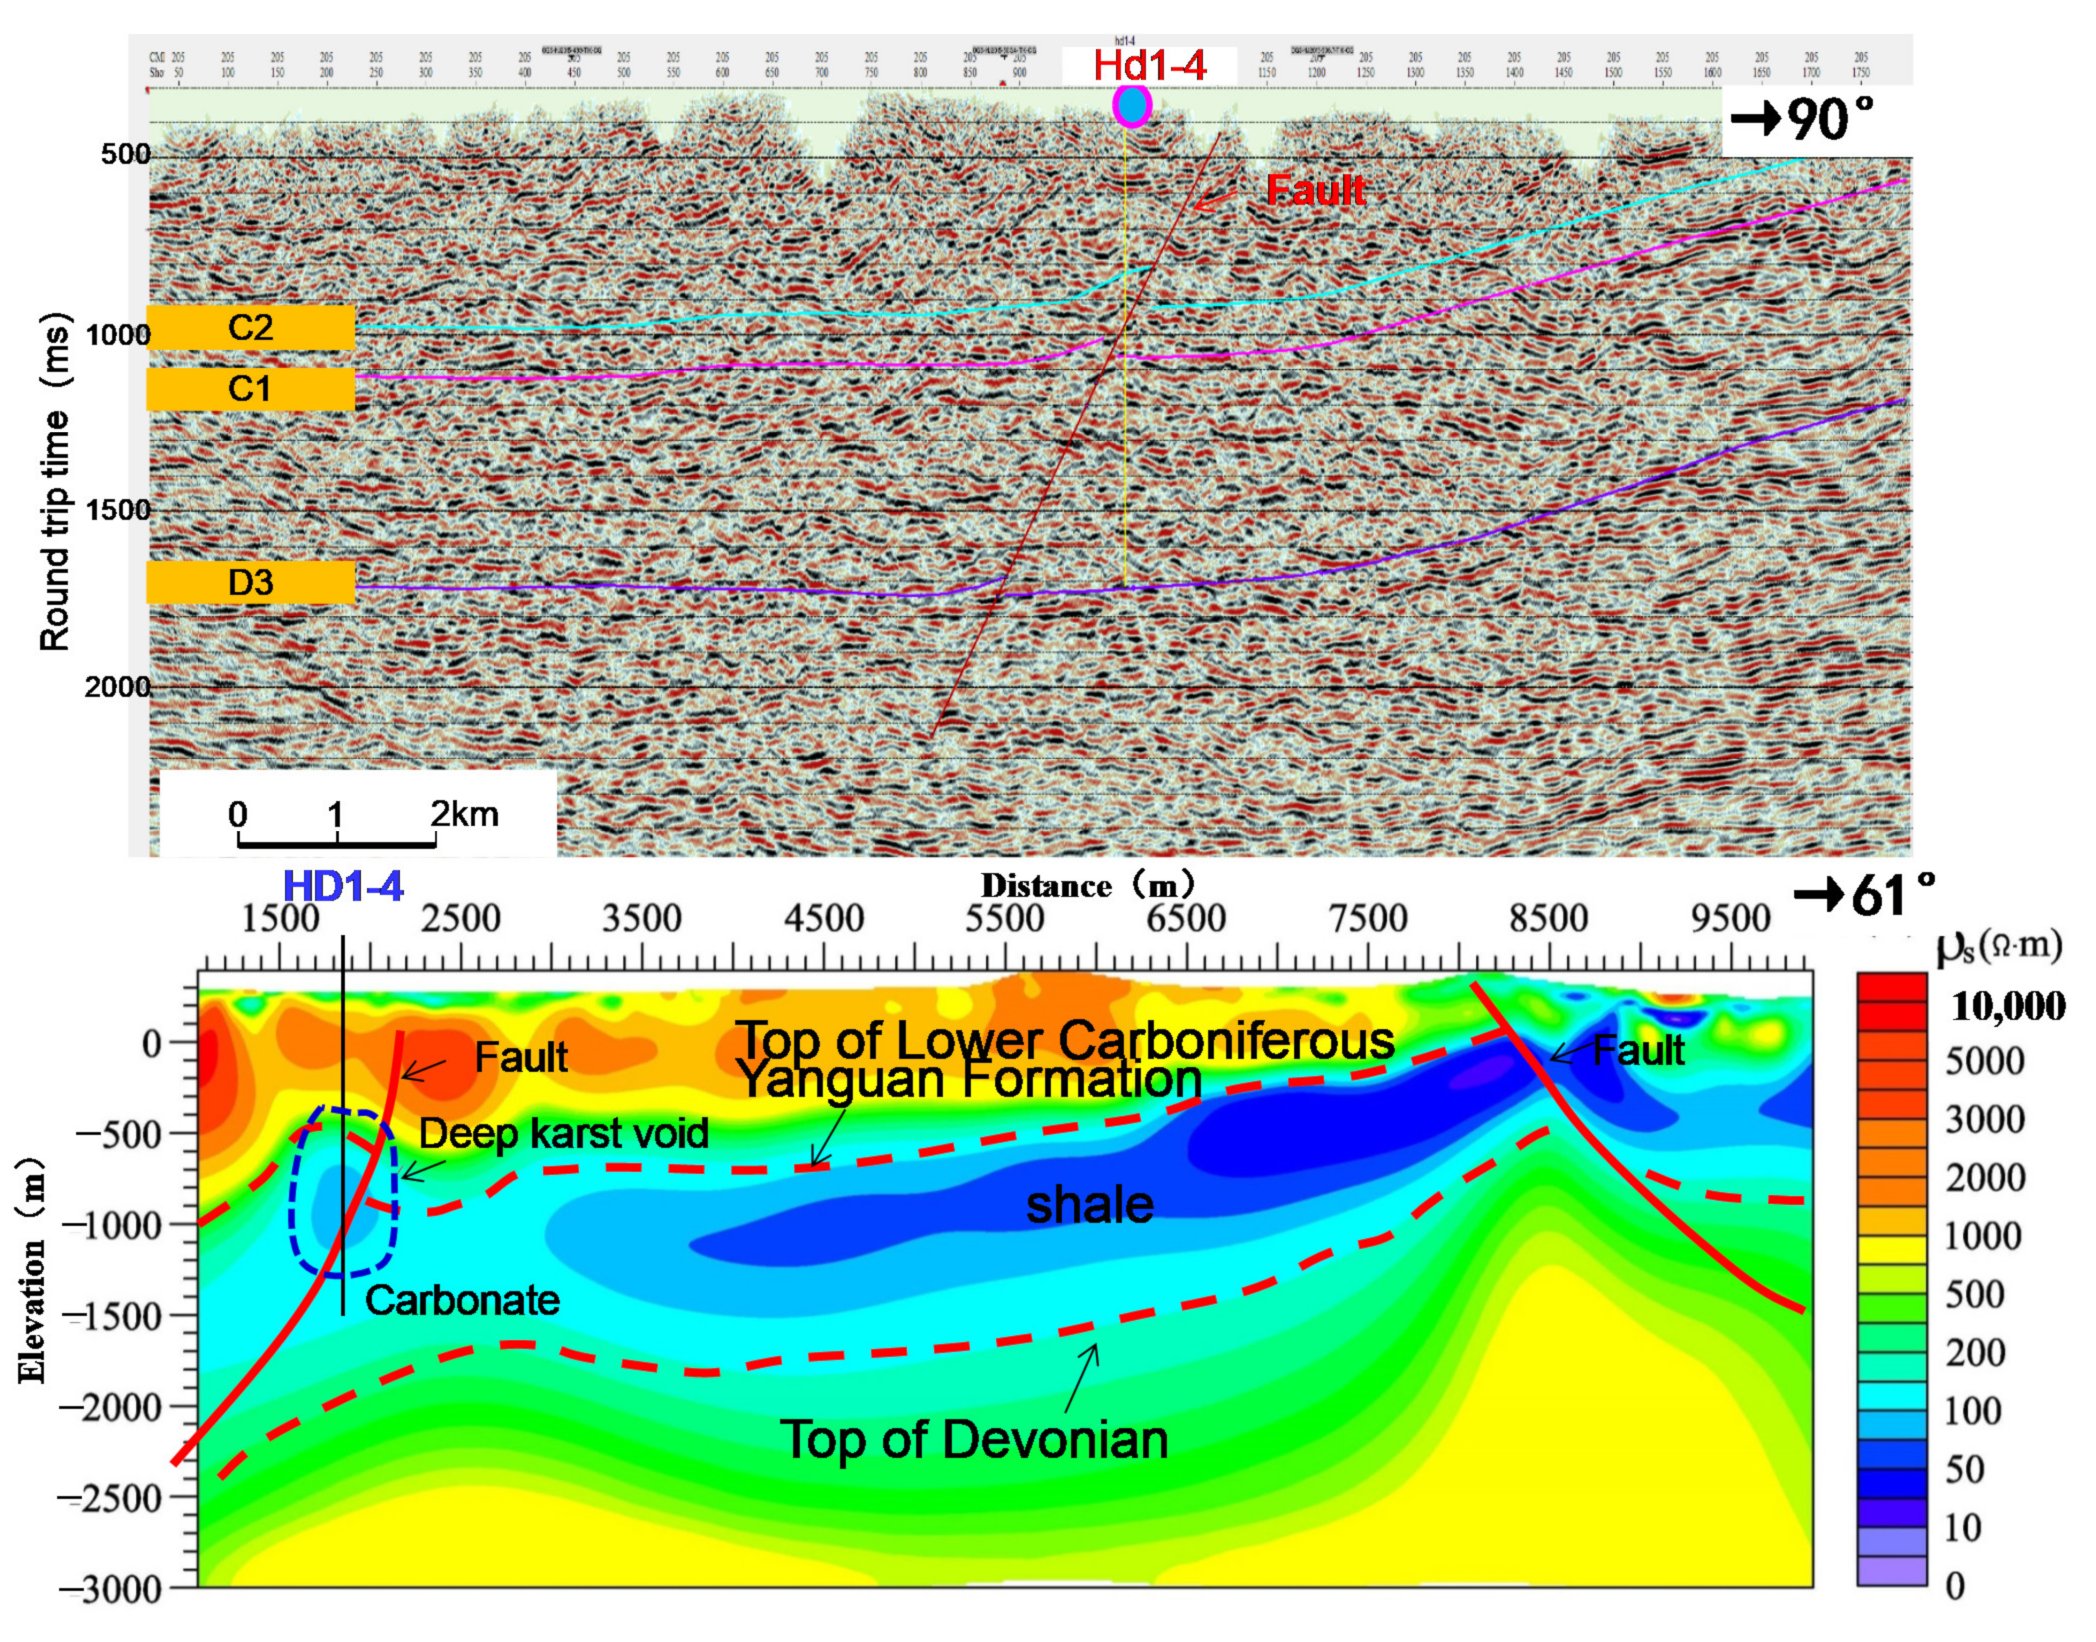
3.2.1. Two-Dimensional Seismic Interpretation and Analysis Method
3.2.2. Wide-Field Electromagnetic Method
3.3. Geochemical Analysis Method of Karst Fillings
3.3.1. Determination Method of Deep Karst Cave Filling Period
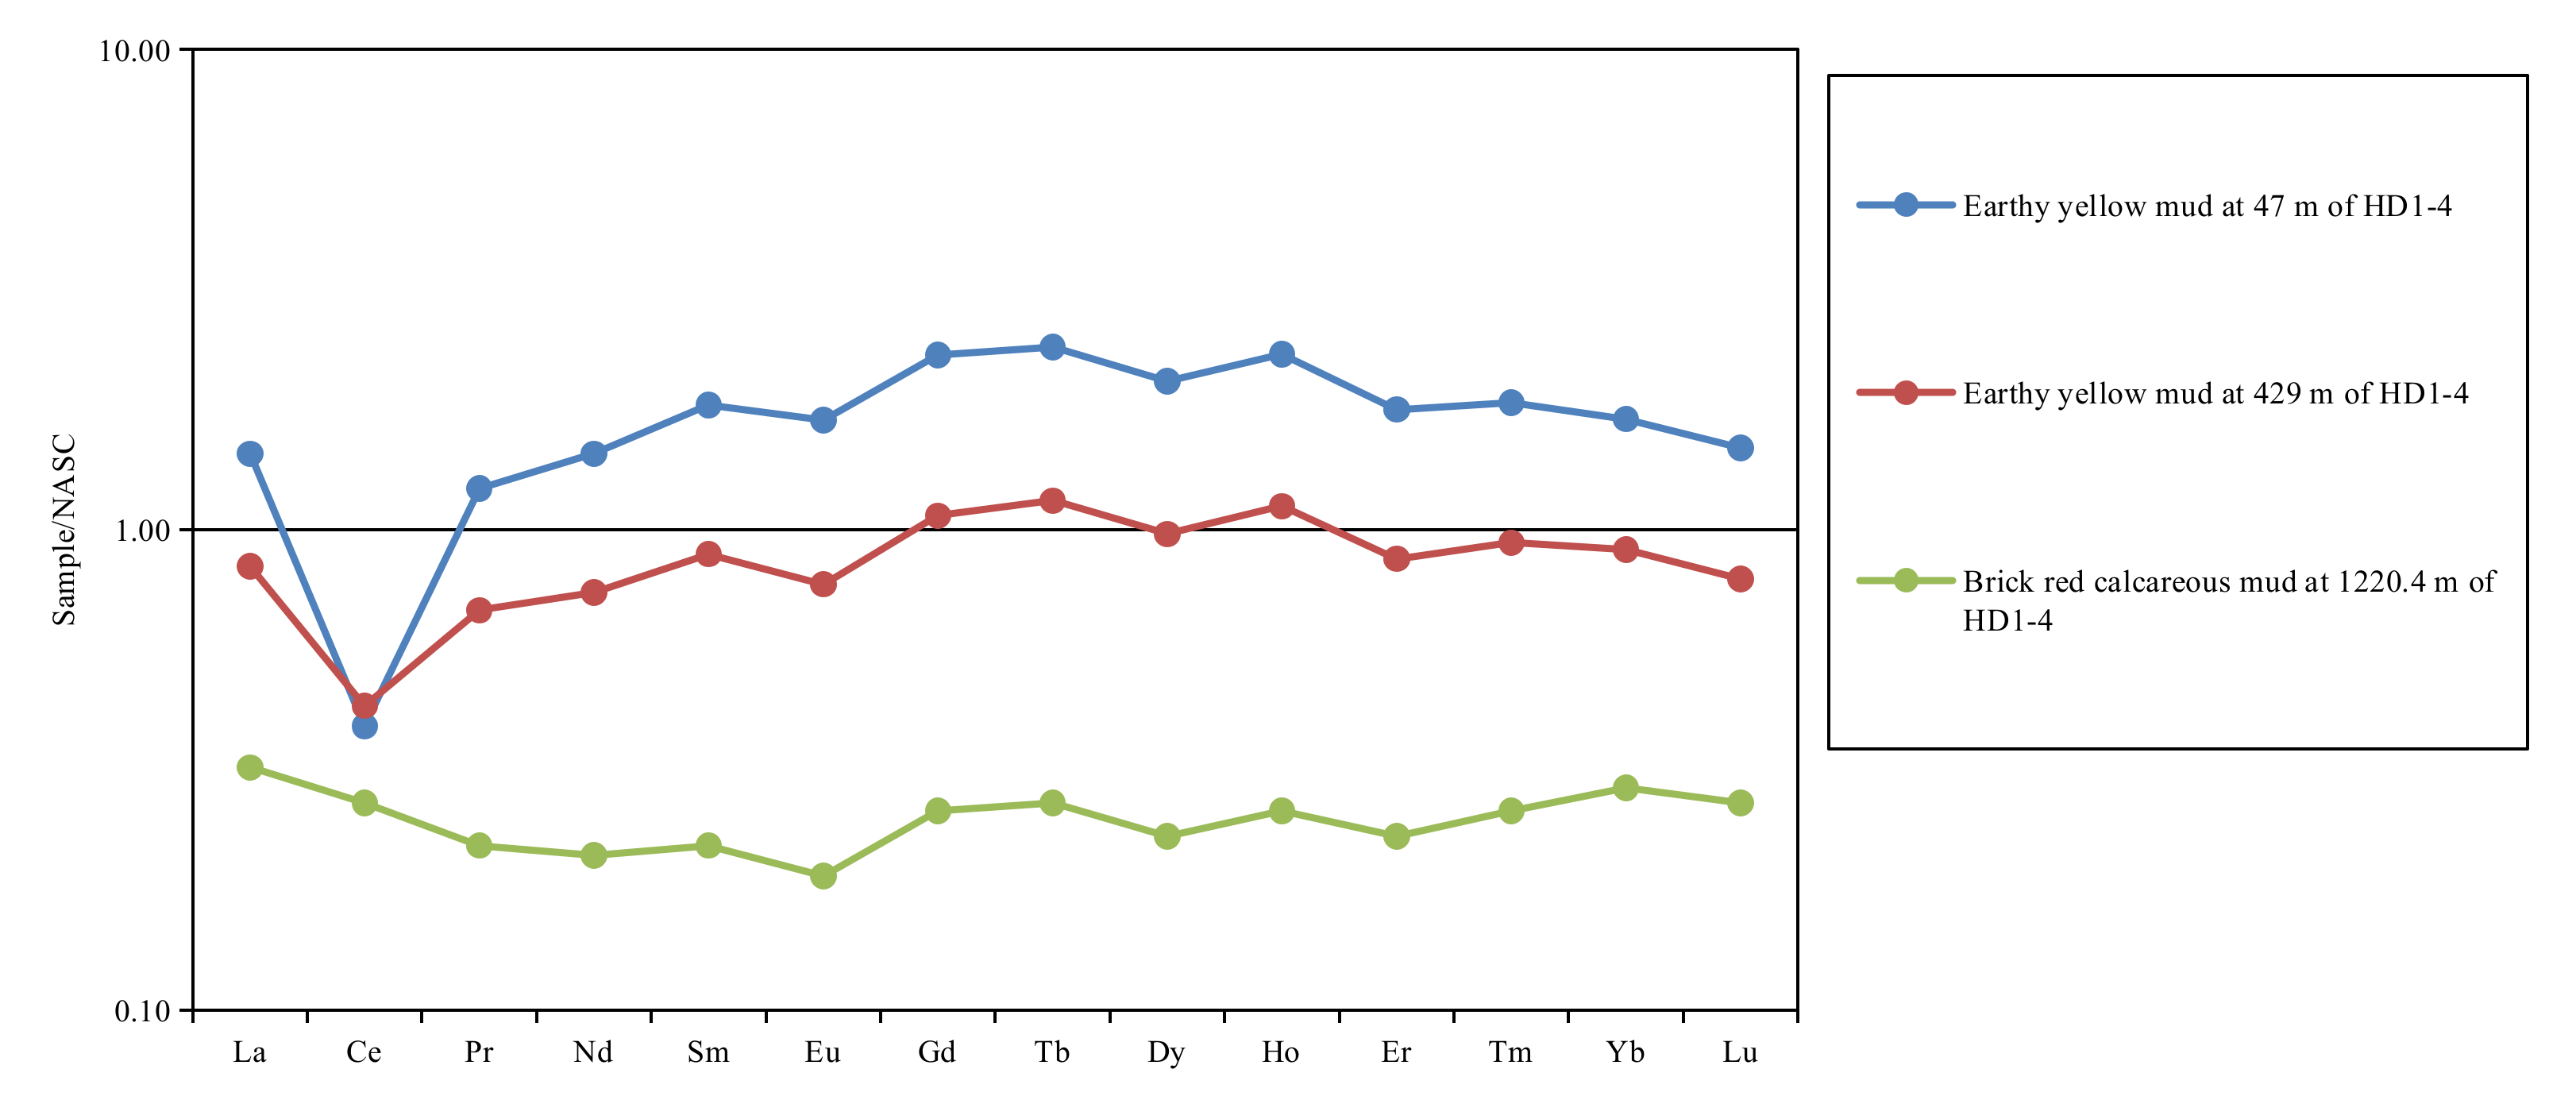
3.3.2. Analysis of Rare Earth Elements in Mud Filling of Karst Cave
3.3.3. Fluid Inclusion Analysis of Cave Calcite and Dolomite
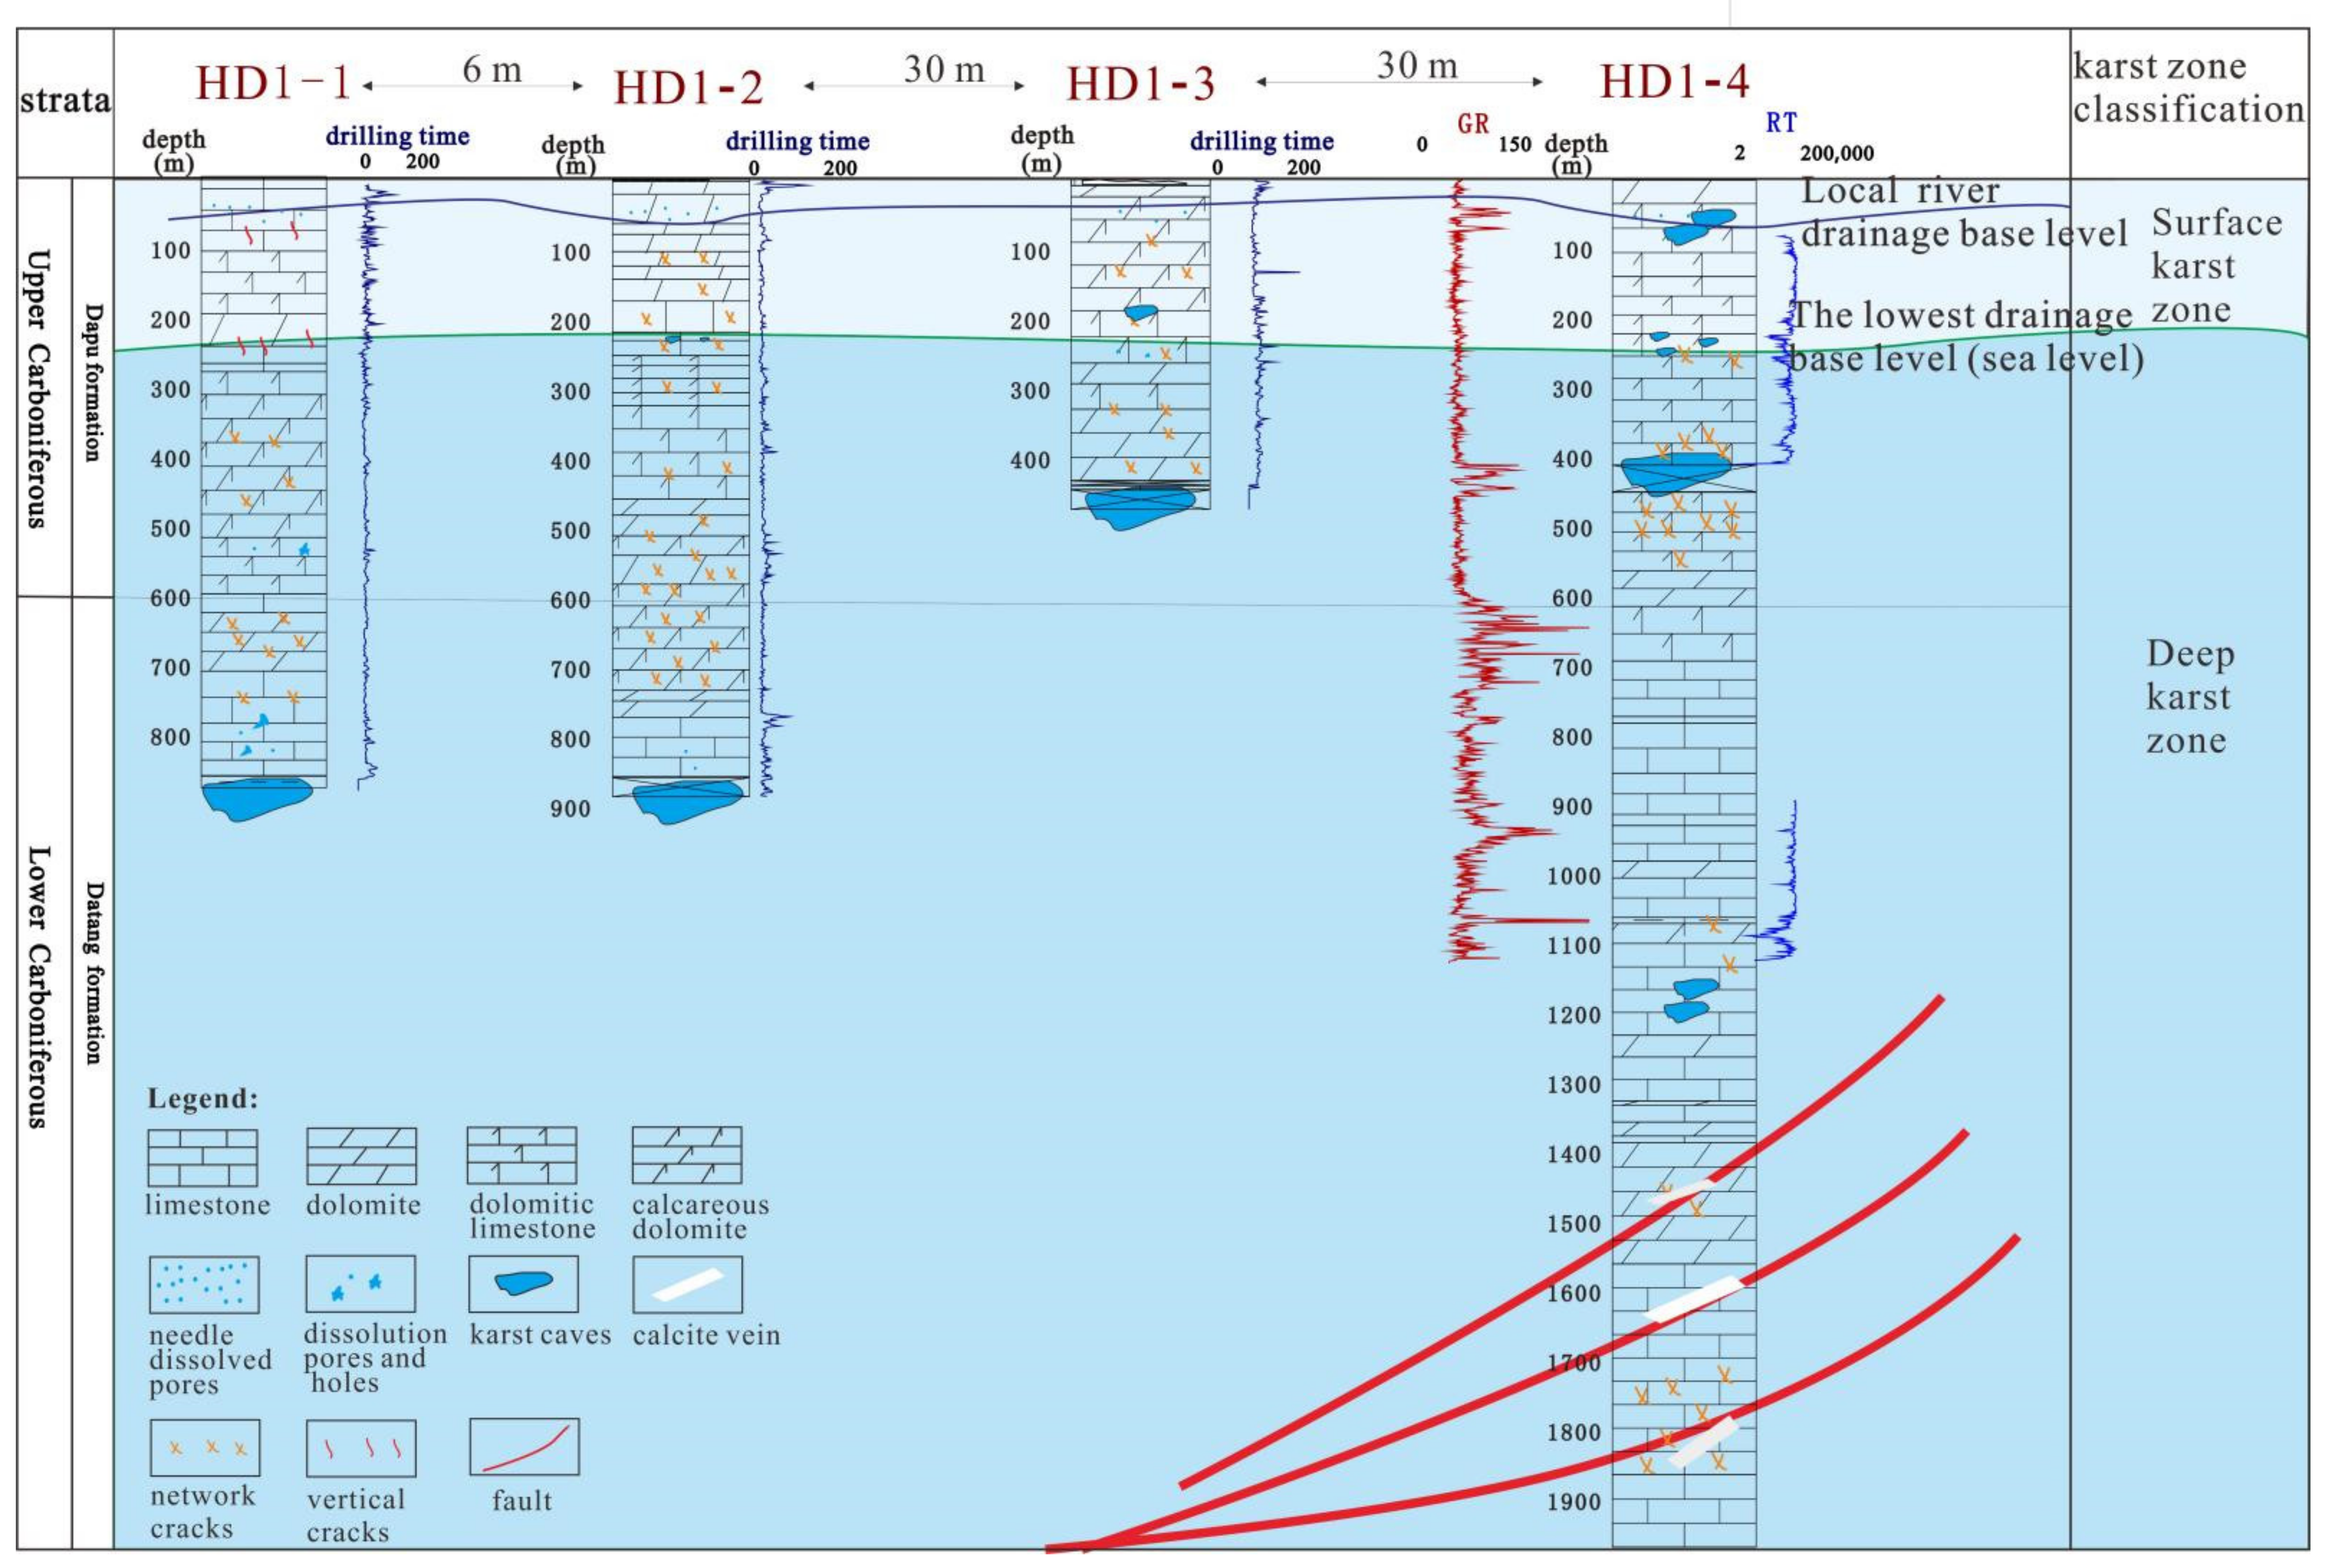
4. Identification Results of Deep Karst Morphology in the Well
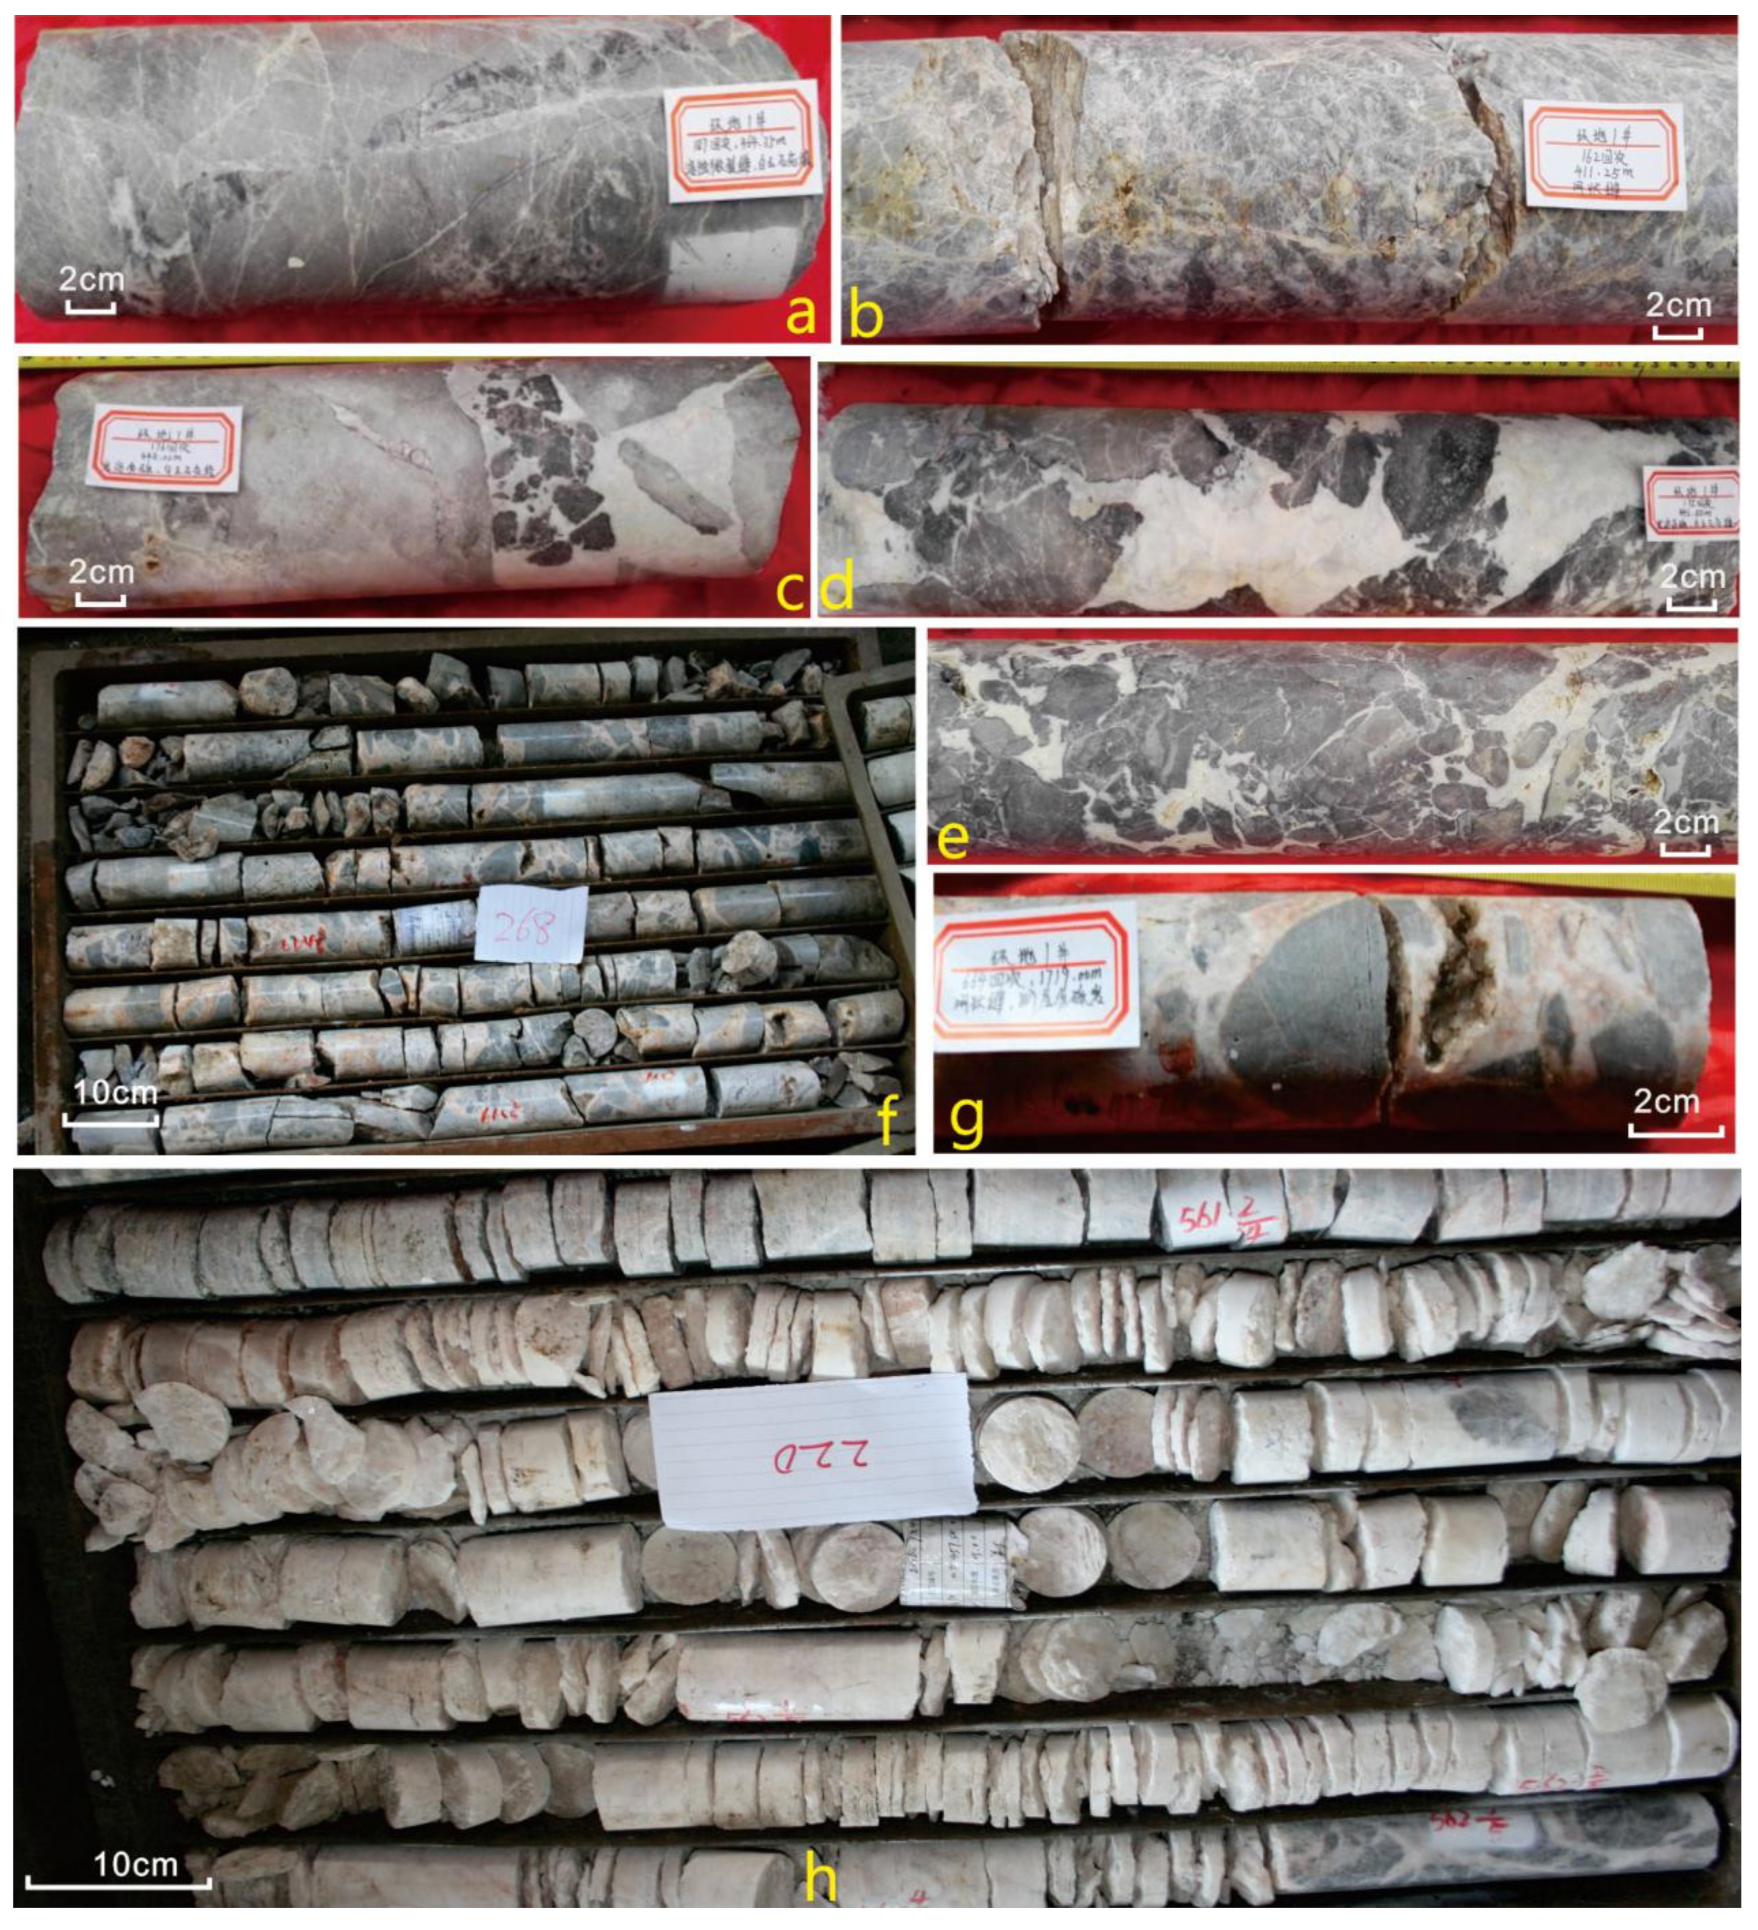
4.1. Dissolution Pores and Cavities Space Morphology
4.2. Dissolution Morphology Related to Structural Fractures
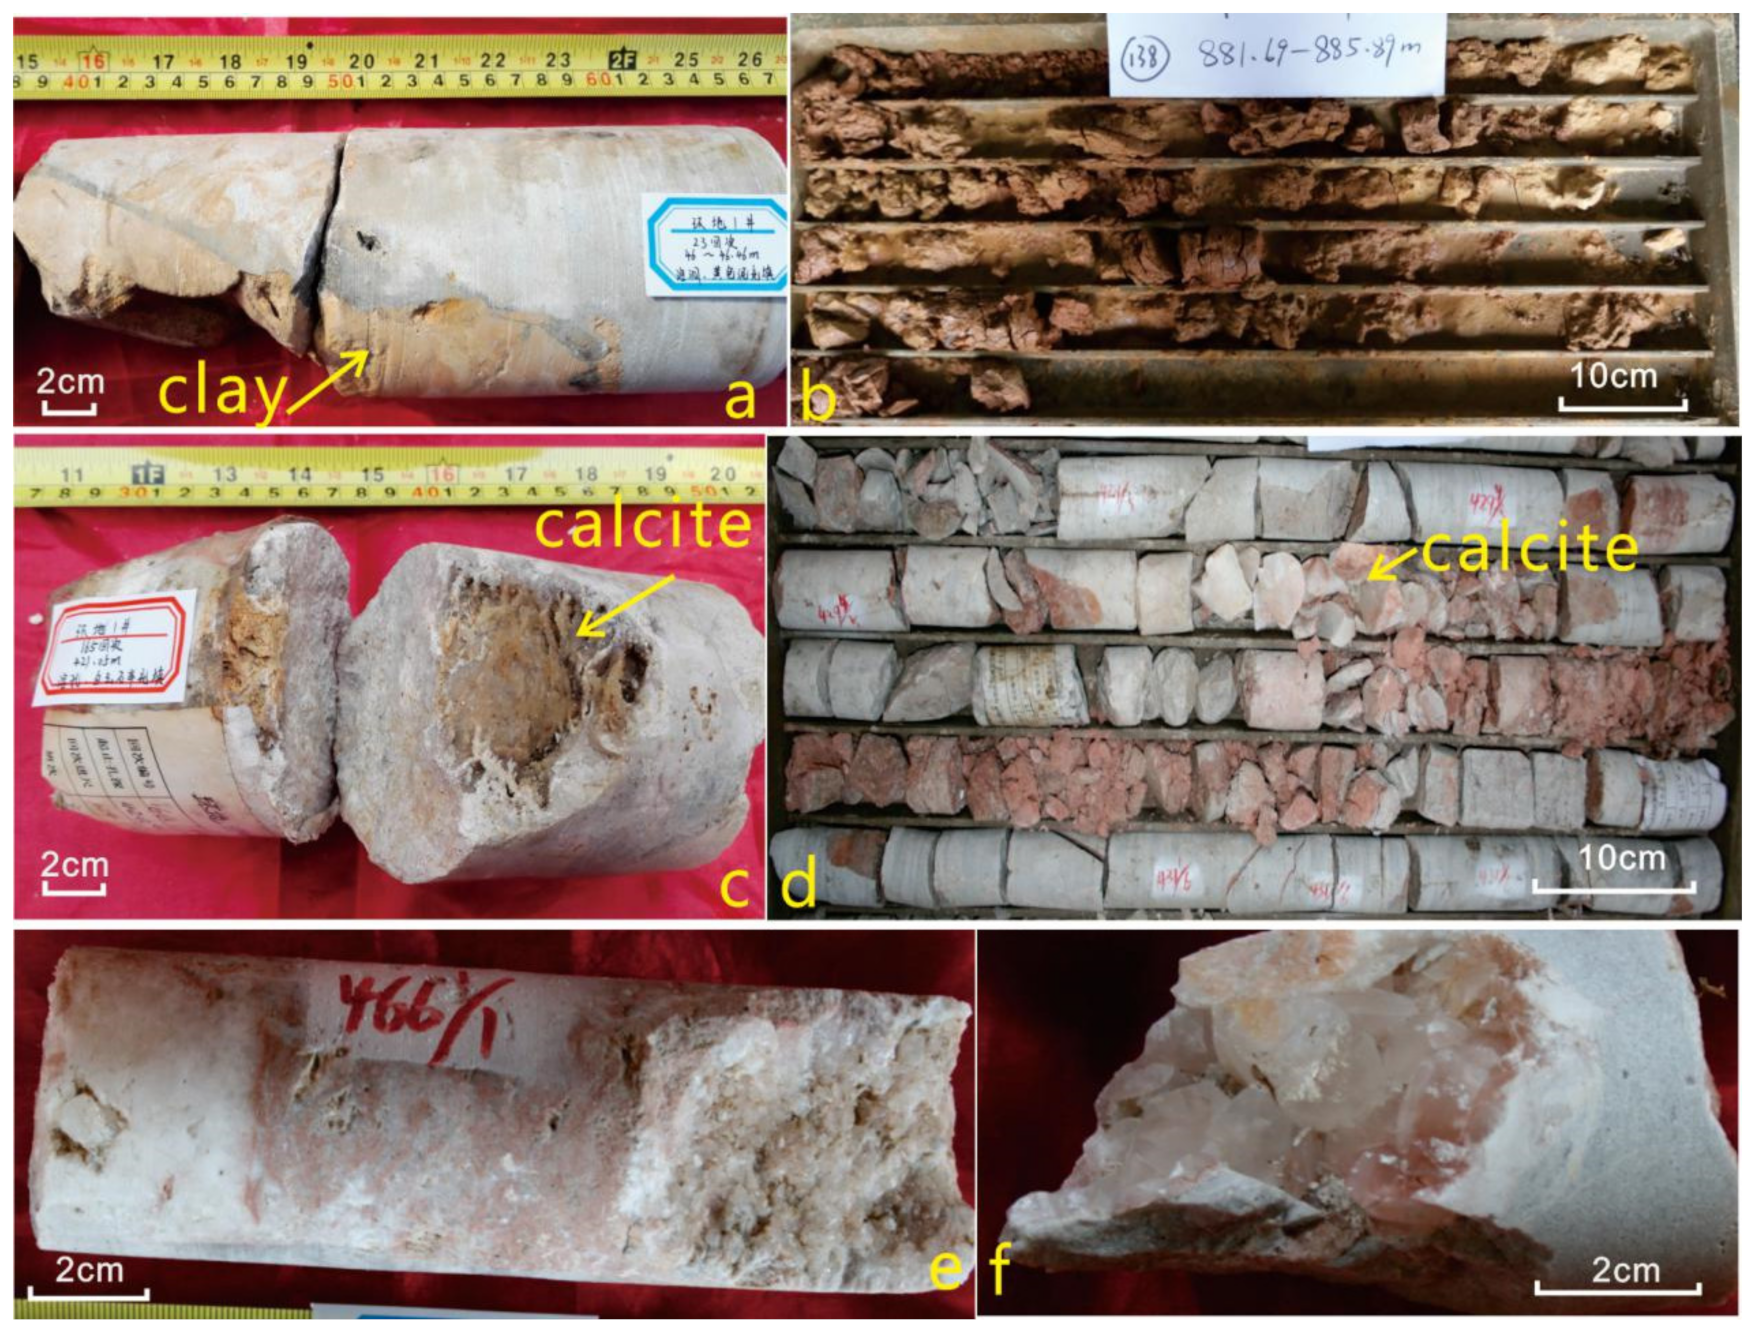
4.3. Filling Morphology in Dissolution Space
5. Spatial Distribution of Deep Karst
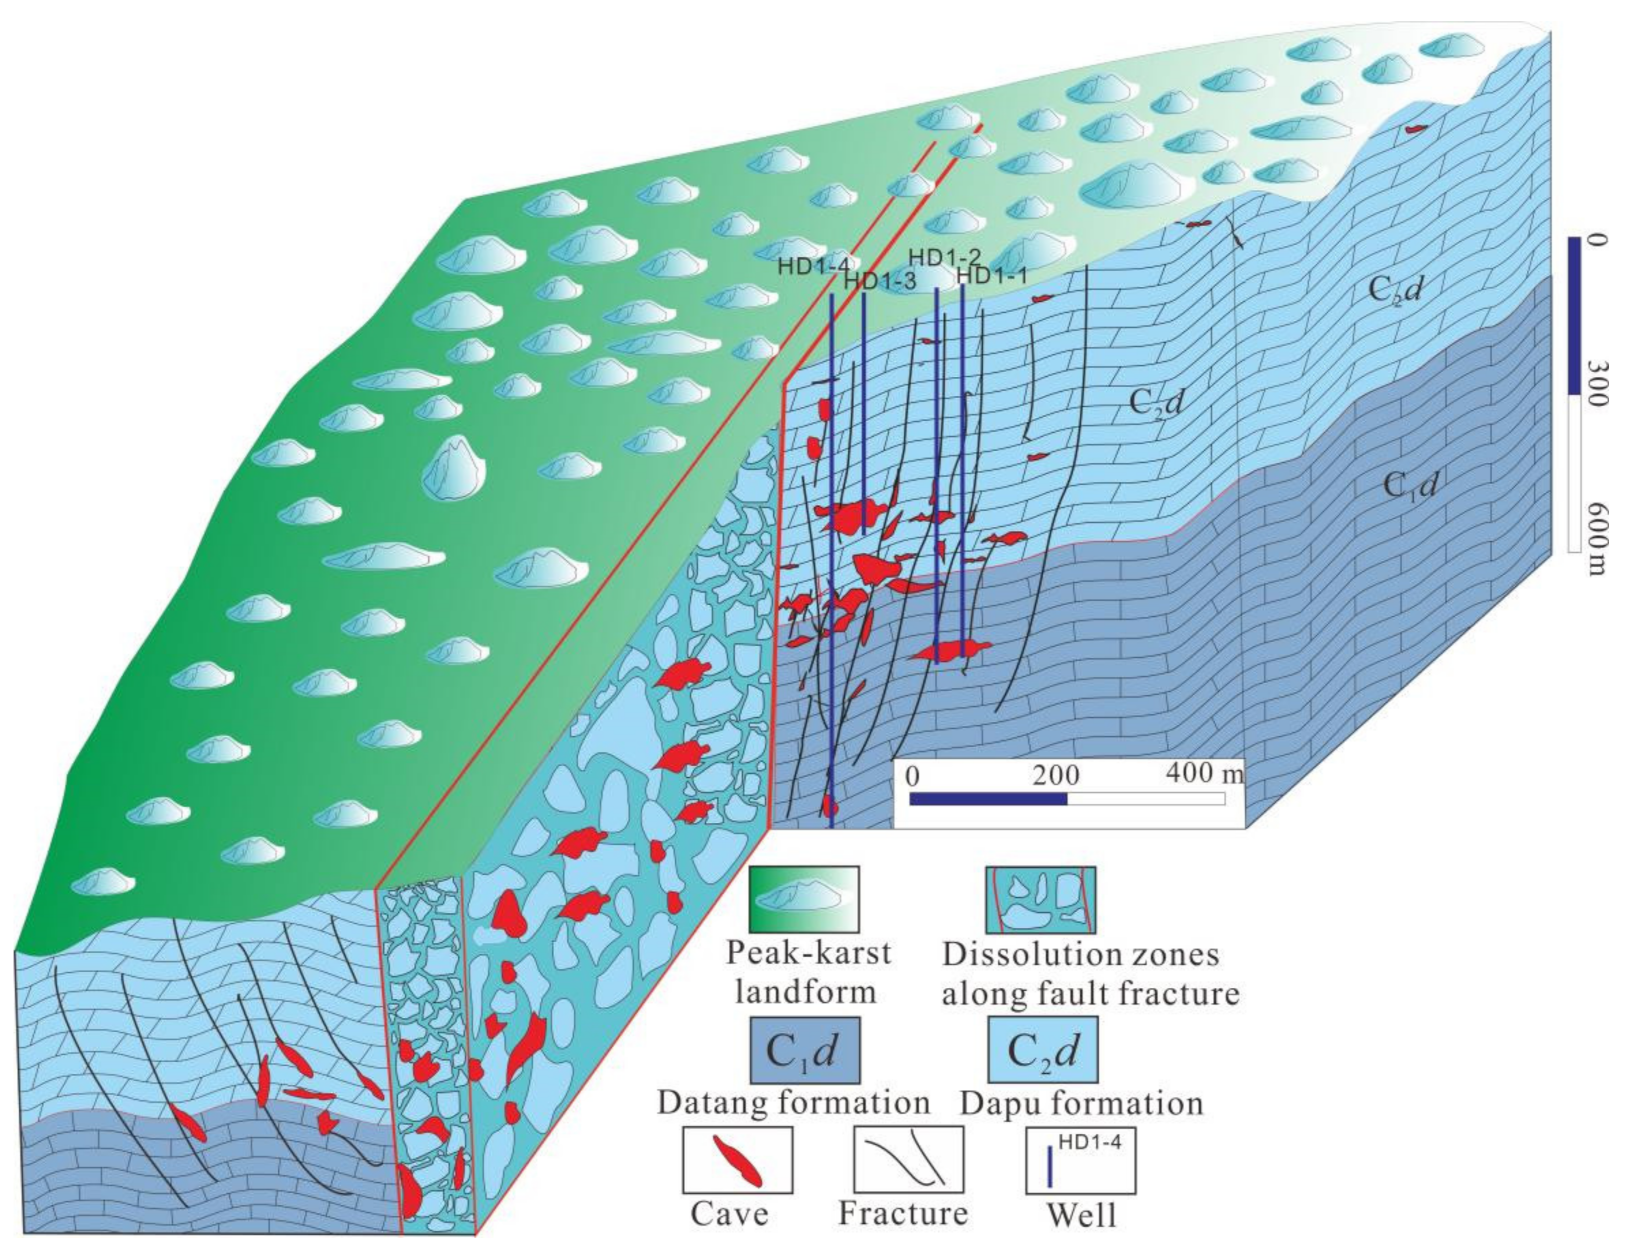
5.1. Combined Characteristics of Deep Karst Development
5.2. Geophysical Identification and Distribution Characteristics of Deep Karst
6. Geochemical Characteristics of Fracture-Cavity Fillings
6.1. Age Determination Results of Cave Fillings
6.2. Characteristics of Rare Earth Elements of Mud Fillings in the Deep Karst Caves
6.3. Inclusion Characteristics of Chemical Deposits
7. Discussion
7.1. A Fault Is the Channel for Fluid Movement in Deep Karst and Control the Development of Deep Karst
7.2. Deep Karst Stages and Genetic Types
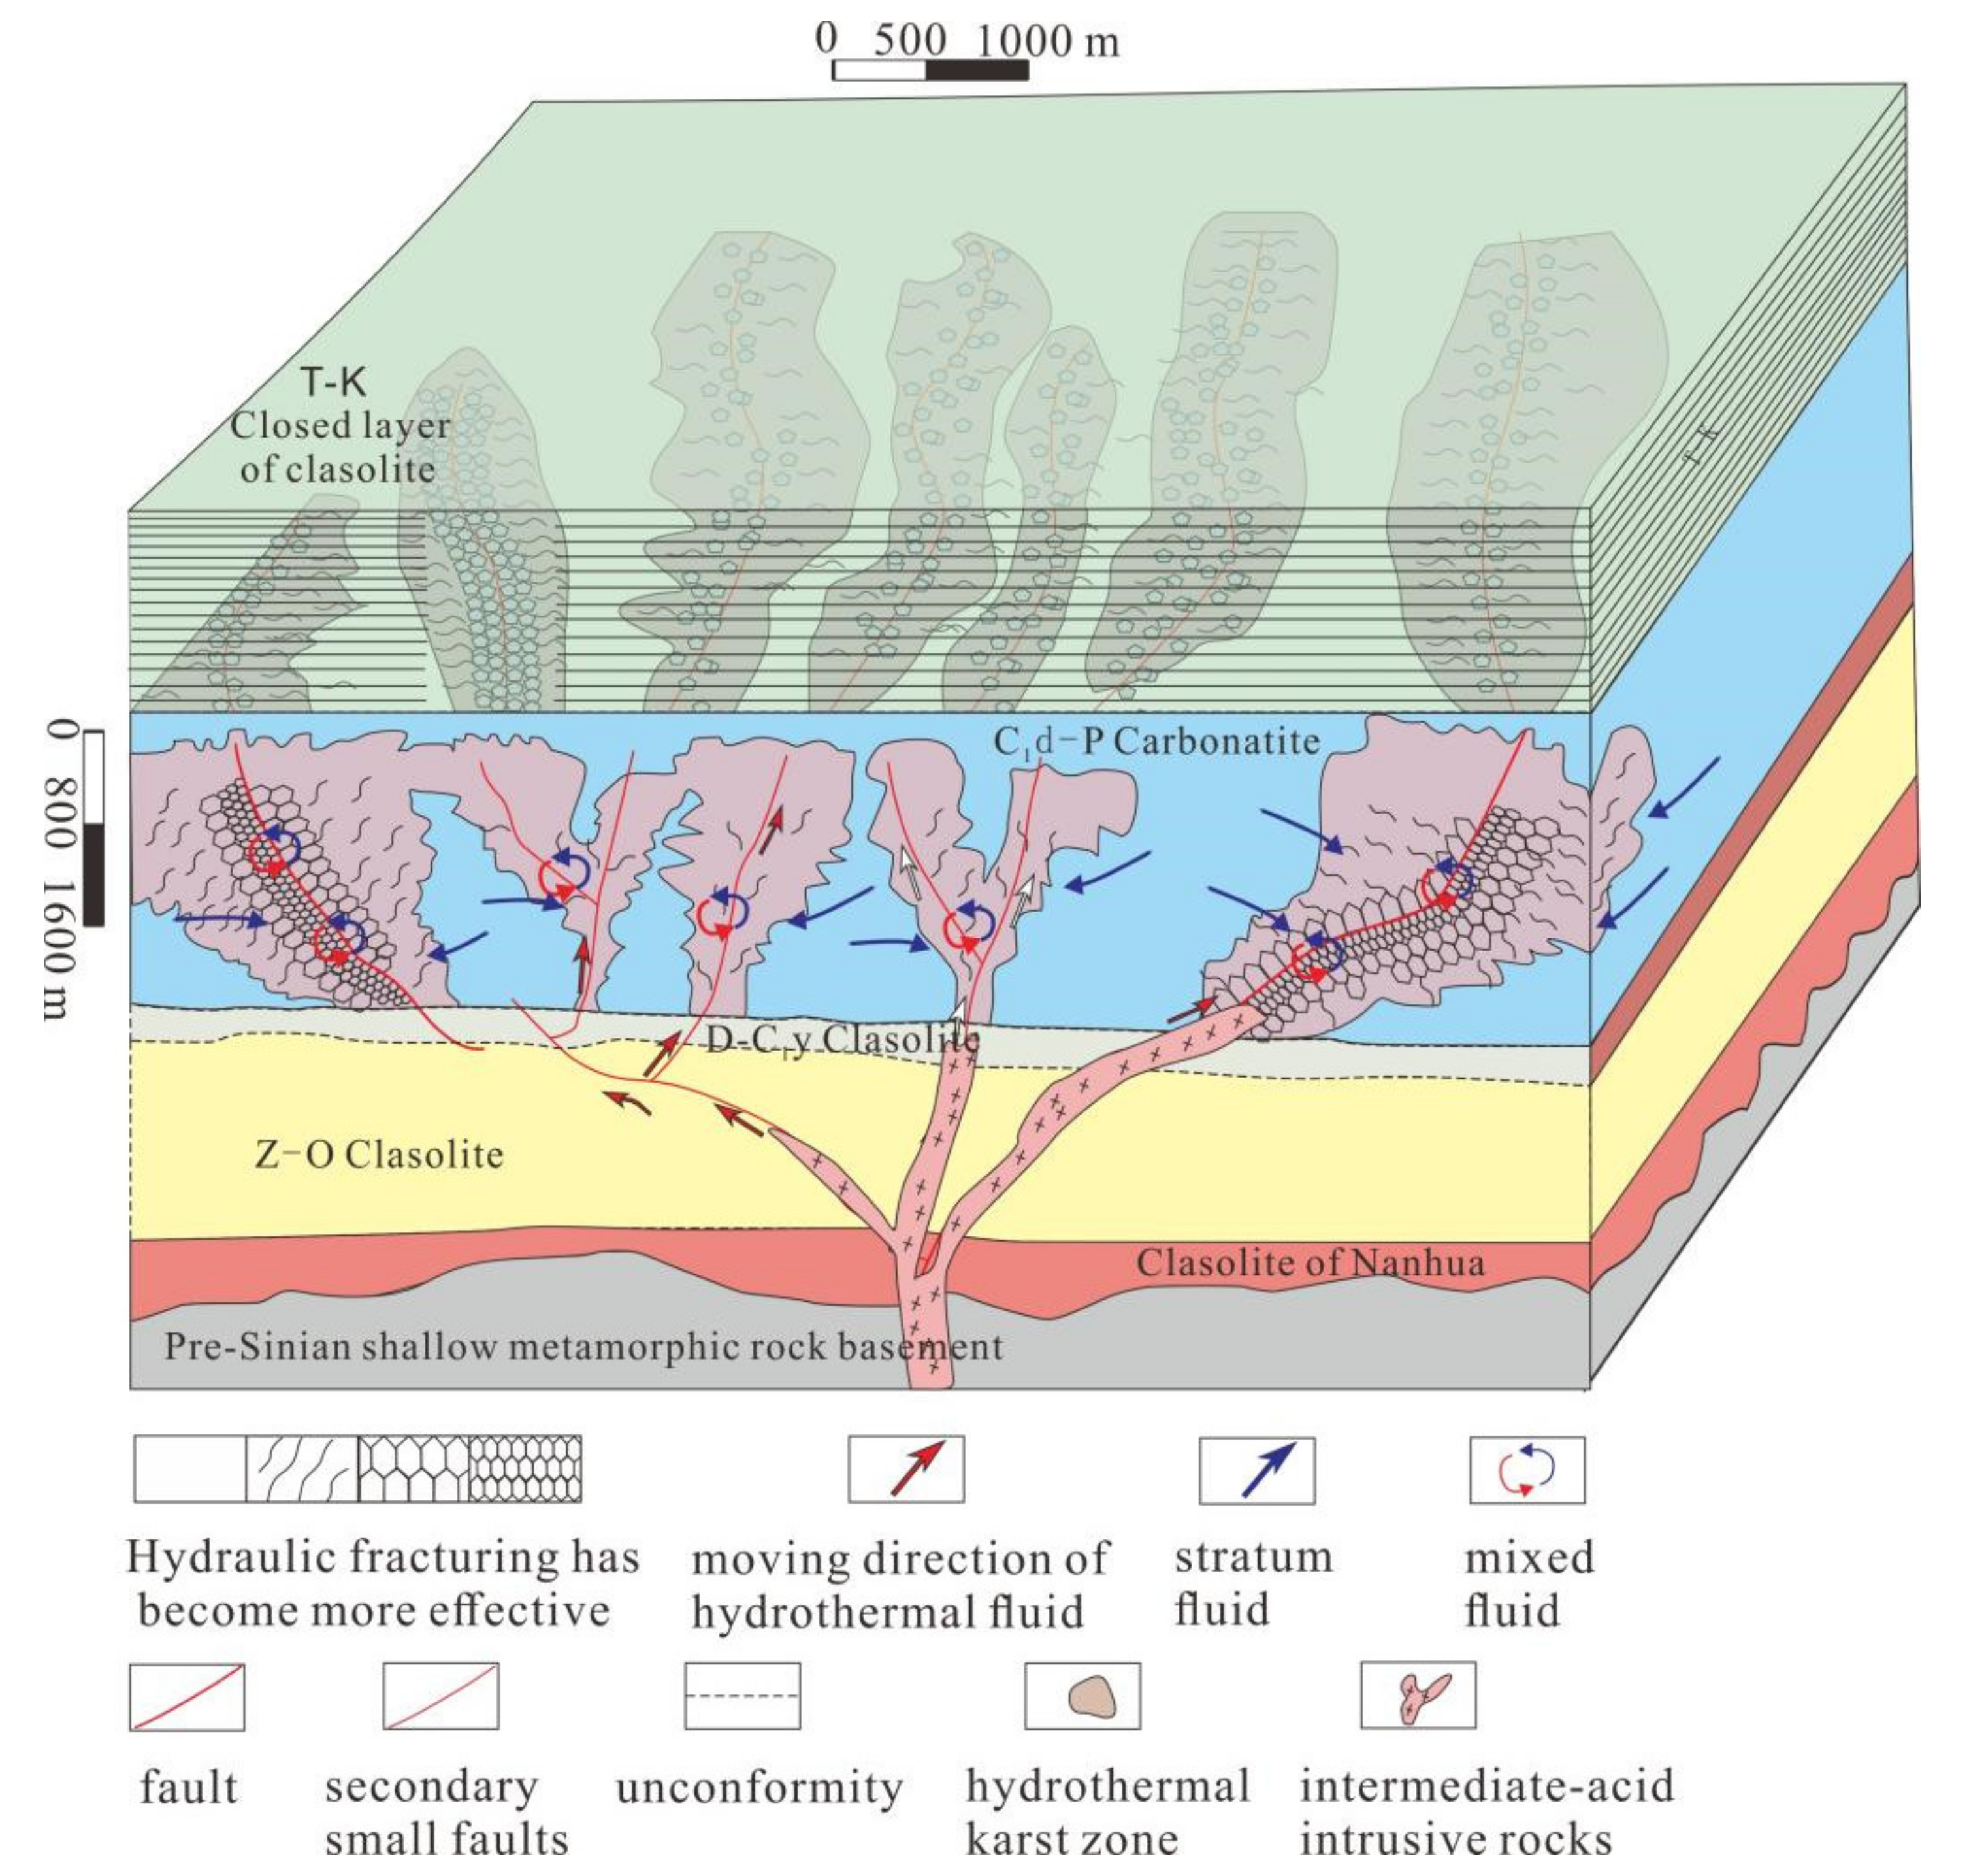
7.2.1. Deep Hydrothermal Karst in Yanshanian Period
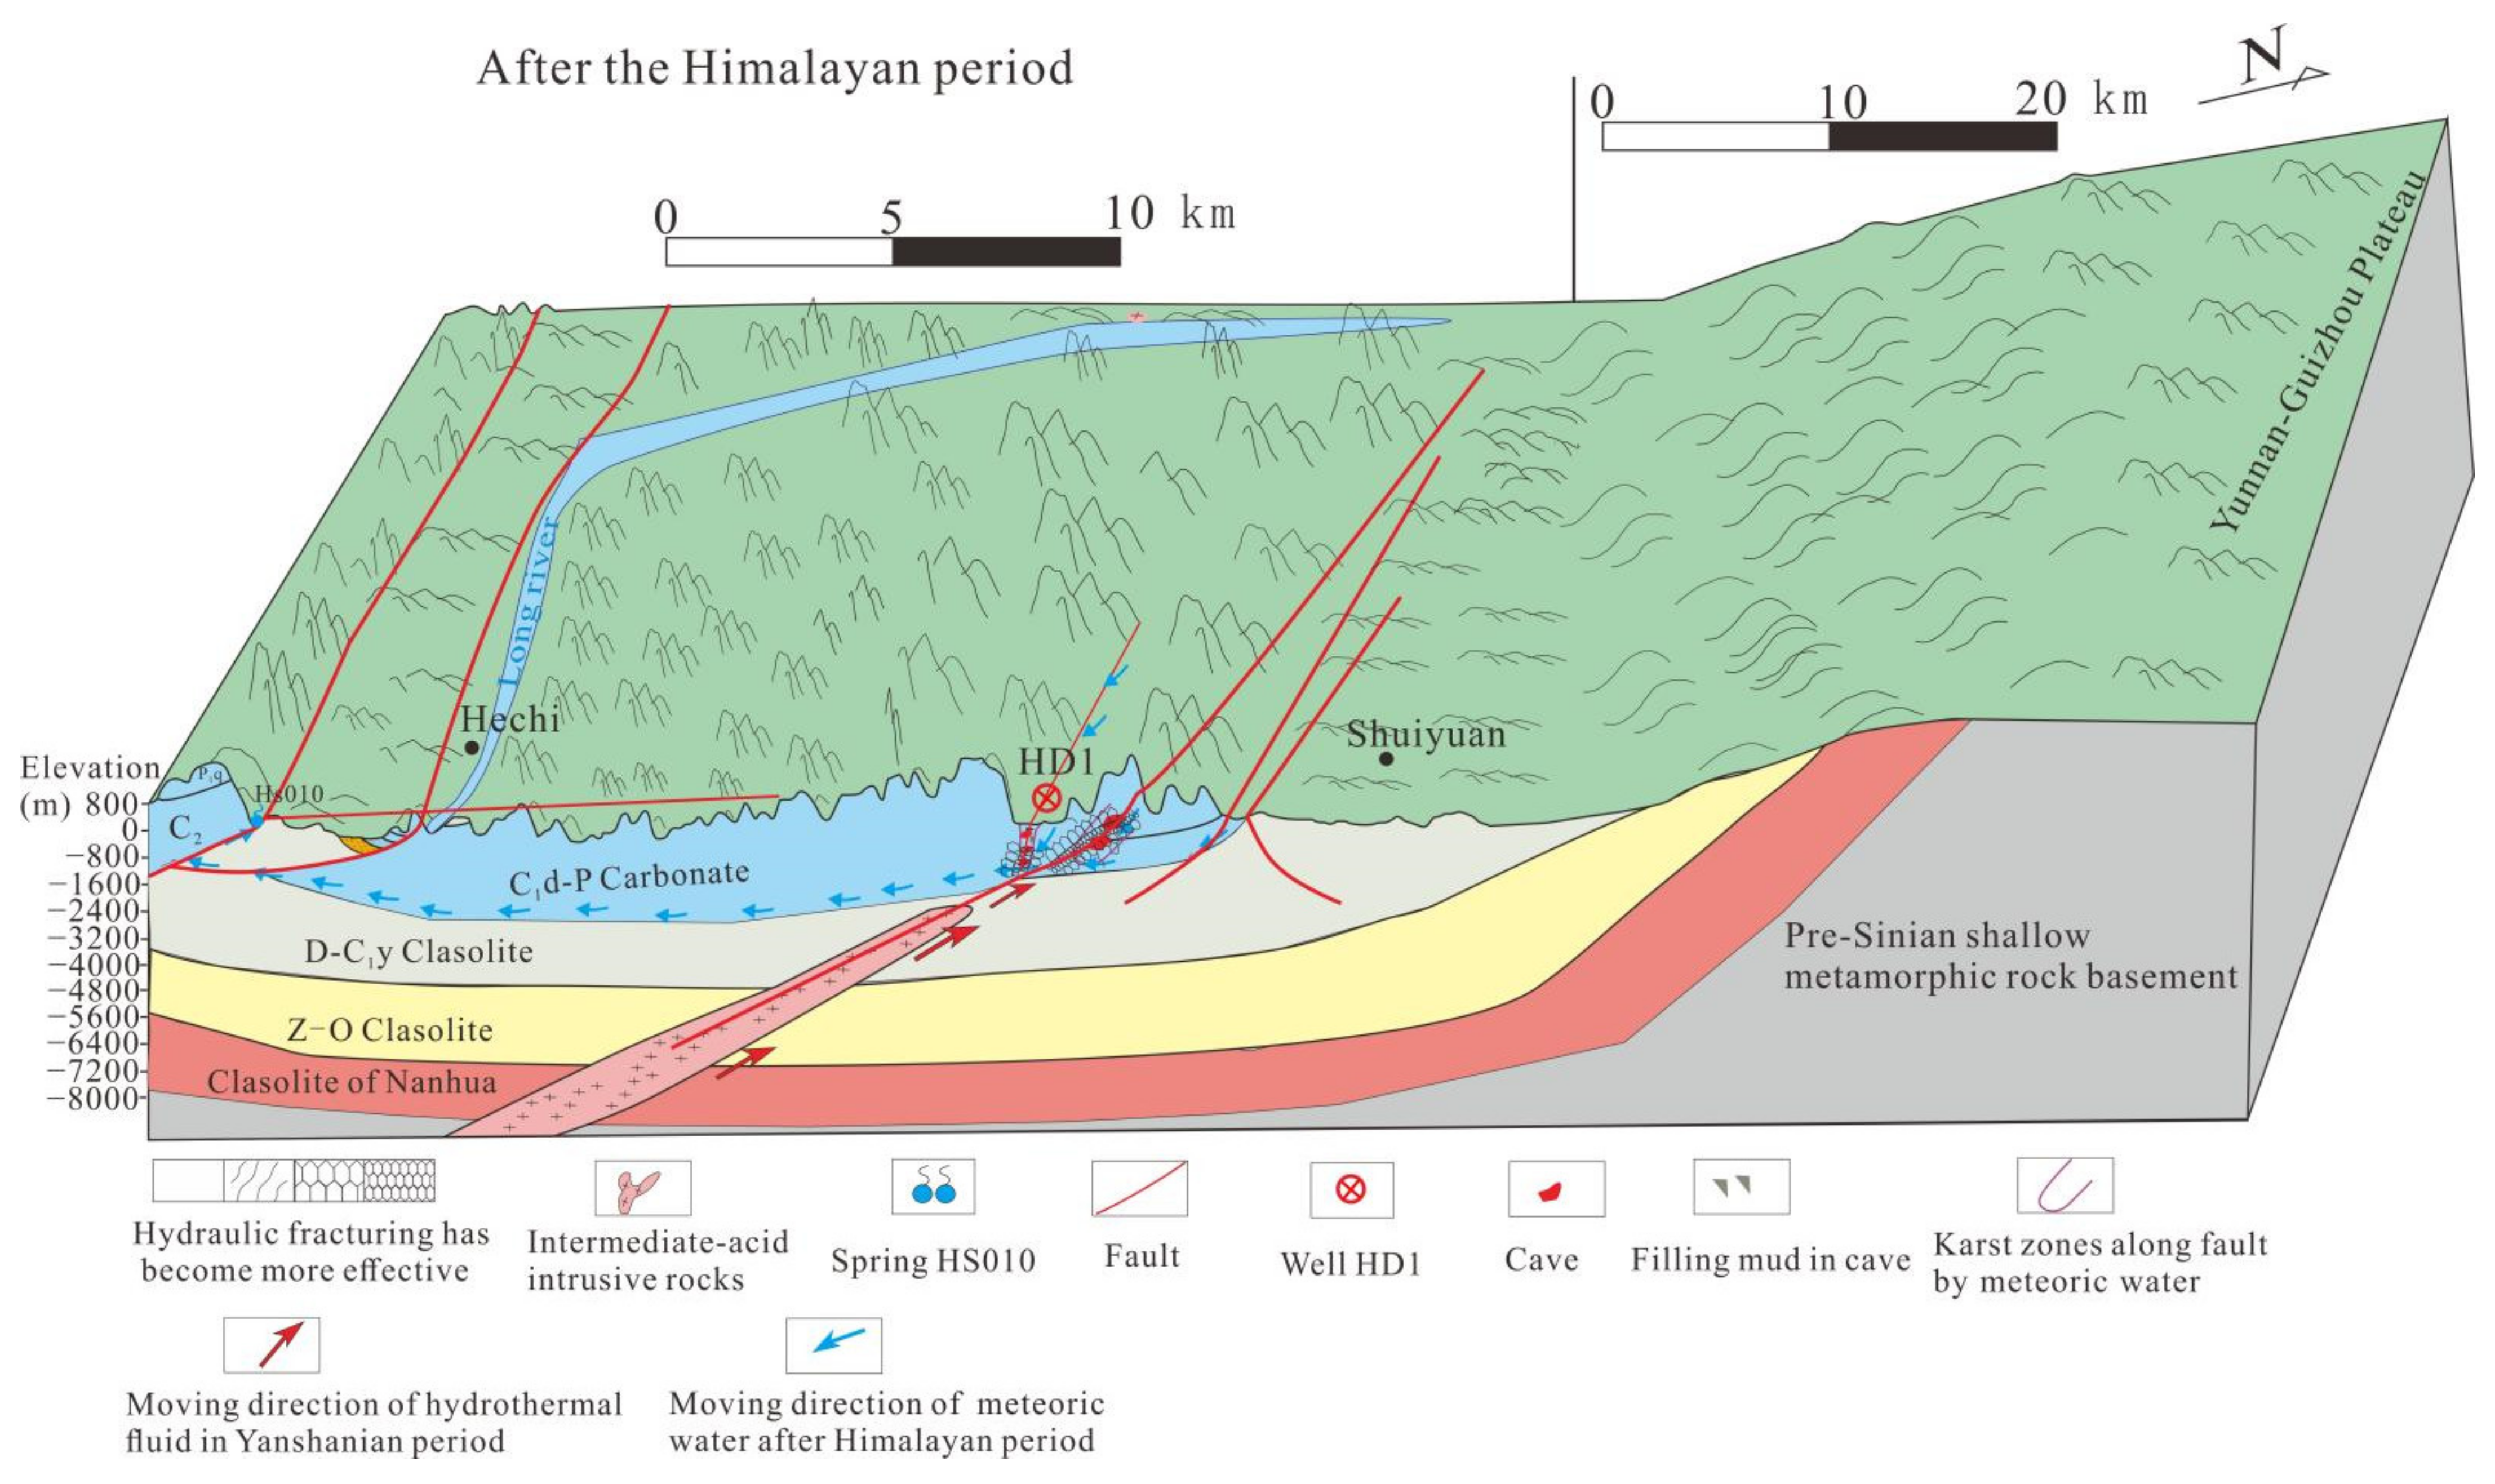
7.2.2. Meteoric Water Deep Circulation Karst after the Himalayan Period
7.3. Evolution of Deep Karst of Different Genetic Types
8. Conclusions
Supplementary Materials
Author Contributions
Funding
Institutional Review Board Statement
Informed Consent Statement
Data Availability Statement
Acknowledgments
Conflicts of Interest
References
- Palmer, A.N. Origin and morphology of limestone caves. Geol. Soc. Am. Bull. 1991, 103, 1–21. [Google Scholar] [CrossRef]
- Kunsky, J. Thermomineral karst and caves of Zbrasov, Northern Moravia. Proc. Czechoslov. Soc. Geol. 1957, 62, 306–351. [Google Scholar]
- Dublyansky, Y.N. Hydrothermal karst in the Alpine folded region of the South of the USSR. Kras I Speleol. 1980, 3, 18–36. [Google Scholar]
- Dublyansky, Y.V. Speleogenetic History of the Hungarian Hydrothermal Karst. Environ. Geol. 1995, 25, 24–35. [Google Scholar] [CrossRef]
- Dublyansky, Y.V. Speleogenesis: Evolution of Karst Aquifers; National Speleological Society: Huntsville, AL, USA, 2000; pp. 298–303. [Google Scholar]
- Ford, D.C.; Williams, P.W. Karst Geomorphology and Hydrology; Unwin Hyman: London, UK, 1989; p. 601. [Google Scholar]
- Ford, D.C. Karst geomorphology, caves and cave deposits: A review of North American contributions during the past half century. In Perspectives on Karst Geomorphology, Hydrology and Geochemistry; Paper, 404; Harmon, R.S., Wicks, C.W., Eds.; GSA Special: Boulder, CO, USA, 2006; pp. 1–14. [Google Scholar]
- Egemeier, S.J. Cavern development by thermal waters. Natl. Speleol. Soc. Bull. 1981, 49, 31–51. [Google Scholar]
- Hill, C.A. Geology of Carlsbad Cavern and other Caves in the Guadalupe Mountains, New Mexico and Texas; New Mexico Bureau of Mines & Mineral Resources: Socorro, NM, USA, 1987; Volume 117, p. 150. [Google Scholar]
- Klimchouk, A.B. Hypogene Speleogenesis: Hydrogeological and Morphogenetic Perspective; Special Paper 1; National Cave and Karst Research Institute: Carlsbad, NM, USA, 2007; p. 106. [Google Scholar]
- Palmer, A.N. Cave Geology; Cave Books: Dayton, OH, USA, 2007. [Google Scholar]
- Anette, S.E.; Libby, A.S. Microbial contributions to cave formation: New insights into sulfuric acid speleogenesis. Geology 2004, 32, 369–372. [Google Scholar]
- Audra, P.; D’antoni-Nobecourt, J.C. Hypogenic caves in France. Speleogenesis and morphology of the cave systems. Bull. Soc. Geol. Fr. 2010, 181, 327–335. [Google Scholar] [CrossRef]
- Walker, J.; Almasi, I.; Potma, K.; O’Keefe, J. Hypogenic karst beneath the Athabasca Oil Sands: Implications for oil sands mining operations. Bull. Can. Petrol. Geol. 2017, 65, 115–146. [Google Scholar] [CrossRef]
- Frumkin, A.; Langford, B.; Lisker, S.; Amrani, A. Hypogenic karst at the Arabian platform margins: Implications for far-field groundwater systems. Bull. Geol. Soc. Am. 2017, 129, 1636–1659. [Google Scholar] [CrossRef]
- Dong, H.Q.; Dan, Y.; Liang, J.P.; Liang, B.; Nie, G.Q.; Ji, S.C. A Hypogene Karst Development Pattern Controlled by the Deep-Cycle of Groundwater in the Syncline in Huanjiang, Guangxi, China. Water 2021, 13, 199. [Google Scholar] [CrossRef]
- Li, M.Q. The Simulation Study Deep karst Formation Conditions. In Karat Caves and Physiognomy; Science Press: Beijing, China, 1985. (In Chinese) [Google Scholar]
- Zou, C.J. Application of tritium analysis to the study of deep karst and seepage problems at reservoir and dam sites. Carsol. Sin. 1988, 7, 132–138. (In Chinese) [Google Scholar]
- Li, Y.C.; Han, B.P. Deep karst periods and types in the Tengxian and Peixian coal bearing basin. Procedia Earth Planet. Sci. 1993, 11, 59–61. (In Chinese) [Google Scholar]
- Huang, S.Y.; Song, H.R. Deep karstification of gas-oil reservoir. Carsol. Sin. 1997, 16, 189–198. (In Chinese) [Google Scholar]
- Xia, R.Y. New progress in the study of paleokarst and deep karst in oil and gas fields. Carsol. Sin. 2001, 20, 76. (In Chinese) [Google Scholar]
- Xu, M.; Mao, B.Y.; Zhang, Q. Evolvement and ecpectation of research on the modern deep karst. Adv. Earth Sci. 2008, 23, 495–501. (In Chinese) [Google Scholar]
- Sauro, F.; Zampieri, D.; Filipponi, M. Development of a deep karst system within a transpressional structure of the dolomites in north-east italy. Geomorphology 2013, 184, 51–63. [Google Scholar] [CrossRef]
- Mao, B.Y.; Xu, M.; Bai, A.Z. Study on the Karst Development Law and Mechanism of Heshan Coal Field in Guangxi Province. Res. Soil Water Conserv. 2008, 1, 205–208. (In Chinese) [Google Scholar]
- Pan, W.Q.; Liu, Y.Y.F.; Dickson, J.A.D.; Shen, A.J.; Han, J.; Ye, Y.; Gao, H.L.; Guan, P.; Zheng, X.P. The Geological Model of Hydrothermal Activity in Outcrop and the Characteristics of Carbonate Hydrothermal Karst of Lower Paleozoic in Tarim Basin. Acta Sedimentol. Sin. 2009, 27, 983–994. (In Chinese) [Google Scholar]
- Frumkin, M. Deep confined karst detection, analysis and paleo-hydrology reconstruction at a basin-wide scale using new geophysical interpretation of borehole logs. J. Hydrol. 2011, 406, 158–169. [Google Scholar]
- Regional Geological Survey Report of Luocheng Sheet (scale, 1:200,000). In The Geological Survey of Guangxi Zhuang Autonomous Region; Guangxi Geological Bureau Press: Nanning, China, 1968. (In Chinese)
- Regional Geological Survey Report of Donglan Sheet (scale, 1:200,000). In The Geological Survey of Guangxi Zhuang Autonomous Region; Guangxi Geological Bureau Press: Nanning, China, 1971. (In Chinese)
- Wu, G.; Yao, G.; Xu, Z.; Guo, Q.; Chen, Z. Structural patterns and origin of tectonic reformation in guizhong depression. Mar. Orig. Pet. Geol. 2009, 14, 33–40. (In Chinese) [Google Scholar]
- Liu, B.; Li, S.Z.; Zhou, Y.G.; Jin, C.; Dai, L.M.; Liu, L.P.; Wang, T.; Wang, J.; Hao, Y.; Liu, E.S. Structural features and evolution of the Hechi-Yizhou fault zone, northern Guangxi-insights from shallow to deep structures of its Liucheng segment. Geotecton. Metallog. 2009, 33, 488–496. (In Chinese) [Google Scholar]
- Mao, P.X.; Jin, A.M.; Lou, Z.H. Investigation of pore structure and fractal characteristics of marine shale reservoirs of the Upper Paleozoic in Huanjiang sag, Guizhong depression. Chin. J. Geol. 2019, 54, 130–144. (In Chinese) [Google Scholar]
- Klimchouk, A.; Auler, A.S.; Bezerra, F.; Cazarin, C.L.; Balsamo, F.; Dublyansky, Y. Hypogenic origin, geologic controls and functional organization of a giant cave system in precambrian carbonates, brazil. Geomorphology 2016, 253, 385–405. [Google Scholar] [CrossRef]
- Bögli, A. Karst Hydrology and Physical Speleology; Springer: Berlin, Germany, 1980. [Google Scholar]
- Dan, Y.; Lin, L.; Liang, B.; Zhang, Q.; Yu, Y.; Cao, J. Eogenetic karst control of carbonate reservoirs during a transient exposure: A case study of the ordovician yingshan formation in the northern slope of the tazhong uplift, tarim basin, China. Minerals 2018, 8, 345. [Google Scholar] [CrossRef] [Green Version]
- Zhang, J.; He, Z.H.; Huang, D.J. Application of frequency attenuation gradient in prediction of gas and oil potentials. Prog. Explor. Geophys. 2010, 33, 207–211. [Google Scholar]
- Huafeng, H.U.; Bao, D.; Lingwei, M.A.; Qi, H.U. Scale characterization of carbonate karst cave reservoirs based on high-frequency attenuation gradient: A case study from karst paleochannels reservoirs in tahe oilfield, China. Geophys. Prospect. Pet. 2018, 57, 892–900. (In Chinese) [Google Scholar]
- Yuan, B.; Li, D.; Bayless, R.C. Wide field electromagnetic method for shale gas exploration in southern china: A case study. J. Environ. Eng. Geophys. 2017, 22, 279–289. [Google Scholar] [CrossRef]
- Shen, C.C.; Edwards, R.L.; Cheng, H.; Dorale, J.A.; Edmonds, H.N. Uranium and thorium isotopic and concentration measurements by magnetic sector inductively coupled plasma mass spectrometry. Chem. Geol. 2002, 185, 165–178. [Google Scholar] [CrossRef]
- Cheng, H.; Edwards, R.L.; Shen, C.-C.; Woodhead, J.; Hellstrom, J.; Wang, Y.J.; Kong, X.G.; Spötl, C.; Wang, X.F.; Alexander, E.C., Jr. Improvements in 230 Th dating, 230 Th and 234 U half-life values, and U-Th isotopic measurements by multi-collector inductively coupled plasma mass spectrometry. Earth Planet. Sci. Lett. 2013, 371–372, 82–91. [Google Scholar] [CrossRef]
- Nothdurft, L.D.; Webb, G.E.; Kamber, B.S. Rare earth element geochemistry of Late Devonian reefal carbonates, Canning Basin, Western Australia: Confirmation of seawater REE proxy in ancient limestones. Geochim. Cosmochim. Acta 2004, 68, 263–283. [Google Scholar] [CrossRef]
- Yi, H.S.; Lin, J.H.; Zhao, X.X. Geochemistry of Rare Earth Elements and Origin of Positive Europium Anomaly in Miocene-Oligocene Lacustrine Carbonates from Tuotuohe Basin of Tibetan Plateau. Acta Sendimentologica Sin. 2008, 26, 1–10. [Google Scholar]
- Gromet, L.P.; Haskin, L.A.; Korotev, R.L. The “North American Shale Composite”: Its Compilation, Major and Trace Element Characteristics. Geochim. Coamochimica Acta 1984, 48, 2469–2482. [Google Scholar] [CrossRef]
- Pan, R.; Tang, X.; Meng, J. Shale gas preservation conditions for the Upper Paleozoic in Guizhong Depression. Oil Gas Geol. 2014, 35, 534–541. [Google Scholar]
- Wang, D.; Chen, Y.; Chen, W.; Sang, H.; Lin, Z. Dating the dachang giant tin-polymetal lic deposit in nandan, guangxi. Acta Geol. Sin. 2004, 78, 133–138. [Google Scholar]
- Bögli, A. Mischungkorrosion; ein Beitrag zum Ver karst ungs problem. Erdkunde 1964, 18, 83–92. [Google Scholar] [CrossRef]
- Wei, Y.; Chengzhan, L.I.; Chen, W.; Luo, Q.; Zhu, D.; Pan, T. Characteristics and formation and evolution analysis of the karst landscape of guangxi. Guangxi Sci. 2018, 25, 465–504. [Google Scholar]
- Yu, L.; Shijie, W.; Sheng, X.; Derek, F.; Finlay, M.S.; Ángel, R.; Xinbao, Z.; Weijun, L. New chronological constraints on the Plio-Pleistocene uplift of the Guizhou Plateau, SE margin of the Tibetan Plateau. Quat. Geochronol. 2022, 67, 101237. [Google Scholar]


| Number | Well Number | Emptying Section | Cave Height (m) | Number | Well Number | Emptying Section | Cave Height (m) |
|---|---|---|---|---|---|---|---|
| 1 | HD1-1 | 766.00–766.20 | 0.2 | 13 | HD1-4 | 417.10–418.90 | 1.8 |
| 2 | 842.90–864.16 | 21.26 | 14 | 421.75–425.29 | 3.54 | ||
| 3 | HD1-2 | 861.58–887.38 | 25.8 | 15 | 426.29–429.00 | 2.71 | |
| 4 | HD1-3 | 172.50–174.45 | 1.95 | 16 | 429.63–432.10 | 2.47 | |
| 5 | 176.75–177.59 | 0.85 | 17 | 432.70–435.11 | 2.41 | ||
| 6 | 440.49–442.64 | 2.15 | 18 | 448.37–451.01 | 2.64 | ||
| 7 | 445.07–449.99 | 4.92 | 19 | 451.45–453.05 | 1.6 | ||
| 8 | 453.68–474.59 | 20.91 | 20 | 454.70–455.80 | 1.1 | ||
| 9 | HD1-4 | 46.96–49.56 | 2.6 | 21 | 1126.90–1129.30 | 2.4 | |
| 10 | 49.96–54.16 | 4.2 | 22 | 1158.00–1160.30 | 2.3 | ||
| 11 | 73.26–76.26 | 3 | 23 | 1206.00–1208.40 | 2.4 | ||
| 12 | 76.96–78.16 | 1.2 |
| Sample Number | 238U (ppb) | 232Th (ppt) | 230Th/232Th (Atomic × 10−6) | δ234U* (Measured) | 230Th/238U (Activity) | 230Th Age (yr) (Uncorrected) | 230Th Age (yr) (Corrected) | δ234UInitial** (Corrected) | 230Th Age (yr BP) *** (Corrected) |
|---|---|---|---|---|---|---|---|---|---|
| DY | 17 ± 0 | 24,412 ± 491 | 13 ± 0 | 150 ± 6 | 1.1124 ± 0.0136 | 289,757 ± 17,907 | 252,486 ± 31,087 | 306 ± 29 | 252,418 ± 31,087 |
Publisher’s Note: MDPI stays neutral with regard to jurisdictional claims in published maps and institutional affiliations. |
© 2022 by the authors. Licensee MDPI, Basel, Switzerland. This article is an open access article distributed under the terms and conditions of the Creative Commons Attribution (CC BY) license (https://creativecommons.org/licenses/by/4.0/).
Share and Cite
Dan, Y.; Dong, H.; Liang, B.; Nie, G.; Hu, X.; Ji, S.; Han, K. Identification and Evolution of Different Genetic Types of Deep Karst Caves Controlled by Faults—A Case Study in Huanjiang Sag, Guangxi Province, South China. Minerals 2022, 12, 405. https://doi.org/10.3390/min12040405
Dan Y, Dong H, Liang B, Nie G, Hu X, Ji S, Han K. Identification and Evolution of Different Genetic Types of Deep Karst Caves Controlled by Faults—A Case Study in Huanjiang Sag, Guangxi Province, South China. Minerals. 2022; 12(4):405. https://doi.org/10.3390/min12040405
Chicago/Turabian StyleDan, Yong, Hongqi Dong, Bin Liang, Guoquan Nie, Xiuquan Hu, Shaocong Ji, and Kai Han. 2022. "Identification and Evolution of Different Genetic Types of Deep Karst Caves Controlled by Faults—A Case Study in Huanjiang Sag, Guangxi Province, South China" Minerals 12, no. 4: 405. https://doi.org/10.3390/min12040405