
Geochemistry of REY-Enriched Phosphorites in Zhijin Region, Guizhou Province, SW China: Insight into the Origin of REY

 ,
,
Abstract
:1. Introduction
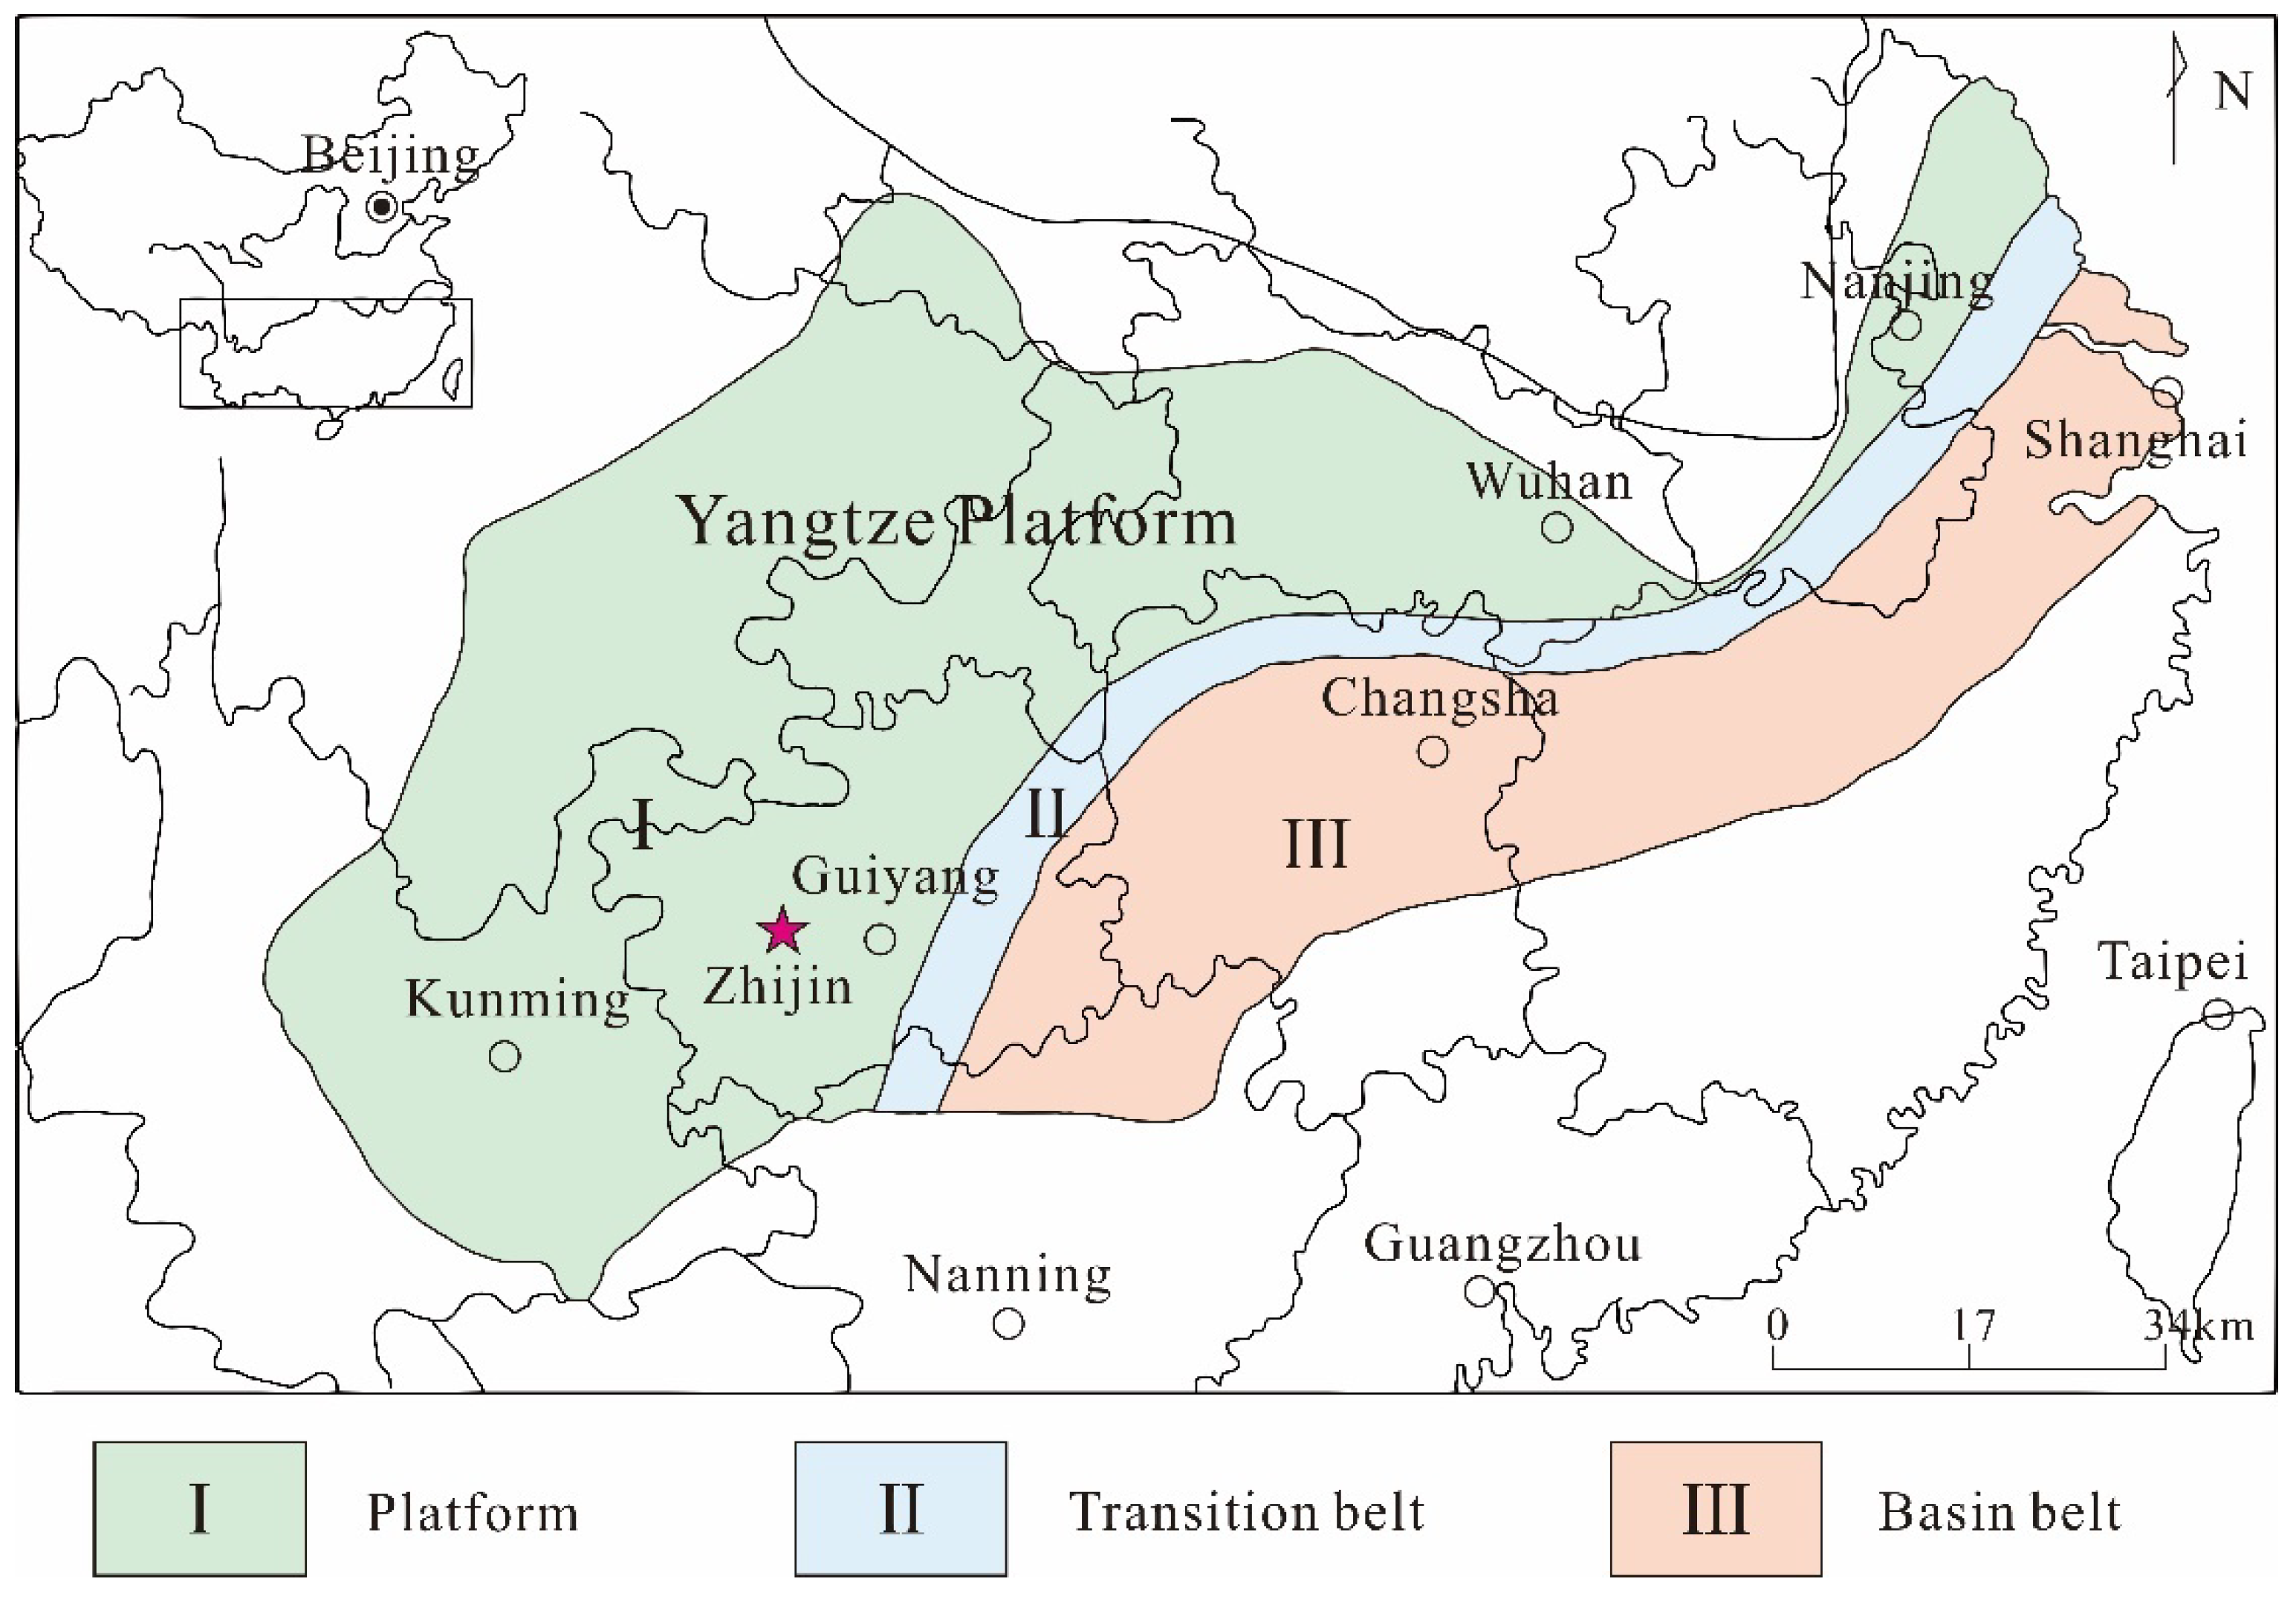
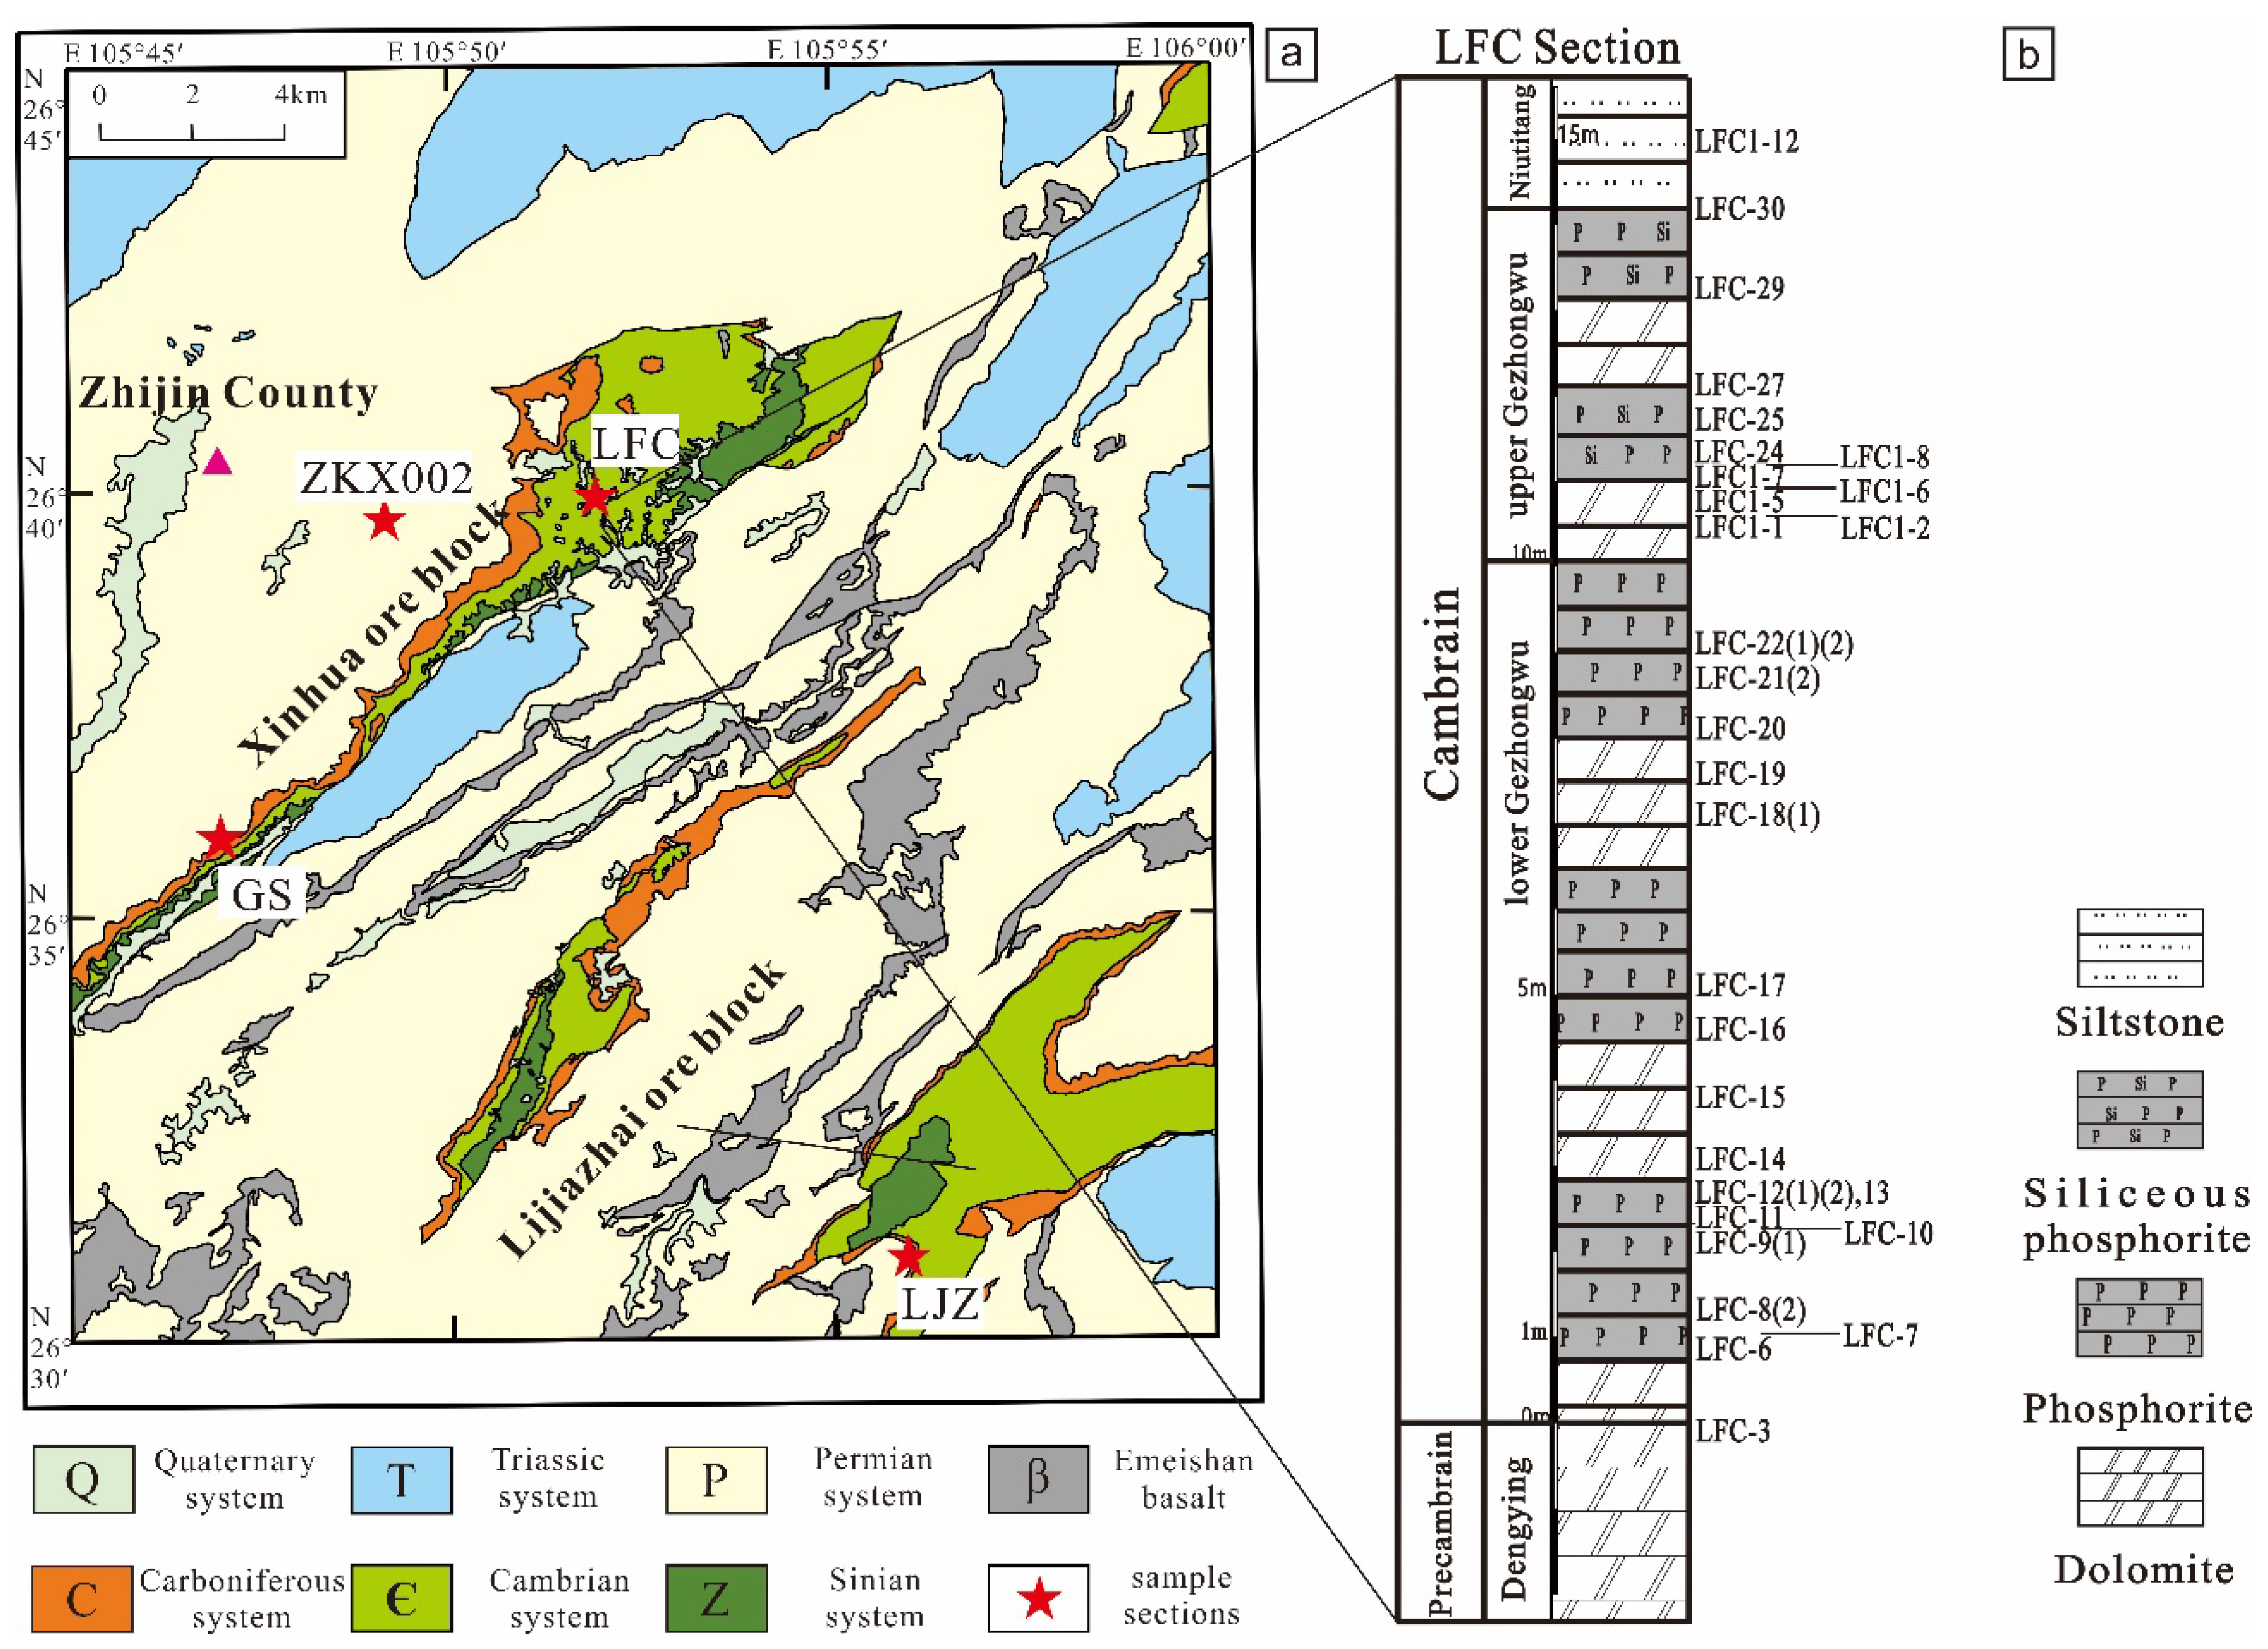
2. Geology Setting
3. Materials and Methods
3.1. Samples
3.2. Methods
4. Results
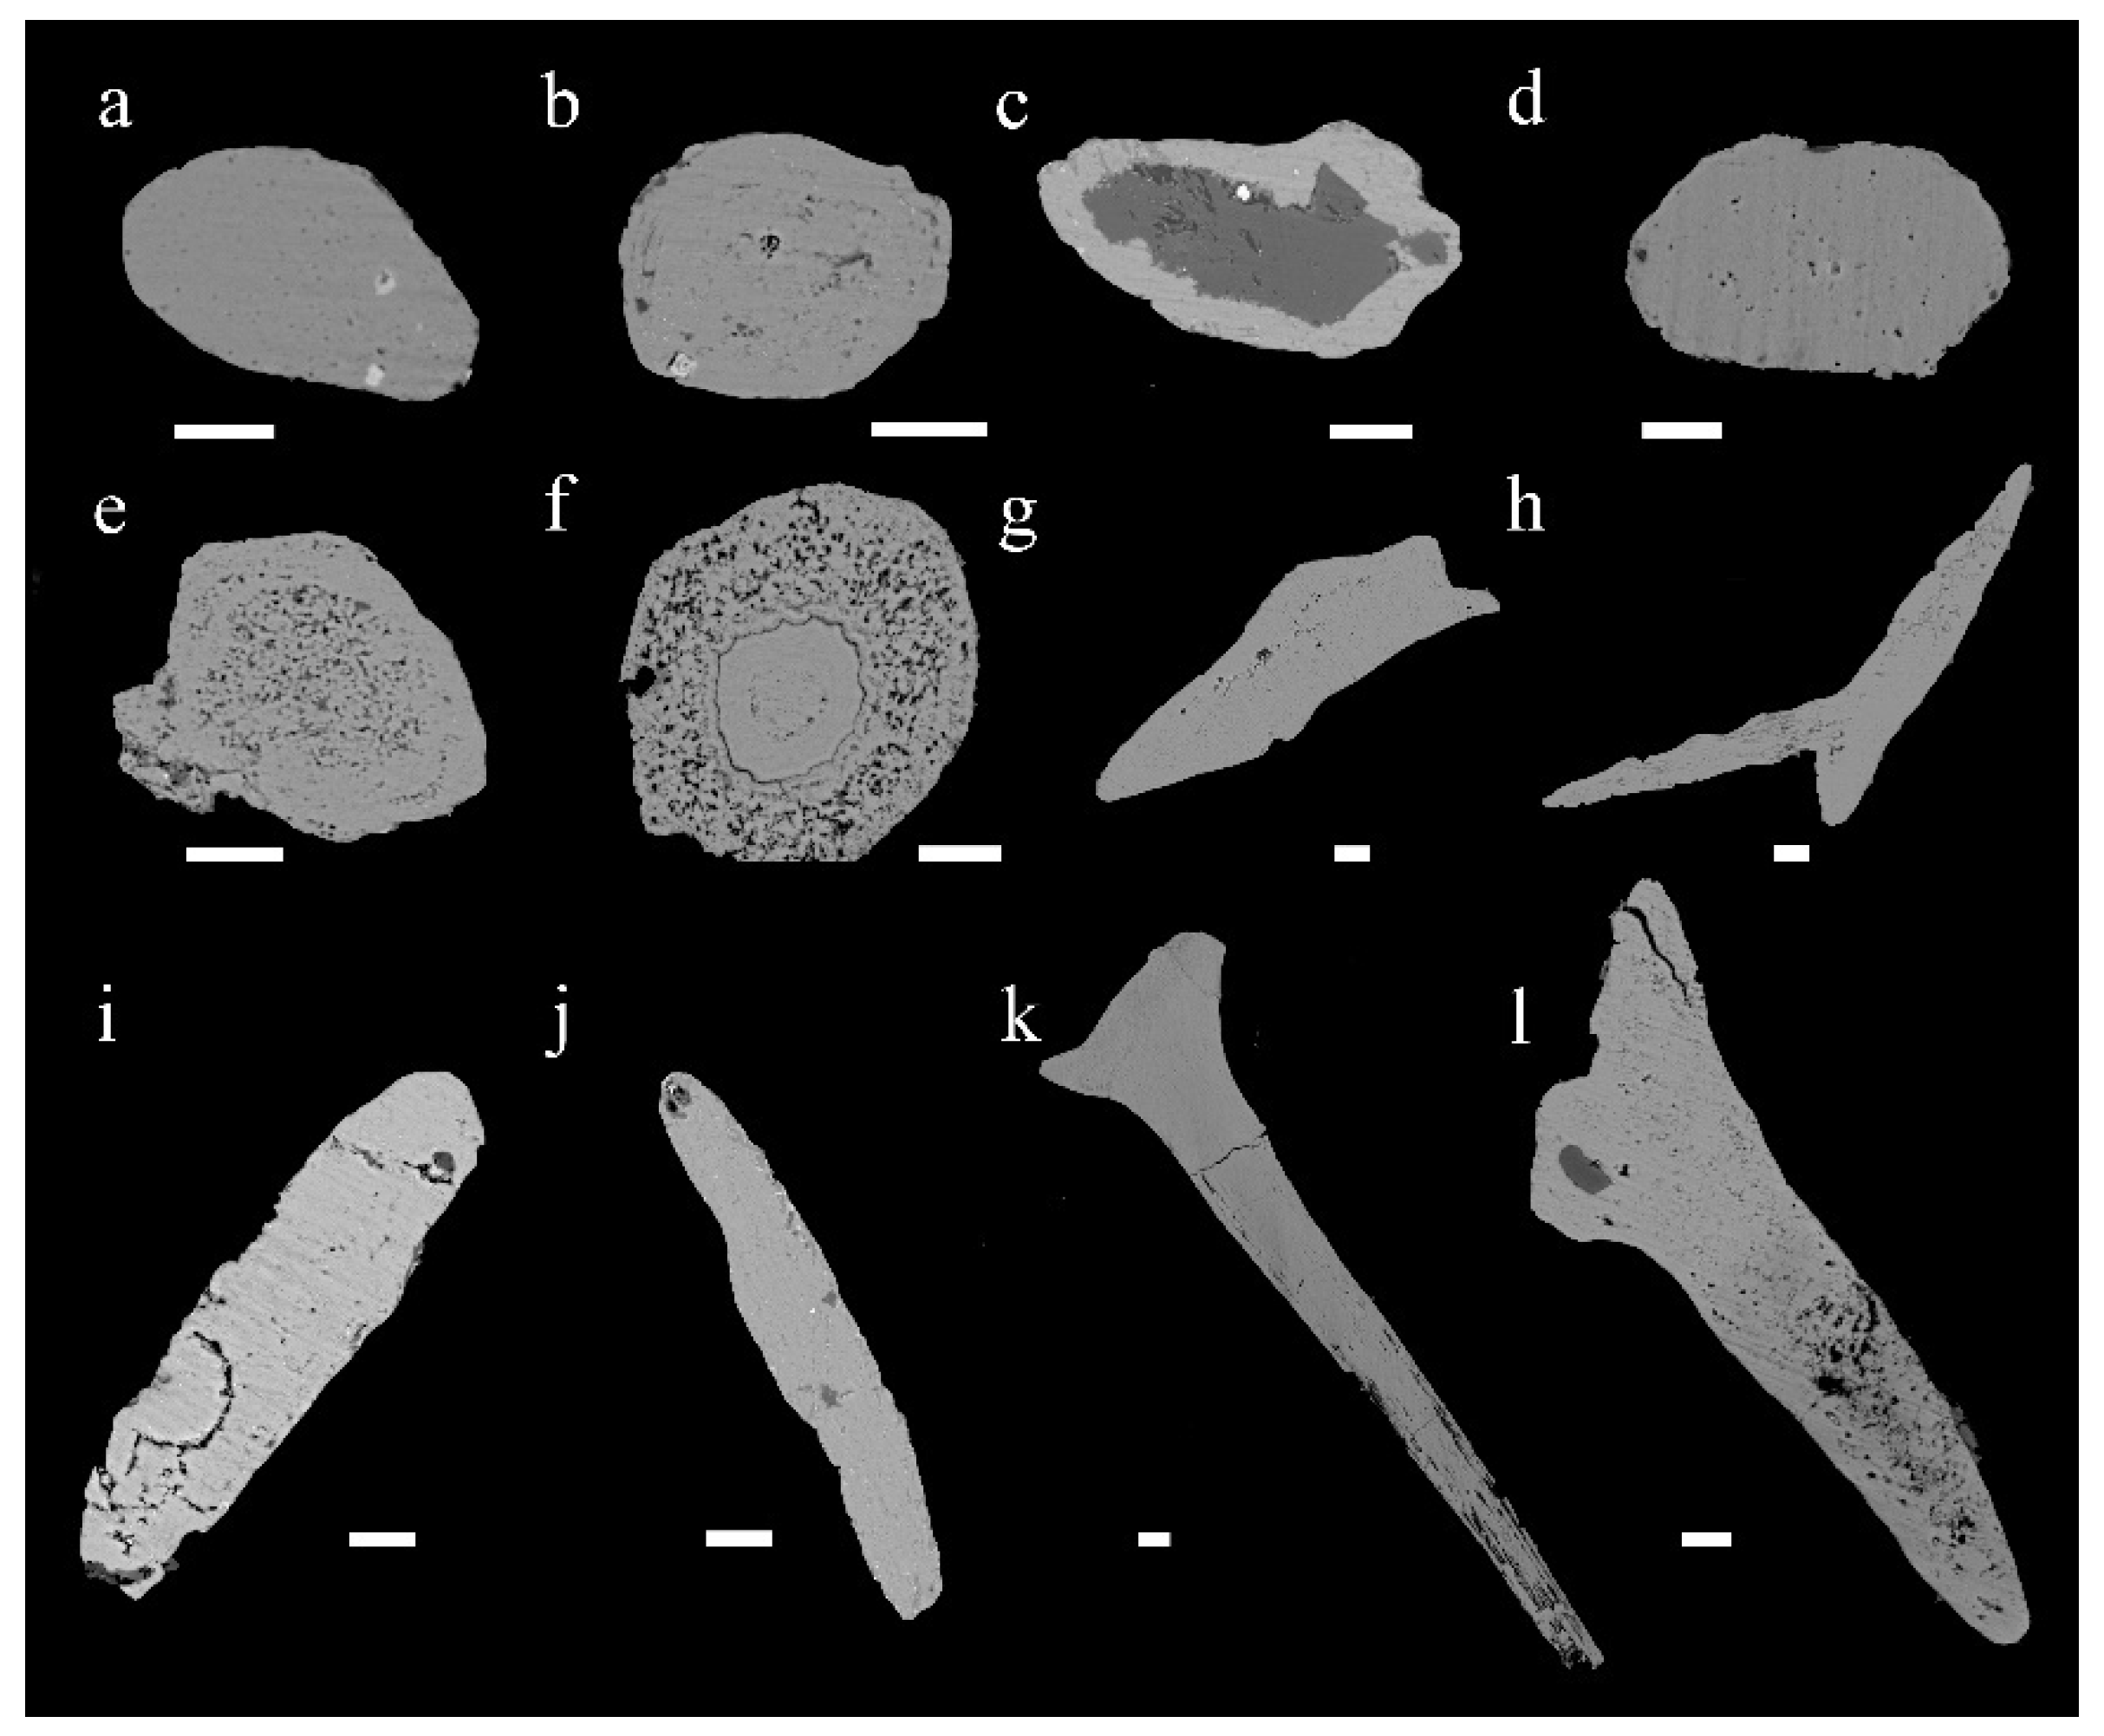
4.1. Francolite Micro-Textures
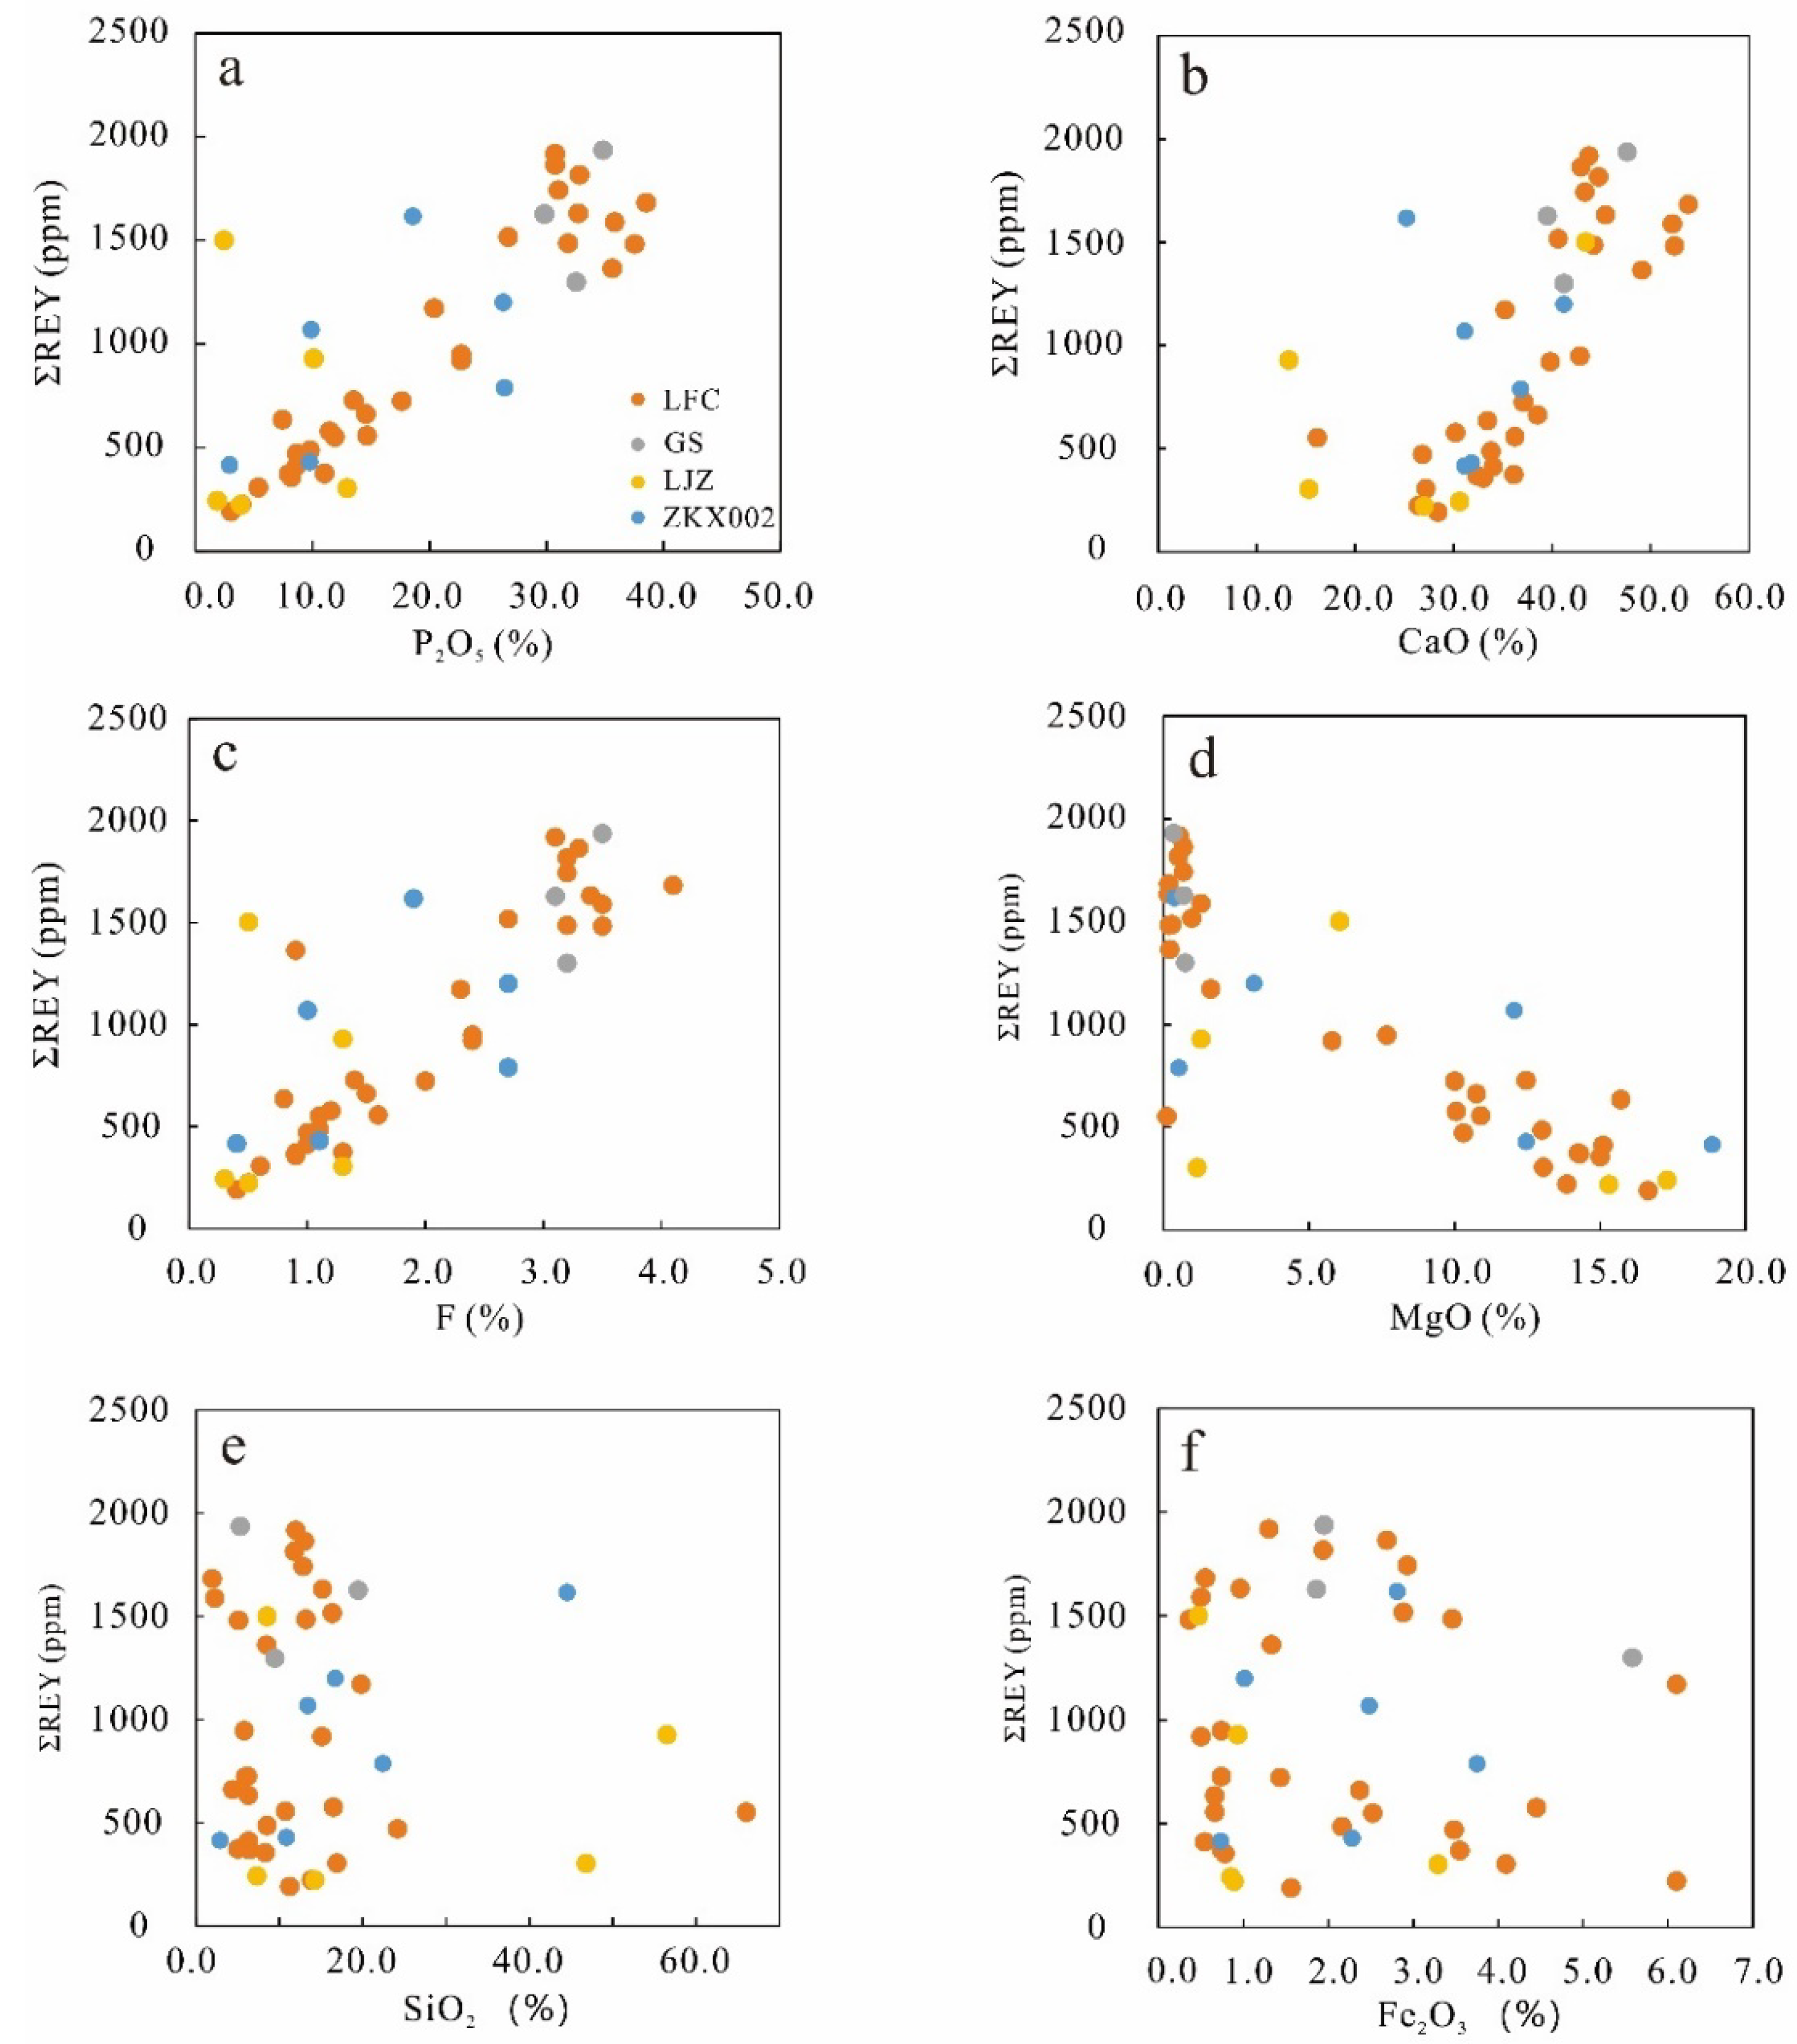
4.2. Bulk Major and Trace Elements
4.3. In Situ REY of Francolite and Dolomite
5. Discussion
5.1. Occurrence of REY
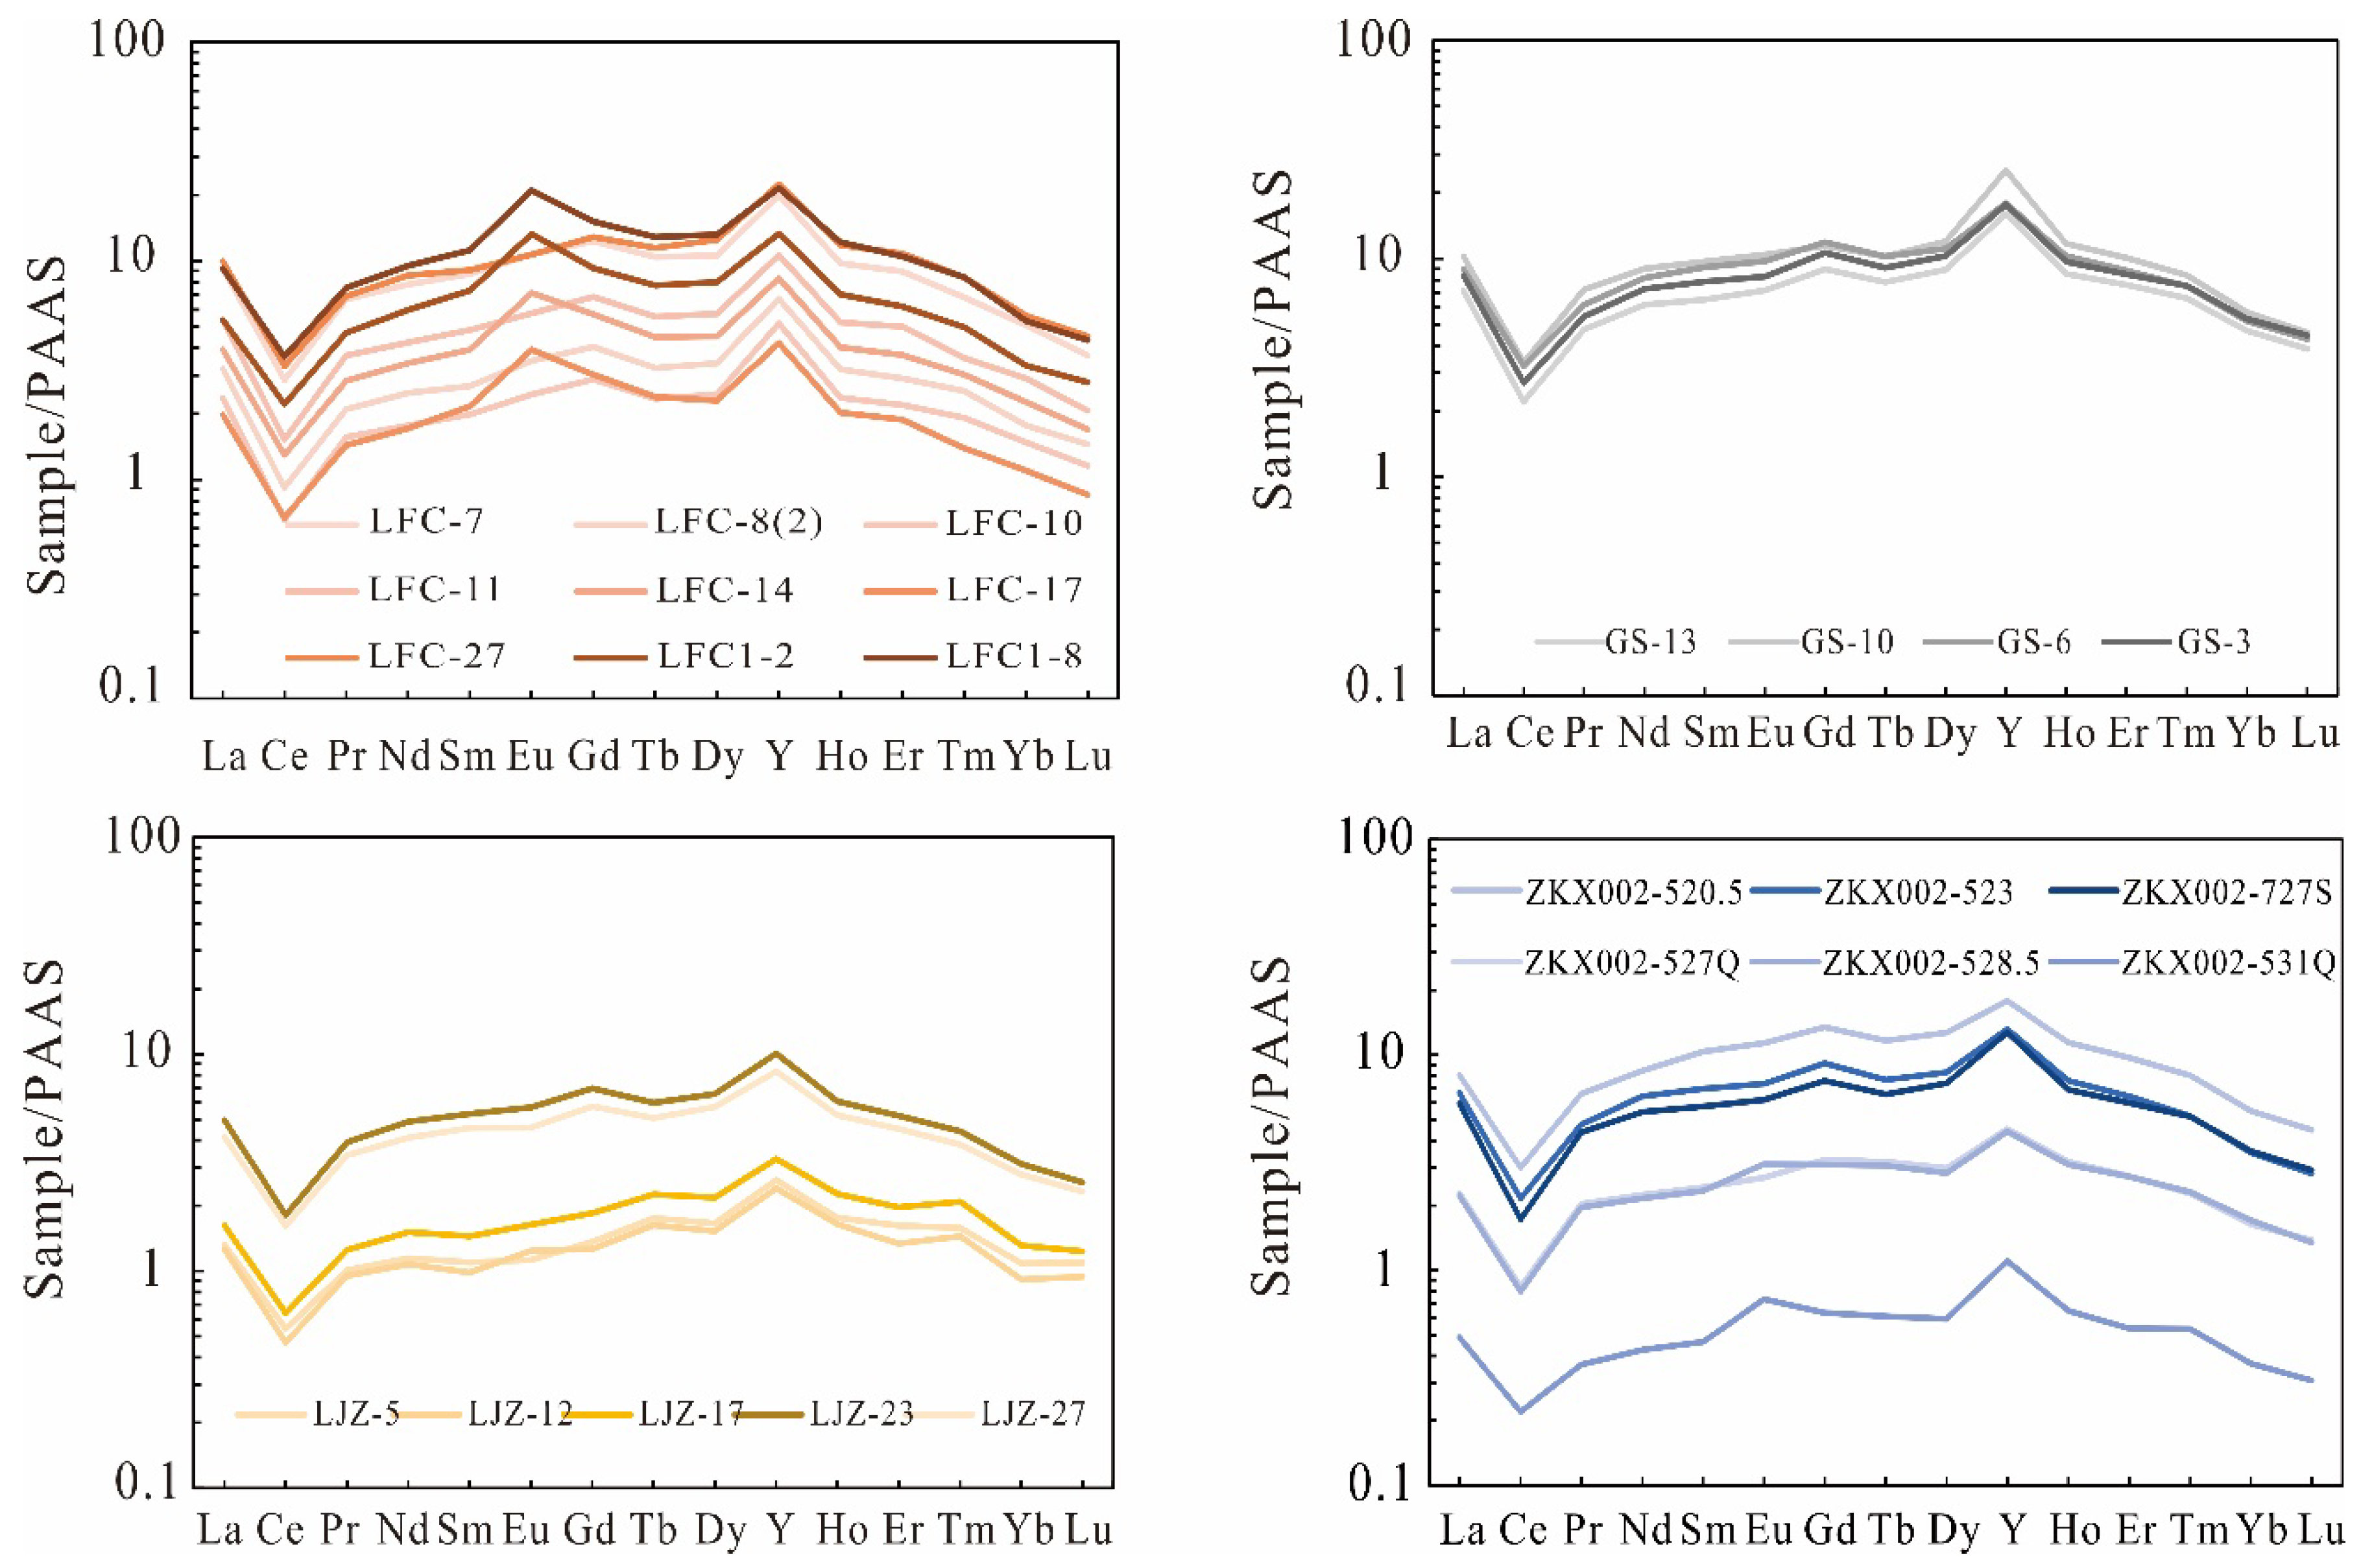
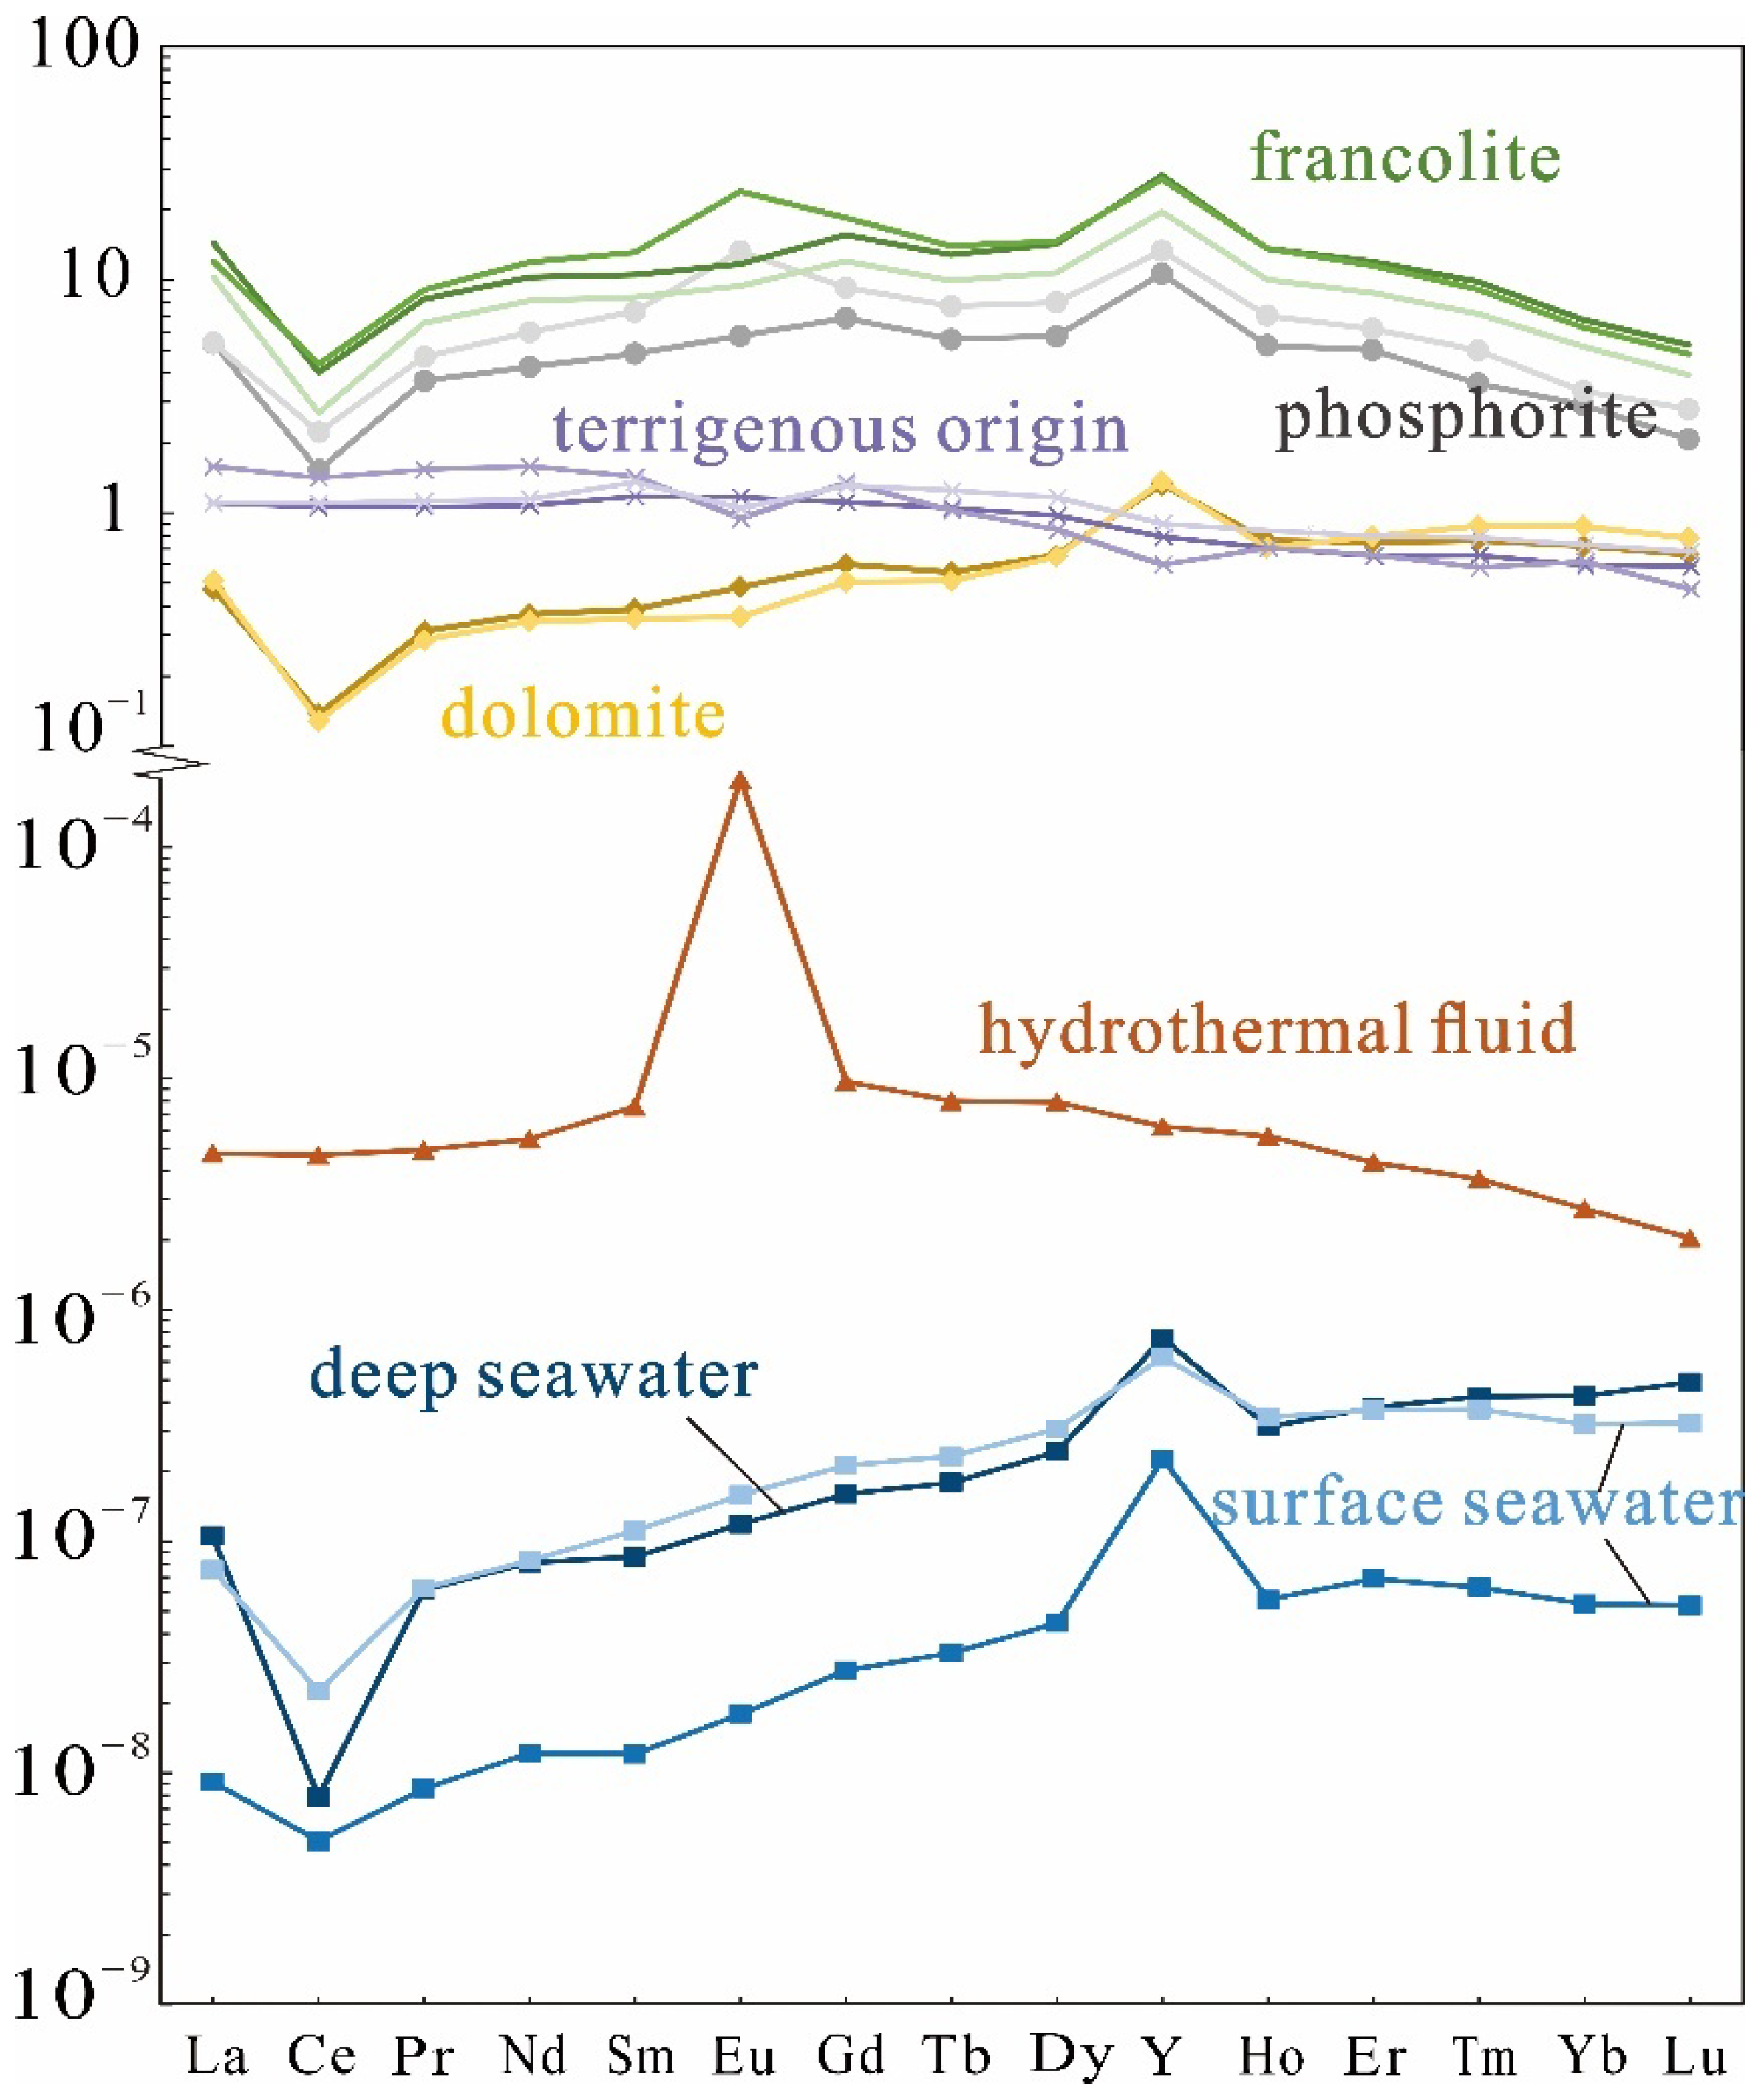
5.2. REY Pattern
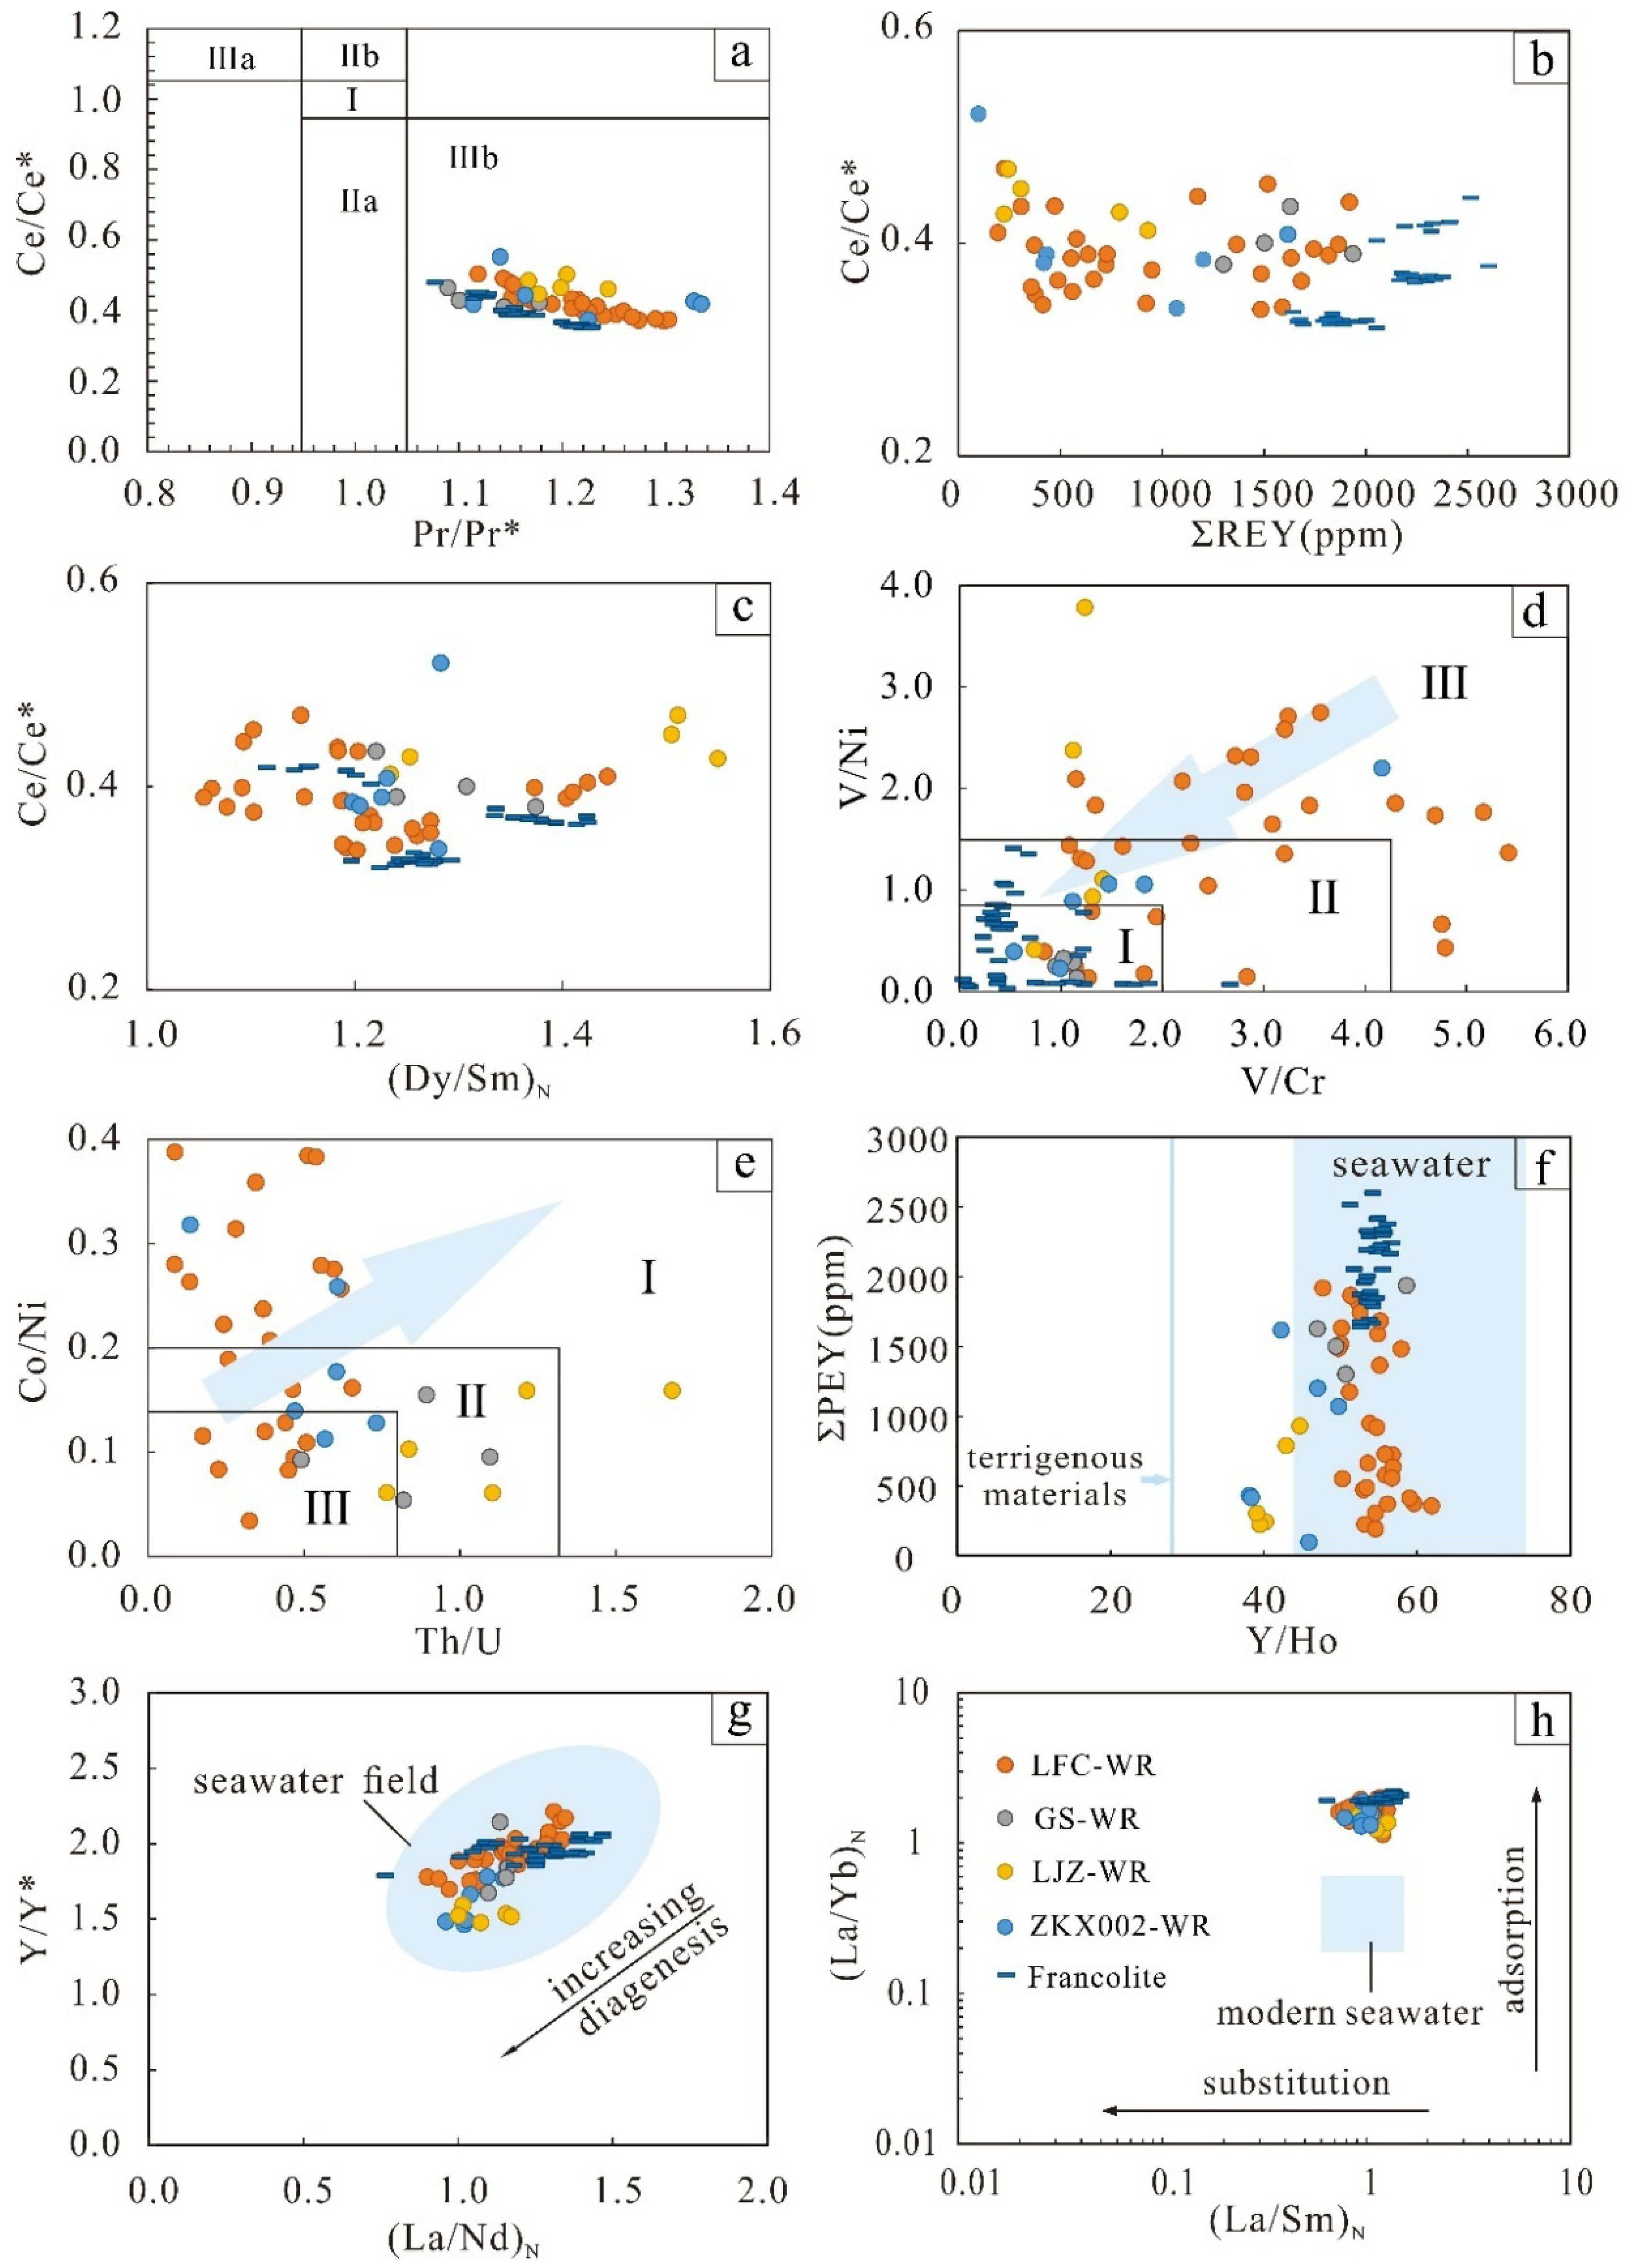
5.3. Redox Conditions
5.3.1. Ce Anomaly
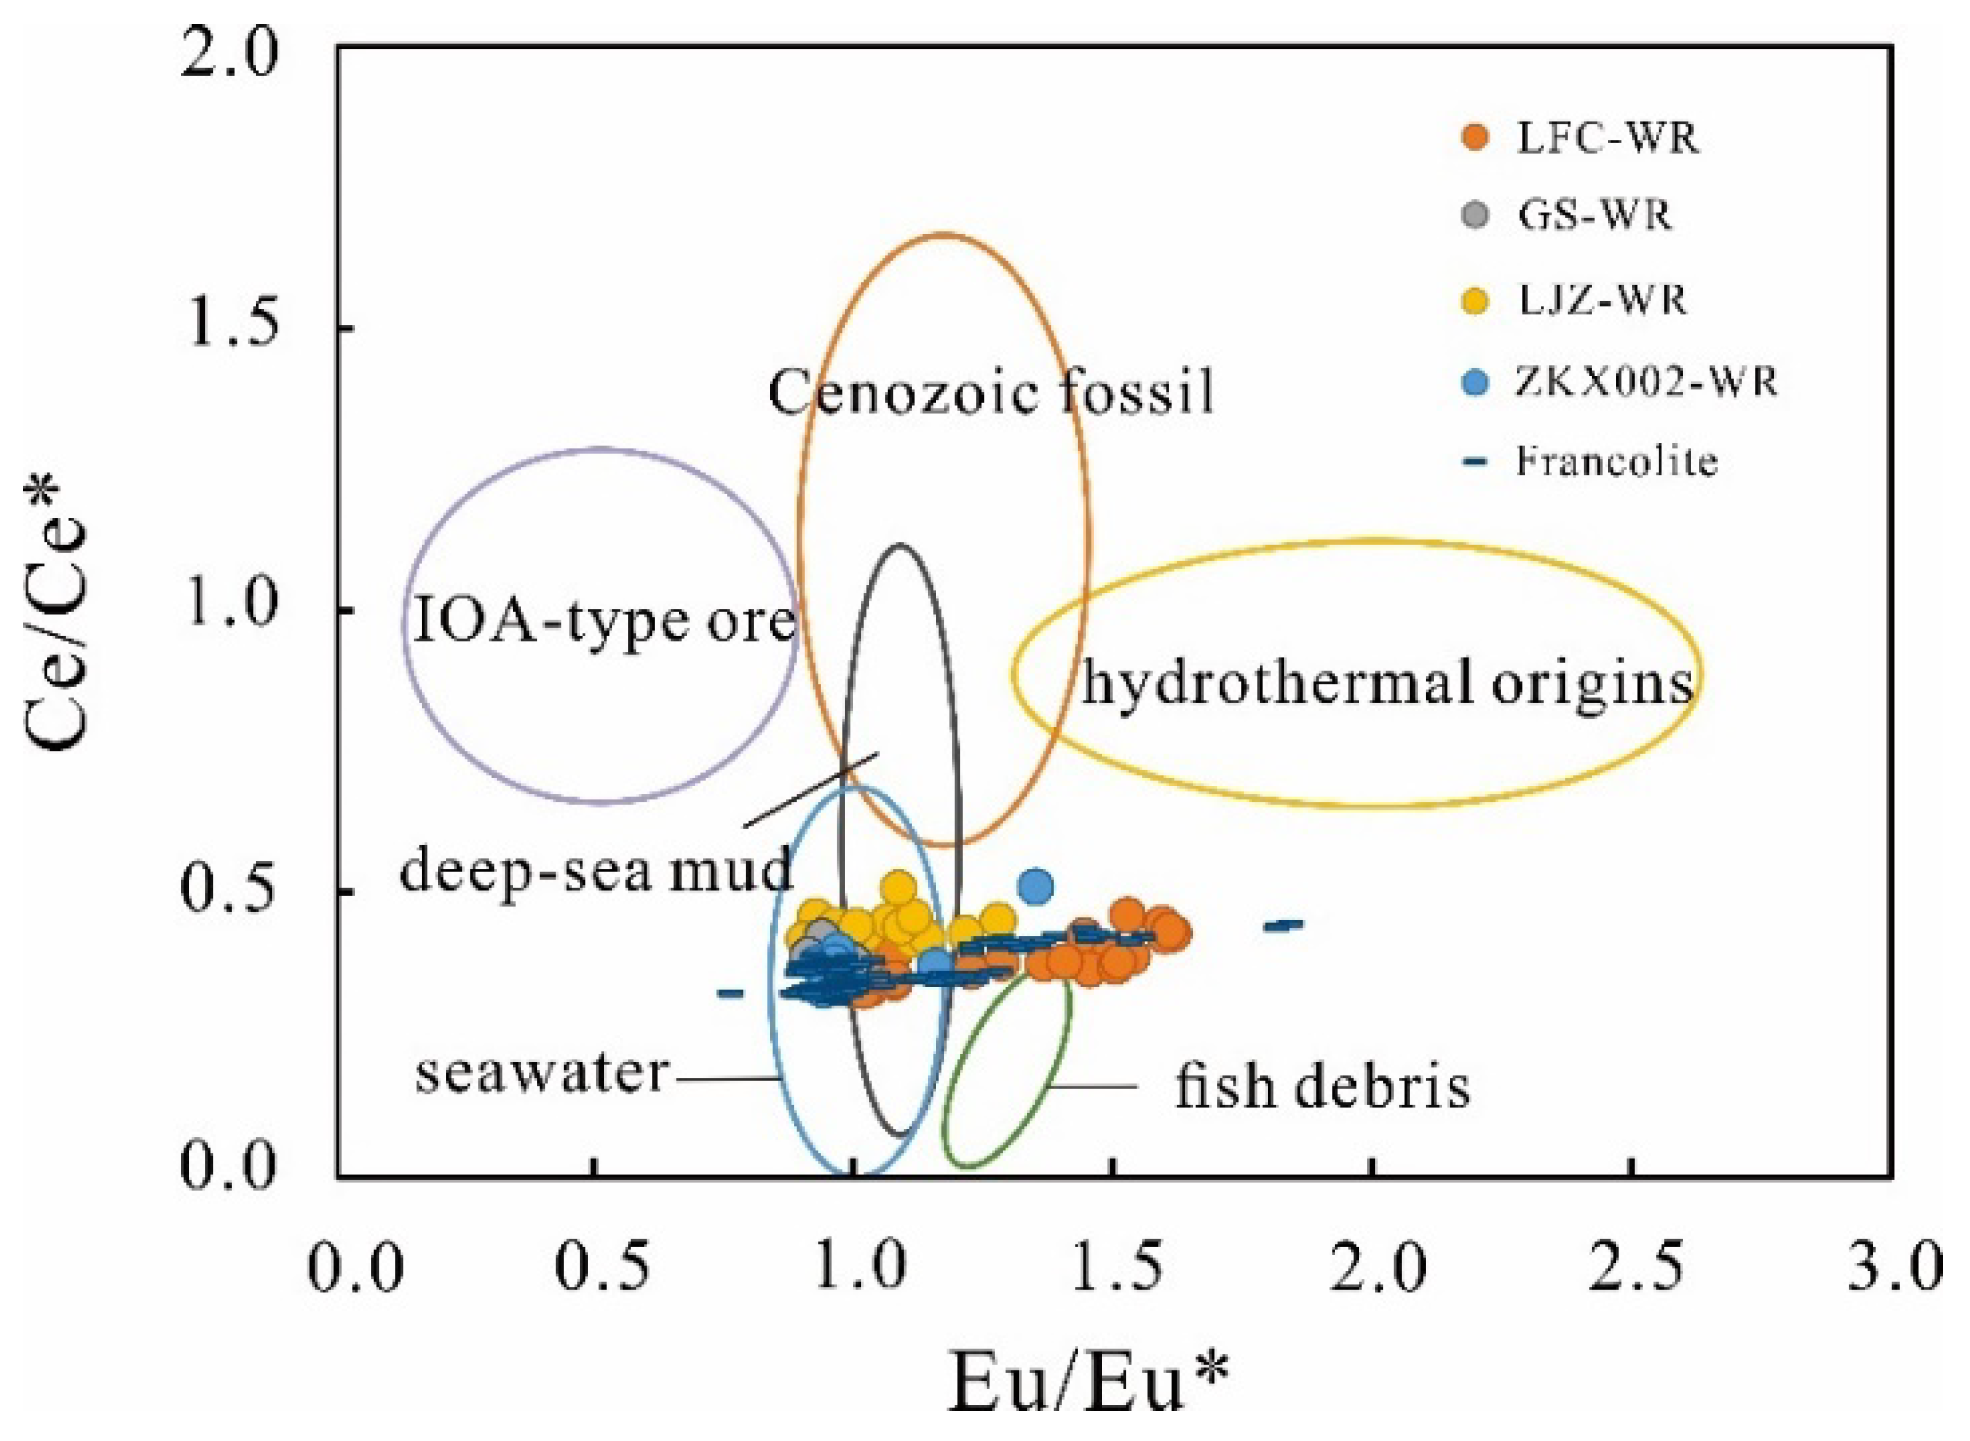
5.3.2. Eu Anomaly
5.3.3. Redox Sensitive Elements (RSEs)
5.4. The Origin of the REY
5.4.1. The Sources of REY
5.4.2. The Enrichment Process of REY
6. Conclusions
- The REY in the Zhijin deposit are mainly contained in francolite. The phosphorites and francolite show a hat-shaped pattern characterized by MREE enrichment and HREE depletion, indicating the influence of diagenetic processes.
- Ce anomalies indicate a primary oxic sedimentation condition. The Eu anomalies and RSEs indicate fluctuating depositional conditions during diagenesis, which can promote the enrichment of REY.
- We propose that the main origin of REY in the Zhijin phosphorites is seawater, though terrigenous materials may have a minor contribution. The REY were absorbed by francolite during primary sedimentation, transportation, and early diagenesis. Hydrothermal fluids have a minor influence on REY concentrations.
Supplementary Materials
Author Contributions
Funding
Data Availability Statement
Conflicts of Interest
References
- Emsbo, P.; McLaughlin, P.I.; Breit, G.N.; du Bray, E.A.; Koenig, A.E. Rare earth elements in sedimentary phosphate deposits: Solution to the global REE crisis? Gondwana Res. 2015, 27, 776–785. [Google Scholar] [CrossRef] [Green Version]
- Dushyantha, N.; Batapola, N.; Ilankoon, I.M.S.K.; Rohitha, S.; Premasiri, R.; Abeysinghe, B.; Ratnayake, N.; Dissanayake, K. The story of rare earth elements (REEs): Occurrences, global distribution, genesis, geology, mineralogy and global production. Ore Geol. Rev. 2020, 122, 103521. [Google Scholar] [CrossRef]
- Hein, J.; Koschinsky, A.; Mikesell, M.; Mizell, K.; Glenn, C.; Wood, R. Marine Phosphorites as Potential Resources for Heavy Rare Earth Elements and Yttrium. Minerals 2016, 6, 88. [Google Scholar] [CrossRef] [Green Version]
- Jiang, X.; Feng, L. Comprehensive utilization of associated rare earth element resources in phosphate rocks. China Popul. Resour. Environ. 2011, 21, 195–199, (In Chinese with English Abstract). [Google Scholar]
- Fakhry, A.A.; Eid, K.A.; Mahdy, A.A. Distribution of REE in shales overlying the Abu Tartur phosphorite deposit, western desert, Egypt. J. Alloys Compd. 1998, 275, 929–933. [Google Scholar] [CrossRef]
- Awadalla, G.S. Geochemistry and microprobe investigations of Abu Tartur REE-bearing phosphorite, Western Desert, Egypt. J. Afr. Earth Sci. 2010, 57, 431–443. [Google Scholar] [CrossRef]
- Tanaka, E.; Nakamura, K.; Yasukawa, K.; Mimura, K.; Fujinaga, K.; Iijima, K.; Nozaki, T.; Kato, Y. Chemostratigraphy of deep-sea sediments in the western North Pacific Ocean: Implications for genesis of mud highly enriched in rare-earth elements and yttrium. Ore Geol. Rev. 2020, 119, 103392. [Google Scholar] [CrossRef]
- Kato, Y.; Fujinaga, K.; Nakamura, K.; Takaya, Y.; Kitamura, K.; Ohta, J.; Toda, R.; Nakashima, T.; Iwamori, H. Deep-sea mud in the Pacific Ocean as a potential resource for rare-earth elements. Nat. Geosci. 2011, 4, 535–539. [Google Scholar] [CrossRef]
- Iijima, K.; Yasukawa, K.; Fujinaga, K.; Nakamura, K.; Machida, S.; Takaya, Y.; Ohta, J.; Haraguchi, S.; Nishio, Y.; Usui, Y.; et al. Discovery of extremely REY-rich mud in the western North Pacific Ocean. Geochem. J. 2016, 50, 557–573. [Google Scholar] [CrossRef] [Green Version]
- Ye, L. Phosphorites in China; Science Press: Beijing, China, 1989. (In Chinese) [Google Scholar]
- Meng, Q.T.; Lan, A.P.; Ye, C. A Report on Integrated Exploration of Phosphorus (Rare Earth) Deposits in Zhijin Area, Guizhou Province; Fourth Geological Brigade of Guizhou Geological and Mineral Exploration and Development Bureau: Guizhou, China, 2014. (In Chinese) [Google Scholar]
- Yang, J.; He, T. Zhijin county Guizhou province Xinhua containing rare earth phosphate rock deposit geological characteristics and reasons discussed. Geol. Chem. Miner. 2013, 35, 27–33, (In Chinese with English Abstract). [Google Scholar]
- Wang, J.; Zhang, J. Study on characteristics of material composition and ore REE of Zhijin dolomitic phosphorite. China Non-Met. Min. Ind. Her. 2011, 87, 25–59, (In Chinese with English Abstract). [Google Scholar]
- Liu, S.; Hu, R.; Zhou, G.; Gong, G.; Jin, Z.; Zheng, W. Study on the mineral Composition of the clastic phosphate in Zhijin phosphate deposits, China. Acta Mineral. Sin. 2008, 28, 244–250, (In Chinese with English Abstract). [Google Scholar]
- Zhang, Y.; Gong, M.; Li, H. Occurrence of REE in rare earth phosphorite in Zhijin area, Guizhou. J. Earth Sci. Environ. 2007, 29, 362–368, (In Chinese with English Abstract). [Google Scholar]
- Xie, H.; Zhu, L. Existing state and distribution regularity of rare earth elements from early Cambrian phosphorite in Guizhou. J. Chin. Soc. Rare Earths 2012, 30, 620–627, (In Chinese with English Abstract). [Google Scholar]
- Chen, J.; Zhang, J.; Yang, R. Mode of occurrence of rare earth elements in posphorite in Zhijin county, Guizhou province, China. Acta Mineral. Sin. 2010, 30, 123–129, (In Chinese with English Abstract). [Google Scholar]
- Zhang, J.; Sun, C.; Gong, M.; Zhang, Q.; Chen, D.; Cheng, J. Geochemical characteristics and occurrence states of the REE elements of the phosphorite in Xinhua, Zhijin, Guizhou. Chin. Rare Earths 2007, 28, 75–79, (In Chinese with English Abstract). [Google Scholar]
- Liu, X.Q.; Zhang, H.; Tang, Y.; Liu, Y.L. REE Geochemical Characteristic of Apatite: Implications for Ore Genesis of the Zhijin Phosphorite. Minerals 2020, 10, 1012. [Google Scholar]
- Liu, J.; Wen, H.; Zhang, Y.; Fan, H.; Zhu, C. Mo isotopic signature of non euxinic sediments and its paleo oceanic significance. Acta Mineral. Sin. 2015, 89, 72–73, (In Chinese with English Abstract). [Google Scholar]
- Liu, J.; Wen, H.; Liu, S.; Fan, H.; Zhang, Y. Structures and sedimentary environment of phosphorite in Zhijin county, Guizhou province, China. Acta Mineral. Sin. 2016, 36, 253–259, (In Chinese with English Abstract). [Google Scholar]
- Yang, H.; Zhao, Z.; Xia, Y.; Xiao, J. REY enrichment mechanisms in the early Cambrian phosphorite from South China. Sediment. Geol. 2021, 426, 106041. [Google Scholar] [CrossRef]
- Wang, M.; Sun, X.; Ma, M. Rare earth elements geochemistry and genesis of Xinhua large-size phosphorite deposit in western Guizhou. Miner. Depos. 2004, 23, 484–493, (In Chinese with English Abstract). [Google Scholar]
- Guo, H.; Xia, Y.; He, S.; Xie, Z.; Wei, D.; Lei, B. Geochemical characteristics of Zhijin phosphorite type rare-earth deposit, Guizhou province, China. Acta Mineral. Sin. 2017, 37, 755–763, (In Chinese with English Abstract). [Google Scholar]
- Yang, H.; Xiao, J.; Xia, Y.; Xie, Z.; Tan, Q.; Xu, J.; He, S.; Wu, S.; Liu, X.; Gong, X. Phosphorite generative processes around the Precambrian-Cambrian boundary in South China: An integrated study of Mo and phosphate O isotopic compositions. Geosci. Front. 2021, 12, 101187. [Google Scholar] [CrossRef]
- Fan, H.; Wen, H.; Zhu, X. Marine redox conditions in the Early Cambrian ocean: Insights from the Lower Cambrian phosphorite deposits, South China. J. Earth Sci. 2016, 27, 282–296. [Google Scholar] [CrossRef]
- Zhang, H.; Fan, H.; Wen, H.; Han, T.; Zhou, T.; Xia, Y. Controls of discrepant REY enrichment in the early Cambrian phosphorites. Geochim. Cosmochim. Acta 2022, 324, 117–139. [Google Scholar] [CrossRef]
- Ilyin, A.V. Rare-earth geochemistry of ‘old’ phosphorites and probability of syngenetic precipitation and accumulation of phosphate. Chem. Geol. 1998, 144, 143–256. [Google Scholar] [CrossRef]
- Zhang, Z.; Jiang, Y.; Niu, H.; Xing, J.; Yan, S.; Li, A.; Weng, Q.; Zhao, X. Enrichment of rare earth elements in the early Cambrian Zhijin phosphorite deposit, SW China: Evidence from francolite micro-petrography and geochemistry. Ore Geol. Rev. 2021, 138, 104342. [Google Scholar] [CrossRef]
- Xing, J.Q.; Jiang, Y.H.; Xian, H.Y.; Zhang, Z.Y.; Yang, Y.P.; Tan, W.; Liang, X.L.; Niu, H.C.; He, H.P.; Zhu, J.X. Hydrothermal activity during the formation of REY-rich phosphorites in the early Cambrian Gezhongwu Formation, Zhijin, South China: A micro- and nano-scale mineralogical study. Ore Geol. Rev. 2021, 136, 104224. [Google Scholar] [CrossRef]
- Abedini, A.; Calagari, A.A. REEs geochemical characteristics of lower Cambrian phosphatic rocks in the Gorgan-Rasht Zone, northern Iran: Implications for diagenetic effects and depositional conditions. J. Afr. Earth Sci. 2017, 135, 115–124. [Google Scholar] [CrossRef]
- Guo, Q.; Shields, G.A.; Liu, C.; Strauss, H.; Zhu, M.; Pi, D.; Goldberg, T.; Yang, X. Trace element chemostratigraphy of two Ediacaran–Cambrian successions in South China: Implications for organosedimentary metal enrichment and silicification in the Early Cambrian. Palaeogeogr. Palaeoclim. Palaeoecol. 2007, 254, 194–216. [Google Scholar] [CrossRef]
- Shields, G.; Stille, P. Diagenetic constraints on the use of cerium anomalies as palaeoseawater redox proxies: An isotopic and REE study of Cambrian phosphorites. Chem. Geol. 2001, 175, 29–48. [Google Scholar] [CrossRef]
- Steiner, M.; Wallis, E.; Erdtmann, B.-D.; Zhao, Y.; Yang, R. Submarine-hydrothermal exhalative ore layers in black shales from South China and associated fossils Ð insights into a Lower Cambrian facies and bio-evolution. Palaeogeogr. Palaeoclimatol. Palaeoecol. 2001, 169, 191. [Google Scholar] [CrossRef]
- Chew, D.M.; Babechuk, M.G.; Cogné, N.; Mark, C.; O’Sullivan, G.J.; Henrichs, I.A.; Doepke, D.; McKenna, C.A. (LA,Q)-ICPMS trace-element analyses of Durango and McClure Mountain apatite and implications for making natural LA-ICPMS mineral standards. Chem. Geol. 2016, 435, 35–48. [Google Scholar] [CrossRef]
- Mao, T.; Yang, R. Micro-structural Characteristics and Composotion of the Small Shelly Fossils in Cambrian phosphorites, Zhijin, Guizhou. Acta Micropalaeontol. Sin. 2013, 30, 100–207. [Google Scholar]
- Zhang, J.; Zhang, Q.; Chen, D. REE geochemistry of the Xinhua REE-bearing phosphorus deposit, Zhijin county, Guizhou province. Geol. Prospect. 2004, 40, 41–44, (In Chinese with English Abstract). [Google Scholar]
- Duan, K.; Wang, D.; Xiong, X.; Lian, W.; Gao, P.; Wang, Y.; Zhang, Y. A review of a preliminary quantitative study and genetic analysis for rare earth elements of ionic adsorption state in phosphate ore deposit in Zhijin, Guizhou province. Rock Miner. Anal. 2014, 33, 118–125, (In Chinese with English Abstract). [Google Scholar]
- Liao, J.; Sun, X.; Li, D.; Sa, R.; Lu, Y.; Lin, Z.; Xu, L.; Zhan, R.; Pan, Y.; Xu, H. New insights into nanostructure and geochemistry of bioapatite in REE-rich deep-sea sediments: LA-ICP-MS, TEM, and Z-contrast imaging studies. Chem. Geol. 2019, 512, 58–68. [Google Scholar] [CrossRef]
- Hughes, J.M.; Rakovan, J.F. Structurally Robust, Chemically Diverse: Apatite and Apatite Supergroup Minerals. Elements 2015, 11, 165–170. [Google Scholar] [CrossRef]
- Zhu, B.; Jiang, S.Y.; Yang, J.H.; Pi, D.H.; Ling, H.F.; Chen, Y.Q. Rare earth element and Sr-Nd isotope geochemistry of phosphate nodules from the lower Cambrian Niutitang Formation, NW Hunan Province, South China. Palaeogeogr. Palaeoclim. Palaeoecol. 2014, 398, 132–143. [Google Scholar] [CrossRef]
- Garnit, H.; Bouhlel, S.; Barca, D.; Chtara, C. Application of LA-ICP-MS to sedimentary phosphatic particles from Tunisian phosphorite deposits: Insights from trace elements and REE into paleo-depositional environments. Chem. Erde-Geochem. 2012, 72, 127–139. [Google Scholar] [CrossRef]
- Bright, C.A.; Cruse, A.M.; Lyons, T.W.; MacLeod, K.G.; Glascock, M.D.; Ethington, R.L. Seawater rare-earth element patterns preserved in apatite of Pennsylvanian conodonts? Geochim. Cosmochim. Acta 2009, 73, 1609–1624. [Google Scholar] [CrossRef]
- Bau, M.; Dulski, P. Distribution of yttrium and rare-earth elements in the Penge and Kuruman iron-formations, Transvaal Supergroup, South Africa. Precambrian Res. 1996, 79, 37–55. [Google Scholar] [CrossRef]
- Zhang, J.; Yoshiyuki, N. Rare earth elements and yttrium in seawater: ICP-MS determinations in the East Caroline, Coral Sea, and South Fiji basins of the western South Pacific Ocean. Geochim. Cosmochim. Acta 1996, 60, 4631–4644. [Google Scholar] [CrossRef]
- Nozaki, Y.; Zhang, J.; Amakawa, H. The fractionation between Y and Ho in the marine environment. Earth Planet. Sci. Lett. 1997, 148, 329–340. [Google Scholar] [CrossRef]
- Nozaki, Y.; Alibo, D.S. Importance of vertical geochemical processes in controlling the oceanic profiles of dissolved rare earth elements in the northeastern Indian Ocean. Earth Planet. Sci. Lett. 2003, 205, 155–172. [Google Scholar] [CrossRef]
- Shields, G.A.; Webb, G.E. Has the REE composition of seawater changed over geological time? Chem. Geol. 2004, 204, 103–107. [Google Scholar] [CrossRef]
- Stéphanie, P.; Christophe, L.; Jean-Pierre, G.; Gilles, D.; Sheppar, S.M.F. Rare earth element contents of Jurassic fish and reptile teeth and their potential relation to seawater composition (Anglo-Paris Basin, France and England. Chem. Geol. 2002, 186, 1–16. [Google Scholar]
- Jiang, S.-Y.; Zhao, H.-X.; Chen, Y.-Q.; Yang, T.; Yang, J.-H.; Ling, H.-F. Trace and rare earth element geochemistry of phosphate nodules from the lower Cambrian black shale sequence in the Mufu Mountain of Nanjing, Jiangsu province, China. Chem. Geol. 2007, 244, 584–604. [Google Scholar] [CrossRef]
- Pi, D.-H.; Liu, C.-Q.; Shields-Zhou, G.A.; Jiang, S.-Y. Trace and rare earth element geochemistry of black shale and kerogen in the early Cambrian Niutitang Formation in Guizhou province, South China: Constraints for redox environments and origin of metal enrichments. Precambrian Res. 2013, 225, 218–229. [Google Scholar] [CrossRef]
- Xin, H.; Jiang, S.; Yang, J.; Wu, H.; Pi, D. Rare earth element geochemistry of phosphatic rocks in Neoproterozoic Ediacaran Doushantuo Formation in Hushan Section from the Yangtze Gorges Area, South China. J. Earth Sci. 2016, 27, 204–210. [Google Scholar] [CrossRef]
- Yang, H.Y.; Xiao, J.F.; Xia, Y.; Xie, Z.J.; Tan, Q.P.; Xu, J.B.; Guo, H.Y.; He, S.; Wu, S.W. Origin of the Ediacaran Weng’an and Kaiyang phosphorite deposits in the Nanhua basin, SW China. J. Asian Earth Sci. 2019, 182, 103931. [Google Scholar] [CrossRef]
- Laenen, B.; Hertogen, J.; Vandenberghe, N. The variation of the trace-element content of fossil biogenic apatite through eustatic sea-level cycles. Palaeogeogr. Palaeoclim. Palaeoecol. 1997, 132, 325–342. [Google Scholar] [CrossRef]
- Trotter, J.A.; Eggins, S.M. Chemical systematics of conodont apatite determined by laser ablation ICPMS. Chem. Geol. 2006, 233, 196–216. [Google Scholar] [CrossRef]
- Lumiste, K.; Mänd, K.; Bailey, J.; Paiste, P.; Lang, L.; Lepland, A.; Kirsimäe, K. REE+Y uptake and diagenesis in Recent sedimentary apatites. Chem. Geol. 2019, 525, 268–281. [Google Scholar] [CrossRef]
- Reynard, B.; Lecuyer, C.; Grandjean, P. Crystal-chemical controls on rare-earth element concentrations in fossil biogenic apatites and implications for paleoenvironmental reconstructions. Chem. Geol. 1999, 155, 233–241. [Google Scholar] [CrossRef]
- Byrne, R.H.; Liu, X.W.; Schijf, J. The influence of phosphate coprecipitation on rare earth distributions in natural waters. Geochim. Cosmochim. Acta 1996, 60, 3341–3346. [Google Scholar] [CrossRef]
- Rasmussen, B.; Buick, R.; Taylor, W.R. Removal of oceanic REE by authigenic precipitation of phosphatic minerals. Earth Planet. Sci. Lett. 1998, 164, 135–149. [Google Scholar] [CrossRef]
- Felitsyn, S.; Morad, S. REE patterns in latest Neoproterozoic–early Cambrian phosphate concretions and associated organic matter. Chem. Geol. 2002, 187, 257–265. [Google Scholar] [CrossRef]
- Wright, J.; Schrader, H.; Holser, W.T. Paleoredox Variations in Ancient Oceans Recorded by Rare-Earth Elements in Fossil Apatite. Geochim. Cosmochim. Acta 1987, 51, 631–644. [Google Scholar] [CrossRef]
- Tostevin, R.; Shields, G.A.; Tarbuck, G.M.; He, T.C.; Clarkson, M.O.; Wood, R.A. Effective use of cerium anomalies as a redox proxy in carbonate-dominated marine settings. Chem. Geol. 2016, 438, 146–162. [Google Scholar] [CrossRef] [Green Version]
- Bau, M.; Dulski, P. Comparing yttrium and rare earths in hydrothermal fluids from the Mid-Atlantic Ridge implications for Y and REE behaviour during near-vent mixing and for the YrHo ratio of Proterozoic seawater. Chem. Geol. 1999, 155, 77–90. [Google Scholar] [CrossRef]
- Lu, L.; Liu, Y.; Liu, H.; Zhao, Z.; Wang, C.; Xu, X. Geochemical and Geochronological Constraints on the Genesis of Ion-Adsorption-Type REE Mineralization in the Lincang Pluton, SW China. Minerals 2020, 10, 1116. [Google Scholar] [CrossRef]
- Khan, S.A.; Khan, K.F.; Dar, S.A. REE geochemistry of Early Cambrian phosphorites of Masrana and Kimoi blocks, Uttarakhand, India. Arab. J. Geosci. 2016, 9, 456. [Google Scholar] [CrossRef]
- Alibo, D.S.; Nozaki, Y. Rare earth elements in seawater: Particle association, shale-normalization, and Ce oxidation. Geochim. Cosmochim. Acta 1999, 63, 363–372. [Google Scholar] [CrossRef]
- German, C.R.; Elderfield, H. Application of the Ce Anomaly as a Paleoredox Indicator: The Ground Rules. Paleoceanography 1990, 5, 823–833. [Google Scholar] [CrossRef]
- Morad, S.; Felitsyn, S. Identification of primary Ce-anomaly signatures in fossil biogenic apatite: Implication for the Cambrian oceanic anoxia and phosphogenesis. Sediment. Geol. 2001, 143, 259–264. [Google Scholar] [CrossRef]
- Bau, M. Controls on the fractionation of isovalent trace elements in magmatic and aqueous systems: Evidence from Y/Ho, Zr/Hf, and lanthanide tetrad effect. Contrib. Mineral. Petrol. 1996, 123, 323–333. [Google Scholar] [CrossRef]
- Ross, D.J.K.; Bustin, R.M. Sediment geochemistry of the Lower Jurassic Gordondale Member, northeastern British Columbia. Bull. Can. Pet. Geol. 2006, 54, 337–365. [Google Scholar] [CrossRef]
- Webb, G.E.; Kamber, B.S. Rare earth elements in Holocene reefal microbialites: A new shallow seawater proxy. Geochim. Cosmochim. Acta 2000, 64, 1557–1565. [Google Scholar] [CrossRef]
- Debaar, H.J.W.; Bacon, M.P.; Brewer, P.G.; Bruland, K.W. Rare-Earth Elements in the Pacific and Atlantic Oceans. Geochim. Cosmochim. Acta 1985, 49, 1943–1959. [Google Scholar] [CrossRef]
- Kidder, D.L.; Krishnaswamy, R.; Mapes, R.H. Elemental mobility in phosphatic shales during concretion growth and implications for provenance analysis. Chem. Geol. 2003, 198, 335–353. [Google Scholar] [CrossRef]
- Yang, H.; Xiao, J.; Xia, Y.; Zhao, Z.; Xie, Z.; He, S.; Wu, S. Diagenesis of Ediacaran—early Cambrian phosphorite: Comparisons with recent phosphate sediments based on LA-ICP-MS and EMPA. Ore Geol. Rev. 2022, 144, 104813. [Google Scholar] [CrossRef]
- Chang, H.; Chu, X.; Feng, L.-J.; Huang, J.; Zhang, Q. Redox Sensitive Trace Elements as Paleoenvironments Proxies. Geol. Rev. 2009, 55, 91–99. [Google Scholar]
- Lewan, M.D.; Maynard, J.B. Factors Controlling Enrichment of Vanadium and Nickel in the Bitumen of Organic Sedimentary-Rocks. Geochim. Cosmochim. Acta 1982, 46, 2547–2560. [Google Scholar] [CrossRef]
- Jones, B.; Manning, D.A.C. Comparison of Geochemical Indexes Used for the Interpretation of Palaeoredox Conditions in Ancient Mudstones. Chem. Geol. 1994, 111, 111–129. [Google Scholar] [CrossRef]
- Lewan, M.D. Factors Controlling the Proportionality of Vanadium to Nickel in Crude Oils. Geochim. Cosmochim. Acta 1984, 48, 2231–2238. [Google Scholar] [CrossRef]
- Kimura, H.; Watanabe, Y. Oceanic anoxia at the Precambrian-Cambrian boundary. Geology 2001, 29, 995–998. [Google Scholar] [CrossRef]
- Xin, H.; Jiang, S.-Y.; Yang, J.-H.; Wu, H.-P.; Pi, D.-H. Rare earth element and Sr–Nd isotope geochemistry of phosphatic rocks in Neoproterozoic Ediacaran Doushantuo Formation in Zhangcunping section from western Hubei Province, South China. Palaeogeogr. Palaeoclim. Palaeoecol. 2015, 440, 712–724. [Google Scholar] [CrossRef]
- Bau, M.; Dulski, P.; Moller, P. Yttrium and Holmium in South-Pacific Seawater—Vertical-Distribution and Possible Fractionation Mechanisms. Chem. Erde-Geochem. 1995, 55, 1–16. [Google Scholar]
- Pack, A.; Russell, S.S.; Shelley, J.M.G.; van Zuilen, M. Geo- and cosmochemistry of the twin elements yttrium and holmium. Geochim. Cosmochim. Acta 2007, 71, 4592–4608. [Google Scholar] [CrossRef]
- Bellanca, A.; Masetti, D.; Neri, R. Rare earth elements in limestone/marlstone couplets from the Albian-Cenomanian Cismon section (Venetian region, northern Italy): Assessing REE sensitivity to environmental changes. Chem. Geol. 1997, 141, 141–152. [Google Scholar] [CrossRef]
- de Baar, H.J.W.; German, C.R.; Elderfield, H.; van Gaans, P. Rare earth element distributions in anoxic waters of the Cariaco Trench. Geochim. Cosmochim. Acta 1988, 52, 1203–1219. [Google Scholar] [CrossRef]
- Fazio, A.M.; Scasso, R.A.; Castro, L.N.; Carey, S. Geochemistry of rare earth elements in early-diagenetic miocene phosphatic concretions of Patagonia, Argentina: Phosphogenetic implications. Deep. Sea Res. Part II Top. Stud. Oceanogr. 2007, 54, 1414–1432. [Google Scholar] [CrossRef]
- Zhang, J.; Amakaw, H.; Nozak, Y. The comparative behaviors of Yttrium and Lanthanides in the seawater of the North Pacific. Geophys. Res. Lett. 1994, 21, 2677–2680. [Google Scholar] [CrossRef]
- Kon, Y.; Hoshino, M.; Sanematsu, K.; Morita, S.; Tsunematsu, M.; Okamoto, N.; Yano, N.; Tanaka, M.; Takagi, T. Geochemical Characteristics of Apatite in Heavy REE-rich Deep-Sea Mud from Minami-Torishima Area, Southeastern Japan. Resour. Geol. 2014, 64, 47–57. [Google Scholar] [CrossRef]
- Bernat, M. Les isotopes de l’uranium et du thorium et les terres rares dans l’environnement marin. Cuh. ORSTOM Sér. GPol. 1975, 7, 65–83. [Google Scholar]
- Frietsch, R.; Perdahl, J.A. Rare-Earth Elements in Apatite and Magnetite in Kiruna-Type Iron-Ores and Some Other Iron-Ore Types. Ore Geol. Rev. 1995, 9, 489–510. [Google Scholar] [CrossRef]
- Mokhtari, M.A.A.; Zadeh, G.H.; Emami, M.H. Genesis of iron-apatite ores in Posht-e-Badam Block (Central Iran) using REE geochemistry. J. Earth Syst. Sci. 2013, 122, 795–807. [Google Scholar] [CrossRef] [Green Version]
- Stalder, M.; Rozendaal, A. Apatite nodules as an indicator of depositional environment and ore genesis for the Mesoproterozoic Broken Hill-type Gamsberg Zn?Pb deposit, Namaqua Province, South Africa. Miner. Depos. 2004, 39, 189–203. [Google Scholar] [CrossRef]
- Halpin, K.M. The Characteristics and Origin of the Hoidas Lake REE Deposit; University of Saskatchewan Saskatoon: Saskatoon, SK, Canada, 2010. [Google Scholar]
- Shields, G.A. A normalised seawater strontium isotope curve: Possible implications for Neoproterozoic-Cambrian weathering rates and the further oxygenation of the Earth. eEarth 2007, 2, 35–42. [Google Scholar] [CrossRef] [Green Version]
- Halverson, G.P.; Wade, B.P.; Hurtgen, M.T.; Barovich, K.M. Neoproterozoic chemo stratigraphy. Precambrian Res. 2010, 182, 337–350. [Google Scholar] [CrossRef]
- Goldberg, T.; Strauss, H.; Guo, Q.; Liu, C. Reconstructing marine redox conditions for the Early Cambrian Yangtze Platform: Evidence from biogenic sulphur and organic carbon isotopes. Palaeogeogr. Palaeoclimatol. Palaeoecol. 2007, 254, 175–193. [Google Scholar] [CrossRef]


| Stratum | Sample | P2O5 | CaO | F | MgO | SiO2 | Al2O3 | TFe2O3 | MnO | K2O | Na2O | LOI | |
|---|---|---|---|---|---|---|---|---|---|---|---|---|---|
| Upper Gezhongwu | LFC1-8 | Phosphorite | 30.70 | 43.70 | 3.10 | 0.54 | 11.96 | 2.49 | 1.30 | 0.01 | 0.80 | 0.06 | 5.45 |
| LFC1-7 | Phosphatic dolomite | 5.36 | 27.20 | 0.60 | 13.05 | 16.92 | 0.83 | 4.09 | 0.46 | 0.29 | 0.03 | 30.62 | |
| LFC1-6 | Phosphorite | 26.70 | 40.60 | 2.70 | 0.97 | 16.35 | 2.02 | 2.88 | 0.06 | 0.68 | 0.04 | 7.03 | |
| LFC1-5 | Phosphatic dolomite | 3.91 | 26.40 | 0.50 | 13.85 | 13.83 | 0.96 | 6.10 | 0.32 | 0.31 | 0.01 | 32.76 | |
| LFC1-2 | Phosphorite | 20.40 | 35.20 | 2.30 | 1.62 | 19.81 | 2.50 | 6.10 | 0.14 | 0.81 | 0.05 | 10.82 | |
| LFC1-1 | Phosphatic dolomite | 8.64 | 26.80 | 1.00 | 10.30 | 24.19 | 0.93 | 3.48 | 0.27 | 0.33 | 0.03 | 23.99 | |
| LFC-30 | Phosphorite | 32.80 | 44.70 | 3.20 | 0.51 | 11.80 | 2.72 | 1.94 | 0.02 | 0.81 | 0.07 | 2.63 | |
| LFC-29 | Phosphatic dolomite | 3.01 | 28.40 | 0.40 | 16.65 | 11.22 | 0.61 | 1.56 | 0.24 | 0.21 | 0.03 | 37.60 | |
| LFC-27 | Phosphorite | 30.70 | 42.90 | 3.30 | 0.68 | 13.00 | 3.11 | 2.69 | 0.02 | 1.02 | 0.08 | 3.41 | |
| LFC-25 | Phosphorite | 31.00 | 43.30 | 3.20 | 0.68 | 12.86 | 2.07 | 2.93 | 0.03 | 0.75 | 0.06 | 3.37 | |
| LFC-24 | Phosphatic dolomite | 11.45 | 30.20 | 1.20 | 10.05 | 16.47 | 1.34 | 4.45 | 0.23 | 0.43 | 0.04 | 23.70 | |
| Lower Gezhongwu | LFC-22 (2) | Phosphorite | 32.70 | 45.40 | 3.40 | 0.17 | 15.19 | 0.52 | 0.96 | 0.04 | 0.17 | 0.05 | 1.90 |
| LFC-22 (1) | Phosphatic dolomite | 11.90 | 16.15 | 1.10 | 0.11 | 66.02 | 0.63 | 2.52 | 0.17 | 0.16 | 0.03 | 1.01 | |
| LFC-21 (2) | Phosphorite | 31.80 | 44.20 | 3.20 | 0.29 | 13.18 | 1.07 | 3.46 | 0.27 | 0.36 | 0.05 | 2.54 | |
| LFC-20 | Phosphatic dolomite | 9.79 | 33.80 | 1.10 | 13.00 | 8.52 | 0.31 | 2.16 | 0.28 | 0.12 | 0.03 | 31.15 | |
| LFC-19 | Phosphatic dolomite | 14.55 | 38.50 | 1.50 | 10.75 | 4.42 | 0.49 | 2.37 | 0.40 | 0.18 | 0.05 | 27.25 | |
| LFC-18 (1) | Phosphorite | 35.60 | 49.10 | 0.90 | 0.22 | 8.47 | 0.55 | 1.33 | 0.13 | 0.21 | 0.07 | 2.61 | |
| LFC-17 | Phosphatic dolomite | 7.95 | 32.30 | 0.90 | 14.30 | 6.39 | 0.36 | 3.55 | 0.33 | 0.13 | 0.03 | 33.69 | |
| LFC-16 | Phosphorite | 22.70 | 42.80 | 2.40 | 7.67 | 5.80 | 0.39 | 0.74 | 0.07 | 0.15 | 0.07 | 18.06 | |
| LFC-15 | Phosphatic dolomite | 17.60 | 37.10 | 2.00 | 10.00 | 5.92 | 0.73 | 1.43 | 0.11 | 0.25 | 0.05 | 23.25 | |
| LFC-14 | Phosphatic dolomite | 13.50 | 37.10 | 1.40 | 12.45 | 6.17 | 0.26 | 0.74 | 0.09 | 0.10 | 0.05 | 28.44 | |
| LFC-13 | Phosphatic dolomite | 7.41 | 33.40 | 0.80 | 15.70 | 6.26 | 0.28 | 0.66 | 0.10 | 0.11 | 0.03 | 35.50 | |
| LFC-12 (2) | Phosphatic dolomite | 11.00 | 36.10 | 1.30 | 14.25 | 4.99 | 0.28 | 0.74 | 0.09 | 0.11 | 0.05 | 32.01 | |
| LFC-12 (1) | Phosphorite | 35.80 | 52.20 | 3.50 | 1.29 | 2.26 | 0.22 | 0.50 | 0.02 | 0.10 | 0.11 | 4.71 | |
| LFC-11 | Phosphorite | 22.70 | 39.80 | 2.40 | 5.79 | 15.09 | 0.58 | 0.50 | 0.05 | 0.21 | 0.06 | 13.78 | |
| LFC-10 | Phosphatic dolomite | 8.63 | 34.00 | 1.00 | 15.10 | 6.31 | 0.32 | 0.54 | 0.10 | 0.12 | 0.03 | 34.16 | |
| LFC-9 (1) | Phosphorite | 37.50 | 52.40 | 3.50 | 0.19 | 5.08 | 0.38 | 0.36 | 0.02 | 0.14 | 0.05 | 2.19 | |
| LFC-8 (2) | Phosphatic dolomite | 14.65 | 36.20 | 1.60 | 10.90 | 10.74 | 0.55 | 0.66 | 0.07 | 0.20 | 0.05 | 25.00 | |
| LFC-7 | Phosphorite | 38.50 | 53.80 | 4.10 | 0.18 | 1.94 | 0.38 | 0.55 | 0.02 | 0.15 | 0.11 | 2.24 | |
| LFC-6 | Phosphatic dolomite | 8.17 | 33.00 | 0.90 | 15.00 | 8.29 | 0.54 | 0.78 | 0.10 | 0.18 | 0.04 | 33.53 | |
| Upper Gezhongwu | GS-13 | Phosphorite | 32.50 | 41.20 | 3.20 | 0.75 | 9.47 | 3.13 | 5.58 | 0.02 | 1.04 | 0.14 | 7.43 |
| GS-10 | Phosphorite | 34.80 | 47.60 | 3.50 | 0.38 | 5.32 | 2.53 | 1.95 | 0.02 | 0.70 | 0.14 | 3.06 | |
| GS-6 | Phosphorite | 29.80 | 39.50 | 3.10 | 0.70 | 19.45 | 2.85 | 1.86 | 0.01 | 0.98 | 0.13 | 3.07 | |
| Lower Gezhongwu | LJZ-5 | Phosphatic dolomite | 2.44 | 43.40 | 0.50 | 6.05 | 8.52 | 0.74 | 0.47 | 0.05 | 0.28 | <0.01 | 29.90 |
| LJZ-12 | Phosphatic dolomite | 1.86 | 30.60 | 0.30 | 17.30 | 7.32 | 0.43 | 0.85 | 0.14 | 0.17 | <0.01 | 41.08 | |
| LJZ-17 | Phosphatic dolomite | 3.84 | 27.00 | 0.50 | 15.30 | 14.25 | 1.66 | 0.89 | 0.08 | 0.72 | <0.01 | 34.80 | |
| LJZ-23 | Phosphatic dolomite | 12.95 | 15.30 | 1.30 | 1.15 | 46.80 | 9.36 | 3.29 | <0.01 | 4.35 | 0.09 | 4.46 | |
| LJZ-27 | Phosphatic dolomite | 10.10 | 13.25 | 1.30 | 1.29 | 56.50 | 9.38 | 0.93 | <0.01 | 4.52 | 0.10 | 3.09 | |
| Lower Gezhongwu | ZKX002-520.5 | Phosphorite | 26.40 | 36.80 | 2.70 | 0.52 | 22.40 | 2.25 | 3.75 | 0.03 | 0.74 | 0.11 | 3.88 |
| ZKX002-523 | Phosphorite | 18.55 | 25.20 | 1.90 | 0.38 | 44.50 | 1.86 | 2.81 | 0.04 | 0.58 | 0.08 | 3.82 | |
| ZKX002-527S | Phosphorite | 26.30 | 41.20 | 2.70 | 3.11 | 16.70 | 0.47 | 1.01 | 0.09 | 0.15 | 0.12 | 8.25 | |
| ZKX002-527Q | Phosphatic dolomite | 9.87 | 31.10 | 1.00 | 12.05 | 13.40 | 0.32 | 2.48 | 0.32 | 0.10 | 0.03 | 27.28 | |
| ZKX002-528.5 | Phosphatic dolomite | 9.76 | 31.80 | 1.10 | 12.45 | 10.85 | 0.99 | 2.28 | 0.34 | 0.28 | 0.02 | 28.31 | |
| ZKX002-531Q | Phosphatic dolomite | 2.91 | 31.10 | 0.40 | 18.85 | 2.91 | 0.38 | 0.73 | 0.15 | 0.12 | <0.01 | 41.74 |
| Stratum | Sample | La | Ce | Pr | Nd | Sm | Eu | Gd | Tb | Dy | Y | Ho | Er | Tm | Yb | Lu | ΣREY | |
|---|---|---|---|---|---|---|---|---|---|---|---|---|---|---|---|---|---|---|
| Upper Gezhongwu | LFC1-8 | Phosphorite | 351.00 | 293.00 | 69.70 | 335.00 | 62.60 | 23.12 | 71.09 | 9.90 | 58.20 | 582.00 | 12.20 | 30.30 | 3.37 | 14.90 | 1.87 | 1918.24 |
| LFC1-7 | Phosphatic dolomite | 57.50 | 45.80 | 10.60 | 50.20 | 9.13 | 3.30 | 10.17 | 1.54 | 8.63 | 98.80 | 1.81 | 4.76 | 0.52 | 2.74 | 0.33 | 305.84 | |
| LFC1-6 | Phosphorite | 270.00 | 238.00 | 55.40 | 267.00 | 51.50 | 18.12 | 54.64 | 7.92 | 44.60 | 461.00 | 9.21 | 23.50 | 2.52 | 12.00 | 1.51 | 1516.93 | |
| LFC1-5 | Phosphatic dolomite | 40.20 | 35.30 | 7.69 | 37.20 | 7.14 | 2.41 | 7.62 | 1.15 | 6.44 | 71.30 | 1.34 | 3.43 | 0.40 | 2.11 | 0.27 | 224.00 | |
| LFC1-2 | Phosphorite | 204.00 | 178.00 | 43.20 | 210.00 | 41.00 | 14.57 | 43.58 | 5.94 | 35.20 | 360.00 | 7.03 | 17.90 | 1.99 | 9.33 | 1.20 | 1172.94 | |
| LFC1-1 | Phosphatic dolomite | 89.50 | 71.60 | 16.60 | 78.70 | 14.30 | 4.69 | 16.06 | 2.26 | 13.30 | 149.00 | 2.81 | 7.44 | 0.78 | 4.05 | 0.51 | 471.60 | |
| LFC-30 | Phosphorite | 367.00 | 245.00 | 59.40 | 275.00 | 48.60 | 10.86 | 56.82 | 8.13 | 53.60 | 623.00 | 11.90 | 32.30 | 3.80 | 18.70 | 2.52 | 1816.63 | |
| LFC-29 | Phosphatic dolomite | 39.10 | 26.80 | 6.00 | 28.20 | 4.78 | 1.15 | 5.76 | 0.88 | 5.42 | 65.50 | 1.20 | 3.41 | 0.43 | 2.53 | 0.33 | 191.48 | |
| LFC-27 | Phosphorite | 378.00 | 264.00 | 63.60 | 302.00 | 50.80 | 11.73 | 60.54 | 8.83 | 54.80 | 606.00 | 11.80 | 31.20 | 3.36 | 15.70 | 1.95 | 1864.31 | |
| LFC-25 | Phosphorite | 357.00 | 244.00 | 58.80 | 277.00 | 47.30 | 11.04 | 54.60 | 8.11 | 52.40 | 573.00 | 10.90 | 28.50 | 3.12 | 15.30 | 1.80 | 1742.87 | |
| LFC-24 | Phosphatic dolomite | 123.00 | 82.30 | 18.50 | 85.20 | 14.30 | 3.57 | 16.83 | 2.56 | 16.00 | 195.00 | 3.49 | 9.41 | 1.10 | 5.42 | 0.68 | 577.36 | |
| Lower Gezhongwu | LFC-22 (2) | Phosphorite | 328.00 | 230.00 | 59.30 | 293.00 | 51.80 | 14.82 | 56.11 | 8.21 | 48.40 | 490.00 | 9.77 | 25.10 | 2.77 | 13.10 | 1.64 | 1632.02 |
| LFC-22 (1) | Phosphatic dolomite | 110.00 | 78.60 | 20.70 | 95.60 | 17.80 | 5.48 | 19.75 | 2.81 | 16.60 | 167.00 | 3.32 | 8.38 | 0.93 | 4.46 | 0.60 | 552.03 | |
| LFC-21 (2) | Phosphorite | 300.00 | 205.00 | 55.70 | 263.00 | 46.00 | 12.61 | 50.33 | 7.32 | 43.90 | 453.00 | 9.10 | 23.40 | 2.55 | 12.70 | 1.50 | 1486.11 | |
| LFC-20 | Phosphatic dolomite | 102.00 | 66.00 | 17.60 | 81.10 | 14.10 | 3.05 | 15.17 | 2.31 | 13.50 | 156.00 | 2.92 | 7.68 | 0.86 | 4.32 | 0.53 | 487.14 | |
| LFC-19 | Phosphatic dolomite | 142.00 | 90.70 | 23.70 | 109.00 | 18.60 | 4.15 | 20.26 | 3.05 | 18.60 | 210.00 | 3.92 | 10.40 | 1.17 | 6.05 | 0.73 | 662.32 | |
| LFC-18 (1) | Phosphorite | 277.00 | 203.00 | 51.30 | 236.00 | 43.50 | 15.21 | 52.18 | 6.62 | 37.30 | 402.00 | 7.29 | 19.20 | 2.06 | 10.40 | 1.21 | 1364.27 | |
| LFC-17 | Phosphatic dolomite | 75.10 | 53.70 | 13.30 | 60.30 | 12.10 | 4.32 | 14.19 | 1.84 | 10.10 | 114.00 | 2.03 | 5.46 | 0.56 | 3.08 | 0.37 | 370.44 | |
| LFC-16 | Phosphorite | 196.00 | 131.00 | 34.20 | 159.00 | 29.20 | 10.03 | 35.52 | 4.52 | 25.30 | 294.00 | 5.46 | 13.80 | 1.60 | 7.95 | 0.94 | 948.52 | |
| LFC-15 | Phosphatic dolomite | 151.00 | 102.00 | 26.20 | 118.00 | 22.10 | 7.82 | 26.61 | 3.39 | 18.70 | 225.00 | 3.96 | 10.80 | 1.21 | 6.22 | 0.71 | 723.71 | |
| LFC-14 | Phosphatic dolomite | 149.00 | 104.00 | 26.20 | 120.00 | 22.00 | 7.85 | 26.76 | 3.45 | 19.90 | 225.00 | 4.03 | 10.80 | 1.21 | 6.34 | 0.73 | 727.27 | |
| LFC-13 | Phosphatic dolomite | 130.00 | 91.30 | 23.20 | 106.00 | 20.40 | 6.61 | 23.64 | 3.05 | 16.90 | 194.00 | 3.41 | 9.45 | 1.02 | 5.35 | 0.64 | 634.97 | |
| LFC-12 (2) | Phosphatic dolomite | 81.50 | 48.50 | 12.80 | 56.10 | 9.80 | 2.46 | 11.64 | 1.68 | 9.70 | 127.00 | 2.13 | 5.84 | 0.73 | 3.98 | 0.46 | 374.31 | |
| LFC-12 (1) | Phosphorite | 352.00 | 208.00 | 58.40 | 260.00 | 45.70 | 10.55 | 53.82 | 7.13 | 42.80 | 501.00 | 9.13 | 23.20 | 2.59 | 13.10 | 1.51 | 1588.93 | |
| LFC-11 | Phosphorite | 203.00 | 122.00 | 34.10 | 149.00 | 27.00 | 6.33 | 32.20 | 4.28 | 25.20 | 287.00 | 5.24 | 14.50 | 1.44 | 8.12 | 0.89 | 920.30 | |
| LFC-10 | Phosphatic dolomite | 89.40 | 52.60 | 14.50 | 62.20 | 11.10 | 2.70 | 13.51 | 1.81 | 10.80 | 140.00 | 2.37 | 6.38 | 0.77 | 4.16 | 0.50 | 412.79 | |
| LFC-9 (1) | Phosphorite | 328.00 | 192.00 | 54.10 | 235.00 | 41.30 | 9.83 | 49.58 | 6.88 | 39.00 | 481.00 | 8.30 | 21.50 | 2.41 | 12.00 | 1.38 | 1482.28 | |
| LFC-8 (2) | Phosphatic dolomite | 122.00 | 73.60 | 19.40 | 87.60 | 15.00 | 3.85 | 18.99 | 2.49 | 15.00 | 181.00 | 3.19 | 8.42 | 1.02 | 4.95 | 0.63 | 557.13 | |
| LFC-7 | Phosphorite | 351.00 | 229.00 | 61.70 | 275.00 | 48.90 | 11.78 | 57.87 | 8.02 | 46.40 | 539.00 | 9.76 | 25.90 | 2.73 | 14.20 | 1.59 | 1682.85 | |
| LFC-6 | Phosphatic dolomite | 75.90 | 46.40 | 12.10 | 53.70 | 9.44 | 2.37 | 11.21 | 1.57 | 9.31 | 122.00 | 1.97 | 5.62 | 0.67 | 3.63 | 0.43 | 356.32 | |
| Upper Gezhongwu | GS-13 | Phosphorite | 271.00 | 177.00 | 42.30 | 197.00 | 36.40 | 7.87 | 42.10 | 6.01 | 39.30 | 433.00 | 8.54 | 22.00 | 2.64 | 13.10 | 1.66 | 1299.92 |
| GS-10 | Phosphorite | 388.00 | 268.00 | 64.30 | 288.00 | 54.20 | 11.50 | 53.80 | 7.86 | 52.80 | 686.00 | 11.70 | 29.30 | 3.36 | 15.90 | 1.97 | 1936.69 | |
| GS-6 | Phosphorite | 340.00 | 258.00 | 54.80 | 261.00 | 51.10 | 10.70 | 55.90 | 7.87 | 49.00 | 484.00 | 10.30 | 25.60 | 2.99 | 14.50 | 1.84 | 1627.60 | |
| GS-3 | Phosphorite | 318.00 | 216.00 | 48.40 | 232.00 | 44.00 | 9.10 | 49.90 | 7.00 | 45.20 | 478.00 | 9.67 | 24.60 | 3.00 | 14.90 | 1.92 | 1501.69 | |
| Lower Gezhongwu | LJZ-5 | Phosphatic dolomite | 50.20 | 43.40 | 8.98 | 36.60 | 6.14 | 1.24 | 6.40 | 1.35 | 7.29 | 70.80 | 1.76 | 4.69 | 0.63 | 3.04 | 0.47 | 242.99 |
| LJZ-12 | Phosphatic dolomite | 47.70 | 37.40 | 8.47 | 34.30 | 5.52 | 1.36 | 5.92 | 1.25 | 6.72 | 64.80 | 1.64 | 3.88 | 0.58 | 2.56 | 0.41 | 222.51 | |
| LJZ-17 | Phosphatic dolomite | 61.50 | 51.30 | 11.10 | 48.30 | 8.11 | 1.80 | 8.69 | 1.74 | 9.59 | 88.70 | 2.27 | 5.71 | 0.83 | 3.67 | 0.53 | 303.85 | |
| LJZ-23 | Phosphatic dolomite | 188 | 145 | 34.8 | 156 | 29.7 | 6.25 | 32.6 | 4.59 | 28.8 | 271 | 6.06 | 15.1 | 1.76 | 8.73 | 1.1 | 929.49 | |
| LJZ-27 | Phosphatic dolomite | 157 | 129 | 30.4 | 132 | 25.5 | 5.05 | 27 | 3.91 | 25.1 | 225 | 5.24 | 13.1 | 1.53 | 7.8 | 1 | 788.63 | |
| Lower Gezhongwu | ZKX002-520.5 | Phosphorite | 308.00 | 239.00 | 58.8 | 270.00 | 57.9 | 12.5 | 63.3 | 8.96 | 56 | 482.00 | 11.4 | 28.1 | 3.22 | 15.4 | 1.93 | 1616.51 |
| ZKX002-523 | Phosphorite | 253.00 | 173.00 | 42.2 | 205.00 | 38.9 | 8.08 | 42.9 | 5.89 | 36.6 | 356.00 | 7.57 | 18.6 | 2.08 | 9.86 | 1.21 | 1200.89 | |
| ZKX002-727S | Phosphorite | 226.00 | 138.00 | 38.8 | 174.00 | 32.3 | 6.8 | 35.6 | 5.06 | 32.5 | 343.00 | 6.89 | 17.4 | 2.07 | 10 | 1.25 | 1069.67 | |
| ZKX002-527Q | Phosphatic dolomite | 86.90 | 67.20 | 18.10 | 71.80 | 13.60 | 2.96 | 15.35 | 2.46 | 13.10 | 122.00 | 3.20 | 7.92 | 0.91 | 4.57 | 0.60 | 430.66 | |
| ZKX002-528.5 | Phosphatic dolomite | 84.00 | 63.40 | 17.40 | 69.00 | 13.10 | 3.42 | 14.55 | 2.35 | 12.40 | 119.00 | 3.10 | 7.88 | 0.93 | 4.76 | 0.58 | 415.86 | |
| ZKX002-531S | Phosphatic dolomite | 18.50 | 17.60 | 3.25 | 13.60 | 2.60 | 0.80 | 2.98 | 0.47 | 2.62 | 29.70 | 0.65 | 1.56 | 0.21 | 1.03 | 0.13 | 95.71 |
| Sample (Type) | Spot | La | Ce | Pr | Nd | Sm | Eu | Gd | Tb | Dy | Y | Ho | Er | Tm | Yb | Lu | ΣREY |
|---|---|---|---|---|---|---|---|---|---|---|---|---|---|---|---|---|---|
| LFC1-2 (granular francolite) | 1-2-1-A | 409.65 | 289.25 | 66.63 | 316.96 | 59.82 | 17.85 | 72.82 | 9.39 | 57.14 | 687.99 | 12.38 | 31.12 | 3.40 | 16.40 | 1.90 | 2052.71 |
| 1-2-1-B | 454.62 | 339.90 | 77.36 | 365.66 | 69.65 | 23.64 | 84.02 | 10.51 | 62.48 | 730.63 | 13.60 | 33.85 | 3.71 | 17.96 | 2.23 | 2289.82 | |
| 1-2-1-C | 455.48 | 349.21 | 80.62 | 381.03 | 73.58 | 26.35 | 86.76 | 10.76 | 64.49 | 729.65 | 13.63 | 33.32 | 3.64 | 17.47 | 2.08 | 2328.05 | |
| 1-2-1-D | 499.29 | 349.48 | 76.37 | 350.80 | 64.06 | 18.63 | 77.59 | 9.87 | 60.46 | 740.41 | 13.29 | 33.81 | 3.89 | 19.04 | 2.36 | 2319.34 | |
| 1-2-2-A | 419.61 | 376.72 | 91.17 | 462.19 | 96.22 | 40.29 | 110.61 | 13.05 | 73.28 | 761.09 | 14.85 | 35.11 | 3.57 | 16.06 | 1.80 | 2515.63 | |
| 1-2-2-B | 486.67 | 362.92 | 81.14 | 381.91 | 71.82 | 22.99 | 85.69 | 10.85 | 65.12 | 768.14 | 14.01 | 35.16 | 3.90 | 18.73 | 2.23 | 2411.28 | |
| 1-2-2-C | 449.06 | 327.23 | 72.89 | 336.70 | 63.09 | 18.93 | 76.72 | 9.68 | 59.07 | 707.69 | 12.76 | 32.31 | 3.59 | 17.52 | 2.11 | 2189.36 | |
| 1-2-2-D | 493.49 | 365.51 | 81.02 | 378.13 | 71.89 | 22.98 | 85.05 | 10.97 | 65.34 | 768.78 | 14.00 | 35.18 | 3.86 | 18.61 | 2.29 | 2417.10 | |
| LFC-27 (granular francolite) | 27-1-A | 545.90 | 321.73 | 73.54 | 327.67 | 58.78 | 12.86 | 73.39 | 9.86 | 62.49 | 758.35 | 13.60 | 34.70 | 3.94 | 18.89 | 2.26 | 2317.94 |
| 27-1-B | 549.07 | 314.76 | 71.68 | 321.15 | 56.82 | 12.65 | 71.55 | 9.61 | 62.22 | 754.67 | 13.59 | 35.19 | 3.90 | 19.59 | 2.26 | 2298.71 | |
| 27-1-C | 550.93 | 320.23 | 73.42 | 328.28 | 58.15 | 12.99 | 73.06 | 9.85 | 63.06 | 774.59 | 13.95 | 35.56 | 3.97 | 20.06 | 2.33 | 2340.42 | |
| 27-1-D | 537.62 | 306.30 | 69.99 | 308.56 | 53.74 | 11.73 | 68.95 | 9.18 | 59.67 | 741.40 | 13.08 | 34.30 | 3.83 | 19.18 | 2.30 | 2239.83 | |
| 27-1-E | 493.11 | 298.05 | 69.55 | 317.53 | 57.27 | 13.50 | 73.54 | 9.82 | 61.55 | 738.46 | 13.47 | 33.92 | 3.69 | 18.20 | 2.12 | 2203.78 | |
| 27-1-F | 465.71 | 291.85 | 69.91 | 321.85 | 59.51 | 13.83 | 74.67 | 9.98 | 62.41 | 735.87 | 13.44 | 33.68 | 3.62 | 17.27 | 1.96 | 2175.58 | |
| 27-1-G | 494.84 | 286.07 | 65.52 | 299.20 | 53.26 | 12.12 | 69.02 | 9.23 | 59.60 | 742.24 | 13.13 | 34.15 | 3.86 | 19.39 | 2.29 | 2163.92 | |
| 27-2-A | 517.22 | 304.56 | 69.84 | 314.55 | 56.29 | 12.67 | 71.45 | 9.49 | 60.99 | 742.17 | 13.39 | 34.19 | 3.85 | 19.19 | 2.25 | 2232.10 | |
| 27-2-B | 563.55 | 359.06 | 84.33 | 385.42 | 70.10 | 17.17 | 88.41 | 11.77 | 73.56 | 863.29 | 15.92 | 40.14 | 4.32 | 20.82 | 2.41 | 2600.27 | |
| 27-2-C | 483.47 | 295.31 | 69.22 | 318.39 | 57.29 | 13.50 | 73.74 | 9.94 | 64.07 | 761.65 | 13.78 | 35.86 | 3.95 | 19.45 | 2.30 | 2221.92 | |
| 27-2-D | 579.38 | 331.77 | 74.18 | 332.89 | 57.91 | 12.61 | 71.77 | 9.81 | 62.21 | 769.59 | 13.70 | 35.19 | 4.02 | 20.23 | 2.42 | 2377.67 | |
| 27-2-E | 461.59 | 289.49 | 70.17 | 329.06 | 60.44 | 14.20 | 76.04 | 10.16 | 64.26 | 743.24 | 13.89 | 34.81 | 3.69 | 17.93 | 2.04 | 2191.01 | |
| LFC-7 (granular francolite) | 7-1-A | 435.59 | 240.51 | 63.20 | 279.24 | 50.91 | 11.76 | 59.91 | 8.38 | 50.60 | 577.35 | 10.80 | 27.54 | 3.16 | 15.94 | 1.92 | 1836.83 |
| 7-1-B | 430.38 | 237.80 | 64.95 | 289.01 | 53.88 | 11.65 | 64.14 | 8.71 | 54.07 | 596.63 | 11.33 | 28.54 | 3.24 | 16.07 | 1.88 | 1872.27 | |
| 7-1-C | 450.07 | 248.29 | 67.70 | 304.37 | 55.71 | 12.49 | 66.03 | 8.93 | 55.73 | 622.15 | 11.72 | 29.40 | 3.32 | 16.75 | 2.01 | 1954.66 | |
| 7-1-D | 449.98 | 239.44 | 63.76 | 279.66 | 50.70 | 11.15 | 60.49 | 8.24 | 50.66 | 582.41 | 10.84 | 27.39 | 3.21 | 16.51 | 2.01 | 1856.43 | |
| 7-1-E | 479.16 | 255.74 | 67.74 | 303.30 | 53.83 | 11.82 | 63.52 | 8.73 | 53.10 | 609.74 | 11.42 | 29.00 | 3.23 | 16.81 | 2.00 | 1969.15 | |
| 7-1-F | 463.53 | 245.25 | 63.79 | 282.84 | 50.44 | 10.63 | 59.62 | 8.14 | 50.67 | 585.96 | 10.88 | 27.71 | 3.21 | 16.32 | 1.98 | 1880.96 | |
| 7-1-G | 367.18 | 211.82 | 57.44 | 261.82 | 48.22 | 10.57 | 57.24 | 7.75 | 47.62 | 517.86 | 9.84 | 24.92 | 2.67 | 13.71 | 1.57 | 1640.23 | |
| 7-1-H | 430.77 | 233.10 | 63.68 | 281.89 | 51.25 | 11.12 | 60.92 | 8.17 | 49.90 | 571.23 | 10.70 | 26.91 | 3.00 | 15.16 | 1.79 | 1819.61 | |
| LFC-7 (bioclastic francolite) | 7-2-A | 461.81 | 244.44 | 64.29 | 280.86 | 49.06 | 10.27 | 57.92 | 7.83 | 49.16 | 566.30 | 10.36 | 26.51 | 3.11 | 16.33 | 1.95 | 1850.18 |
| 7-2-B | 454.33 | 242.67 | 63.10 | 276.02 | 49.08 | 10.17 | 56.75 | 7.78 | 47.94 | 547.58 | 10.11 | 25.91 | 3.00 | 15.16 | 1.91 | 1811.51 | |
| 7-3-A | 400.15 | 215.28 | 57.55 | 255.44 | 45.43 | 9.93 | 55.03 | 7.28 | 44.47 | 520.01 | 9.59 | 24.49 | 2.77 | 14.51 | 1.72 | 1663.64 | |
| 7-3-B | 406.00 | 216.94 | 58.36 | 260.88 | 46.41 | 10.15 | 55.99 | 7.40 | 46.39 | 527.57 | 9.81 | 25.27 | 2.78 | 14.50 | 1.75 | 1690.20 | |
| 7-3-C | 427.52 | 236.56 | 63.82 | 287.34 | 52.17 | 11.60 | 62.20 | 8.24 | 51.83 | 583.55 | 10.68 | 27.59 | 3.12 | 16.23 | 1.91 | 1844.38 | |
| 7-3-D | 389.10 | 214.91 | 58.21 | 261.15 | 47.23 | 10.36 | 56.49 | 7.63 | 47.07 | 528.32 | 10.03 | 25.56 | 2.85 | 14.49 | 1.69 | 1675.11 | |
| 7-3-E | 439.14 | 236.38 | 62.30 | 279.47 | 49.35 | 10.79 | 59.01 | 7.95 | 48.56 | 559.81 | 10.39 | 26.39 | 3.02 | 15.51 | 1.93 | 1810.00 | |
| 7-3-F | 450.62 | 235.96 | 61.06 | 268.51 | 47.84 | 9.84 | 56.34 | 7.55 | 47.68 | 547.26 | 10.09 | 25.82 | 2.97 | 15.52 | 1.90 | 1788.98 | |
| 7-3-G | 451.51 | 238.05 | 61.63 | 273.87 | 47.87 | 10.15 | 57.62 | 7.76 | 48.62 | 555.55 | 10.32 | 26.31 | 3.01 | 16.01 | 1.90 | 1810.20 | |
| 7-3-H | 474.91 | 247.49 | 65.01 | 287.07 | 50.70 | 11.09 | 59.86 | 8.05 | 50.45 | 577.44 | 10.71 | 27.70 | 3.16 | 16.88 | 2.06 | 1892.57 | |
| 7-3-I | 485.17 | 262.56 | 73.24 | 326.61 | 59.93 | 12.76 | 68.73 | 9.41 | 57.63 | 633.24 | 12.22 | 30.07 | 3.39 | 17.00 | 2.02 | 2053.98 | |
| 7-3-J | 499.20 | 264.95 | 69.30 | 307.96 | 55.54 | 11.81 | 64.44 | 8.67 | 52.22 | 609.19 | 11.39 | 28.68 | 3.28 | 17.01 | 2.08 | 2005.72 | |
| LFC-6 (dolomite) | D6-1-1 | 18.39 | 9.94 | 2.41 | 9.81 | 1.46 | 0.28 | 2.24 | 0.35 | 2.96 | 39.23 | 0.86 | 2.34 | 0.40 | 2.92 | 0.40 | 93.98 |
| D6-1-3 | 10.18 | 6.34 | 1.61 | 6.46 | 1.09 | 0.23 | 1.59 | 0.24 | 2.56 | 29.67 | 0.64 | 1.68 | 0.33 | 1.69 | 0.27 | 64.59 | |
| D6-1-5 | 13.65 | 7.71 | 1.96 | 8.31 | 1.94 | 0.30 | 2.24 | 0.43 | 3.25 | 41.00 | 0.85 | 2.85 | 0.44 | 3.47 | 0.48 | 88.88 | |
| D6-1-6 | 11.44 | 6.40 | 1.62 | 6.48 | 1.45 | 0.24 | 1.74 | 0.29 | 2.48 | 31.91 | 0.67 | 1.91 | 0.30 | 1.98 | 0.30 | 69.22 | |
| D6-1-8 | 20.70 | 11.00 | 2.41 | 9.84 | 1.57 | 0.32 | 2.10 | 0.39 | 2.81 | 37.79 | 0.72 | 2.30 | 0.35 | 2.07 | 0.30 | 94.66 | |
| D6-2-1 | 14.02 | 7.68 | 1.96 | 7.68 | 1.33 | 0.30 | 1.91 | 0.31 | 2.46 | 32.07 | 0.59 | 2.00 | 0.32 | 2.16 | 0.34 | 75.14 | |
| D6-2-2 | 10.53 | 5.90 | 1.62 | 6.82 | 1.23 | 0.28 | 1.58 | 0.26 | 2.26 | 26.95 | 0.56 | 1.77 | 0.27 | 1.77 | 0.28 | 62.07 | |
| D6-2-3 | 6.04 | 3.64 | 1.02 | 3.89 | 0.85 | 0.17 | 1.18 | 0.23 | 1.64 | 21.65 | 0.44 | 1.45 | 0.23 | 1.56 | 0.22 | 44.20 | |
| D6-2-4 | 9.08 | 4.74 | 1.10 | 4.35 | 0.85 | 0.21 | 1.07 | 0.20 | 1.74 | 22.10 | 0.45 | 1.54 | 0.24 | 1.72 | 0.25 | 49.65 | |
| D6-4-2 | 18.4 | 9.6 | 2.47 | 10.6 | 1.83 | 0.40 | 2.27 | 0.37 | 2.69 | 35.3 | 0.67 | 2.21 | 0.33 | 2.35 | 0.33 | 89.86 |
Publisher’s Note: MDPI stays neutral with regard to jurisdictional claims in published maps and institutional affiliations. |
© 2022 by the authors. Licensee MDPI, Basel, Switzerland. This article is an open access article distributed under the terms and conditions of the Creative Commons Attribution (CC BY) license (https://creativecommons.org/licenses/by/4.0/).
Share and Cite
He, S.; Xia, Y.; Xiao, J.; Gregory, D.; Xie, Z.; Tan, Q.; Yang, H.; Guo, H.; Wu, S.; Gong, X. Geochemistry of REY-Enriched Phosphorites in Zhijin Region, Guizhou Province, SW China: Insight into the Origin of REY. Minerals 2022, 12, 408. https://doi.org/10.3390/min12040408
He S, Xia Y, Xiao J, Gregory D, Xie Z, Tan Q, Yang H, Guo H, Wu S, Gong X. Geochemistry of REY-Enriched Phosphorites in Zhijin Region, Guizhou Province, SW China: Insight into the Origin of REY. Minerals. 2022; 12(4):408. https://doi.org/10.3390/min12040408
Chicago/Turabian StyleHe, Shan, Yong Xia, Jiafei Xiao, Daniel Gregory, Zhuojun Xie, Qinping Tan, Haiying Yang, Haiyan Guo, Shengwei Wu, and Xingxiang Gong. 2022. "Geochemistry of REY-Enriched Phosphorites in Zhijin Region, Guizhou Province, SW China: Insight into the Origin of REY" Minerals 12, no. 4: 408. https://doi.org/10.3390/min12040408