Abstract
Fine ware pottery from the Etruscan town of Tarquinia, whose necropolis in inscribed in the list of UNESCO sites, was studied by means of near-infrared (NIR) diffuse reflection spectroscopy. The aim was to investigate the correlation between the firing conditions of the illitic-calcareous local clay, in terms of temperature and atmosphere, and the physical properties of the ceramic paste, usually exploited by the archaeologists for a classification of pottery sherds. For comparison, analytical data related to the mineralogical composition of the samples were obtained by X-ray diffraction and Fourier-transform infrared (FTIR) spectroscopy. Spectroscopic data were elaborated by methods of multivariate analysis.
1. Introduction
The question of determining the firing temperature of archaeological pottery, the so-called archaeothermometry, has been and still is the object of much debate and of the search for analytical methods capable of estimating this parameter [1]. However, its usefulness is generally recognized, thanks to the information it provides on ceramic production technology. As is known, the study of the firing temperature of ancient ceramics represents, first of all, a means of obtaining information on the technological know-how of a given society. From this point of view, it is worth remembering that two main types of firing have been used for earthenware, namely open firing typically on bonfires and firing in kilns. Even if the temperature ranges accessible in the two cases partially overlap, the heat input in the kilns is greater due to the longer firing times, and therefore higher firing temperatures are estimated for the pottery. It should in fact be remembered that the effect of firing on the clayey raw material is determined not only by the maximum temperature reached but also by the duration of the process, so that just an “equivalent firing temperature” can be estimated [2]. Furthermore, this parameter obviously has a significant effect on the visual appearance of the ceramic fabric, determining several of its characteristics that are used by archaeologists for its classification. A typical example is the presence, number, and form of vacuoles in the fabric itself. The evaluation of the firing temperature is therefore an aid in the interpretation of differences in the physical appearance of the fabrics for ceramic products for which a common provenance has been recognized on the basis of stylistic considerations and chemical analyses of elemental composition.
Different methods have been proposed for determining the firing temperature, based on measurements of material properties such as color, porosity, hardness, coefficient of elasticity (through the ultrasonic attenuation method), mineralogical composition, morphology (observed by scanning electron microscopy SEM), electronic properties (measured by Mössbauer spectroscopy and electron spin resonance ESR), coefficient of expansion and thermoluminescence (TL) sensitivity [3,4,5]. Two approaches have been taken, one based on the observed changes for temperature-dependent properties upon heating clay similar to that of the ceramic samples and the other based on refiring the sherds until a selected property begins to change. Particular attention has been paid to the study of mineralogical composition by X-ray diffraction (XRD), also combined with multivariate analysis of data [6,7,8] and observation of microstructural features [9].
The firing atmosphere is also an important factor in the manufacturing of pottery and its primary effect on the macroscopic aspect of the final product is certainly the color of the ceramic fabric. This characteristic is obviously considered by archaeologists for the classification of pottery materials, especially for the large number of sherds that can be found in an excavation, and the alphanumeric code provided by the Munsell Soil chart has been widely used to define the color. From the analytical point of view, the ratio between iron(II) and the total iron in the ceramic paste and the evolution of iron-bearing phases upon firing were studied mainly by XRD and Mössbauer spectroscopy to correlate with firing atmosphere and temperature [10,11,12]. Again XRD, Fourier-transform infrared (FTIR) spectroscopy, Raman spectroscopy and SEM were exploited to individuate the raw materials and firing conditions for black or brown-black coatings of ceramic vessels [13,14].
In the present work, the possibility of exploiting diffuse reflectance near-infrared (NIR) spectroscopy for the investigation of both the firing temperature and the origin of color in the paste of archaeological pottery was explored. The possible estimate of the firing temperature will be based on the characteristic bands due to water and OH groups in clayey materials that can be observed in the NIR spectra. In fact, the dehydration and dehydroxylation processes that occur upon thermal treatment of clay minerals are well documented [15]. The study of color in ceramic paste using this technique will be instead be correlated to the characteristic absorption bands of iron in different oxidation states that are observed in this spectral range and in the adjacent visible region. The proposed technique has the advantage of allowing a rapid screening of many samples, with a pretreatment that is limited to the grinding of ceramic materials. As a case study, Etruscan pottery from the archaeological site of Tarquinia (central Italy) was investigated. Tarquinia is world famous for the beautiful paintings of the tombs in its necropolis, which is a Unesco site, and was one of the most important Etruscan cities. In particular, the sherds examined come from the excavation of the political and religious center of the ancient town, the so-called Civita, carried out under the supervision of the archaeologists of the University of Milan (Italy). They are examples of both plain and decorated ware and date back to the 8th–6th century B.C. The mineralogical composition of the ceramic materials was also examined by FTIR spectroscopy and X-ray diffraction. Both NIR and FTIR spectra were also subjected to multivariate analysis. In particular, principal component analysis (PCA) was applied to the NIR spectra to highlight the differences among the samples. A semi-quantitative analysis of mineralogical phases was also attempted by applying the partial least squares (PLS) method to FTIR data. The examination of the mineralogical composition is in fact relevant, because, as highlighted above, it represents a recognized method for evaluating the firing temperature of ceramic materials and therefore a tool for validating the procedure based on NIR spectroscopy.
2. Materials and Methods
2.1. Archaeological Ceramic Samples from Tarquinia
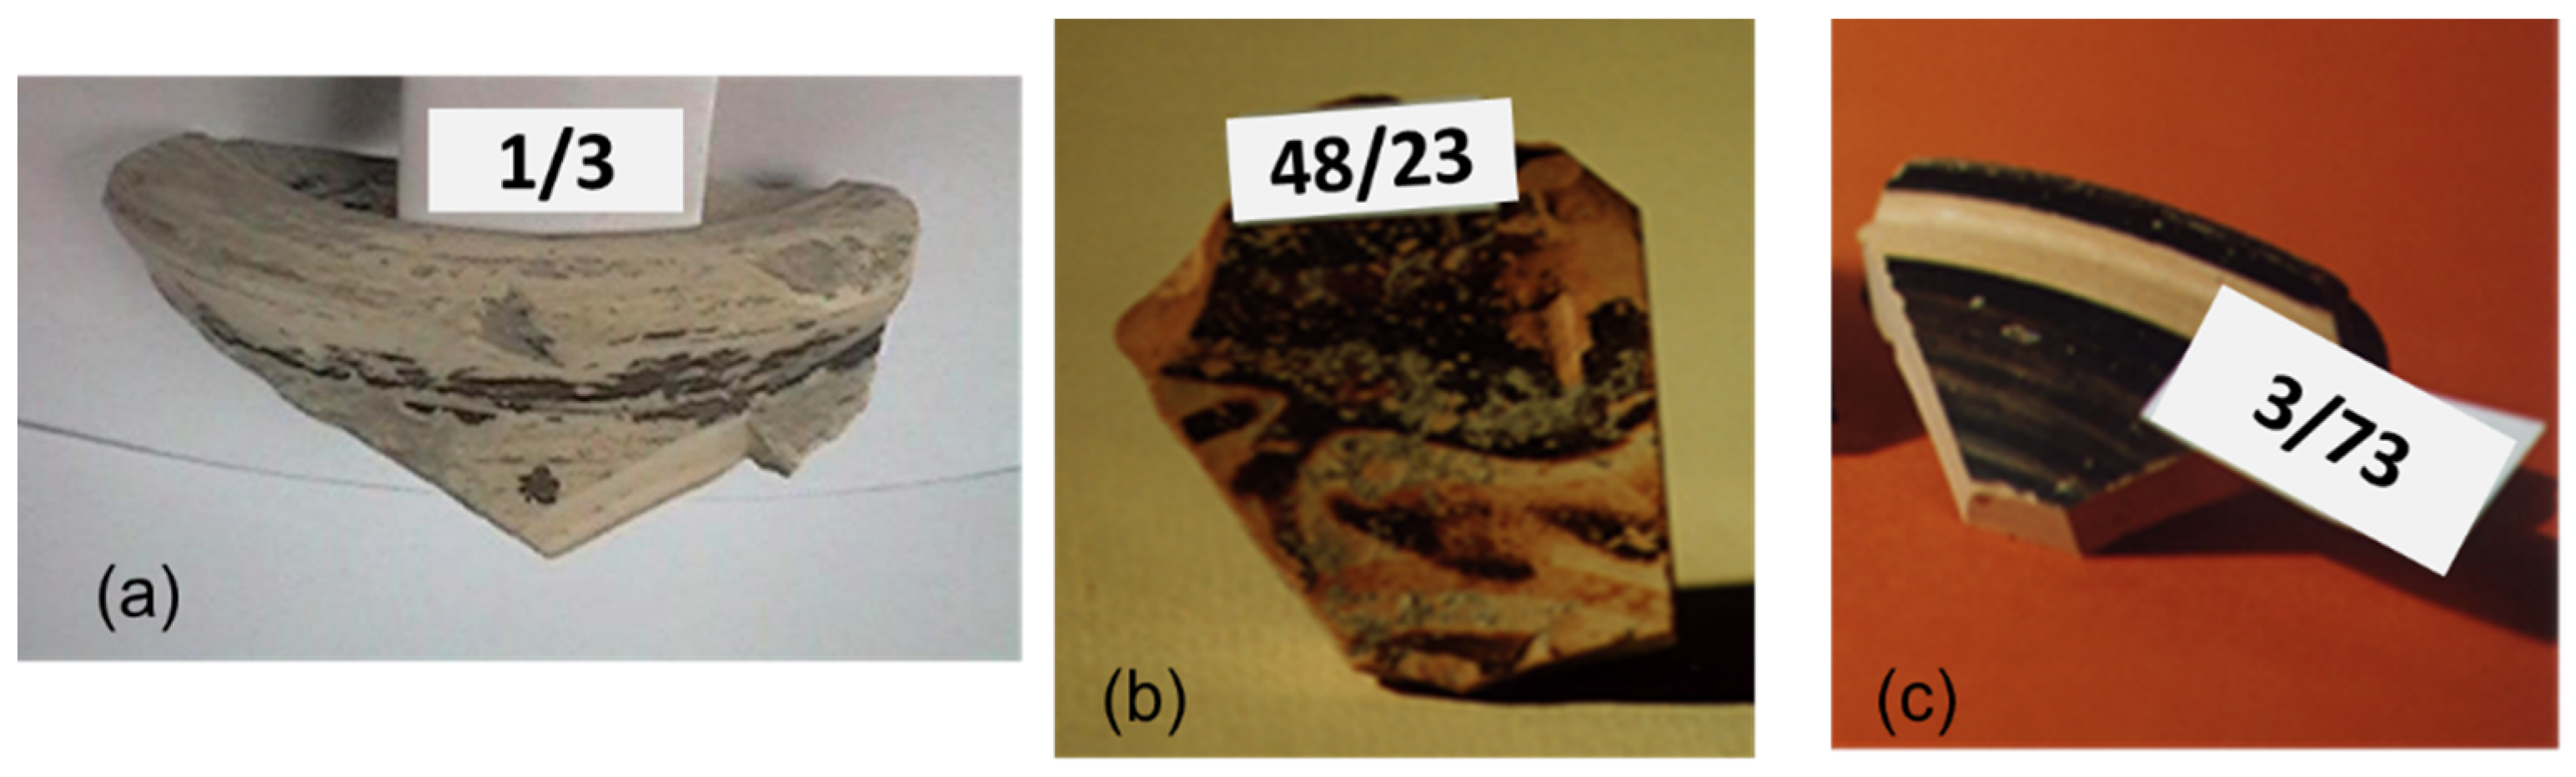
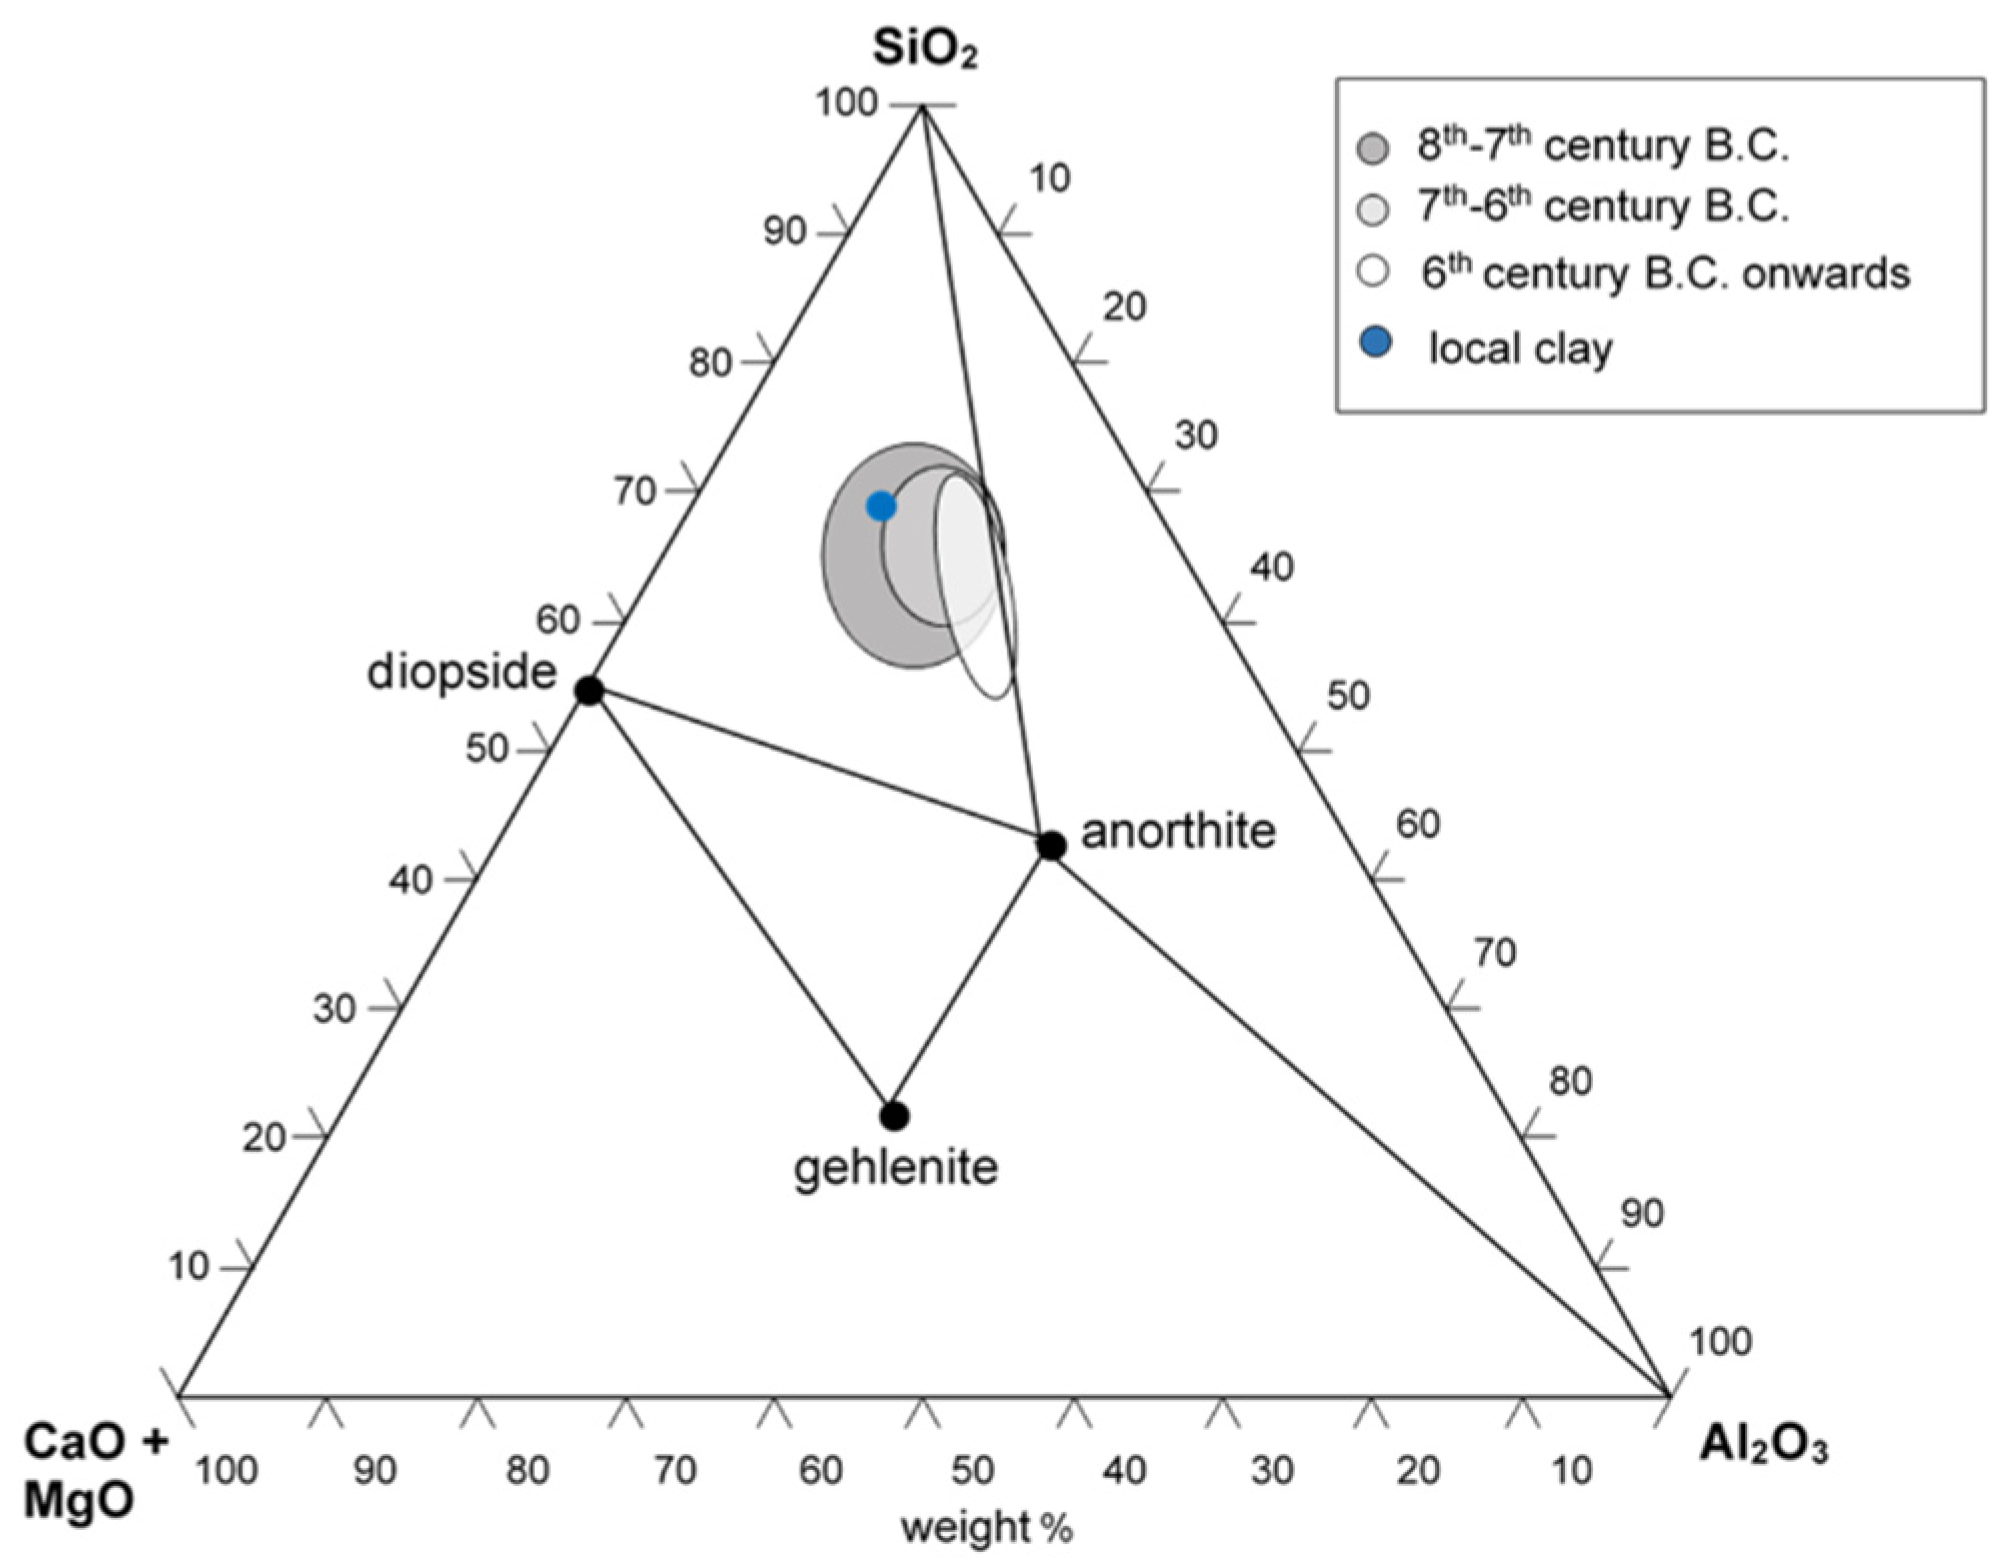
The 31 ceramic sherds from the excavation of the Civita di Tarquinia examined in the present work are listed in Table 1. They are all examples of fine ware (Figure 1), belonging to different classes depending on the decoration of the surface and datable to a period ranging from the 8th to the 6th century B.C. (with one exception of a fragment datable to the 3rd–2nd century B.C.). Most of the samples in Table 1 are considered of local production, based on a previous study of their elemental composition [16]. From the point of view of the so-called “ceramic triangle” CaO + MgO/Al2O3/SiO2, they are situated in the phase field quartz-diopside-anorthite, as shown in Figure 2.

Table 1.
List of the ceramic sherds from the excavation of the Civita di Tarquinia, analyzed in the present work. The samples are listed in numerical order, according to the first (and then the second, and so on) digit of their inventory number. For each sample, the table shows the chronology, the class based on the decoration of the ceramic vessel and the color with the corresponding Munsell code.

Figure 1.
Some examples of the archaeological ceramic samples from the Civita di Tarquinia analyzed in the present work: (a) 1/3, plain white ware; (b) 48/23, Etruscan-Corinthian pottery; (c) 3/73, Etruscan black gloss pottery.

Figure 2.
Composition of the fine ware samples from the Civita di Tarquinia in the ternary phase diagram CaO (+MgO)-Al2O3-SiO2. The blue circle represents the composition of the sample of local clay used in the heating experiments (see Section 2.3).
Two further samples, representative, respectively, of the so-called grey pottery (inventory n. 36/1000) and of “bucchero” (inventory n. 30b) (see below), were also compared from the point of view of the origin of their grey-black color.
2.2. Test Samples of Clay from Tarquinia and Heating Experiments
A test samples of clay was collected from the Civita site, whose geological features are described in [17]. The acropolis of ancient Tarquinia stands on the top of a hill formed by the so-called “macco”, made up of fossiliferous calcarenite and cemented bioclastic sands, of a straw-yellow color. The clay collected was therefore a typical calcareous clay. It was finely ground in a mortar and then mixed with an adequate amount of deionized water until an easily moldable paste was obtained. The obtained paste was divided in six specimens of similar shape and size. The specimens were heated in an electric tubular oven at 200 °C for 1 h. They were then allowed to cool slowly inside the oven itself. Each specimen was then heated in air to one of six different temperatures: 500 °C, 700 °C, 800 °C, 900 °C, 1000 °C and 1100 °C. In each case, the maximum temperature was reached at a rate of 200 °C/h, and maintained for 2 h. The samples were then allowed to cool to room temperature with a similar rate.
2.3. NIR Analysis
NIR spectra were acquired on powders of both the archaeological ceramic materials listed in Table 1 and the heated clay samples by a Jasco V-570 UV-visible-NIR spectrophotometer, equipped with an integrating sphere internally coated with BaSO4. In the case of the archaeological sherds, the powder was collected using a diamond tip from the inner side of the fragments, after removing by the same diamond tip the most superficial layer to avoid possible contamination due to the burial environment. For the study of the effect of firing temperature, the spectra were collected between 1300 and 2500 nm, while for the study of color the spectra were acquired in the wider range 400–2500 nm to include the visible region both for the samples listed in Table 1 and for the two additional samples of grey pottery and “bucchero”. The spectral resolution was 2 nm in the visible and 4 nm in the NIR region.
2.4. FTIR Analysis
FTIR spectra were recorded in the 4000–400 cm−1 interval using a Digilab FTS 40 FTIR spectrometer, as a sum of 16 scans with resolution 4 cm−1. The analyses were performed on KBr pellets of the powdered samples, collected as described above from the ceramic materials listed in Table 1. For the semi-quantitative analyses, the quantities of sample and KBr mixed together were weighed exactly, as well as the amount of the mixture used to prepare the pellet. The pellets were obtained using a 13-mm diameter Specac die and applying a pressure of 10 tons for 1 min.
2.5. XRD Analysis
XRD analyses of the archaeological samples listed in Table 1 were performed by means of a Philips PW 1820 diffractometer with vertical scan. The instrument was equipped with collimator plates (Soller’s slits), a single crystal graphite monochromator, and a Na(TI)I scintillation counter with impulse height amplification. The incident radiation corresponded to Cu Kα (1.5418 Å) (settings HV: 40 kV and 40 mA), and the acquisition was run at room temperature in the angular range 5–65°, in the θ–2θ mode with a step size of 0.02° and a time of 3 s per step.
2.6. Mathematical Treatment and Multivariate Analysis of Spectral Data
2.6.1. PCA of NIR Spectra
NIR spectra in the range 1300–2500 nm were subjected to principal component analysis using the Minitab ver. 13 software (Minitab Ltd., Coventry, UK). No pretreatment was applied to the spectra and the covariance matrix was used to reduce the contribution of wavelengths corresponding to the baseline.
2.6.2. PLS Model Based on FTIR Spectra
To obtain semi-quantitative data about the mineralogical composition of the archaeological samples, PLS regression was applied to FTIR spectra using the corresponding function of the Minitab ver. 13 software. Such function is based on the nonlinear iterative partial least square (NIPALS) algorithm [18] and allows to fit multiple response variables in a single model.
The absorbance values of the spectra at each wavenumber were first of all divided by the factor
where ws is the weight of the sample powder, wd is the weight of KBr mixed with the sample, and wp is the weight of the part of the mixture used to fill the dye for the preparation of the pellet. In this way, the different concentrations of the KBr pellets were taken into account, as well as their different thickness, that determined the light path through the pellets themselves. It was in fact assumed that the quantity of mixture sample + KBr (wp) introduced in the dye was proportional to the thickness of the pellet obtained, since an identical pressure was applied to each sample for an identical time. By dividing the spectra by the above factor, the dependance of the absorbance values on the absolute concentration of the samples and on the optical path of the radiation passing through them (as described by the Beer’s Law) was eliminated.
For each spectrum, only the range 1600–400 cm−1 has been considered, since in that range the most significant bands of most mineralogical phases are found. In addition, the spectra, initially acquired with 4-cm−1 resolution, were de-resolved to half the number of points to reduce the time required for computation, as no significant loss of information occurred. To eliminate the variability associated with the baseline slope, the second derivative of each spectrum was calculated, using the software GRAMS (Thermo Scientific) and in particular the “gap” algorithm (gap = 20 cm−1).
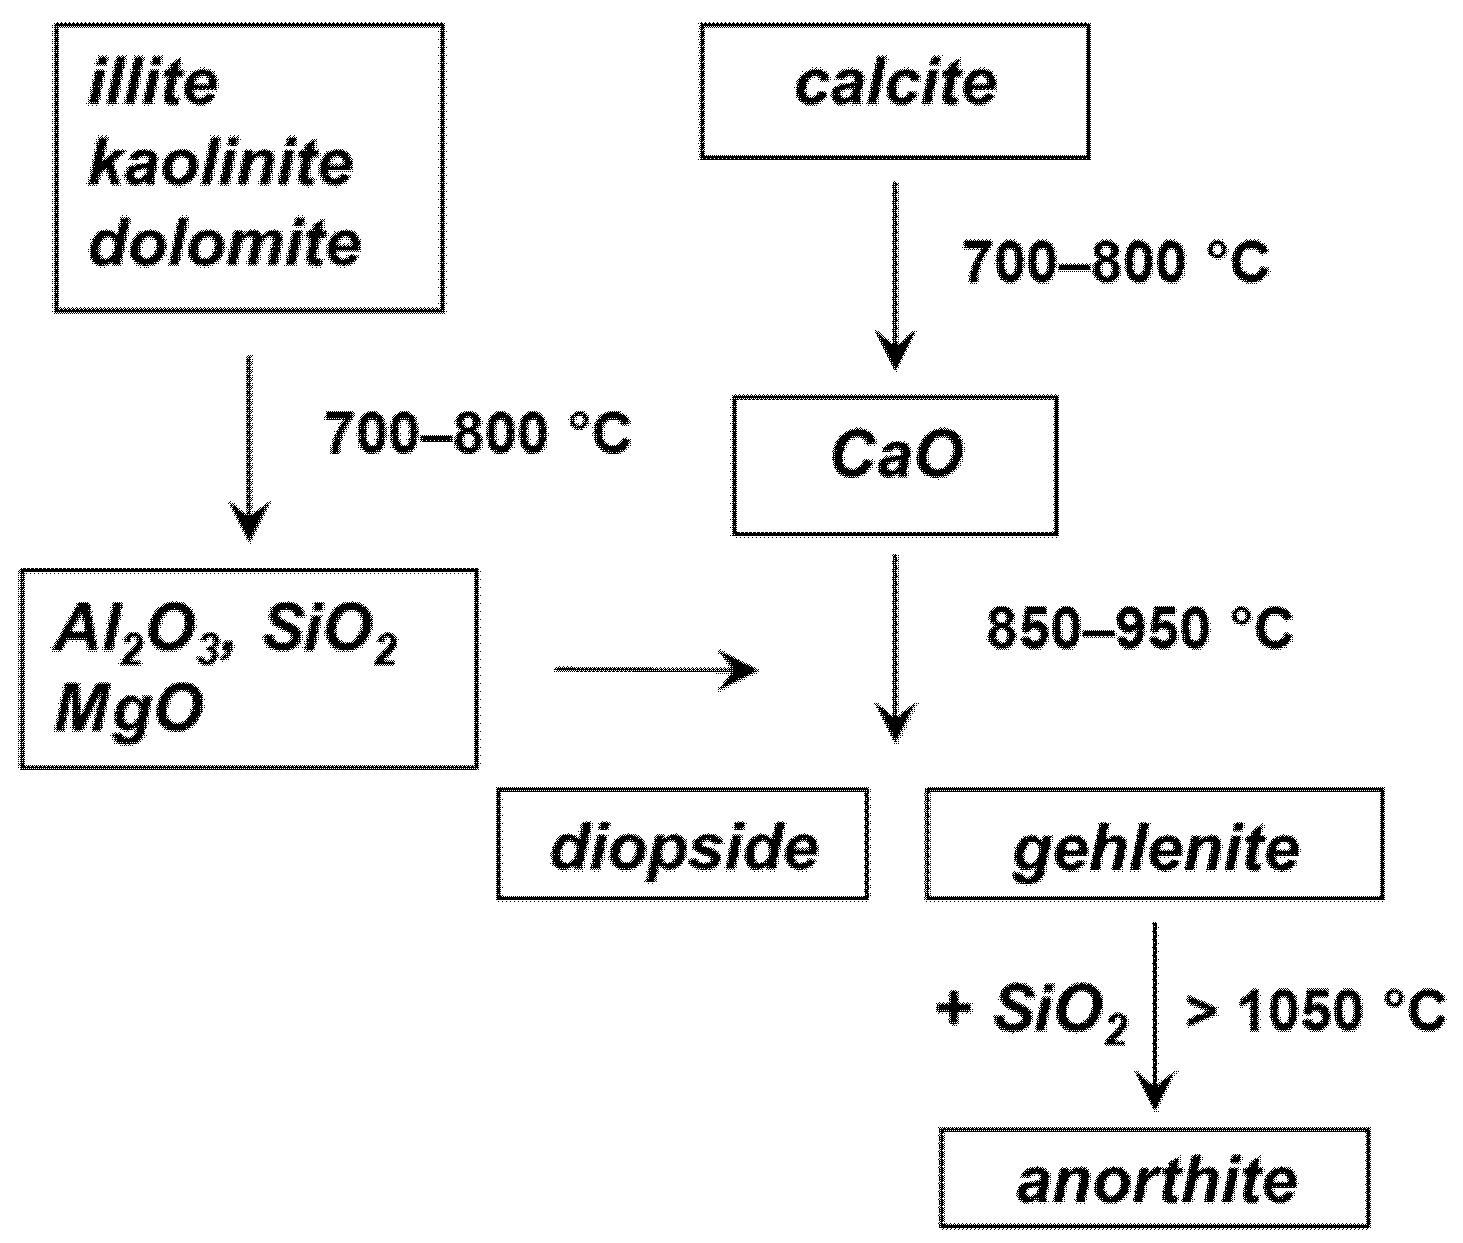
To construct the model, the responses corresponding to the following mineralogical phases have been considered: anorthite CaAl2Si2O8, calcite CaCO3, diopside CaMgSi2O6, gehlenite Ca2Al2SiO7, and quartz SiO2. These are in fact the expected phases in a ceramic material obtained from an illitic-calcareous clay such as that of the Tarquinia site [19]. Their formation as a function of the firing temperature can be described according to the diagram shown in Figure 3 (see also [19,20]).

Figure 3.
Evolution of the mineralogical phases in the firing of a ceramic material from calcareous clay.
In addition to the phases listed above, two further components were considered in the model, corresponding respectively to illite K0.6–0.85Al2(Si,Al)4O10(OH)2 heated at 800 and 1000 °C. In this way, it was possible to take into account the amorphous silicate phase that is present in the ceramic material and contributes to its IR spectrum with the broad and intense band located at about 1000 cm−1, whose position also depends on the firing temperature [21].
The model was constructed using 45 spectra of pure reference minerals and their mixtures. The spectra of the mixtures were partly obtained experimentally and partly calculated by combining the spectra of pure minerals. The leave-one-out cross-validation method was adopted. As shown in Table 2, the model was satisfactory [22] for all the phases considered, with the exception of gehlenite for which a low predictive capability was obtained.
Table 2.
Values of the determination coefficients R2 and predicted R2 for the PLS model of the fractions of mineralogical phases in an archaeological ceramic material.
The fractions of the mineralogical phases obtained for the archeological samples from the PLS model based on the FTIR spectra were then subjected to PCA using the Minitab ver. 13 software. The correlation matrix was used in this case.
3. Results and Discussion
3.1. Diffuse Reflectance NIR Spectra of Fired Tarquinia Clay
The NIR spectra obtained from the heated samples of Tarquinia clay are shown in Figure 4 and were already reported in [23].

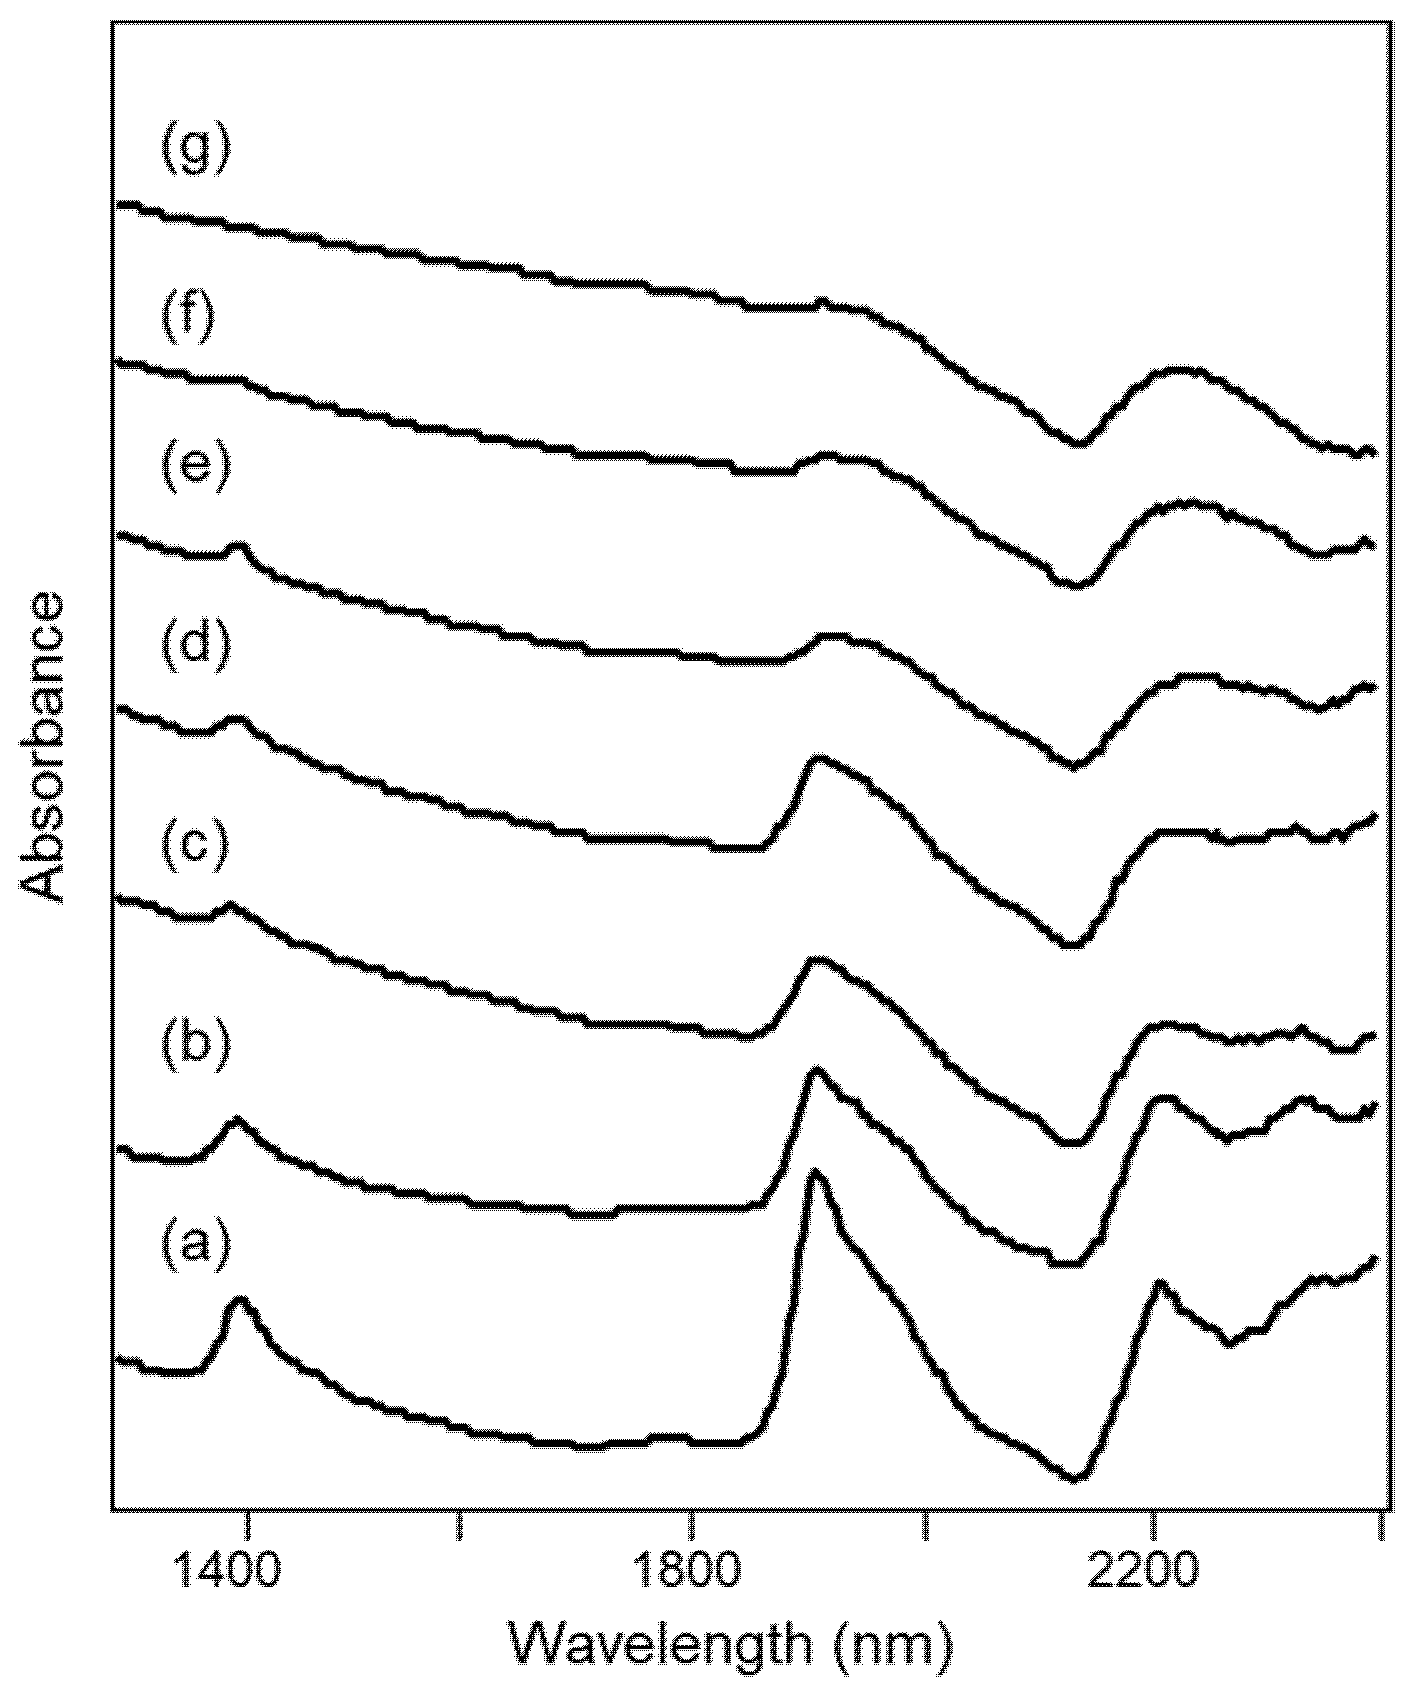
Figure 4.
NIR spectra of specimens of Tarquinia clay (a) as such and heated at (b) 500 °C, (c) 700 °C, (d) 800 °C, (e) 900 °C, (f) 1000 °C and (g) 1100 °C, as described in Section 2.2.
The NIR spectra of the unheated clay and of the specimens heated up to about 800 °C show bands that can be assigned as detailed below [24,25,26]:
- 1410 nm 2νOH and ν’w + 2δw
- 1910 nm ν’w + δw
- 1966 nm νw + 2δw
- 2210 nm νOH + δAl-OH
- 2342 nm νOH + δMg-OH
where ν and δ indicate stretching and bending vibrational modes respectively, w indicates water molecules and the single quote mark refers to those molecules that are “isolated”, i.e., less involved in hydrogen bonding, or at least involved in weak hydrogen bonding with the surface oxygen of silicates [25]. All the bands listed above decrease in intensity as the heating temperature increases.
For heating temperatures above 800 °C, the bands at 2210 and 2342 nm due to OH groups are no longer distinguishable, while in the same spectral region a broad signal appears at 2230 nm and is attributed to overtones of Si-O-Si stretching modes [27]. This observation is in agreement with the fact that, if in some clay minerals dehydroxylation is already complete at 600 °C, for other minerals such as illite it occurs up to about 800 °C [24,28]. On the other hand, at temperatures above 800 °C, the formation of new condensed silicate phases begins (Figure 1), explaining the signal due to Si-O-Si bonds.
Finally, for heating temperatures of 1000–1100 °C, the bands due to H2O molecules are now barely distinguishable.
3.2. Diffuse Reflectance NIR Spectra of Archaeological Ceramic Samples from the Civita di Tarquinia
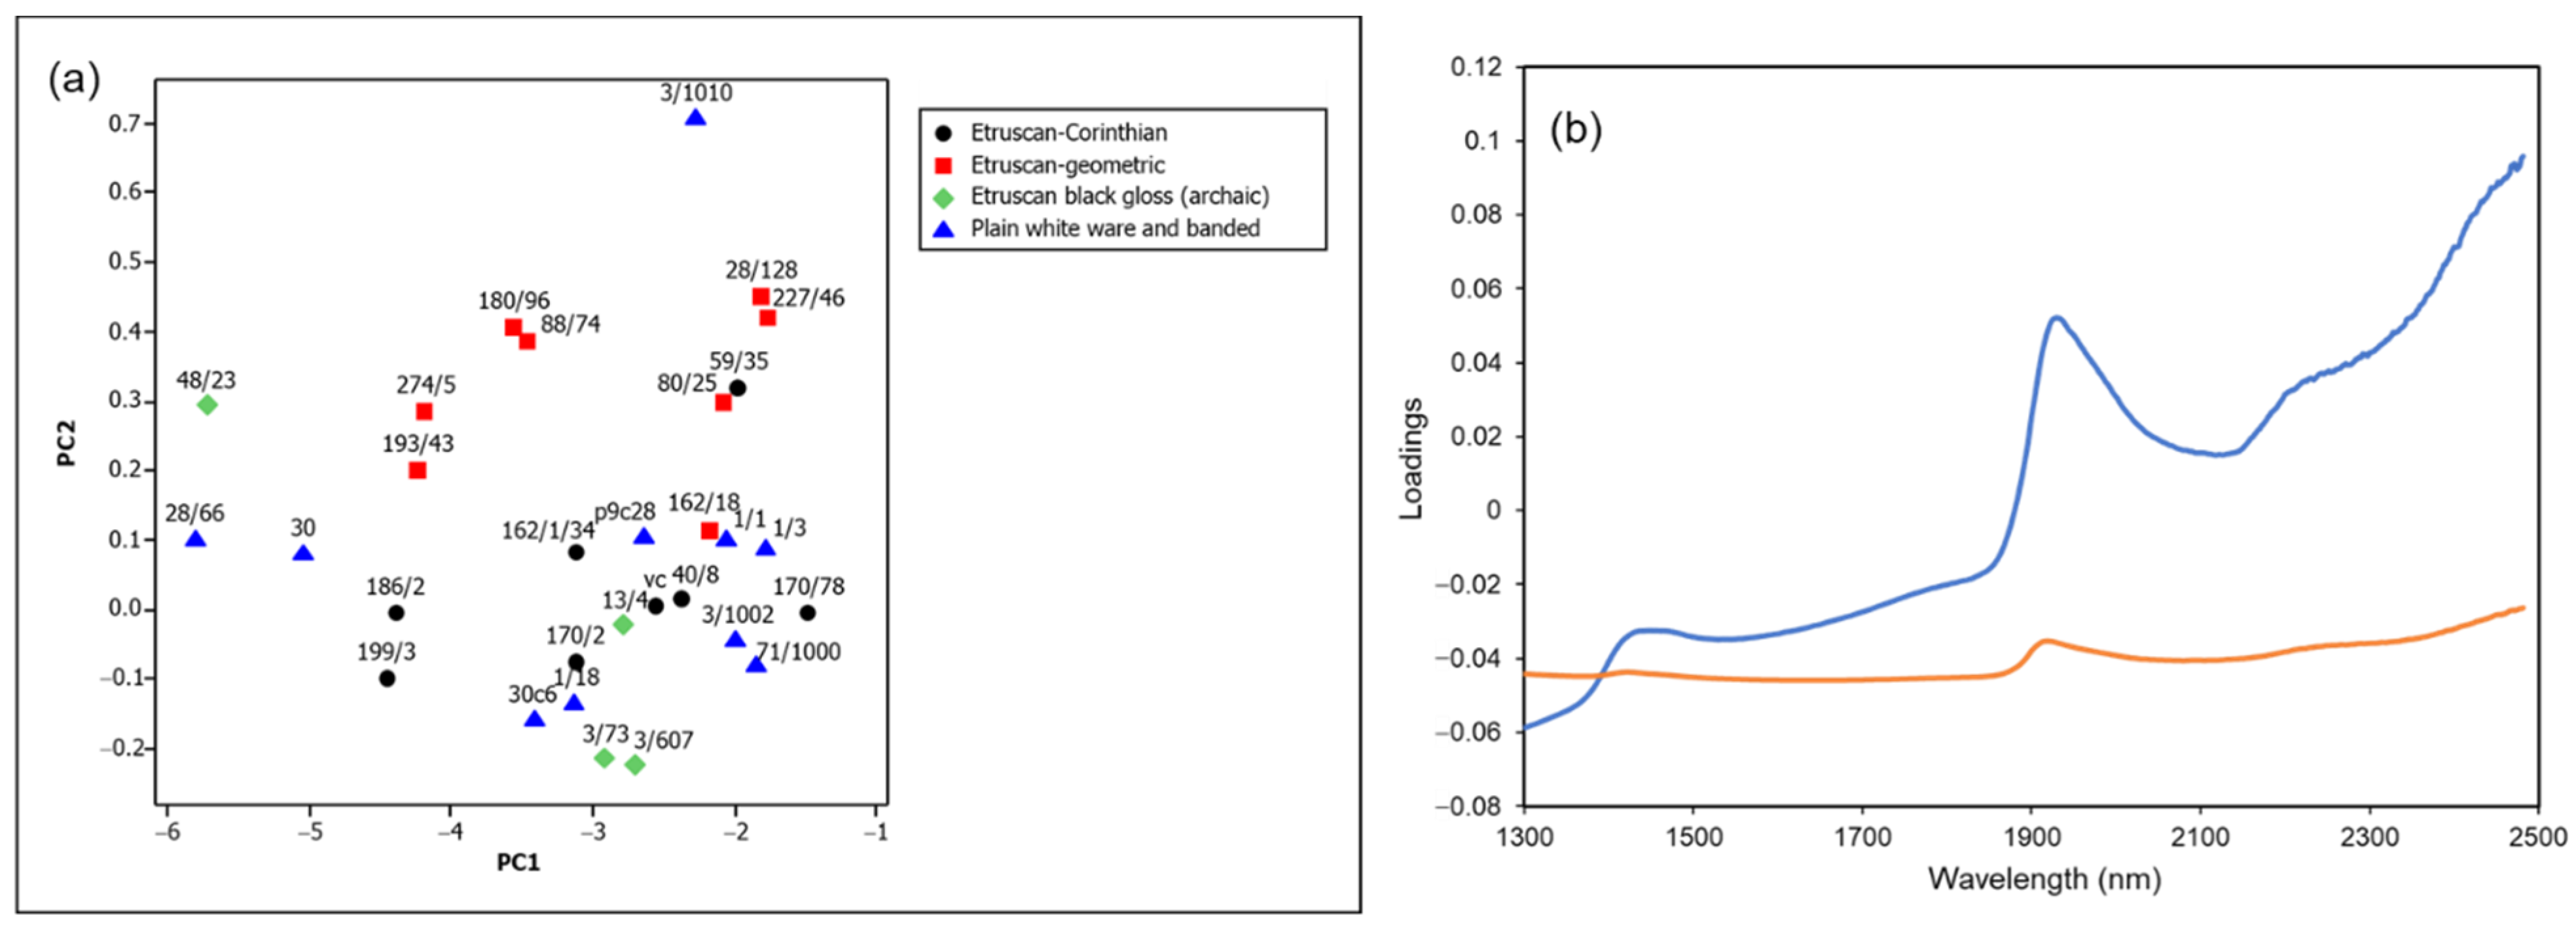
The diffuse reflectance NIR spectra of the 30 archaeological samples listed in Table 1 were collected and analyzed by PCA as described in Section 2.6. The resulting score plot and loadings of the first two principal components are shown in Figure 5a,b, respectively.
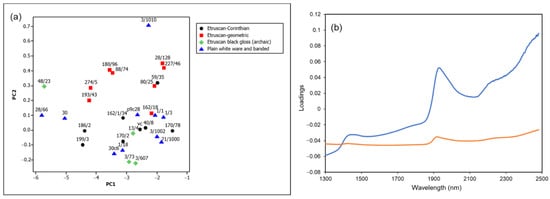
Figure 5.
(a) Score plot and (b) loadings of the first two principal components (orange line, PC1; blue line, PC2) of the NIR spectra in the range 1300–2500 nm of archaeological ceramic samples from the Civita di Tarquinia (99.4% variance explained, of which 96.2% by PC1 and 3.3% by PC2).
It can be easily observed that the loadings of the second principal component correspond mainly to the spectral pattern due to water molecules in the wavelength range considered. The first component seems to be principally associated with the more or less high background absorption, which overlaps with that due to water molecules as shown in Figure 6. An increase in absorbance values towards the lower limit of the wavelength range examined may be associated with absorptions due to the presence of more or less significant quantities of iron(II) in the ceramic paste, as will be detailed below (Section 3.4).
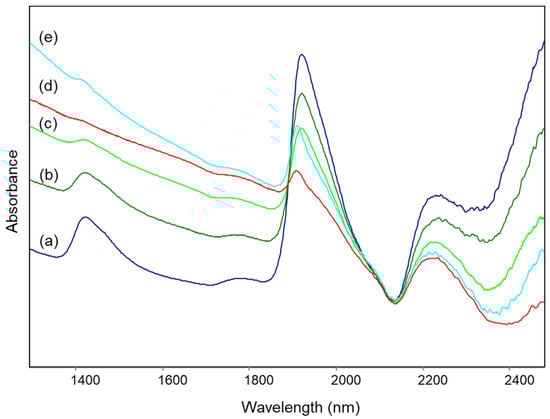
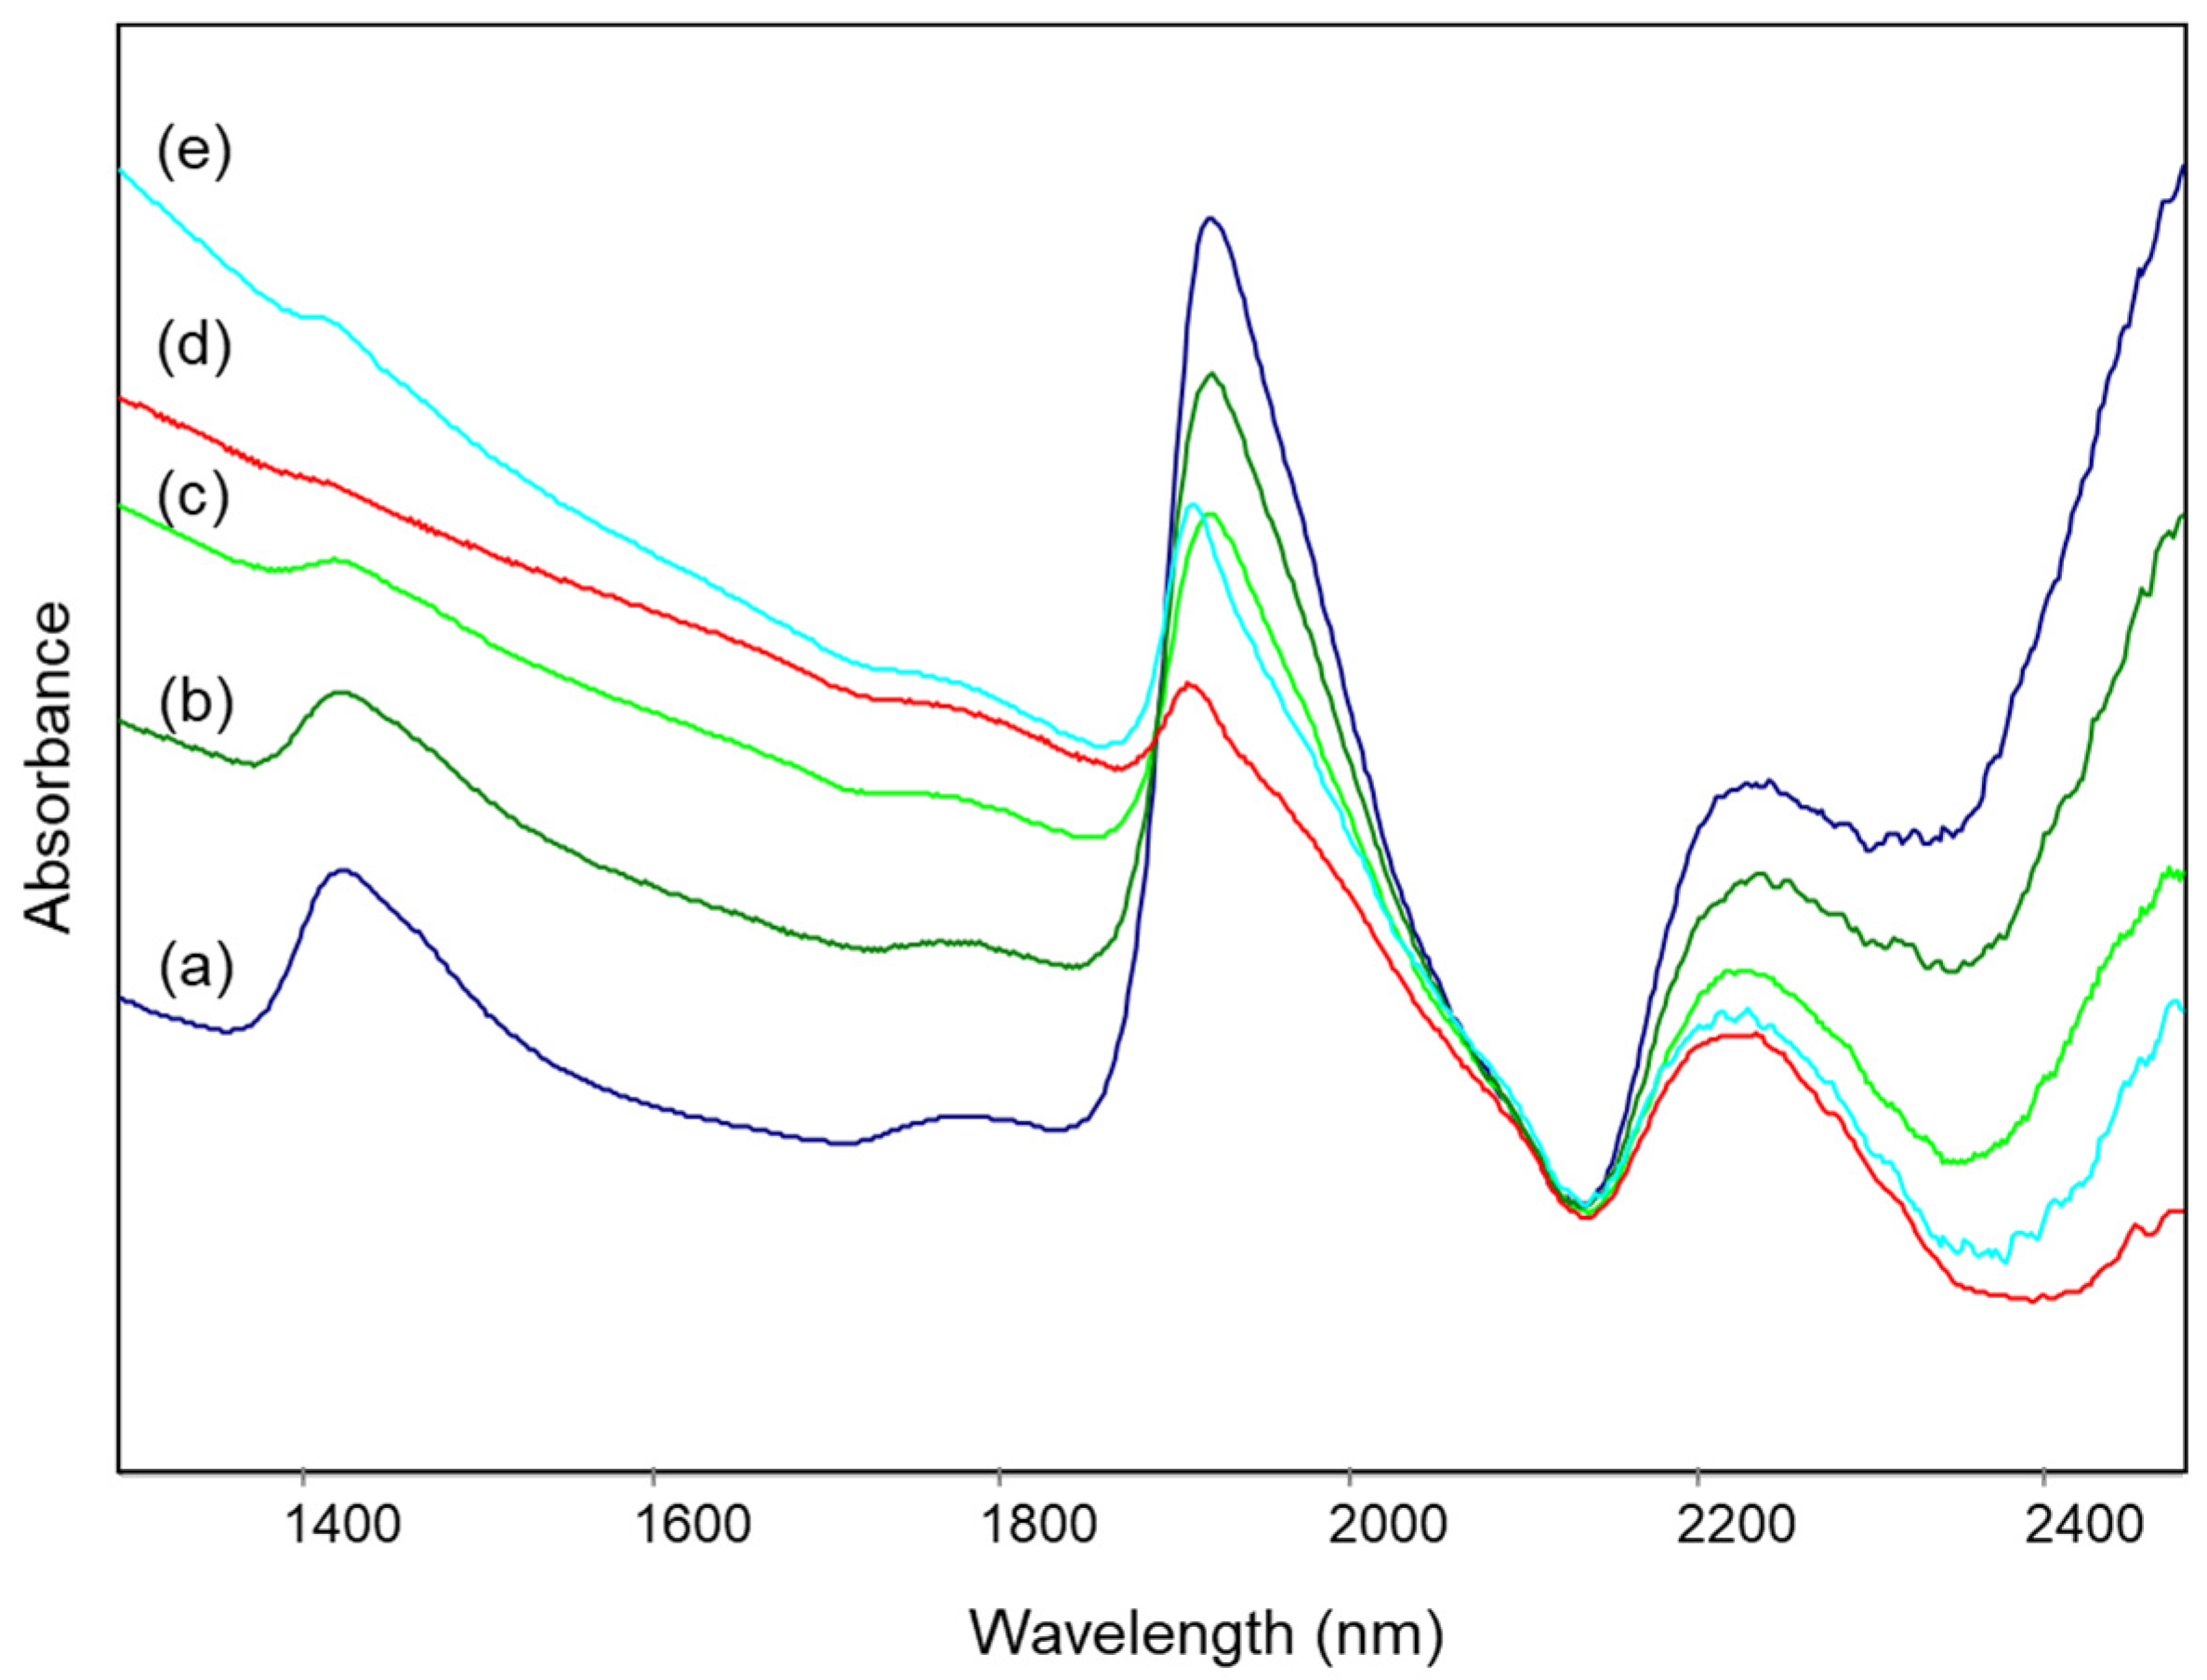
Figure 6.
Diffuse reflectance NIR spectra of archaeological samples from the Civita di Tarquinia: (a) sample 3/1010; (b) sample 80/25; (c) sample 162/1/34; (d) sample 3/607; (e) sample 30.
Figure 6 shows the NIR spectra of some of the examined samples, located in different parts of the score plot, in particular sample 3/1010 (top of the plot), sample 80/25 (right above the middle of the plot), samples 30 and 162/1/34 (both below the middle of the plot, but shifted with respect to each other along the first component) and sample 3/607 (bottom of the plot). As expected, the intensity of bands at about 1410 and 1910 nm due to absorbed water (and also, in the first case, to the residual OH groups, as explained above) decreases from top to bottom and samples for which the scores are similar for the second component but lower for the first one show spectra with a background absorption rising towards the visible region, which also causes a slight shift of the band around 1900 nm to lower wavelengths. It should be noted that none of the spectra showed the typical bands of lattice OH groups (see above), and therefore all the ceramic samples were fired at temperatures no lower than 700–800 °C. Nevertheless, the amount of absorbed water appears to be higher in comparison with the specimens of reference clay heated at the corresponding temperatures. As already suggested [23], this fact can be explained considering that the water content in the archaeological materials could reach its equilibrium value during burial, differently from recently fired mock-ups.
It is also worth noting that in the score plot of Figure 5a the archaeological samples are also grouped according to their class. The Etruscan-geometric ones, which are the most ancient and datable to the 8th–7th century, have a higher content of absorbed water in comparison with Etruscan-Corinthian and black gloss ones, generally dated to the 6th century or later.
3.3. Mineralogical Composition of the Archaeological Samples from the Civita di Tarquinia: Semi-Quantitative Analysis Based on FTIR Spectra and Comparison with XRD Data
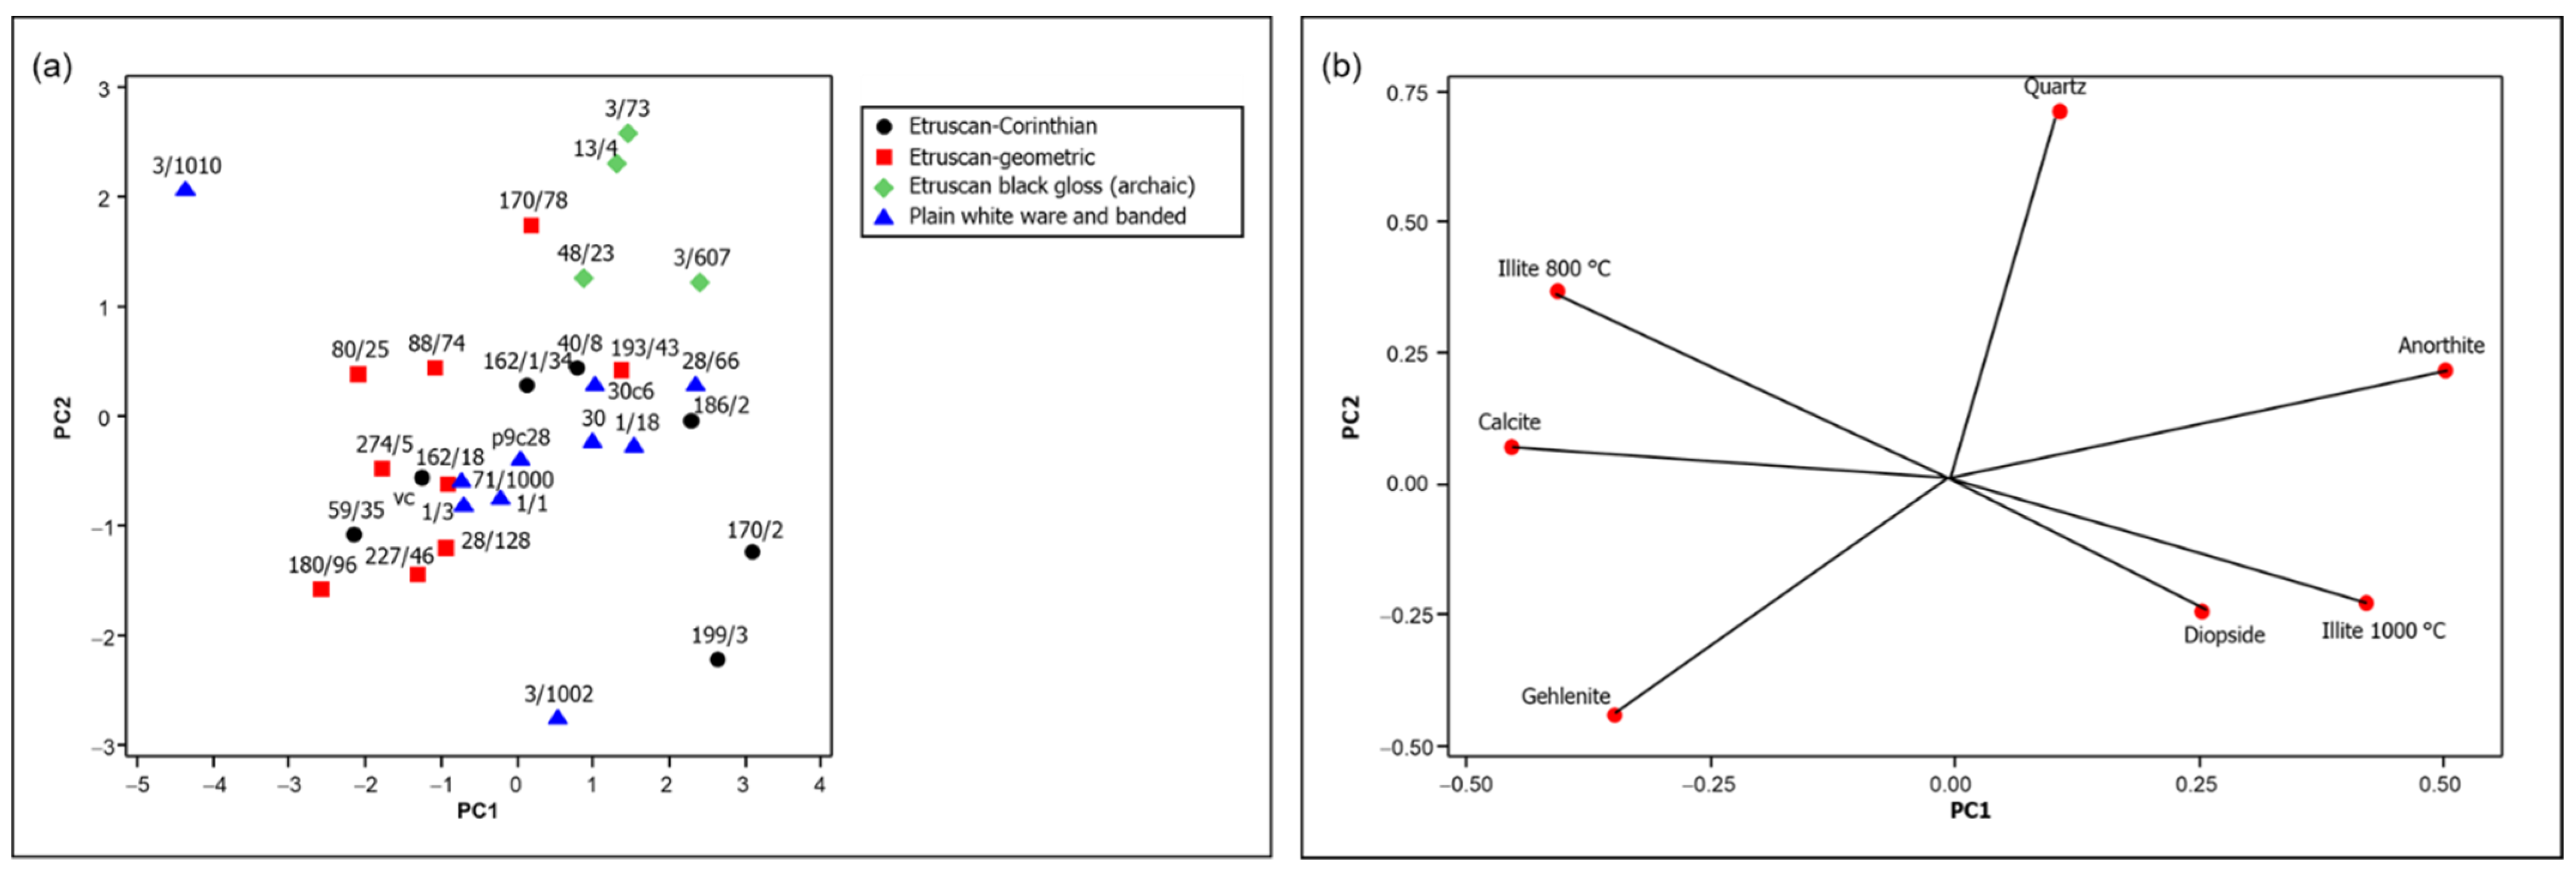
As indicated above, the mineralogical composition data resulting from the PLS model applied to the FTIR spectra of the archaeological samples, reported in Table S1 (Supplementary Material), were subjected to PCA for a better comparison. The score and loading plots of the first two principal components are shown in Figure 7.
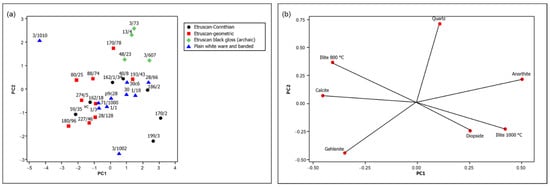
Figure 7.
(a) Score plot and (b) loading plot of the first two principal components of the mineralogical composition data obtained from the PLS model based on FTIR spectra (69.4% variance explained, of which 45.7% by PC1 and 23.7% by PC2).
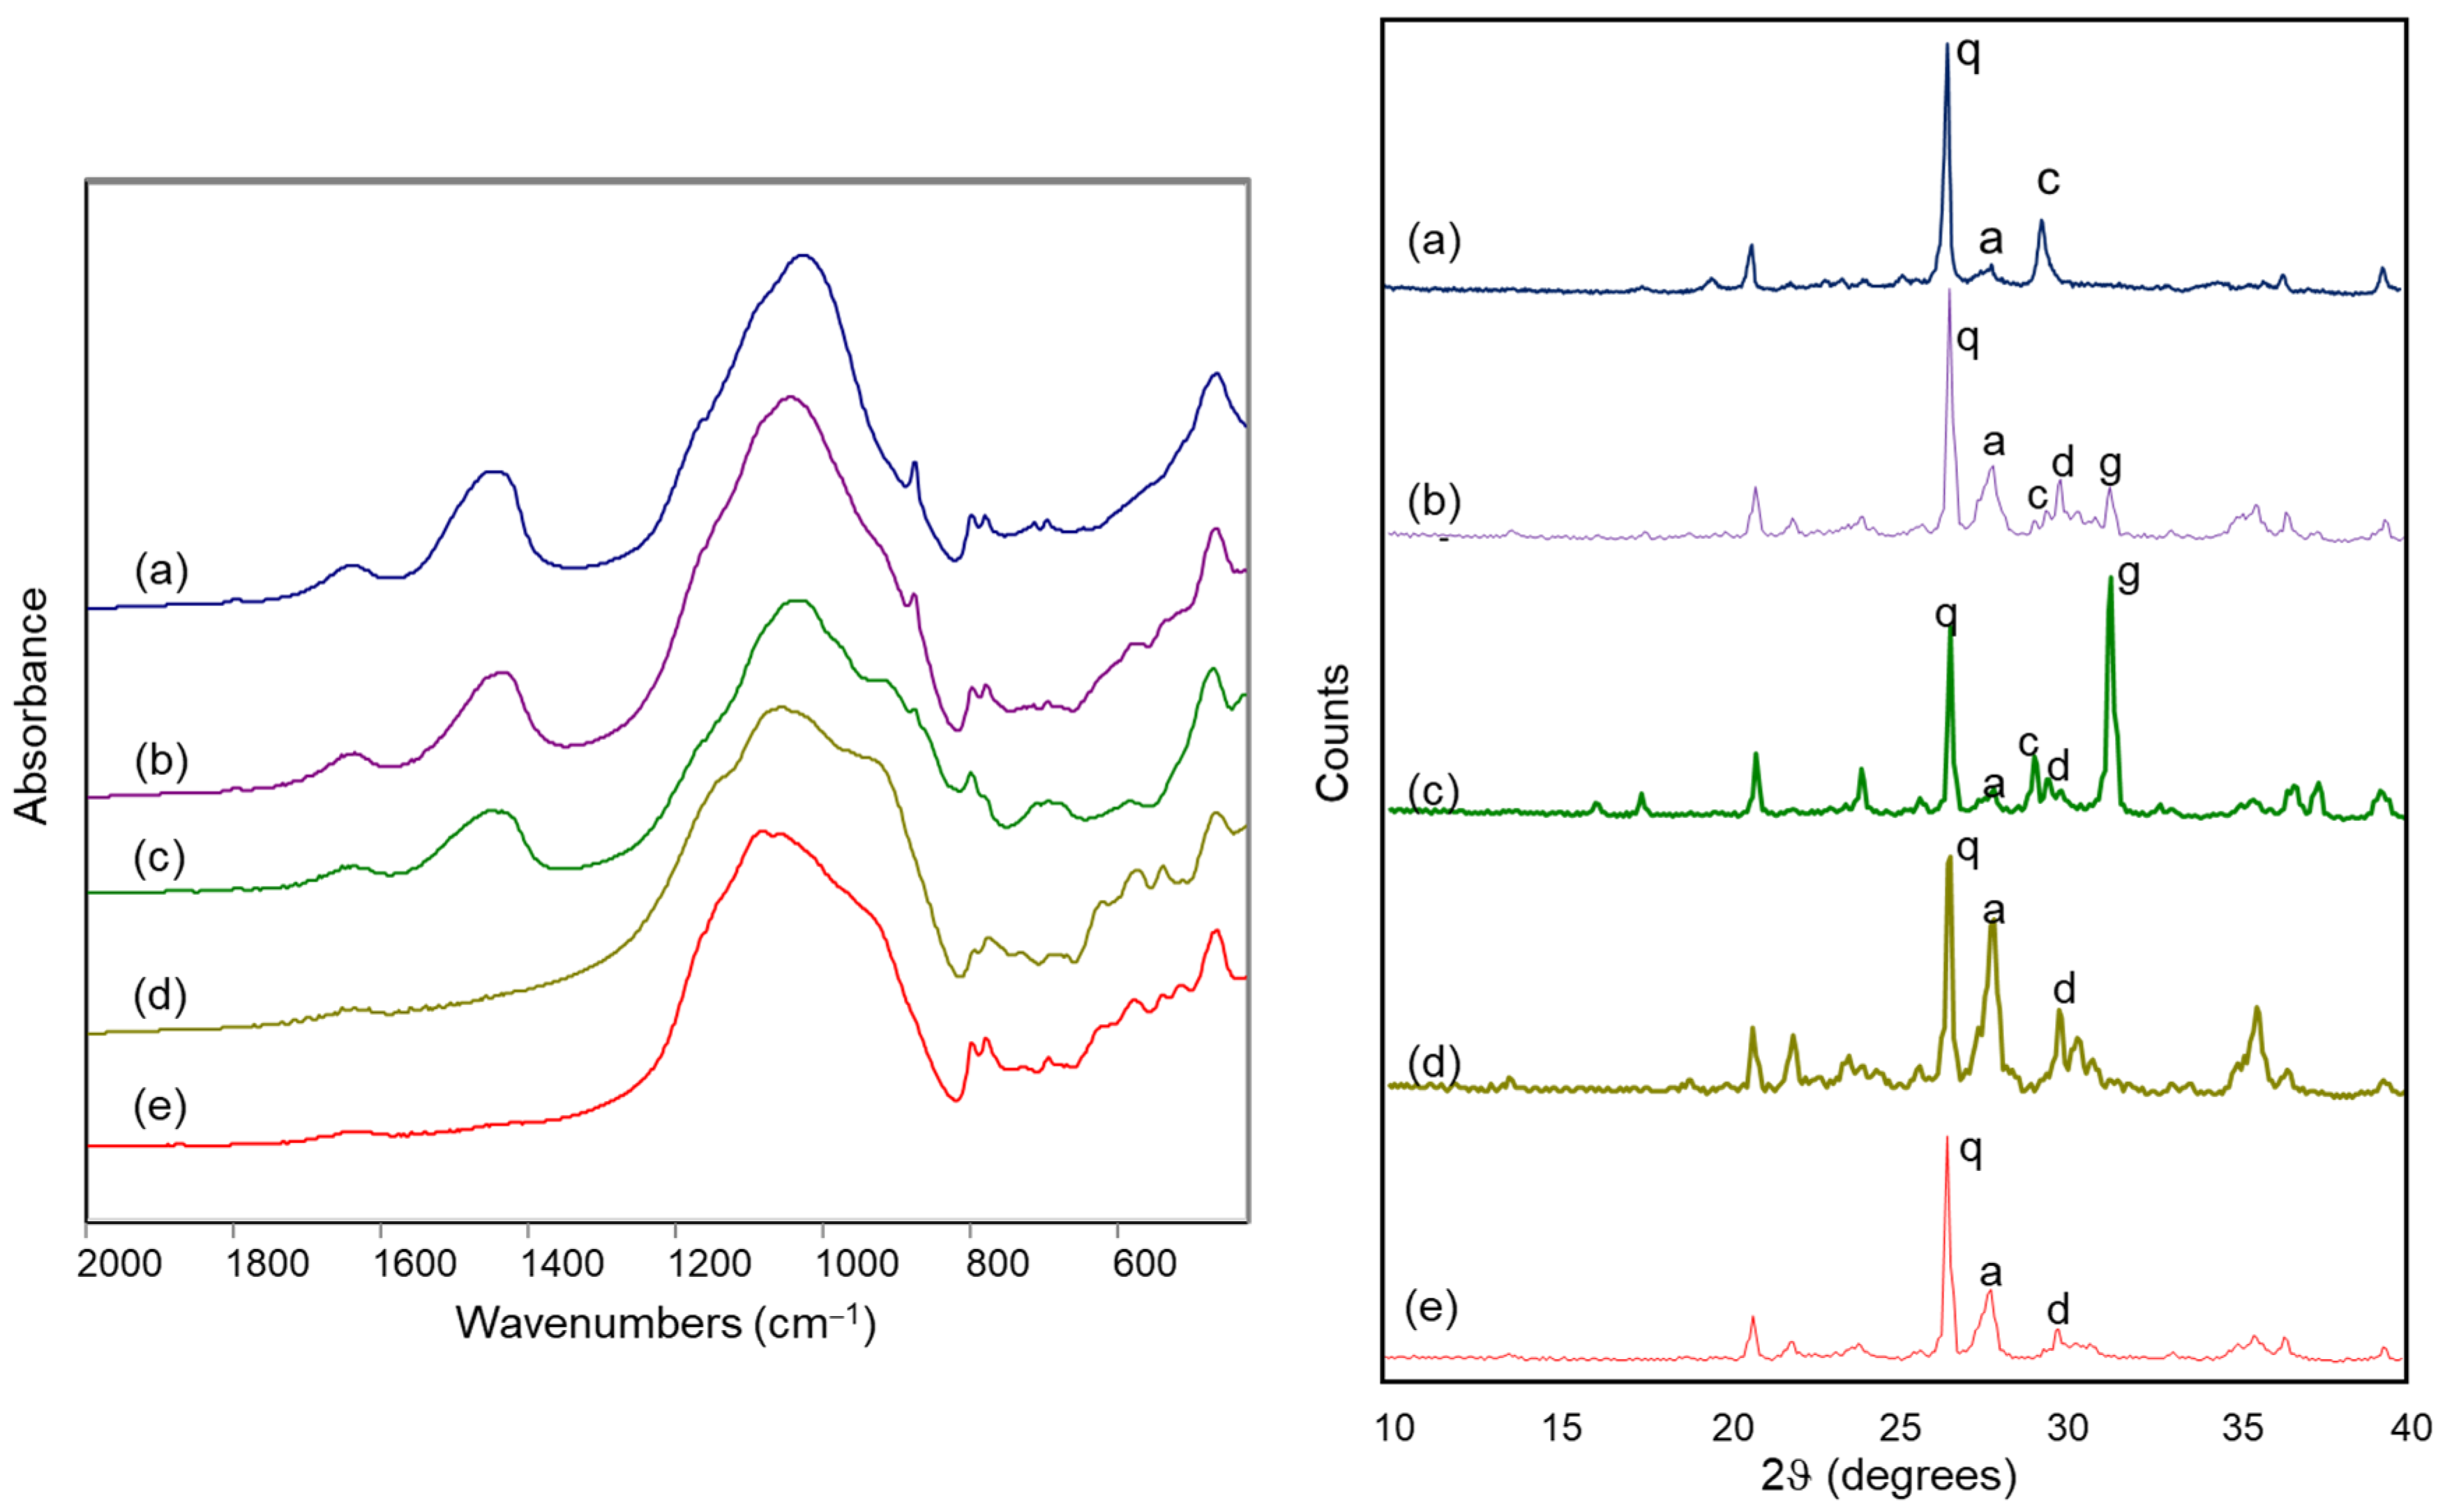
Figure 8 reports the FTIR spectra and the X-ray diffraction patterns of some of the archaeological samples, positioned in different areas of the score plot shown in Figure 7.
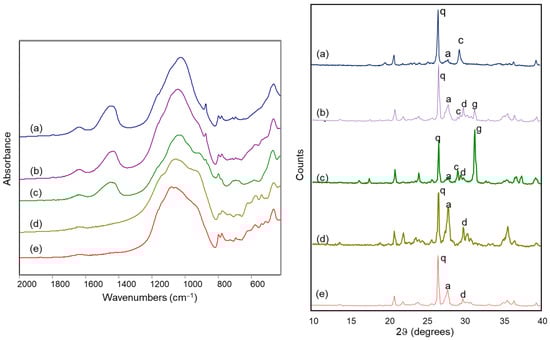
Figure 8.
FTIR spectra (left) and X-ray diffraction patterns (right) of archaeological ceramic samples from the Civita di Tarquinia: (a) sample 3/1010; (b) sample 88/74; (c) sample 180/96; (d) sample 170/2; (e) sample 13/4. Legend: a = anorthite; c = calcite; d = diopside; g = gehlenite; q = quartz.
In detail, sample 3/1010, located in the upper left part of the score plot, presents a relevant amount of calcite and the absence of silicate phases formed during firing in the XRD analysis and an evident band at around 1450 cm−1 due to calcite in the FTIR spectrum (a in Figure 8). Sample 88/74, roughly in the middle of the score plot, still contains calcite, as shown by the diffraction pattern, but also diopside and gehlenite, which are responsible for the broadening of the Si-O stretching band towards the lower wavenumbers in the FTIR spectrum (b in Figure 8): characteristic bands due to diopside and gehlenite are in fact located at 970, 930, 920 and 870 cm−1 [29,30]. A shoulder at 930 cm−1 becomes evident in the FTIR spectrum of sample 180/96, which is in fact in the lower left part of the score plot and shows a strong XRD peak due to gehlenite (c in Figure 8). For sample 170/2, positioned in the right part of the score plot, the XRD analysis shows a relevant amount of anorthite which is also associated with the pronounced shoulder at 940 cm−1 and the evident bands at 620, 570 and 540 cm−1 in the FTIR spectrum (d in Figure 8) [29,30]. Finally, sample 13/4 (e in Figure 8) contains a significant quantity of anorthite and diopside, as shown by the X-ray diffraction pattern, but also a relevant amount of quartz, which shifts its score values towards the upper right part of the plot; its FTIR spectrum shows the same characteristic bands of the silicates formed upon firing already considered above, and a more pronounced component of the Si-O stretching band at 1080 cm−1, due to quartz.
The comparison of the score and the loading plots in Figure 7 suggests that the firing temperature increased for the examined pottery samples from left to right, and in fact a correspondence can be observed with the analogous trend observed in Figure 5 based on the NIR spectra. This is the case, for example, of sample 3/1010, characterized by a high content of absorbed water and, at the same time, by the mineralogical phases discussed above and indicating a firing temperature not higher than 800 °C. All the other samples show phases corresponding to firing temperatures from 850 to 1100 °C (see Figure 1), with Etruscan-geometric pottery located in the lower part of this range and most Etruscan-Corinthian and black-gloss pottery in the upper part. Therefore, the hypotheses previously made on the firing temperature based on the NIR spectra are supported by these observations.
However, other factors also contributed to determining the mineralogical composition of the fragments examined. In the case of some of the most ancient ones, belonging to the Etruscan-geometric class, significant amounts of gehlenite are detected, due to the coarser granulometry of the raw material, which allows its formation at grain boundaries where the local composition can be different from that of the bulk [19]. In other cases, such as that of the Etruscan-Corinthian sample 199/3, a different provenance was hypothesized on the basis of the elemental composition [16].
3.4. Diffuse Reflectance Visible-NIR Spectra of Archaeological Ceramic Samples from the Civita di Tarquinia
Also, the portion of the diffuse reflectance spectra in the visible range can be of interest in explaining and classifying the characteristics of the ceramic paste of the archaeological samples, in particular from the point of view of their color. Figure 9 shows as examples the spectra of four ceramic materials, representative of the patterns observed in the visible-NIR spectra for the ceramic pastes of fine ware from the Civita di Tarquinia.

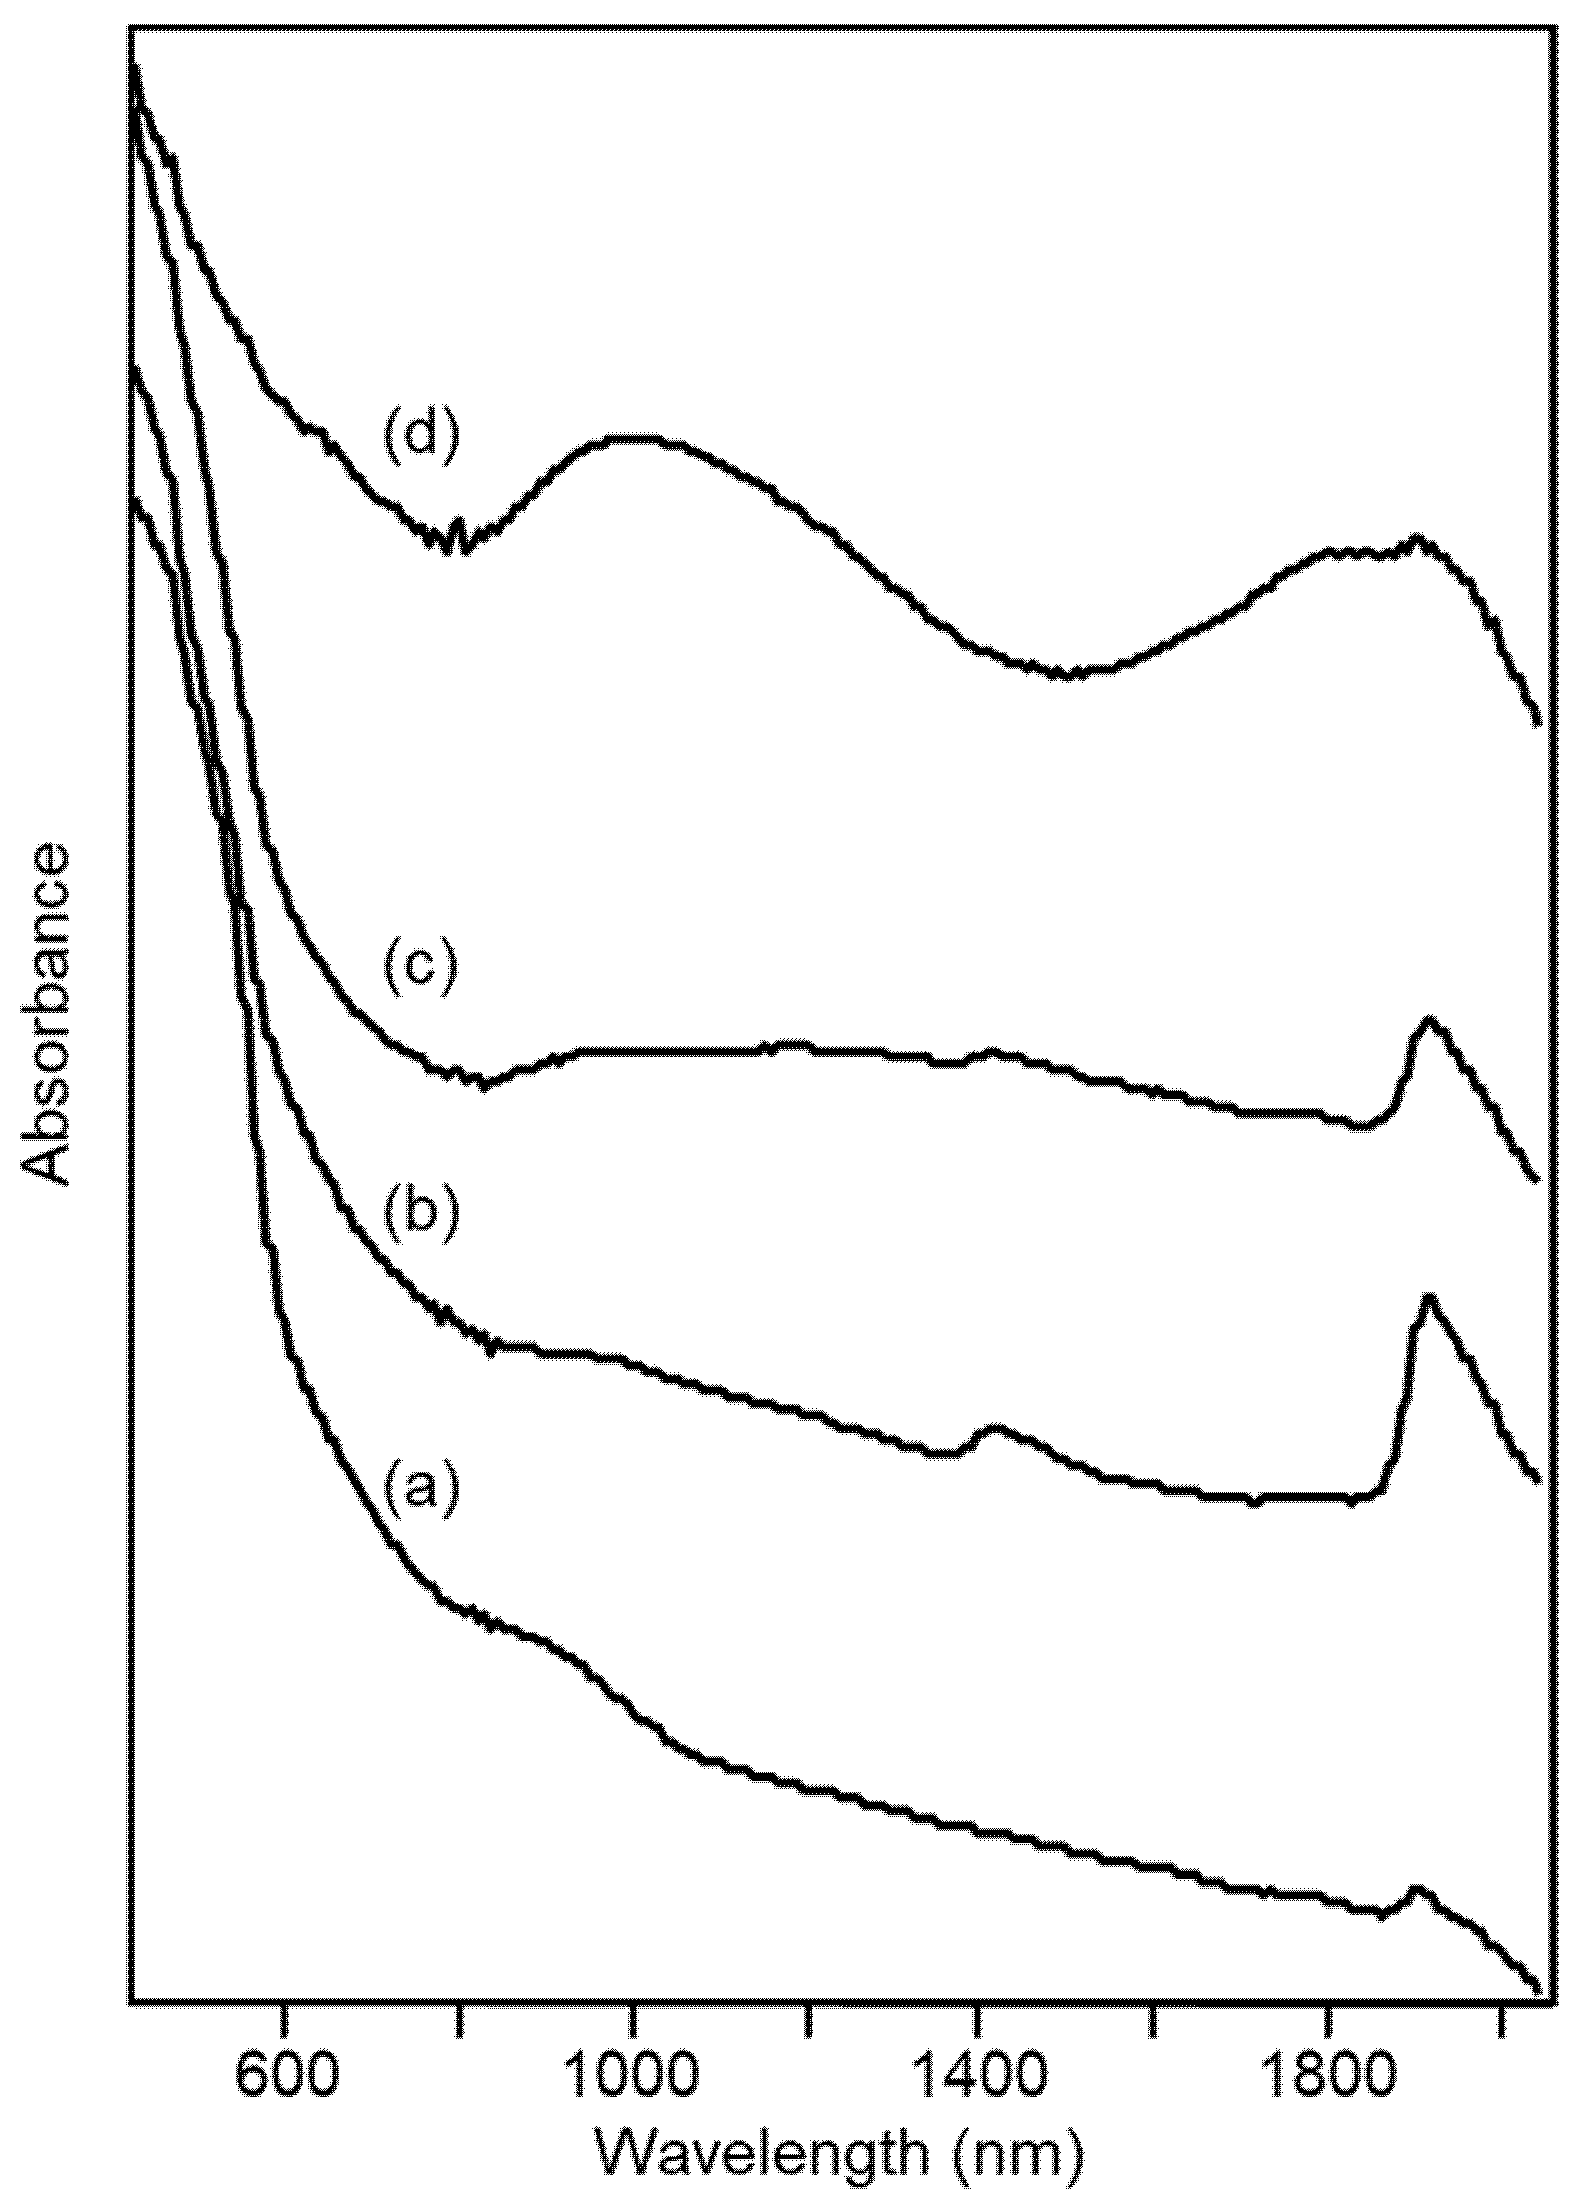
Figure 9.
Diffuse reflectance visible-NIR spectra of archaeological ceramic samples from the Civita di Tarquinia: (a) sample 3/73, grey-pink; (b) sample 28/128, pale yellow; (c) sample 274/5, pale yellow; (d) sample 3/610, dark grey.
In the case of the sample 3/73, whose color was defined by the archaeologists as grey-pink, the typical bands of hematite at 550 and 850 nm (and, less evident, 660 nm) [31] can be observed. These bands are progressively less distinguishable for the pale-yellow ceramic fragments 28/128 and 274/5. Especially for the latter, an increase in absorbance around 1000 nm is observed which can be assigned to Fe(II) in a disordered environment. Finally, for the dark grey sample 3/610 two bands due to Fe(II) are clearly evident in the NIR region of the spectrum. The first is around 1000 nm and is attributed to hexa-coordinated Fe(II) [32], as in an octahedral site of diopside (or hedenbergite CaFeSi2O6). The second band is around 1800 nm and can be assigned to tetra-coordinated Fe(II), as in hercynite FeAl2O4 [32]. The presence of this latter phase could in fact be recognized, as well as that of diopside, in the X-ray diffraction pattern of the dark grey sample (data not shown).
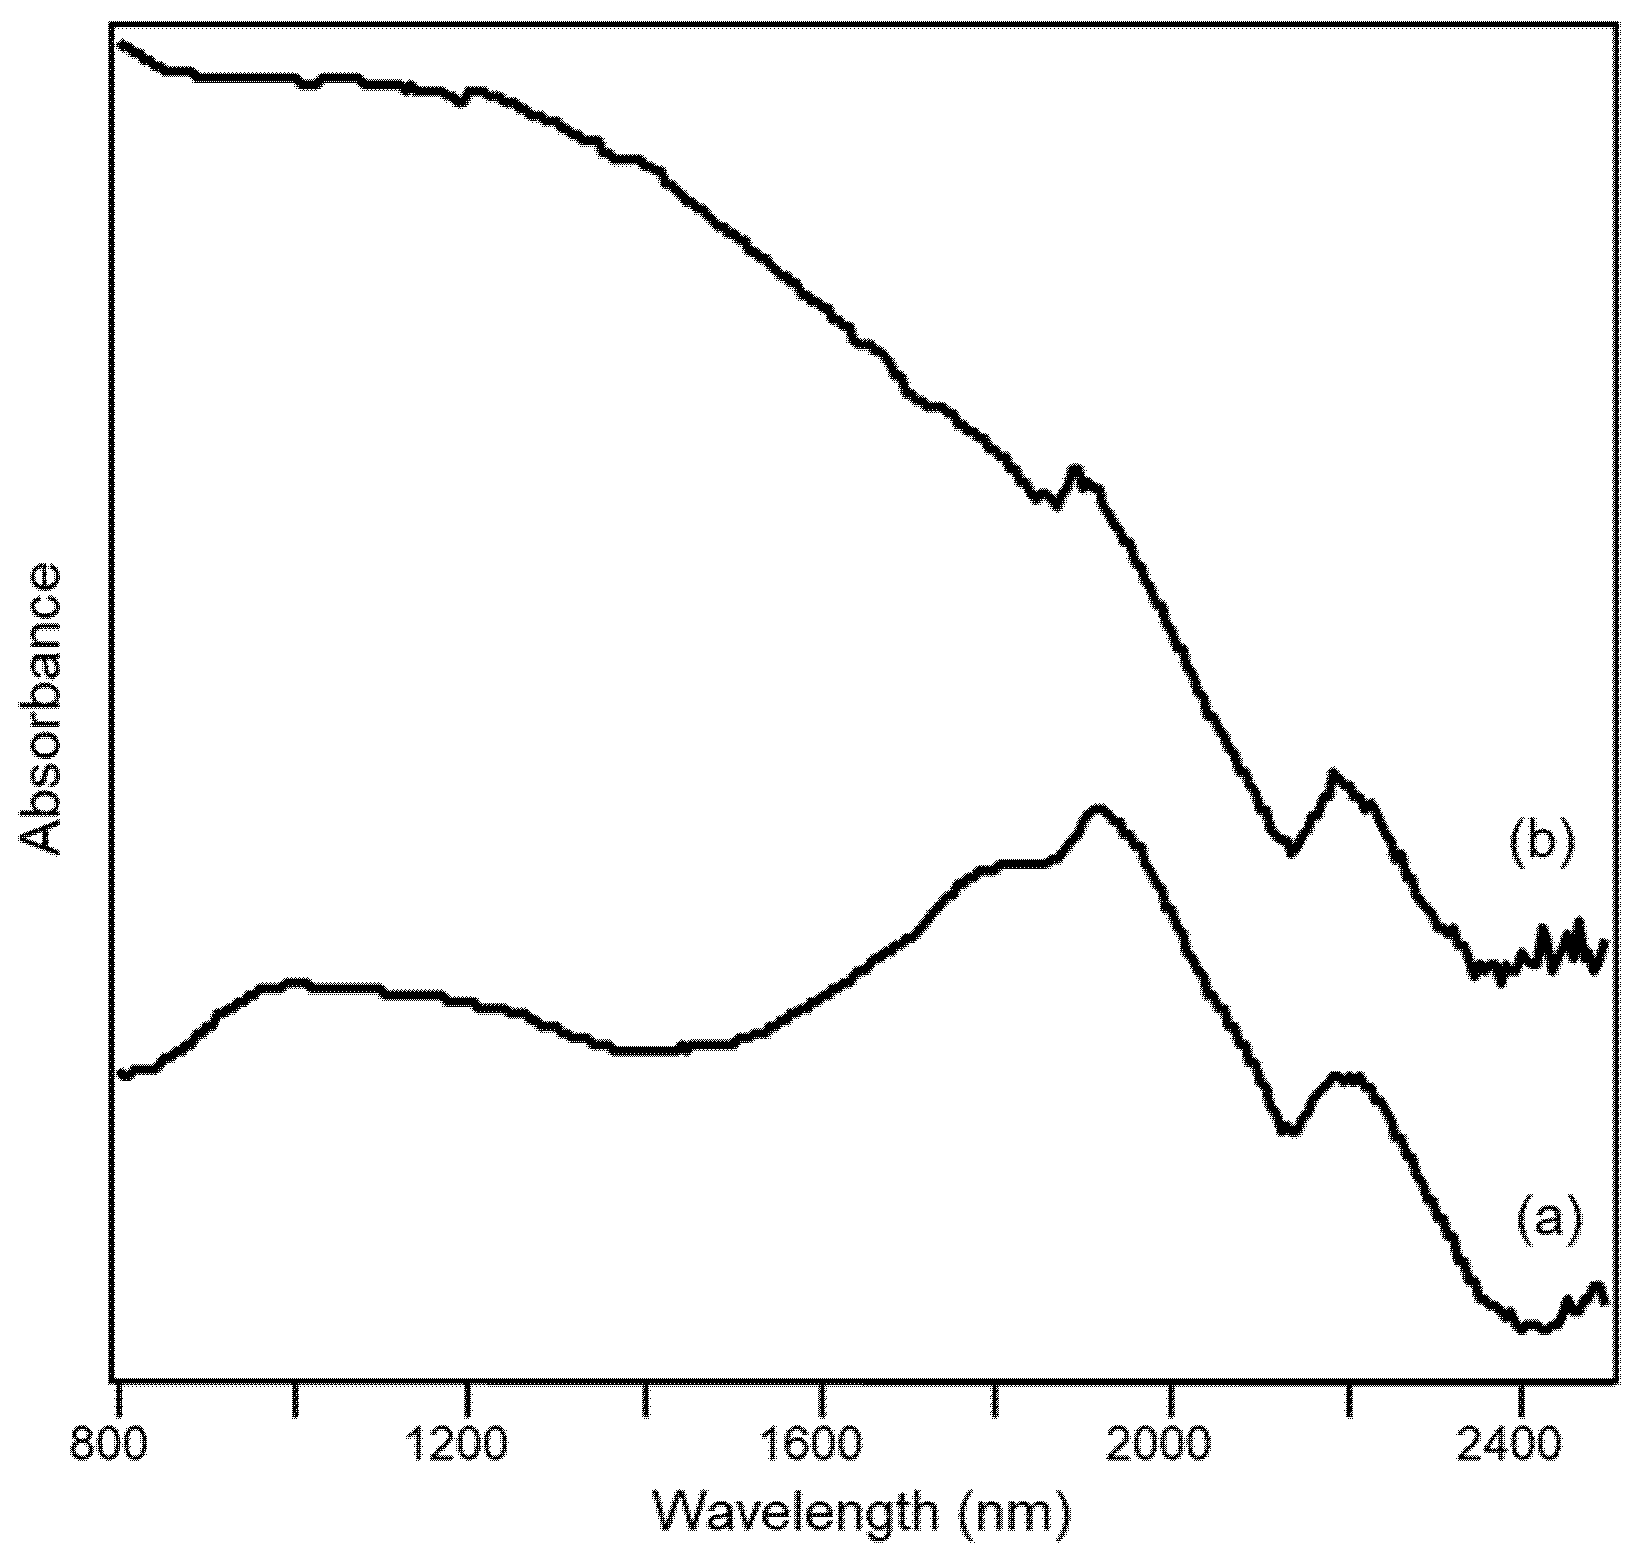
Interestingly, the diffuse reflectance visible-NIR spectrum makes it possible to distinguish if the grey (or black) color of a ceramic paste is due to the presence of Fe(II) oxides or of carbon, as can be seen in Figure 10 where the spectrum of a sherd of grey pottery is compared with that of a sherd of “bucchero”. “Bucchero” is a class of typical Etruscan ceramic materials uniformly black or dark grey both in the fabric and in the surface. It is evident from the spectra that the main source of the black color in the “bucchero” sample is elemental carbon, giving rise to a continuous absorption from the NIR to the visible region [33], while the bands discussed above and due to Fe(II), if present, are hidden by the broad absorption due to carbon. In fact, it has been hypothesized that the color of “bucchero” was obtained by firing the clay in a reducing atmosphere and in the presence of organic material, naturally contained in the clay or, more probably, added on purpose in the kiln by the potter himself [34].
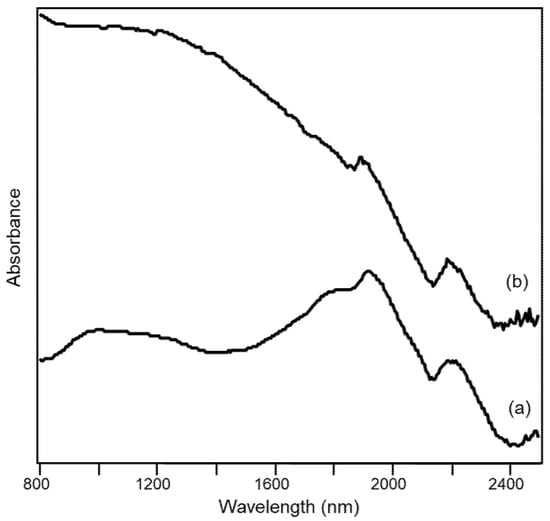
Figure 10.
Diffuse reflectance visible-NIR spectra of archaeological ceramic samples from the Civita di Tarquinia: (a) sherd of grey pottery (36/1000); (b) sherd of “bucchero” (30b).
4. Conclusions
In the present work, some examples of the contribution that diffuse reflectance NIR spectroscopy can give to the study of the firing conditions of a ceramic material have been presented.
The ease of use of the technique makes it suitable for a rapid screening of numerous samples, giving an independent indication about their firing temperature, at least relative in the case of materials obtained from similar clays. This possibility has been demonstrated by comparison with a semi-quantitative study of mineralogical phases for a series of archaeological ceramic samples from the Etruscan site of Tarquinia. In particular, considering the different sub-classes of fine ware from the Civita, it was possible to conclude that Etruscan-geometric ceramic materials, dating back to the 8th–7th century, experienced a lower firing temperature, even if not lower than 700–800 °C, than more recent materials, such as Etruscan-Corinthian and black gloss ones, dating back to the 6th century and later. The mineralogical phases detected by FTIR spectroscopy combined with the use of a PLS model and by XRD confirmed for most samples a firing temperature ranging from 850 to 1100 °C, in agreement with the results obtained by NIR spectroscopy combined with PCA of spectral data.
A further potentiality of the technique lies in the information that can be obtained from it, if extended to include also the visible region of the electromagnetic spectrum, about the species that are responsible for the color of the ceramic paste. The typical NIR absorptions of iron(II) in different coordination geometries could be observed, especially for those samples showing a grey-colored fabric. From the comparison with the spectra of “bucchero” samples, for which one representative example was shown, it was also highlighted the possibility of distinguishing by means of visible-NIR reflectance spectroscopy if the grey-black color of a ceramic paste originates from elemental carbon or from phases containing reduced iron.
Supplementary Materials
The following supporting information can be downloaded at: https://www.mdpi.com/article/10.3390/min12040412/s1, Table S1: Weight fractions of the mineralogical phases obtained from the PLS model.
Funding
This research received no external funding.
Informed Consent Statement
Not applicable.
Data Availability Statement
Not applicable.
Conflicts of Interest
The authors declare no conflict of interest.
References
- Tite, M.S. Ceramic production, provenance and use—A review. Archaeometry 2008, 50, 216–231. [Google Scholar] [CrossRef]
- Tite, M.S. Determination of the firing temperature of ancient ceramics by measurement of thermal expansion: A reassessment. Archaeometry 1969, 11, 131–143. [Google Scholar] [CrossRef]
- Heimann, R.; Franklin, U.M. Archaeo-thermometry: The assessment of firing temperatures of ancient ceramics. J. Int. Inst. Conserv.-Can. Group 1979, 4, 23–45. [Google Scholar]
- Palmiter, T.; Johnson, P. Techniques for archaeothermometry. MRS Proc. 1988, 123, 135–140. [Google Scholar] [CrossRef]
- Tite, M.S. Firing Temperature Determination: How and Why? In The Aim of Laboratory Analysis in Archaeology; KVHAA Konferenser 34; Lindahl, A., Stilberg, O., Eds.; Kungl. Vitterhets Historie och Antikvitets Akademien: Stockholm, Sweden, 1995; pp. 37–42. [Google Scholar]
- Holakooei, P.; Tessari, U.; Verde, M.; Vaccaro, C. A new look at XRD patterns of archaeological ceramic bodies. J. Therm. Anal. Calorim. 2014, 118, 165–176. [Google Scholar] [CrossRef]
- Maritan, L.; Holakooei, P.; Mazzoli, C. Cluster analysis of XRPD data in ancient ceramics: What for? Appl. Clay Sci. 2015, 114, 540–549. [Google Scholar] [CrossRef]
- Mangueira, G.M.; Toledo, R.; Teixeira, S.; Franco, R.W.A. A study of the firing temperature of archeological pottery by X-ray diffraction and electron paramagnetic resonance. J. Phys. Chem. Solids 2011, 72, 90–96. [Google Scholar] [CrossRef]
- Maritan, L.; Mazzoli, C.; Freestone, I. Modelling changes in mollusc shell internal microstructure during firing: Implications for temperature estimation in shell-bearing pottery. Archaeometry 2007, 49, 529–541. [Google Scholar] [CrossRef]
- Maggetti, M.; Galetti, G. Archäometrische Untersuchungen an spätlateinezeitlicher Keramik von Basel-Gasfabrik und Sissach-Brühl. Archäologisches Korresp. 1981, 11, 321–328. [Google Scholar]
- Nodari, L.; Marcuz, E.; Maritan, L.; Mazzoli, C.; Russo, U. Hematite nucleation and growth in the firing of carbonate-rich clay for pottery production. J. Eur. Ceram. Soc. 2007, 27, 4665–4673. [Google Scholar] [CrossRef]
- Maritan, L.; Nodari, L.; Mazzoli, C.; Milano, A.; Russo, U. Influence of firing conditions on ceramic products: Experimental study on clay rich in organic matter. Appl. Clay Sci. 2006, 31, 1–15. [Google Scholar] [CrossRef]
- Maggetti, M.; Galetti, G.; Schwander, H.; Picon, M.; Wessicken, R. Campanian pottery; the nature of the black coating. Archaeometry 1981, 23, 199–207. [Google Scholar] [CrossRef]
- Bruni, S.; Guglielmi, V.; Della Foglia, E.; Castoldi, M.; Bagnasco Gianni, G. A non-destructive spectroscopic study of the decoration of archaeological pottery: From matt-painted bichrome ceramic sherds (southern Italy, VIII–VII B.C.) to an intact Etruscan cinerary urn. Spectrochim. Acta A 2018, 191, 88–97. [Google Scholar] [CrossRef] [PubMed] [Green Version]
- Stevenson, C.M.; Gurnick, M. Structural collapse in kaolinite, montmorillonite and illite clay and its role in the ceramic rehydroxylation dating of low-fired earthenware. J. Archaeol. Sci. 2016, 69, 54–63. [Google Scholar] [CrossRef] [Green Version]
- Cariati, F.; Bruni, S.; Fermo, P. Indagini chimico-fisiche sulla ceramica depurata e di impasto. In Tarquinia Scavi Sistematici Nell’abitato. Campagne 1982–1988. I Materiali 2; Bonghi Jovino, M., Ed.; L’Erma di Bretschneider: Roma, Italy, 2001; pp. 525–536. [Google Scholar]
- Ispra: Carta Geologica D’Italia 1:50000-354 Tarquinia. Available online: https://www.isprambiente.gov.it/Media/carg/354_TARQUINIA/Foglio.html (accessed on 27 February 2022).
- Wold, H. Soft Modeling by Latent Variables: The Nonlinear Iterative Partial Least Squares Approach. In Perspectives in Probability and Statistics, Papers in Honour of M.S. Bartlett; Gani, J., Ed.; Academic Press: London, UK, 1975; pp. 117–142. [Google Scholar]
- Heimann, R.B. Assessing the technology of ancient pottery: The use of ceramic phase diagrams. Archeomaterials 1989, 3, 123–148. [Google Scholar]
- Heimann, R.B.; Maggetti, M. Experiments on simulated burial of calcareous terra sigillata (mineralogical change). Preliminary results. Br. Mus. Occas. Pap. 1981, 19, 163–177. [Google Scholar]
- Shoval, S.; Beck, P. Thermo-FTIR spectroscopy analysis as a method of characterizing ancient ceramic technology. J. Therm. Anal. Calorim. 2005, 82, 609–616. [Google Scholar] [CrossRef]
- Cheng, J.-H.; Sun, D.-W. Partial least squares regression (PLSR) applied to NIR and HIS spectral data modeling to predict chemical properties of fish muscle. Food Eng. Rev. 2017, 9, 36–49. [Google Scholar] [CrossRef]
- Bruni, S.; Cariati, F.; Bagnasco Gianni, G.; Bonghi Jovino, M.; Artioli, G.; Russo, U. Spectroscopic characterization of Etruscan depurata and impasto pottery from the excavation at Pian di Civita in Tarquinia (Italy): A comparison with local clay. In Archaeology and Clays, BAR International Series 942; Druc, I., Ed.; BAR Publishing: Oxford, UK, 2001; pp. 27–38. [Google Scholar]
- Chanéac, C.; Tronc, E.; Jolivet, J.P. Magnetic iron oxide–silica nanocomposites. Synthesis and characterization. J. Mater. Chem. 1996, 6, 1905–1911. [Google Scholar] [CrossRef]
- Cariati, F.; Erre, L.; Micera, G.; Piu, P.; Gessa, C. Water molecules and hydroxyl groups in montmorillonites as studied by near infrared spectroscopy. Clays Clay Miner. 1981, 29, 157–159. [Google Scholar] [CrossRef]
- Cariati, F.; Erre, L.; Micera, G.; Piu, P.; Gessa, C. Effects of layer charge on the near-infrared spectra of water molecules in smectites and vermiculites. Clays Clay Miner. 1983, 31, 447–449. [Google Scholar] [CrossRef]
- Michael, P.J.; McWhinnie, W.R. Mössbauer and esr studies of the thermochemistry of illite and montmorillonite. Polyhedron 1989, 8, 2709–2718. [Google Scholar] [CrossRef]
- Maniatis, Y.; Katsanos, A.; Caskey, M.E. Technological examination of low-fired terracotta statues from Ayia Irini, Kea. Archaeometry 1982, 24, 191–198. [Google Scholar] [CrossRef]
- van der Marel, H.W.; Beutelspacher, H. Atlas of Infrared Spectroscopy of Clay Minerals and Their Admixtures; Elsevier: Amsterdam, The Netherlands, 1976. [Google Scholar]
- Gasden, J.A. Infrared Spectra of Minerals and Related Inorganic Compounds; Butterworths: London, UK, 1975. [Google Scholar]
- Marusak, L.A.; Messier, R.; White, W.B. Optical absorption spectrum of hematite, αFe2O3 near IR to UV. J. Phys. Chem. Solids 1980, 41, 981–984. [Google Scholar] [CrossRef]
- Lever, A.B.P. Inorganic Electronic Spectroscopy, 2nd ed.; Elsevier: Amsterdam, The Netherlands, 1984. [Google Scholar]
- Han, D.; Meng, Z.; Wu, D.; Zhang, C.; Zhu, H. Thermal properties of carbon black aqueous nanofluids for solar absorption. Nanoscale Res. Lett. 2011, 6, 457. [Google Scholar] [CrossRef] [Green Version]
- Rasmussen, T.B. Bucchero Pottery from Southern Etruria; Cambridge University Press: Cambridge, UK, 2006; p. 2. [Google Scholar]
Publisher’s Note: MDPI stays neutral with regard to jurisdictional claims in published maps and institutional affiliations. |
© 2022 by the author. Licensee MDPI, Basel, Switzerland. This article is an open access article distributed under the terms and conditions of the Creative Commons Attribution (CC BY) license (https://creativecommons.org/licenses/by/4.0/).