Article

Research on the Mechanical Properties and Damage Constitutive Model of Multi-Shape Fractured Sandstone under Hydro-Mechanical Coupling

1
School of Civil and Resource Engineering, University of Science and Technology Beijing, Beijing 100083, China
2
Beijing Key Laboratory of Urban Underground Space Engineering, University of Science and Technology Beijing, Beijing 100083, China
3
Beijing Municipal Engineering Research Institute, Beijing 100037, China
4
Jining Energy Development Group Co., Ltd., Jining 272000, China
5
Institute of Architectural Civil Engineering, Langfang Teachers University, Langfang 065000, China
*
Author to whom correspondence should be addressed.
Minerals 2022, 12(4), 436; https://doi.org/10.3390/min12040436
Submission received: 24 January 2022 / Revised: 24 March 2022 / Accepted: 25 March 2022 / Published: 31 March 2022
(This article belongs to the Special Issue Failure Characteristics of Deep Rocks)

Abstract

:
In this paper, mechanical property tests of sandstone with multiple shapes of prefabricated fractures (single, T-shaped, and Y-shaped fractures) are carried out through the MTS815 rock mechanics testing machine and the Teledyne ISCO D-Series Pumps system. Considering the hydro-mechanical coupling effects, the experiments reveal the key thresholds, strength characteristics and deformation laws of multi-shape fractured sandstones during the progressive failure process. According to the elastic-plastic theory, the continuous damage theory and the statistical damage theory, a new damage model is constructed, which fully reflects the coupled effects among water, micro flaws and macroscopic prefabricated fractures. The crack closure stress σcc, crack initiation stress σci and damage stress σcd of multi-shape fractured sandstone samples are determined by the proposed volumetric strain response method. In the range of 0–90°, the σcc and σci of the multi-shape fractured sandstone samples are different, as well as the angles when the σcd and peak strength (σc) reach their peak values. The stress ratios (the σcc/σc, σci/σc, and σcd/σc are collectively referred to as stress ratios) are hardly affected by the shape and inclination of the fractures inside the rock. According to strength analysis and deformation characteristics, the weakening effect of water has less of an influence on the strength than prefabricated fractures. The stress–strain curve obtained, based on the hydro-mechanical coupling test, is in good agreement with the theoretical curve generated by the damage constitutive model, verifying the rationality of the damage constitutive model. In addition, the fracture inclination only affects the numerical value of the total damage variable of multi-shape fractured sandstone samples, and has minor effects on its variation trend.

1. Introduction

In engineering activities, such as mining development, water conservancy and hydropower construction, and geothermal mining, underground fractured rock mass often exists in an environment in which the stress field and seepage field interact with each other, and there are many pores and fractures of different scales and shapes inside the fractured rock mass. The mechanical properties of fractured rocks become more complex, and the damage evolution law is also affected to a greater extent under hydro-mechanical coupling [1,2,3]. Therefore, studying the mechanical properties and damage constitutive model of the fractured rock mass during the damage and failure process under hydro-mechanical coupling helps to reveal the evolution mechanism of the progressive failure of the fractured rock mass, and provide theoretical support and a scientific basis for projects in the field of underground geotechnical engineering.
Some achievements have been made in the study of rock mechanical properties under hydro-mechanical coupling. Yilmaz, Vasarhely, and Van analyzed the effect of water content on rock peak strength and elastic modulus through hydro-mechanical coupling experiments [4,5]. Kou et al. conducted a hydro-mechanical coupling test on prefabricated 45° single-fracture rocks. With the increase in water pressure, the peak strength of the samples decreased continuously, and the degree of deviatoric stress decrease in the post-peak deformation increased with the increase in the water pressure. The peak strength increases with the increasing confining pressure, and the degree of strain softening in the post-peak deformation also gradually increases with the increasing confining pressure [6]. Wang et al. studied the stress–strain law of rock samples with different water pressures and confining pressures under the action of coupling, including the characteristics of lateral strain and volume strain, and discussed the failure characteristic of fluid flow under hydro-mechanical coupling [7]. Wang et al. studied the mechanical and permeability properties of sandstone and limestone in a coal mine, before and after rock failure under hydro-mechanical coupling through laboratory experiments revealed the correlation between mechanical properties and permeability, and obtained the strength relationship between deformation and water pressure difference [8]. Song et al. studied the deformation, mechanics, fracture and strain energy characteristics of tunnel limestone through hydro-mechanical coupling experiments, which provided theoretical support for the safe excavation of water-rich tunnels [9]. Wang et al. combined laboratory tests and numerical simulation methods to study the effects of confining pressure and seepage pressure on the mechanical properties and permeability of red sandstone. In addition, new explorations can be carried out with the help of other advanced observation instruments to continuously enrich the research on the deformation and strength characteristics of rocks or rock samples with fractures under hydro-mechanical coupling [10].
In addition, many scholars established corresponding damage constitutive models for the damage evolution process of fractured rocks. Kawamoto et al. used the damage tensor to represent the discontinuous state distributed in the rock mass, and then proposed a damage constitutive model of the fractured rock mass, and studied the effect of joints on the damage, strength and deformation of the rock mass [11]. Swoboda et al. introduced the active damage tensor to reflect the phenomenon that cracks in the rock mass may close in the compression process [12]. The above studies did not consider the effect of micro-flaws in the rock materials. Some scholars fully combine the continuous damage theory, fracture damage theory and statistical strength theory, and consider randomly distributed micro-flaws, assuming that the rock micro-element strength obeys the normal distribution or Weibull distribution, further enriching and improving the development of rock damage constitutive models. Among them, Zhang et al. and Chen et al. established a macroscopic flaws damage evolution model from the perspective of fracture strain energy [13,14]. Xu and Yang proposed a fractured rock constitutive model that can reflect the initial fracture closure phase in compression. The proposed model can predict energy and damage behavior, and the model is verified by conventional triaxial compression tests of siltstone. The theoretical constitutive model is in reasonably agreement with the stress–strain curve [15]. Based on the Drucker–Prager criterion, and combined with the energy principle and fracture damage theory, Chen and Qiao established a macro–meso composite damage constitutive model for non-persistent jointed rock mass [16]. In summary, the research on the constitutive model has made abundant progress, but there are still some shortcomings. There are many studies on rock damage constitutive models using uniaxial compression tests, and rarely using triaxial tests or hydro-mechanical coupling tests.
The purpose of this study is to explore the mechanical properties and damage evolution laws of multi-shape fractured sandstone samples under hydro-mechanical coupling. First, the stress–strain curves of the multi-shape fractured sandstone samples under hydro-mechanical coupling are obtained, and then the changing laws of mechanical parameters, such as strength, elastic modulus and Poisson’s ratio, are analyzed. Finally, these values are compared to and verify the validity of the constitutive model by a mechanical test and numerical simulation test, and the evolution law of the total damage variable of multi-shape fractured sandstone are analyzed. The research results provide a useful reference for revealing the hydro-mechanical coupling mechanism in deep water-rich rock mass engineering.

2. Experimental Methodology

2.1. Rock Sample Preparation

In Figure 1, waterjet cutting and wire cutting equipment were combined to prefabricate the sandstone samples with different inclinations (α = 0°, 15°, 30°, 45°, 60°, 75°, 90°), single, T-shaped and Y-shaped fractures on standard samples (ϕ50 × 100 mm). The mineral composition of the sandstone mainly includes quartz (72.5%), feldspar (5%), debris (12.5%), and others (10%) by polarizing microscope and X-ray diffraction analysis. In Table 1, in order to study the mechanical characteristics of multi-shape fractured sandstone samples under hydro-mechanical coupling, the tests were carried out on multi-shape fractured sandstone samples with different angles, with a 10 MPa confining pressure and 3 MPa water pressure. In Table 2, two tests of intact sandstone samples were added, which were an intact sample without water pressure (10 MPa confining pressure) and an intact sample with water pressure (10 MPa confining pressure and 3 MPa water pressure) for comparative analysis. In this paper, the sample numbers SF, ST and SY represent single-fracture, T-shaped and Y-shaped fractured sandstone samples, and the following numbers represent the inclinations.

2.2. Testing Procedure

In order to study the mechanical characteristics of sandstone with multiple shapes of fractures under hydro-mechanical coupling, the test equipment adopted the American MTS815 rock mechanics testing machine and Teledyne ISCO D-Series Pumps system, as shown in Figure 2. During the test, both the axial pressure and the confining pressure were controlled by the hydraulic servo system matched with MTS815, and the water pressure was controlled by the D-Series Pumps system. The deformation of the sandstone samples was measured using axial and hoop extensometers. During the installation of the sample, the intact and fractured sandstone samples were wrapped with heat-shrinkable tubes to prevent rock breakage debris from blocking the oil-return hole of the equipment. The water pressure was always kept lower than the confining pressure during the test. During the axial loading process, the entire loading process was controlled by a combination of load and deformation (loop or axial). In the initial loading stage, the axial load control method was used for loading, and the loading rate was 300 N/s. When the load reached about 80% of the peak strength (55 MPa), the loading method was converted to deformation control, and the loading rate was 0.02 mm/min until the rock failed.

3. Mechanical Properties of the Fractured Sandstone under Hydro-Mechanical Coupling

3.1. The Stress–Strain Law of the Fractured Sandstone during Progressive Failure

In Figure 3, the sample SF15 is taken as an example, and the progressive failure stage of the fractured sandstone sample is divided in detail. Martin and Chandler, Brace et al., Hoek and Bieniawski, and Hallbauer et al. conducted a detailed study on the failure of intact rock through experiments, and divided the stress–strain curve of the rock into five stages. This division method is widely accepted as: I. Crack closure, II. Elastic region, III. Stable crack growth, IV. Accelerated crack growth, and V. Post-peak region [17,18,19,20,21].

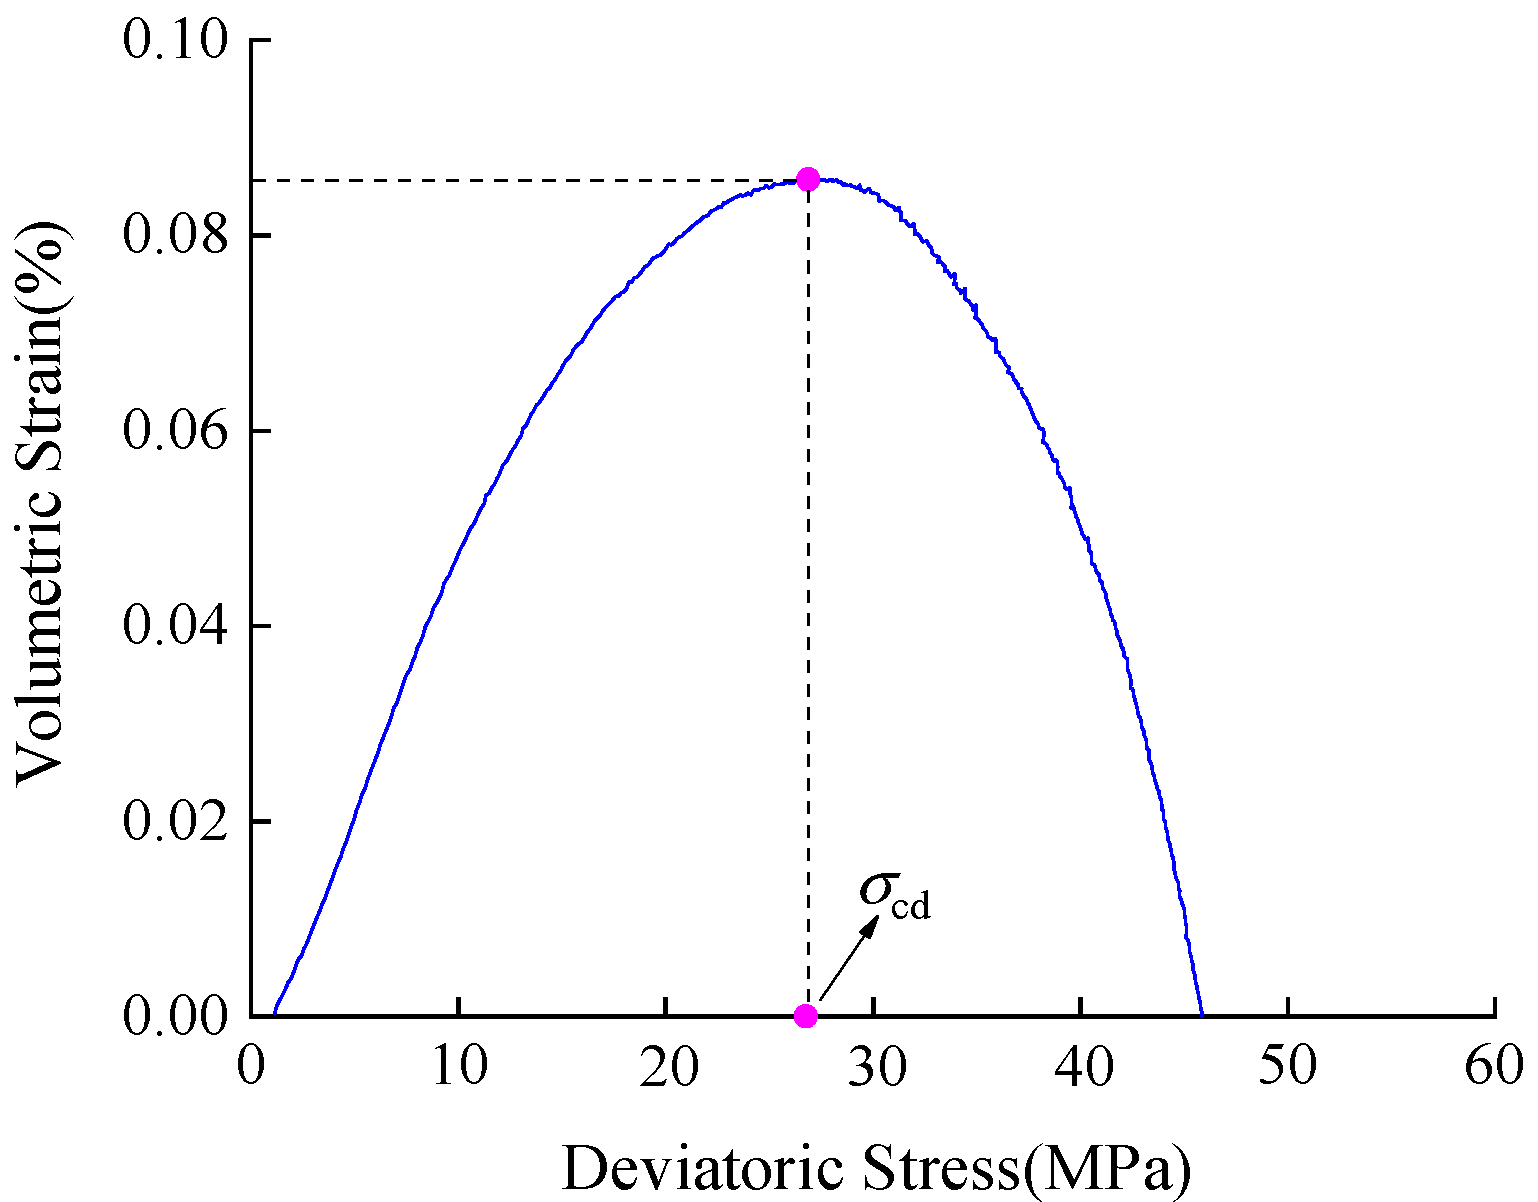
3.2. Determination of the Threshold of the Fractured Sandstone during Progressive Failure

Crack closure stress (σcc), crack initiation stress (σci), damage stress (σcd) and peak strength (σc) are the key indicators for dividing the progressive failure stage of rock samples and the key thresholds for measuring the macro-mechanical properties of fractured rock mass (Figure 3). To date, a lot of research has been conducted on σci, and the commonly used methods to determine σci are the volumetric strain method (VS) [18], lateral strain method (LS) [22], crack volumetric strain method (CVS) [17], and lateral strain response method (LSR) [23]. In addition, the acoustic emission method (AE) [24] and numerical simulation method (NS) [25] are also utilized.
However, the main methods used to determine σcc and σci at the same time are VS, LS, and CVS. In the VS method, σcc is determined by the starting point of the linear segment in the axial stress–volume strain curve, and σci is determined at the end point. The advantage is that the determination of σcc and σci of the rock is intuitive, and the method is simple and easy to operate. The disadvantage is that it relies on artificial tangents to determine σcc and σci, and there are unavoidable subjectivity and value errors. The LS method uses the deviation from the linear segment in the axial stress–lateral strain curve to determine σcc at the start and end points to determine σci. This method has the advantages of VS, removes the influence of the axial strain, and has less interference factors to determine σcc and σci. The disadvantages are the same as VS. In the CVS method, the rock crack volume strain is obtained by calculating the difference between the total volume strain and the elastic volume strain during rock compression, and σcc and σci are determined from the crack volume strain–axial strain curve. The advantage is that the artificial tangent is no longer used to determine σcc and σci, and the process of determining σcc and σci is not easy to confuse, and the obtained σcc and σci values are relatively objective. The disadvantage is that it depends on the calculation of the elastic modulus and Poisson’s ratio, and is sensitive to the change of Poisson’s ratio, and it is easy to produce errors in judging the crack closure and crack initiation points.
In the LSR method, σcd is determined by the axial stress–volume strain curve. First, an reference line is formed by connecting the origin and σcd, and then the corresponding lateral strain value on the reference line is determined, the lateral strain difference is obtained by subtracting the reference lateral strain from the measured lateral strain, and, finally, the relationship between the lateral strain difference and the axial stress is drawn, and the peak point is σci in the figure. The advantage is that the determination of the extreme value is unique, which avoids human error and ensures the objectivity of the result, and the disadvantage is that it is only applicable to hard rock. The drawing operations of the above four methods are shown in Figure 4. In addition, in the AE method, the stress value corresponding to the apparent acoustic emission behavior inside the rock is monitored by the acoustic emission system, which is σci. The advantage is that the acoustic emission method is an important supplement to the conventional strain method, and the disadvantage is that the acoustic emission signal is easily disturbed by noise, and the rock may also have a strongly fluctuating acoustic emission signal during the fracture closure and linear elastic stages, which interferes with the accurate identification of σci. In the NS method, the crack numbers–axial strain curve is drawn through simulation. In this curve, as the strain increases, the strain value corresponding to the first inflection point of the curve is obtained, and σci is determined in the stress–strain curve according to this strain value. The advantage is that human error is avoided, and σci can be easily and quickly determined through simulation; the disadvantage is that the simulation results need to be verified by experiments.
In summary, according to the advantages of each method, this section adopts a new method to determine the σcc, σci and σcd values of the fractured sandstone samples, which are called the volumetric strain response method (VSR). Due to the inhomogeneity of the particle size and structure in the rock, the microcracks and pores are compressed under stress until they are completely closed, and as the stress continues to increase, local tensile stress is generated inside the rock. Under the action of local tensile stress, microcracks occur between the particles with weak cohesion. Therefore, the physical meaning of the maximum relative volume strain difference is elucidated as the microcracks and pores are compressed, or via the initiation of new microcracks. The specific steps are as follows:
(1) In the deviatoric stress–volumetric strain curve, the stress value corresponding to the maximum volumetric strain is selected as σcd, as shown in Figure 5.
(2) In the deviatoric stress–volumetric strain curve, a reference line is formed by connecting the starting point and σcd, and the corresponding volumetric strain value on the reference line is determined. The volumetric strain difference is obtained by subtracting the reference volumetric strain from the measured volumetric strain. Figure 6 shows the relationship between the volumetric strain difference and deviatoric stress, with the deviatoric stress value corresponding to the peak point σci.
(3) In the deviatoric stress–volume strain curve, based on the σci value determined in (2), a reference line is formed by connecting the starting point with σci, and the corresponding volumetric strain value on the reference line is determined. The volumetric strain difference is obtained by subtracting the reference volumetric strain from the measured volumetric strain. Figure 7 presents the relationship between the volumetric strain difference and deviatoric stress, with the deviatoric stress value corresponding to the peak point σcc.
In Table 3 and Table 4, the σcc and σci values of the intact samples and multi-shapes fractured samples are determined by various methods, such as VS, LS, CVS, LSR, and VSR. In order to thoroughly analyze the dispersion degree of σcc and σci obtained by various methods, the standard deviation (SD) and coefficient of variation (CoV) were introduced. It can be observed from Table 3 that the mean SD of the σcc value obtained by the five methods are 0.87 MPa, 1.14 MPa, and 0.58 MPa, and the mean CoV are 6.57%, 7.29%, and 3.83%, respectively. It can be observed from Table 4 that the mean SD values of the σci values obtained by the five methods are 0.75 MPa, 1.19 MPa, and 1.07 MPa, and the mean CoV are 4.38%, 6.71%, and 5.12%, respectively. However, the SD and CoV values of σcc and σci of the intact sample with water pressure and without water pressure are higher than those of the samples with prefabricated fractures, and the SD and CoV values of most of the samples do not exceed 10MPa and 10% [26]. It is shown that each method can reasonably determine σcc and σci, and it also shows the rationality of the method proposed in this paper.

3.3. An Analysis of the Strength Characteristics

As shown in Figure 8, Figure 9 and Figure 10, in order to facilitate the comparison, the intact without water pressure (confining pressure: 10 MPa) and the intact with water pressure (confining pressure: 10 MPa; water pressure: 3 MPa) sample and multi-shape fractured samples are analyzed together. As can be observed from Figure 8a, the change law of the key threshold of the samples with different single fracture inclinations varies with the change of prefabricated fracture inclinations under hydro-mechanical coupling. The peak strength of the single fracture samples is the lowest at 75° and the highest at 0°; the σcd value is the lowest at 90° and the highest at 15°; the σci value is the lowest at 30° and the highest at 15°; and the σcc value is the lowest at 30° and the highest at 15°. Among them, the variation law of the peak strength is evidently consistent with that of the prefabricated fracture rocks studied by Zhao Cheng et al. [27]. The peak strength is the lowest at 30° (60° in the present study) and the highest at 90° (0° in the present study). As can be observed from Figure 8b, the average σcd/σc value, the average σci/σc value, and the average σcc/σc value of the single fracture samples under different angles are 0.48, 0.28, and 0.21, respectively.
As can be observed from Figure 9a, the variation law of the key threshold of samples with different T-shaped fracture samples with the prefabricated fracture inclination under the hydro-mechanical coupling is as follows: the peak strength is the lowest at 60° and the highest at 15°; the σcd value is the lowest at 45° and the highest at 90°; the σci value is the lowest at 30° and the highest at 90°; the σcc value is the lowest at 45° and the highest at 90°. As can be observed from Figure 9b, the average σcd/σc value, average σci/σc value, and average σcc/σc value of T-shaped fracture samples under different dip angles are 0.55, 0.32, and 0.23, respectively.
As can be observed from Figure 10a, the variation law of the key threshold of the samples with different Y-shaped fracture samples with the prefabricated fracture inclination under the hydro-mechanical coupling is as follows: the peak strength is the lowest at 60° and the highest at 75°; the σcd value is the lowest at 60° and the highest at 90°; the σci value is the lowest at 60° and the highest at 15°; and the σcc value is the lowest at 60° and the highest at 90°. As can be observed from Figure 10b, the average σcd/σc value, average σci/σc value, and average σcc/σc value of the Y-shaped fracture samples under different dip angles are 0.63, 0.37, and 0.27, respectively.
In summary, the samples, in descending order of peak strength, are the intact sample without water pressure, intact sample with water pressure, and all the samples with prefabricated fractures. The peak strength of the intact sample with water pressure is 5.25% lower than that of the intact sample without water pressure. The peak strength of the single fracture samples with different inclinations (0°, 15°, 30°, 45°, 60°, 75°, and 90°) decreased by 19.29%, 30.60%, 41.53%, 37.54%, 40.39%, 44.31%, and 36.45%, respectively, compared to the intact sample without water pressure, and decreased by 14.82%, 26.75%, 38.28%, 34.08%, 37.08%, 41.23%, and 32.93%, respectively, compared to the intact sample with water pressure. The peak strength of the T-shaped fracture samples with different inclinations (0°, 15°, 30°, 45°, 60°, 75°, and 90°) decreased by 34.89%, 33.79%, 46.09%, 39.32%, 47.23%, 42.76%, and 36.02%, respectively, compared to the intact sample without water pressure, and decreased by 31.28%, 30.12%, 43.11%, 35.95%, 44.31%, 39.59%, and 32.47%, respectively, compared to the intact sample with water pressure. The peak strength of the Y-shaped fracture samples with different inclinations (0°, 15°, 30°, 45°, 60°, 75°, and 90°) decreased by 43.85%, 37.91%, 43.07%, 43.32%, 44.30%, 37.28%, and 43.92%, respectively, compared to the intact sample without water pressure, and decreased by 40.74%, 34.47%, 39.91%, 40.17%, 41.21%, 33.80%, and 40.81%, respectively, compared to the intact sample with water pressure. It fully shows that the weakening effect of the water has less of an influence on the strength than the prefabricated fractures. In addition, there are no significant differences in the stress ratios for the intact sample without water pressure, the intact sample with water pressure, and the prefabricated fracture samples.

3.4. Deformation Characteristic Analysis

The variation trend of the elastic modulus and Poisson’s ratio of the intact, single, T-shaped and Y-shaped fracture samples with fracture inclinations are shown in Figure 11, Figure 12 and Figure 13. In Figure 11, the elastic modulus of the single fracture samples are the smallest at 30° and the largest at 0°, which are similar to the variation law of the peak strength. On the whole, the elastic modulus experiences a trend of first decreasing and then increasing with the increase in the fracture inclination, while the Poisson’s ratio of the single fracture samples fluctuates to a certain extent with the increase in the fracture inclination. In Figure 12, the elastic modulus of the T-shaped fracture samples are the smallest at 60° and the largest at 75°. The elastic modulus generally experiences a decreasing–increasing–decreasing trend with the increase in the fracture inclination, while the Poisson’s ratio of the T-shaped fracture samples fluctuates significantly with the increase in the fracture inclination. In Figure 13, the elastic modulus of the Y-shaped fracture samples are the smallest at 60° and the largest at 45°. The elastic modulus generally experiences a trend of increase–decrease–increase, with the increase in the fracture inclination, while the Poisson’s ratio of the Y-shaped fracture samples fluctuates significantly with the increase in the fracture inclination. By comparing the intact samples without water pressure with the intact samples with water pressure and with the prefabricated fracture samples, it can be observed that the elastic modulus of the intact samples without water pressure is the largest, other samples are affected by the water pressure, and the single fracture samples are more affected by the water pressure, indicating that the fractures weaken the stiffness of the samples, which are consistent with the conclusion presented in reference [19].

4. Damage Constitutive Model and Verification of the Multi-Shape Fractured Sandstone under Hydro-Mechanical Coupling

4.1. Construction of the Damage Variable for Multi-Shape Fractured Rock

According to the strain equivalence principle proposed by Lemaitre [28,29,30], it can be determined that the strain caused by the macroscopic nominal stress σ on the damaged material is equivalent to the strain caused by the effective stress σ on the non-damaged material, namely
ε = σ E = σ E = σ E ( 1 D )
where E and E are the elastic modulus of the non-damaged material and damaged material, respectively, D is the damage variable.
In this paper, the damage and failure of the multi-shape fractured sandstone samples during hydro-mechanical coupling loading are caused by the superposition or coupling of three types of damage: (1) the damage caused by water immersion before loading, (2) damage caused by random microcracks in the sample during loading, and (3) damage caused by the macroscopic cracks during loading.
It is very difficult to analyze the damage of the sandstone material under water action from the microscopic point of view. Therefore, the elastic modulus of the sandstone material before and after water action can be measured from the macroscopic point of view, and the expression of the damage variable under water action can be determined:
D 1 = 1 E 1 E 0
where D1 is the damage variable caused by water; E0 and E1 correspond to the elastic modulus of the sandstone samples before and after the damage under water.
In addition, the damage state of the prefabricated fractured sandstone samples after water action is regarded as the initial state, and the damage state caused by the load under the hydro-mechanical coupling after water action is regarded as the second damage state. Based on the Lemaitre strain equivalence hypothesis, the total damage variable of the fractured sandstone under the combined action of water action damage and hydro-mechanical coupling loading damage is
E 0 ( 1 D 1 ) ( 1 D 2 ) ε 1 = E 0 ( 1 D 0 ) ε 1
Simplified as
D 0 = D 1 + D 2 D 1 D 2
where D0 is the total damage variable of the fractured sandstone under the combined action of water action damage and hydro-mechanical coupling loading damage, D2 is the coupling damage variable.
In the loading process under hydro-mechanical coupling, the loading damage variable is the coupling of micro-flaw damage and prefabricated fracture damage. Based on Lemaitre strain equivalence hypothesis, there is
ε f = ε a + ε b ε c
where ε is the uniaxial strain of the sandstone materials, the footnotes a, b, and c represent the sandstone samples with prefabricated fractures and macrocracks, the sandstone samples containing only micro-flaws, the sandstone samples containing only macrocracks, and the initial damage sandstone samples, respectively.
Therefore, there is
ε f = σ E f = σ E a + σ E b σ E 0
The damage variables caused by the micro-flaws and macrocracks are expressed as Da and Db, respectively, and their coupling damage variable is D2. The following formula can be obtained based on continuous damage mechanics:
E f = E 0 ( 1 D 2 )
E a = E 0 ( 1 D a )
E b = E 0 ( 1 D b )
Substituting Equations (7)–(9) into Equation (6), the coupling damage variable D2 in the loading process can be obtained as:
D 2 = 1 ( 1 D a ) ( 1 D b ) ( 1 D a D b )
Substituting Equation (10) into Equation (4) and obtain:
D 0 = 1 ( 1 D 1 ) ( 1 D a ) ( 1 D b ) 1 D a D b

4.2. Constitutive Model Construction of Multi-Shapes Fractured Rock

The distribution of micro-flaws in rock materials is random, which leads to great differences in the mechanical properties of the rock materials. Therefore, the rock materials are divided into micro-elements containing several flaws. It is assumed that the relationship between the statistical distribution density of the micro-element damage of rock materials and the damage variable is [31]:
d D = P ( F ) d F
where P(F) is the probability density function of the rock-loading process, F is the strength parameter of the rock micro-element.
Assuming that the micro-element strength during rock loading obeys the Weibull distribution [32], the damage evolution equation of the sandstone samples under hydro-mechanical coupling is:
D a = 0 F P ( F ) d F
D a = 0 F n F 0 ( F F 0 ) n 1 exp [ ( F F 0 ) n ] d F = 1 exp [ ( F F 0 ) n ]
Therefore, the constitutive model of the rock with only micro-flaws under hydro-mechanical coupling can be obtained:
σ 1 = E 1 ε 1 ( 1 D a ) + 2 μ σ 3 = E 1 ε 1 exp [ ( F F 0 ) n ] + 2 μ σ 3
where σ1 and ε1 are the axial stress and strain under hydro-mechanical coupling, respectively, E1 is the elastic modulus.
From the above analysis, it can be observed that the key parameters to be determined in the damage constitutive equation in Equation (15) are n and F0. Therefore, the micro-element strength of the rock is established by introducing the Drucker–Prager failure criterion [33]:
F = α 0 I 1 + J 2
α 0 = 3 sin φ 3 3 + sin 2 φ
I 1 = σ 1 * + σ 2 * + σ 3 *
J 2 = 1 6 [ ( σ 1 * σ 2 * ) 2 + ( σ 2 * σ 3 * ) 2 + ( σ 3 * σ 1 * ) 2 ]
where φ is the internal friction angle of the rock; I1 is the first invariant of the stress tensor; J2 is the second invariant of the deviatoric stress tensor; σ1, σ2, and σ3 are the principal normal stresses in the three principal stress directions; and the corresponding effective stresses are σ 1 * , σ 2 * , and σ 3 * , respectively. In hydro-mechanical coupling tests (triaxial tests), σ2 = σ3 and σ 2 * = σ 3 * , according to Hooke’s law:
ε 1 = ( σ 1 * 2 μ σ 3 * ) 2 / E 1 σ 2 * = σ 3 * = σ 3 / ( 1 D a ) σ 1 * = σ 1 / ( 1 D a ) }
F 1 = α 0 I 1 + J 2
I 1 = ( σ 1 + 2 σ 3 ) E 1 ε 1 σ 1 2 μ σ 3
J 2 = ( σ 1 σ 3 ) E 1 ε 1 [ 3 ( σ 1 2 μ σ 3 ) ]
F = 3 sin φ 3 3 + sin 2 φ ( σ 1 + 2 σ 3 ) E 1 ε 1 σ 1 2 μ σ 3 + ( σ 1 σ 3 ) E 1 ε 1 [ 3 ( σ 1 2 μ σ 3 ) ]
d σ 1 d ε 1 = E 1 exp [ ( F F 0 ) n ] + E 1 ε 1 exp [ ( F F 0 ) n ] [ n F n 1 F 0 n ] { α 0 E 1 [ ( σ 1 + 2 σ 3 ) + α 0 E 1 ε 1 d σ 1 d ε 1 ] σ 1 2 μ σ 3 E 1 ε 1 ( σ 1 + 2 σ 3 ) ( σ 1 2 μ σ 3 ) 2 d σ 1 d ε 1 + E 1 ( σ 1 σ 3 ) + E 1 ε 1 d σ 1 d ε 1 3 ( σ 1 2 μ σ 3 ) E 1 ε 1 ( σ 1 σ 3 ) 3 ( σ 1 2 μ σ 3 ) 2 d σ 1 d ε 1 }
From the stress–strain curve of the hydro-mechanical coupling test, it can be observed that the stress–strain curve meets the following boundary conditions:
ε 1 = ε 1 p ,   σ 1 = σ 1 p   ,   d σ 1 / d ε 1 = 0
Substitute Equation (26) into Equation (25) to obtain the following:
n F p n 1 F 0 n = ( σ 1 p 2 μ σ 3 ) E 1 ε 1 p [ α 0 ( σ 1 p + 2 σ 3 ) + ( σ 1 p σ 3 ) / 3 ]
Substitute Equation (26) into Equation (15) to obtain the following:
( F p F 0 ) n = ln σ 1 p 2 μ σ 3 E 1 ε 1 p
Combine Equations (27) and (28) to obtain
n = F p ( σ 1 p 2 μ σ 3 ) E 1 ε 1 p [ α 0 ( σ 1 p + 2 σ 3 ) + ( σ 1 p σ 3 ) / 3 ] ln [ σ 1 p 2 μ σ 3 E 1 ε 1 p ]
F 0 = [ F p n ln [ ( σ 1 p 2 μ σ 3 ) / E 1 ε 1 p ] ] 1 n
In summary, the stress–strain relationship of the multi-shape fractured sandstone under hydro-mechanical coupling is:
σ = E 0 ( 1 D 1 ) ( 1 D 2 ) ε 1 + 2 μ σ 3 = E 0 ( 1 D 0 ) ε 1 + 2 μ σ 3

4.3. Validation of the Constitutive Model under Hydro-Mechanical Coupling

In Table 5, in order to verify the constitutive model of the multi-shape fractured sandstone sample under hydro-mechanical coupling, according to the test results, the Weibull distribution parameters n and F0 are solved by Equations (29) and (30). In order to avoid redundancy, single, T-shaped and Y-shaped fracture sandstone samples with fracture inclinations of 0°, 45°, and 90° were selected as examples to compare and analyze the results of theoretical curves and experimental curves. As shown in Figure 14b,c,f, it can be observed that some differences occur in the coincidence degree of the curves before the peak stress, but the overall development law is consistent. The constitutive calculation curves of the remaining samples are highly coincidental with the experimental stress–strain curves. Table 6 compares and analyzes the error values of theoretical calculations and test results under different constitutive models, and it is found that the error of the constitutive model in this paper is the smallest. The constitutive model proposed in this paper is further verified by RFPA2D-FLOW software, through comprehensively comparing the experimental results and theoretical calculation results. A constant 10 MPa confining pressure was applied to the left and right boundaries of the numerical model during the simulation process, and the bottom boundary was fixed. An axial load speed of 3 × 10⁻⁵ m/s was applied to the top boundary to control the load until the sample completely lost its bearing capacity. In addition, the seepage behavior in the hydro-mechanical coupling test was simulated by the steady-state seepage model, the left and right boundaries of the sample were impermeable boundaries, and a water pressure of 3 MPa was applied to the lower part of the sample. The main key simulation parameters were the residual strength percentage 0.3%, friction angle 43°, permeability coefficient 0.08 m/d, effective stress coefficient 0.49, coupling coefficient 0.0979, and the assignment value of elastic modulus; the Poisson’s ratio and compressive strength varied with fracture inclination. The simulation results are shown in Figure 14, and the simulation curves and the constitutive calculation curves are basically highly coincident with the measured stress–strain curves, which further verifies the rationality of the constitutive model. In general, the damage constitutive model established in this paper can reflect the stress–strain relationship of the multi-shape fractured sandstone samples better. However, there are also some differences between the damage constitutive model proposed in this paper and the experimental and numerical results, which are mainly caused by the uneven distribution of the mineral composition of the rock. In addition, in the process of simulation analysis, numerical simulation methods often need to simplify the boundary conditions and material properties, which more or less affects the analysis results, and the results obtained with different meshing accuracies are also different, which eventually leads to certain differences.
In Figure 15, for the multi-shape fractured sandstone samples with different angles, the damage evolution curve increases slowly at first, then the curve rises sharply, and finally rises slowly and tends to a constant value 1. With the increase in the strain, the curve development and variation of multi-shape fractured sandstone samples are slightly different. Combined with Table 5 and Figure 15, it can be seen that the fracture inclination is 90°; the total damage value corresponding to the peak strength of single fracture sandstone sample is the largest. When the fracture inclination is 60°, the total damage value corresponding to the peak strength of the T-shaped fracture sandstone sample is the largest; when the fracture inclination is 0°, the total damage value corresponding to the peak strength of the Y-shaped fractured sandstone sample is the largest. Overall, the fracture inclinations do not affect the total damage trend of the multi-shape fractured sandstone samples, but only affects their numerical value.

5. Conclusions

The strength, deformation, and damage evolution characteristics of the multi-shape fractured sandstone under hydro-mechanical coupling were systematically studied by conducting hydro-mechanical coupling tests on fractured sandstone samples at different inclinations (α = 0°, 15°, 30°, 45°, 60°, 75°, and 90°) under a confining pressure of 10 MPa and a water pressure of 3 MPa. The main conclusions are as follows:
(1) Based on the stress–strain curve, the volumetric strain response method is proposed by integrating the advantages of the volumetric strain method, lateral strain method, crack volumetric strain method, and lateral strain response method, and the σcc and σci values of the multi-shape fractured sandstone samples are determined. By introducing standard deviation (SD) and the coefficient of variation (CoV), the dispersion degree of σcc and σci obtained by various methods was analyzed, and the rationality of the method is verified.
(2) The peak strength of the single fractured sandstone samples is the lowest at 75° and the highest at 0°, the peak strength of the T-shaped fracture sandstone samples is the lowest at 60° and the highest at 15°, and the peak strength of the Y-shaped fractured sandstone samples is the lowest at 60° and the highest at 75°. The crack closure stress and crack initiation stress of the multi-shape fractured sandstone samples are different, as well as the angles when the damage stress and peak strength (σc) reach their peak values.
(3) There are no significant differences in the stress ratios for intact sample without water pressure, the intact sample with water pressure, and the prefabricated fracture samples, indicating that the stress ratio is almost unaffected by the shape and inclination of the fractures in the rocks.
(4) The samples, in descending order of peak strength, are the intact sample without water pressure, intact sample with water pressure, and all the samples with prefabricated fractures, which fully shows that the weakening effect of water has less of an influence on the strength than the prefabricated fractures. The elastic modulus of the intact sample without water pressure is the largest, and the single fracture samples are most affected by water and fractures. In addition, the Poisson’s ratio of the multi-shape sandstone samples fluctuates significantly with the increase in the fracture inclination.
(5) A superposition or coupling damage constitutive model, considering the water effect, micro-flaws and macrocracks, is proposed, which is in good agreement with the experimental stress–strain curves and numerical simulation curves, and is scientifically reasonable. When the fracture inclinations are 90°, 60°, and 0°, respectively, the total damage values corresponding to the peak strength of the single, T-shaped, and Y-shaped fracture sandstone samples are the largest.

Author Contributions

Conceptualization, Y.Z. and X.W.; methodology, Q.G. and Z.Z.; validation, Y.Z., X.W. and Q.G.; formal analysis, X.W. and L.T.; investigation, Z.Z.; resources, M.C.; writing—original draft preparation, Y.Z., X.W. and Q.G.; writing—review and editing, Q.G. and Z.Z.; supervision, M.C.; project administration, M.C.; funding acquisition, Q.G. and M.C. All authors have read and agreed to the published version of the manuscript.

Funding

This research was funded by the National Key Research and Development Program of China: 2021YFC3001301, National Natural Science Foundation of China: 51974014 and 52074020, Fundamental Research Funds for the Central Universities: FRF-DRY-20-032.

Institutional Review Board Statement

Not applicable.

Informed Consent Statement

Not applicable.

Data Availability Statement

Not applicable.

Conflicts of Interest

The authors declare that they have no conflict of interest.

References

  1. Gao, F.; Xiong, X.; Xu, C.; Zhou, K. Mechanical property deterioration characteristics and a new constitutive model for rocks subjected to freeze-thaw weathering process. Int. J. Rock Mech. Min. Sci. 2021, 140, 104642. [Google Scholar] [CrossRef]
  2. Zhu, Z.N.; Tian, H.; Jiang, G.S.; Cheng, W. Effects of high temperature on the mechanical properties of Chinese marble. Rock Mech. Rock Eng. 2018, 51, 1937–1942. [Google Scholar] [CrossRef]
  3. Liu, Y.; Dai, F. A damage constitutive model for intermittent jointed rocks under cyclic uniaxial compression. Int. J. Rock Mech. Min. Sci. 2018, 103, 289–301. [Google Scholar] [CrossRef]
  4. Yilmaz, I. Influence of water content on the strength and deformability of gypsum. Int. J. Rock Mech. Min. Sci. 2010, 47, 342–347. [Google Scholar] [CrossRef]
  5. Vasarhelyi, B.; Ván, P.J.E.G. Influence of water content on the strength of rock. Eng. Geol. 2006, 84, 70–74. [Google Scholar] [CrossRef]
  6. Kou, M.; Liu, X.; Tang, S.; Wang, Y. 3-D X-ray computed tomography on failure characteristics of rock-like materials under coupled hydro-mechanical loading. Theor. Appl. Fract. Mech. 2019, 104, 102396. [Google Scholar] [CrossRef]
  7. Wang, H.L.; Xu, W.Y.; Shao, J.F. Experimental researches on hydro-mechanical properties of altered rock under confining pressures. Rock Mech. Rock Eng. 2014, 47, 485–493. [Google Scholar] [CrossRef]
  8. Wang, L.; Liu, J.F.; Pei, J.L.; Xu, H.N.; Bian, Y. Mechanical and permeability characteristics of rock under hydro-mechanical coupling conditions. Environ. Earth Sci. 2015, 73, 5987–5996. [Google Scholar] [CrossRef]
  9. Song, Z.; Cheng, Y.; Tian, X.; Wang, J.; Yang, T. Mechanical properties of limestone from Maixi tunnel under hydro-mechanical coupling. Arab. J. Geosci. 2020, 13, 402. [Google Scholar] [CrossRef]
  10. Wang, Q.; Hu, X.; Zheng, W.; Li, L.; Xu, C. Mechanical properties and permeability evolution of red sandstone subjected to hydro-mechanical coupling: Experiment and discrete element modelling. Rock Mech. Rock Eng. 2021, 54, 2405–2423. [Google Scholar] [CrossRef]
  11. Kawamoto, T.; Ichikawa, Y.; Kyoya, T. Deformation and fracturing behaviour of discontinuous rock mass and damage mechanics theory. Int. J. Numer. Anal. Methods Geomech. 1988, 12, 1–30. [Google Scholar] [CrossRef]
  12. Swoboda, G.; Shen, X.P.; Rosas, L. Damage model for jointed rock mass and its application to tunnelling. Comput. Geotech. 1998, 22, 183–203. [Google Scholar] [CrossRef] [Green Version]
  13. Zhang, T.; Xu, W.; Huang, W.; Wu, G. Experimental study on mechanical properties of multi-layered rock mass and statistical damage constitutive model under hydraulic-mechanical coupling. Eur. J. Environ. Civ. Eng. 2020. [Google Scholar] [CrossRef]
  14. Chen, W.L.; Li, N. Damage model of the rock mass medium with intermittent cracks. Chin. J. Geotech. Eng. 2000, 22, 430–434. [Google Scholar]
  15. Xu, P.; Yang, S.Q. A fracture damage constitutive model for fissured rock mass and its experimental verification. Arab. J. Geosci. 2017, 10, 164. [Google Scholar] [CrossRef]
  16. Chen, S.; Qiao, C. Composite damage constitutive model of jointed rock mass considering crack propagation length and joint friction effect. Arab. J. Geosci. 2018, 11, 283. [Google Scholar] [CrossRef]
  17. Martin, C.D.; Chandler, N.A. The progressive fracture of Lac du Bonnet granite. Int. J. Rock Mech. Min. Sci. Geomech. Abstr. 1994, 31, 643–659. [Google Scholar] [CrossRef]
  18. Brace, W.F.; Paulding, B.W.; Scholz, C. Dilatancy in the fracture of crystalline rocks. J. Geophys. Res. 1966, 71, 3939–3953. [Google Scholar] [CrossRef]
  19. Hoek, E.; Bieniawski, Z.T. Brittle fracture propagation in rock under compression. Int. J. Fract. 1965, 1, 137–155. [Google Scholar] [CrossRef]
  20. Hallbauer, D.K.; Wagner, H.; Cook, N.G.W. Some observations concerning the microscopic and mechanical behaviour of quartzite samples in stiff, triaxial compression tests. Int. J. Rock Mech. Min. Sci. Geomech. Abstr. 1973, 10, 713–726. [Google Scholar] [CrossRef]
  21. Zhao, X.G.; Cai, M.; Wang, J.; Ma, L.K. Damage stress and acoustic emission characteristics of the Beishan granite. Int. J. Rock Mech. Min. Sci. 2013, 64, 258–269. [Google Scholar] [CrossRef]
  22. Lajtai, E.Z. Brittle fracture in compression. Int. J. Fract. Mech. 1974, 10, 525–536. [Google Scholar] [CrossRef]
  23. Nicksiar, M.; Martin, C.D. Evaluation of methods for determining crack initiation in compression tests on low-porosity rocks. Rock Mech. Rock Eng. 2012, 45, 607–617. [Google Scholar] [CrossRef]
  24. Zhao, X.G.; Wang, J.; Ma, L.K.; Su, R.; Cai, M.; Wang, G.B. Acoustic emission behaviors of the Beishan granite under uniaxial and triaxial compression conditions. In Proceedings of the 3rd ISRM SINOROCK Symposium, Shanghai, China, 17–21 June 2013; CRC Press/Balkema: London, UK, 2013; pp. 90–95. [Google Scholar]
  25. Huang, D.; Li, X.Q. Numerical simulation research on characteristic strength of marble based on development of microcrack. Rock Mech. Rock Eng. 2017, 38, 253–262. [Google Scholar]
  26. Ruth, D.; Ma, H. On the derivation of the Forchheimer equation by means of the averaging theorem. Transp. Porous Med. 1992, 7, 255–264. [Google Scholar] [CrossRef]
  27. Zhao, C.; Xing, J.Q.; Niu, J.L.; Ma, C.C. Experimental study on crack propagation of precrack rock-like samples under hydro-mechanical coupling. Chin. J. Rock Mech. Eng. 2019, 38, 2823–2830. [Google Scholar]
  28. Lemaitre, J. A continuous damage mechanics model for ductile fracture. J. Eng. Mater. Technol. 1985, 107, 83–89. [Google Scholar] [CrossRef]
  29. Lemaitre, J. How to use damage mechanics. Nucl. Eng. Des. 1984, 80, 233–245. [Google Scholar] [CrossRef]
  30. Lemaitre, J.; Chaboche, J.L. Mechanics of Solid Materials; Cambridge University Press: Cambridge, UK, 1990; pp. 159–168. [Google Scholar]
  31. Yang, T.H.; Liu, J.; Zhu, W.C.; Elsworth, D.; Tham, L.G.; Tang, C.A. A coupled flow-stress-damage model for groundwater outbursts from an underlying aquifer into mining excavations. Int. J. Rock Mech. Min. Sci. 2007, 44, 87–97. [Google Scholar] [CrossRef]
  32. Weibull, W. A statistical distribution function of wide applicability. J. Appl. Mech. 1951, 18, 293–297. [Google Scholar] [CrossRef]
  33. Drucker, D.C.; Prager, W. Soil mechanics and plastic analysis or limit design. Q. Appl. Mech. 1952, 10, 157–165. [Google Scholar] [CrossRef] [Green Version]
  34. Zou, Y.G.; Wang, X.J.; Li, S.C.; Zeng, Q.; Wang, X.M.; Liu, J. Mechanical Properties and Damage Evolution Constitutive Model of Copper Oxide Rocks under Chemical Corrosion. Min. Res. Dev. 2021, 40, 56–61. [Google Scholar]
  35. Pan, J.L.; Cai, M.F.; Li, P.; Guo, Q.F. A damage constitutive model of rock-like materials containing a single crack under the action of chemical corrosion and uniaxial compression. J. Cent. South Univ. 2021, 29, 486–498. [Google Scholar] [CrossRef]
Figure 1. Preparation process of multi-shape fractured sandstone samples: (a) standard samples; (b) prefabricated fracture-size models; (c) fractures cutting equipment; and (d) prefabricated fracture samples.
Minerals 12 00436 g001aMinerals 12 00436 g001b
Figure 2. Test equipment: (a) MTS815 rock mechanics testing machine and (b) Teledyne ISCO D-Series Pumps.
Minerals 12 00436 g002
Figure 3. Stage division of stress–strain curve of the fractured sandstone sample under hydro-mechanical coupling (SF15-2).
Minerals 12 00436 g003
Figure 4. Different methods to determine the σcc or σci values: (a) VS; (b) LS; (c) CVS; and (d) LSR.
Minerals 12 00436 g004
Figure 5. The σcd is determined based on volume strain–deviatoric stress curve.
Minerals 12 00436 g005
Figure 6. The value of σci is determined based on the volume strain difference–deviatoric stress curve and reference line: (a) creating the reference line and (b) determining the σci value.
Minerals 12 00436 g006
Figure 7. The value of σcc is determined based on the volume strain difference–deviatoric stress curve and reference line: (a) creating the reference line and (b) determining the σcc value.
Minerals 12 00436 g007
Figure 8. Relationship between fracture inclination and different thresholds, stress ratio of intact and single fracture samples: (a) relationship between the different thresholds and fracture inclination and (b) relationship between the stress ratio and fracture inclination.
Minerals 12 00436 g008
Figure 9. Relationship between the fracture inclination and different thresholds, and the stress ratios of the intact and T-shaped fracture samples: (a) relationship between the different thresholds and fracture inclination and (b) relationship between the stress ratio and fracture inclination.
Minerals 12 00436 g009
Figure 10. Relationship between the fracture inclination and different thresholds, and the stress ratios of the intact and Y-shaped fracture samples: (a) relationship between the different thresholds and fracture inclination and (b) relationship between the stress ratio and fracture inclination.
Minerals 12 00436 g010
Figure 11. Relationship between the elastic modulus, Poisson’s ratio, and fracture inclination of intact and single fracture samples: (a) relationship between the elastic modulus and fracture inclination and (b) relationship between the Poisson’s ratio and fracture inclination.
Minerals 12 00436 g011
Figure 12. The relationship between the elastic modulus and Poisson’s ratio of the intact and T-shaped fracture samples: (a) relationship between the elastic modulus and fracture inclination and (b) relationship between the Poisson’s ratio and fracture inclination.
Minerals 12 00436 g012
Figure 13. The relationship between the elastic modulus and the Poisson’s ratio of the intact and Y-shaped fracture samples: (a) relationship between the elastic modulus and the fracture inclination and (b) relationship between the Poisson’s ratio and the fracture inclination.
Minerals 12 00436 g013
Figure 14. Comparison of the theoretical curves, simulation curves, and experimental curves of the multi-shape fractured samples: (a) SF0; (b) SF45; (c) SF90; (d) ST0; (e) ST45; (f) ST90; (g) SY0; (h) SY45; and (i) SY90.
Minerals 12 00436 g014
Figure 15. Loaded damage evolution curves of the multi-shape fractured samples: (a) single fracture samples, (b) T-shaped fracture samples, and (c) Y-shaped fracture samples.
Minerals 12 00436 g015
Table 1. Test scheme of fractured sandstone samples.
Fracture Inclination αSample No.Confining Pressure/MPaWater Pressure/MPa
Single FractureT-Shaped FractureY-Shaped Fracture
SF0ST0SY0103
15°SF15ST15SY15103
30°SF30ST30SY30103
45°SF45ST45SY45103
60°SF60ST60SY60103
75°SF75ST75SY75103
90°SF90ST90SY90103
Table 2. Test scheme of intact sandstone samples.
NameSample No.Confining Pressure/MPaWater Pressure/MPa
Intact sample without water pressureW110-
Intact sample with water pressureW2103
Table 3. Summary of the sandstone progressive failure thresholds σcc and σcd under hydro-mechanical coupling.
Sample No.σcc/MPaσcd/MPa
VSLSCVSVSRMeanSDCoV/%
W122.5922.7521.6817.3021.082.5612.14%68.48
W218.1724.0222.2316.5420.243.4717.14%53.93
SF010.7610.7110.7013.6211.451.4512.66%29.07
SF1516.4619.6720.2619.4218.951.708.97%38.46
SF3010.929.899.6510.3310.200.565.49%29.14
SF4512.8913.2713.3813.0813.160.221.67%33.13
SF6012.2312.7414.5212.3112.951.078.26%27.82
SF7511.5512.1312.9312.7812.350.635.10%26.12
SF9012.4311.7612.8512.1012.290.473.82%24.96
ST015.8616.7117.1113.5615.811.5910.06%38.97
ST1512.4413.8713.9814.1113.600.785.74%33.77
ST308.868.3810.508.819.142.4210.18%27.33
ST457.899.918.697.598.521.0412.21%21.66
ST6014.8414.6915.1415.0714.940.211.41%31.10
ST7516.2115.5815.1115.3215.560.483.08%30.13
ST9018.6417.3415.7719.0517.701.488.36%43.62
SY016.1414.6215.6615.9915.600.694.42%29.73
SY1515.7716.1316.3114.9115.780.623.93%40.46
SY3014.7715.4815.5314.8715.160.402.64%34.63
SY4515.5716.4617.3215.2716.160.935.75%38.02
SY6010.4310.9111.5111.1411.000.454.09%27.89
SY7515.5015.5815.3115.0215.350.251.63%37.40
SY9016.6315.8217.5416.3616.59 0.72 4.34%43.00
Table 4. Summary of the sandstone progressive failure thresholds σci and σc under hydro-mechanical coupling.
Sample No.σci/MPaσc/MPa
VSLSCVSLSRVSRMeanSDCov/%
W133.4733.6926.3339.6032.6333.144.7114.21%97.54
W225.7631.1729.1231.3928.2229.132.327.96%92.42
SF015.3514.0316.9813.6817.8315.571.8111.62%78.73
SF1524.3825.3124.1622.0724.1824.021.194.95%67.70
SF3014.7215.3414.1814.8615.1714.850.453.03%57.04
SF4517.2617.6217.0417.7117.6617.460.29 1.66%60.92
SF6015.5916.7217.1616.7616.3716.520.593.57%58.15
SF7515.1715.2315.4614.6615.8615.280.442.88%54.32
SF9015.8816.0316.9716.4815.8216.240.482.96%61.99
ST020.4321.1619.5820.4120.9020.500.602.93%63.51
ST1519.0219.4620.3214.1619.2218.442.4413.23%64.58
ST3012.6613.4416.6311.3613.9313.601.95 14.34%52.58
ST4513.0813.6914.2113.5914.2513.760.483.49%59.19
ST6020.5721.2121.1522.0120.6421.120.582.75%51.47
ST7522.0319.9321.2822.2721.5221.410.914.25%55.83
ST9023.0123.0920.7024.1724.0022.991.386.00%62.41
SY020.1619.9620.5220.0920.0320.150.221.09%54.77
SY1522.2723.7521.8925.0322.4023.071.305.64%60.56
SY3022.4021.1322.1322.4322.3222.080.542.45%55.53
SY4521.4421.8723.8222.7323.0322.580.944.16%55.29
SY6015.2215.1017.9815.0117.5516.171.469.03%54.33
SY7522.1823.7520.5523.9120.0722.091.778.01%61.18
SY9021.9221.2022.3224.4822.1222.411.235.49%54.70
Table 5. Physical and mechanical properties of the samples with prefabricated fractures.
Sample No.Peak Stress/MPaPeak Strain/%Total Damage VariableWeibull Parameters
nF0
SF078.730.6390.2766.01198.363
SF1567.700.5680.3005.02789.403
SF3057.040.4900.3174.48778.190
SF4560.920.5720.3753.20493.988
SF6058.150.5250.3483.70585.349
SF7554.320.5520.4222.56290.946
SF9061.990.6370.4292.482105.014
ST063.510.5310.3035.10283.475
ST1564.580.4990.2408.54373.265
ST3052.580.4260.2756.07765.484
ST4559.190.4540.2378.86966.312
ST6051.470.5530.4532.24090.513
ST7555.830.4120.20813.28957.208
ST9062.410.6540.4402.371107.467
SY054.770.5800.4462.31395.205
SY1560.560.4690.2418.44568.898
SY3055.530.4230.2309.65361.149
SY4555.290.4070.20214.63355.831
SY6054.330.4030.20813.20755.929
SY7561.180.4520.20513.82162.438
SY9054.700.3850.16941.94148.072
Table 6. Typical constitutive model comparison table.
SourceConstitutive ModelElastic Modulus Relative ErrorPeak Strength Relative ErrorApplicable Conditions
Reference [34] σ = E ( 1 D ) ε = E ( ε m ε k + 1 ) 1 n 0 13%2%Chemical damage, intact rock, uniaxial
Reference [16] [ σ ] = [ E ] [ ε ] ( 1 Ω 12 ) = [ E ] [ ε ] ( 1 Ω ) ( 1 D 2 ) 1 Ω D 2 41%6%Fractured rock, uniaxial
Reference [35] σ = E 0 ( 1 D ) ε 1 D = D c + D load D c D load 2%1%Chemical damage, fractured rock, uniaxial
This article σ = E 0 ( 1 D 0 ) ε 1 + 2 μ σ 3 D 0 = 1 ( 1 D 1 ) ( 1 D a ) ( 1 D b ) 1 D a D b 1.8%0.8%Water damage, fractured rock, triaxial
Publisher’s Note: MDPI stays neutral with regard to jurisdictional claims in published maps and institutional affiliations.

