Abstract
Ferruginous clay minerals in saturated soils and within hydrocarbon deposits often exist in a reduced state. Upon introduction of dissolved oxygen, or other oxidants, the clay minerals oxidise and changes in mineral surface charge and sorption capacity occur, resulting in changes in hydration as well as flux of intercalated species. Here we examine the sorption of water to the Fe-containing clay minerals nontronite NAu-2 (23 wt% Fe) and illite IMt-2 (7 wt% Fe) as a function of Fe oxidation state and exchangeable cations by means of water vapour volumetry and N2 surface area analysis. The clay minerals were chemically reduced using sodium dithionite. Sorption isotherms of water vapour and nitrogen, controlled relative humidity diffractograms, and chemical analyses were recorded. The results show that, after reduction using sodium dithionite, increased amounts of water vapour and nitrogen were adsorbed to the high Fe content nontronite, despite decreased interlayer separation. Little change was observed for the non-swelling and low Fe content illite. Sodium from the reducing agent was found to exchange with calcium present in the starting clay minerals, and sodium balanced the additional mineral charge generated during reduction. The findings presented in this study deliver improved understanding of sorption at the surface of the reduced clay minerals, which aid constrain the role of clay mineral interfaces in subsurface environments.
Keywords:
adsorption; water vapour; BET; nitrogen; SSA; iron reduction; clay surface; nontronite; illite; smectites 1. Introduction
Owing to their high surface area and ubiquitous presence throughout sediments, oils, aquifers and oil reservoirs, clay minerals exert a strong control on transport of dissolved ions and fluids in the sub-surface [1]. Although much research has highlighted the importance of layer charge and type of interlayer cation on the hydration and adsorption properties of clay minerals [2], less effort has focused on understanding how these properties might be affected under the anaerobic conditions typical for saturated soils and hydrocarbon reservoirs. In these reducing environments, structural Fe in clay minerals becomes reduced, increasing the clay mineral’s layer charge, which is balanced by uptake of cations [3]. Very high charge is also balanced by dehydroxylation in the case of high Fe content clay minerals reduced to high extents [4]. In particular, changes in the hydration of reduced clay minerals may arise as a result of increased layer charge and increased hydratable cation content [5], as well as changes in clay mineral layer stacking [6], with associated impacts on transport of dissolved species within the reduced zone. However, the effect of structural changes arising through reduction on the water sorption characteristics of ferruginous clay minerals has not been explored.
Water adsorption–desorption isotherms are used as an important tool for measuring water kinetics and the thermodynamic state at the surface of the clay mineral-water vapour system. Early work on factors important in controlling clay hydration suggested that the initial hydration state of the clay was important [7,8]. This was determined by wetting and drying treatments of clay mineral rich soil prior to measuring the vapour pressure–moisture relationship. The degree of aggregation of the clay prior to hydration was also found to be a key parameter that affected the moisture content of the clay, as shown by Josheph [9]. By studying submicroscopic samples from centrifugation of soil samples, Josheph showed that there was a significant difference in water capacity between the original clay, the colloid and the residue [9]. By isolating the colloidal material from soils and undertaking washing and performing cation substitution experiments, Anderson concluded that oxide and salt concentration within the clay are also controlling factors [10]. It is clear that clay mineral hydration also depends on the interlayer cations that readily exchange in the presence of water [11,12,13]. In these studies, it was shown that clay mineral hydration by means of the exchangeable interlayer cation occurred as hydrating the interlayer cation forces clay mineral layers apart, leading to either crystalline or osmotic swelling. The underpinning mechanism has been extensively studied and reviewed comprehensively [14]. In short, during swelling discrete integer-layer hydrates form within the clay mineral interlayers [15]. The accumulation of hydrate layers forms quasi-crystal structures in the interlayer space, thus creating stepwise increased spacing in the interlayer. Computational chemistry simulations have confirmed this mechanism of clay hydration [16,17] and indicated that accumulation of layer hydrates occurs gradually, leading to the adsorbed water molecules forming discrete hydration layers in the interlayer during initial swelling.
Clay hydration by means of water vapour adsorption is a dynamic and progressive process that is also controlled by the pressure of water vapour, the temperature at which the clay–water system equilibrates, the type of clay mineral, the chemical composition of the system and the water activity during equilibrium [18]. The surface hydration and dehydration of clay minerals exhibit a complete solid solution between the hydrated and dehydrated end members of the clay mineral [19].
Hydration, either at the surface or in a bulk material, is a time-dependent condition, and this is also the case in clay mineral–water systems, where the shifting from dry to wet states occurs gradually and equilibrium sorption experiments are important tools for defining hydration. Calculating the free energy of hydration, ΔGHYD, is key in determining whether equilibrium is attained. Based on the observations made by Tardy and Touret [18], Tardy and Duplay [20] proposed a model for measuring the ΔGHYD for a series of smectite and non-smectite clay minerals. The authors concluded that stability fields, meaning the distinct, individual phases of these minerals (solid, liquid, colloidal), the equilibrium constant and concentration of the phases (solubility products) and the corresponding chemical composition of the clay minerals, were primarily controlled by the following factors: the size of the crystal grain, the extent and location (octahedral or tetrahedral sheet) of isomorphic substitutions giving rise to layer charge and nature of the interlayer cation and, ultimately, the hydration state of the clay. Subsequent to these studies, considerable research has been undertaken to understand clay swelling and stability under hydration [21].
To quantitatively understand changes in clay mineral surface area, adsorption of gases at the clay mineral surfaces is a widely accepted methodology [22]. The Brunauer-Emmett-Teller (BET) method is based on a previous model proposed by Langmuir [22], used to describe the dynamic equilibrium in adsorbent–adsorbate systems based on the sorption and desorption of a gaseous phase to and from a surface. In the BET model [23], it is assumed that the mineral surface is homogeneous and lateral interactions do not occur between adsorbate molecules. Moreover, adsorption energy is the same for all sites and adsorption can occur in an infinite number of layers, whereas Langmuir’s theory was limited to one surface layer of adsorbate molecules. Based on the type of material the generated isotherms can vary in type, with five distinct types of isotherms [23] describing the creation of mono- or multi-layers at different pressures and constant temperature.
In this study, we combine water vapour volumetry and nitrogen BET methods with X-ray diffraction analyses to investigate the effects of clay mineral Fe reduction on: (1) bulk water adsorption, (2) changes in clay mineral surface area and pore structure and (3) the relative contribution of clay mineral interlayers and micro/macro-pores for water uptake.
2. Materials and Methods
2.1. Clay Mineral Preparation and Fe(II)/Fe(III) Determination:
To allow comparison with previous studies, the clay minerals were sourced from the Clay Minerals Society’s Source Clay Repository (www.clays.org, accessed on 23 March 2021). Nontronite NAu-2 has the reported composition: SiO2: 56.99, Al2O3: 3.4, Fe2O3: 37.42, MgO: 0.34, CaO: 2.67, Na2O: 0.11, K2O: 0.02, yielding a structural formula of M+0.72[Si7.55Al0.45][Fe3.83Mg0.05]O20(OH)4 with an octahedral Fe3+ content of 23 wt% [24]. The illite IMt-2 has a reported composition (%) of: SiO2: 49.3, Al2O3: 24.25, TiO2: 0.55, Fe2O3:7.32, FeO: 0.55, MnO: 0.03, MgO: 2.56, CaO: 0.43, Na2O: 0.05 K2O: 7.83, P2O5: 0.08, LOI: 8.02, with 76% Fe3+ and 24% Fe2+, yielding a structural formula of K0.7Na0.01(H2O)0.42(Al1.53Fe2+0.06Fe3+0.19Mg0.28)Σ = 2.06 (Si3.44Al0.56)O10(OH)2 and a total octahedral Fe content of 7 wt% [25]. Similar values were obtained with minor discrepancies from ICP-OES (Thermo ICAP 65000, ThermoFisher Sientific, Waltham, MA, USA) analysis of fully digested samples, as shown in the supplementary information (see Table S1 in supplementary material, Section S1). The mineralogy of the clay minerals used has previously been described by others, with the nontronite NAu-2 described as 95% nontronite, 5% plagioclase and less than 1% quartz [24], whereas the illite IMt-2 has a bulk mineralogy of illite 89.3%, followed by 7.5%, 2%, 0.9% and 0.3% quartz, microcline, rutile and kaolinite, respectively [26]. Each sample obtained was also analysed for mineralogy as detailed below.
The aggregated clay material was ground until the consistency was fine-grained and ready for analytical sample preparation using a Retsch RM 100 hard porcelain mortar grinder (Retsch, Haan, Germany) with a feed size below 8 mm and final fineness below 10 μm. Each batch of clay mineral was ground for approximately 15 min until passing through a 500 μm sieve. For the water vapour and nitrogen adsorption methods, 0.15 g of ground, sieved clay mineral was used.
Both clay minerals were chemically reduced using dithionite as the reductant following the method described by Neumann et al. [4]. For the clay mineral Fe reduction, the amount of sodium dithionite (Sigma Aldrich, St. Louis, MI, USA) required was calculated based on the amount of Fe in the clay mineral (mmol/g), the 2:1 stoichiometry of the redox reaction of dithionite (two-electron donor) with Fe3+ (one-electron acceptor), and the desired Fe reduction extent (see Section S2 for the method for chemical reduction by dithionite). The samples were then washed three times with deionized water (Colepalmer, St. Neots, UK) prior to analysis to remove any excess salt. Clay mineral Fe reduction and handling of resulting suspensions were carried out inside an anaerobic glovebox (N2: 100%; GS Glovebox Systemtechnik GmbH, Germany). To determine the relative amounts of Fe(II) and Fe(III) within the native and reduced samples, Mössbauer spectroscopy was used (see Section S3). Samples were transferred under nitrogen to the BET and XRD instruments to minimise oxidation.
The nomenclature for the samples prepared is: Oxidised nontronite NAu-2 (100% Fe(III)/Fe(total)) = NAu-2 OX; Partially reduced nontronite NAu-2 (28% Fe(II)/Fe(total)) = NAu-2 PARED; 100% Reduced nontronite NAu-2 (100% Fe(II)/Fe(total)) = NAu-2 RED; Oxidised illite IMt-2 (34% Fe(II)/Fe(total) after iron oxyhydroxide phase dissolution) = IMt-2 OX; Partially reduced illite IMt-2 (43% Fe(II)/Fe(total)) = IMt-2 PARED; Reduced illite IMt-2 = IMt-2 RED (41% Fe(II)/Fe(total)).
2.2. X-ray Diffraction Analysis
For each of the clay minerals used, quantitative bulk and clay fraction powder X-ray diffraction analysis (XRD) was undertaken at the James Hutton Institute, Aberdeen to verify mineralogical composition. For bulk (whole sample) quantitative analysis samples were wet ground for 12 min (in ethanol or water) in a McCrone mill (Retsch, Haan, Germany) and spray dried to produce random powder specimens, as shown in Figures S3 and S4 for the NAu-2 and IMt-2 samples, respectively [27]. X-ray powder diffraction (XRPD) patterns were recorded (Panalytical X-pert Pro, Almelo, The Netherlands) from 4–70 °2θ using Ni filtered Cu radiation and counting for 96 s per 0.019° step. Quantitative analysis was made by a normalised full pattern reference intensity ratio (RIR) method as described in references [27,28]. Unless stated otherwise, expanded uncertainty using a coverage factor of 2, i.e., 95% confidence, is given by ±X 0.35, where X = concentration in wt%., e.g., 30 wt% ± 3.3 [29]. Note also, that for phases present at the trace level (<1%) there may also have been uncertainty as to whether or not the phase was truly present in the sample.
For semi-quantitative analysis of clay minerals based on their basal reflections, clay fractions of <2 μm were obtained by timed sedimentation, prepared as oriented mounts using the filter peel transfer technique and scanned from 2.5–45 °2θ using a Bruker D8 Advance (Bruker, Billerica, MA, USA) instrument and counting for 16.5 s per 0.019° step. Three scans were made, one in the air-dried state, one after glycolation (vapour pressure 24 h), and one after heating to 300 °C for one hour. Clay minerals identified were quantified using a mineral intensity factor approach based on calculated XRPD patterns [30]. For clay minerals present in amounts >10 wt% uncertainty is estimated as better than ±5 wt% at the 95% confidence level.
In order to understand the clay mineral hydration further, controlled relative humidity XRD was undertaken on both clay minerals, in both the reduced and oxidized states, also carried out at the James Hutton Institute, Aberdeen. Duplicate XRD analyses were carried out on further samples of each clay mineral to ensure reproducibility. Humidity was adjusted in approximately 25% steps at ~3%, ~25–30%, ~48–53% and ~70–78% relative humidity. XRPD patterns were recorded on a Panalytical Xpert Pro diffractometer using Fe filtered, Co Kα, radiation, and an X-celerator position sensitive detector with active length set to 2.12°. Specimens were mounted in powder cavity holders in an Anton Paar XRK 900 reactor chamber (Graz, Austria) and purged with N2 gas at various relative humidities controlled by an external Sycos H gas humidifier. Automatic divergence and antiscatter slits were set to illuminate a constant 6 mm wide area of the specimen and patterns were collected from 3 to 15° 2θ counting for 250 s per 0.017° step so that each scan took approximately 30 min to collect. Successive runs were made from low to high humidity, and prior to each run the specimen was equilibrated at the given relative humidity for one hour. Peak parameters were measured using Bruker Diffrac Eva software (DIFFRAC.SUITE Part 11, Bruker, Billerica, MA, USA, selected peak parameters are given in Table S3).
2.3. Water and Nitrogen Adsorption Measurements
The water and nitrogen isotherms were generated at the Laboratory of Physical Chemistry and Microbiology for Materials and the Environment (LCPME), National Centre for Scientific Research (CNRS), Nancy, France by a volumetric method for the native oxidized and fully reduced samples of NAu-2 and IMt-2. Complete water vapour adsorption–desorption isotherms at 298 K and N2 adsorption–desorption isotherms at 77 K were obtained using a MicrotracBEL Belsorp-Max (Microtrac, Montgomeryville, PA, USA) volumetric adsorption analyser equipped with three pressure sensors (133 kPa, 1.33 kPa and 13.3 Pa). The samples were initially outgassed at 100 °C under vacuum (~3 × 10⁻⁶ Pa) for 20 h. In the case of the water vapour isotherm, a long acquisition time (7 days per isotherm) was required because of slow hydration kinetics.
The determination of a clay mineral’s changes in pore distribution and crystallite size due to water vapour volume sorption was achieved with the calculation of the specific surface area of water vapour (SSAw). The SSAw is defined as the portion of the surface area of the clay mineral that is available to adsorb [31] and is, by definition, proportional to the amount of sorption of the volume of water vapour by the clay mineral. An increased uptake of water vapour by the clay is followed by an increase in the SSAw.
The BET measures the surface area. When nitrogen or water gas is not present, no layer of gas is created. A layer of one molecule thick (monolayer) is expected to be formed after gas molecules are present. After nitrogen saturation has occurred, layers of multiple molecule thickness (multilayer) are formed. Calculations of BET specific surface area for water vapour and nitrogen require the use of Equation (1):
where the measured adsorbed volume of gas is V (cm3/g), P/P0 is the applied relative pressure, Vm (cm3/g) is the calculated monolayer volume of adsorbate and C (calculated dimensionless constant related to the enthalpy of adsorption of the adsorbate vapour on the powder sample) is the BET energetic constant [32]. The linear fits for Equation (1) are given in Figures S5–S7. It can be seen that error within the linear fit is negligible, however sample preparation error may be larger, though repeats were not undertaken in this present work. Vm is related to the total surface area (Stot) through Equation (2):
where N is Avagadros constant, and s is the adsorption cross-section. The BET surface area is Stot/sample mass. Pore size was calculated using the Gurwitch rule (D = 4V/S, where D is the average pore diameter, V is the total pore volume and S the specific surface area obtained using the BET model). The assumptions made are that the pores must be homogeneous in diameter, cylindrical and rigid.
2.4. Composition Analysis of Clay Minerals
Cation composition of the oxidized and reduced clay minerals was measured using inductively coupled plasma optical emission spectroscopy (ICP-OES) analysis at the University of Greenwich. Samples were fused using a lithium metaborate flux (Sigma Aldrich, St. Louis, MI, USA) at a sample: flux ratio of 1:5. The resultant melt was dissolved in weak nitric acid (Sigma Aldrich, St. Louis, MI, USA) and made to volume. Instrumental analysis was performed using a Thermo ICAP 6500 ICP-OES with calibration established using matrix matched synthetic calibration standards made from ICP grade single element stocks (Table S1).
3. Results
3.1. NAu-2 and IMt-2 Water Adsorption Isotherms
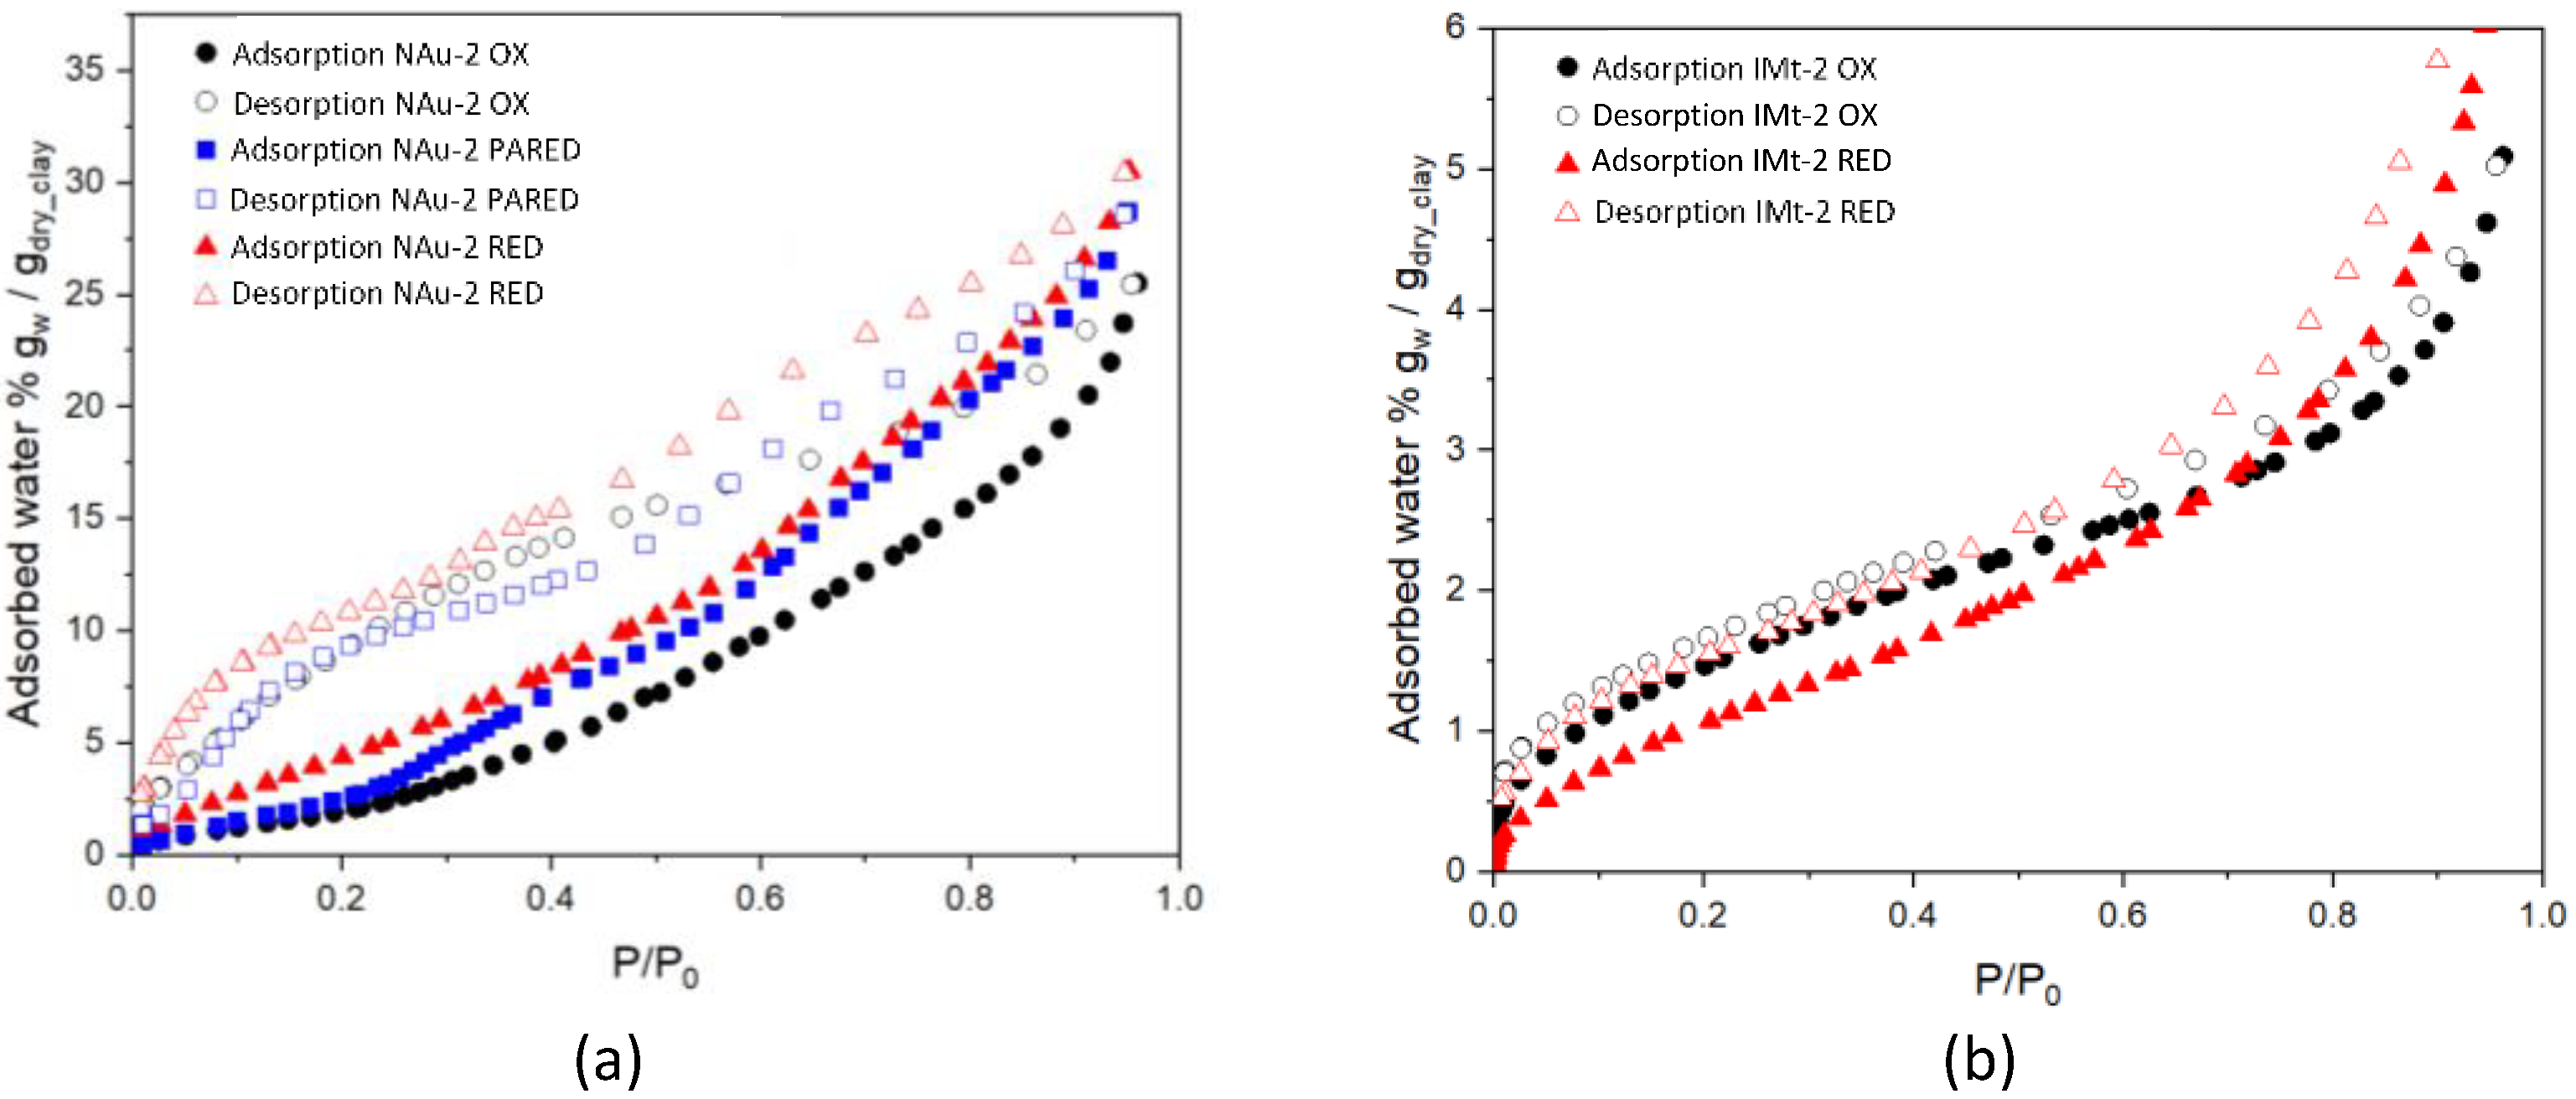
Figure 1a shows the water adsorption for the NAu-2 samples followed the trend of NAu-2 RED > NAu-2 PARED > NAu-2 OX. This is evident at all partial pressures. Hysteresis was evident in both the oxidized and the two reduced NAu-2 samples. Adsorption of water vapour for the partially reduced NAu-2 PARED tracked the NAu-2 OX from 0 to 0.2 P/P0, but then followed the NAu-2 RED curve from ca 0.4 to 1.0 P/P0. Water desorption isotherms exhibited similar behaviour. At all pressures, the desorption isotherm of NAu-2 RED was higher than both NAu-2 PARED and NAu-2 OX. In the 0.9 to 0.6 P/P0 range, just before the desorption isotherms of both samples intersected at a pressure of 1 P/P0, the NAu-2 RED desorption isotherm showed higher sorption. Conversely, from 0.7 to 0.2 P/P0 the NAu-2 OX desorption isotherm showed higher sorption than that of NAu-2 RED. The NAu-2 PARED desorption followed that of NAu-2 OX from 0.2 to 0 P/P0, as with the adsorption curve.
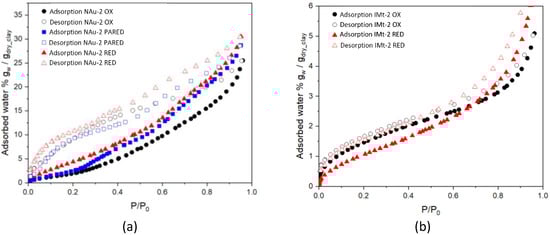
Figure 1.
Water vapour adsorption-desorption isotherms for (a) oxidized nontronite (NAu-2 OX), 50% reduced nontronite (NAu-2 PARED) and 100% reduced nontronite (NAu-2 RED), and (b) oxidized illite (IMt-2 OX) and reduced illite (IMt-2 RED).
Figure 1b shows adsorption and desorption isotherms for oxidized and reduced illite IMt-2. Overall, significantly less water vapour adsorption was observed than for nontronite NAu-2 samples (maximum 6% vs. 32% mass of water/mass of dry clay), with relatively little hysteresis present in the oxidized sample. Adsorption values appeared higher for the oxidized sample (IMt-2 OX) in the 0–0.65 P/P0 range, while the IMt-2 RED was higher from 0.65 to 1 P/P0. The desorption isotherm of IMt-2 RED had higher values for water sorbed at above 0.50 P/P0 and displayed greater hysteresis than the IMT-2 OX. Below 0.50 P/P0, the desorption curves of both oxidized and reduced IMt-2 were very similar
Table 1 presents the water adsorption–desorption parameters of nontronite NAu-2 and illite IMt-2 obtained by water vapour volumetry. The specific surface area (SSAw) was calculated from the water adsorption isotherm at 298 K by the Brunauer, Emmett and Teller (BET) method through multipoint calculation, using the best linear fit in the 0.1 to 0.3 P/P0 range. The calculated BET SSAw for the adsorption branch (Table 1) were based on a classic adsorbate cross-sectional area (σ), for which a water molecule area of 14.8 Å2 was used [27,28]. The SSAw increased for the NAu-2 samples, correlating with extent of reduction, more than doubling from 115 m2/g to 270 m2/g, whereas the SSAw for IMt-2 decreased slightly when reduced, from 68 m2/g to 53 m2/g. The CBET water affinity constant, remained at 8 for the NAu-2, irrespective of oxidation state and decreased from 23, for IMt-2 OX, to 13 for the totally reduced IMt-2 RED.

Table 1.
BET Surface area and energetic constant from water vapour isotherms at 298 K; Vm (cm3/g STP) is monolayer volume, SBET (m2/g) is the water specific surface area and CBET is the energetic constant of water. Error is estimated to be <5% for SSAw.
3.2. NAu-2 and IMt-2 Nitrogen BET Isotherms
Figure 2a shows the nitrogen adsorption isotherms exhibited a Type IV behaviour, as has been first classified by Brunauer et al. [32]. In a Type IV isotherm, the main characteristic is the hysteresis loop that is thought to be associated with capillary condensation occurring in the mesopores of the sample. Moreover, a Type IV isotherm is indicative of a sample’s capacity to adsorb in a range of high pressure [33,34]. In both oxidized and fully reduced nontronite, adsorption hysteresis was evident in the P/P0 0.48–0.99 pressure range.
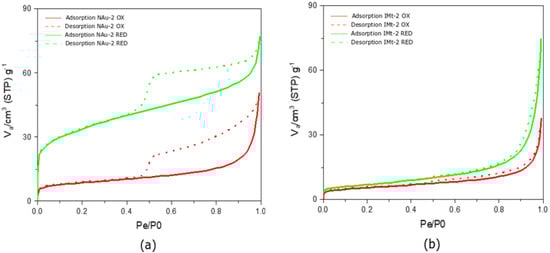
Figure 2.
Nitrogen Adsorption isotherms for the NAu-2 and IMt-2 oxidized and reduced samples. (a) Adsorption and desorption plots of nontronite and fully reduced nontronite; (b) adsorption and desorption plots of illite and fully reduced illite.
The monolayer–multilayer formation limit was indicated in the first part of the isotherms at a P/P0 of 0.04 and 0.06 for NAu-2 OX and NAu-2 RED, respectively, as shown in Figure 2. A very sharp knee seen in the NAu-2 RED sample is indicative of the monolayer completion (Figure 3). The less distinctive knee in the NAu-2 OX isotherm is indicative of monolayer overlapping. Capillary condensation occurred at around 0.8 P/P0 for both samples. According to the classification of hysteresis loops suggested by Sing [35], both NAu-2 samples exhibit a H4 loop type. The almost horizontal isotherms of the H4 type, remain parallel over a range of pressure. The pore structure associated with an H4 loop is narrow slit-like pores.
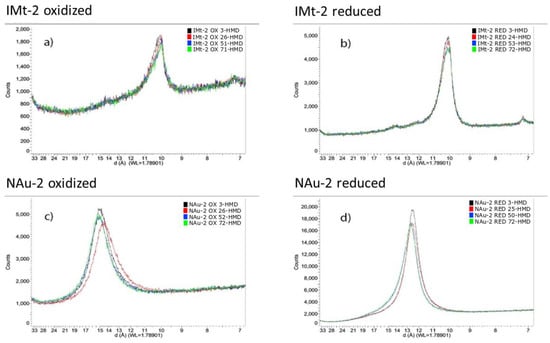
Figure 3.
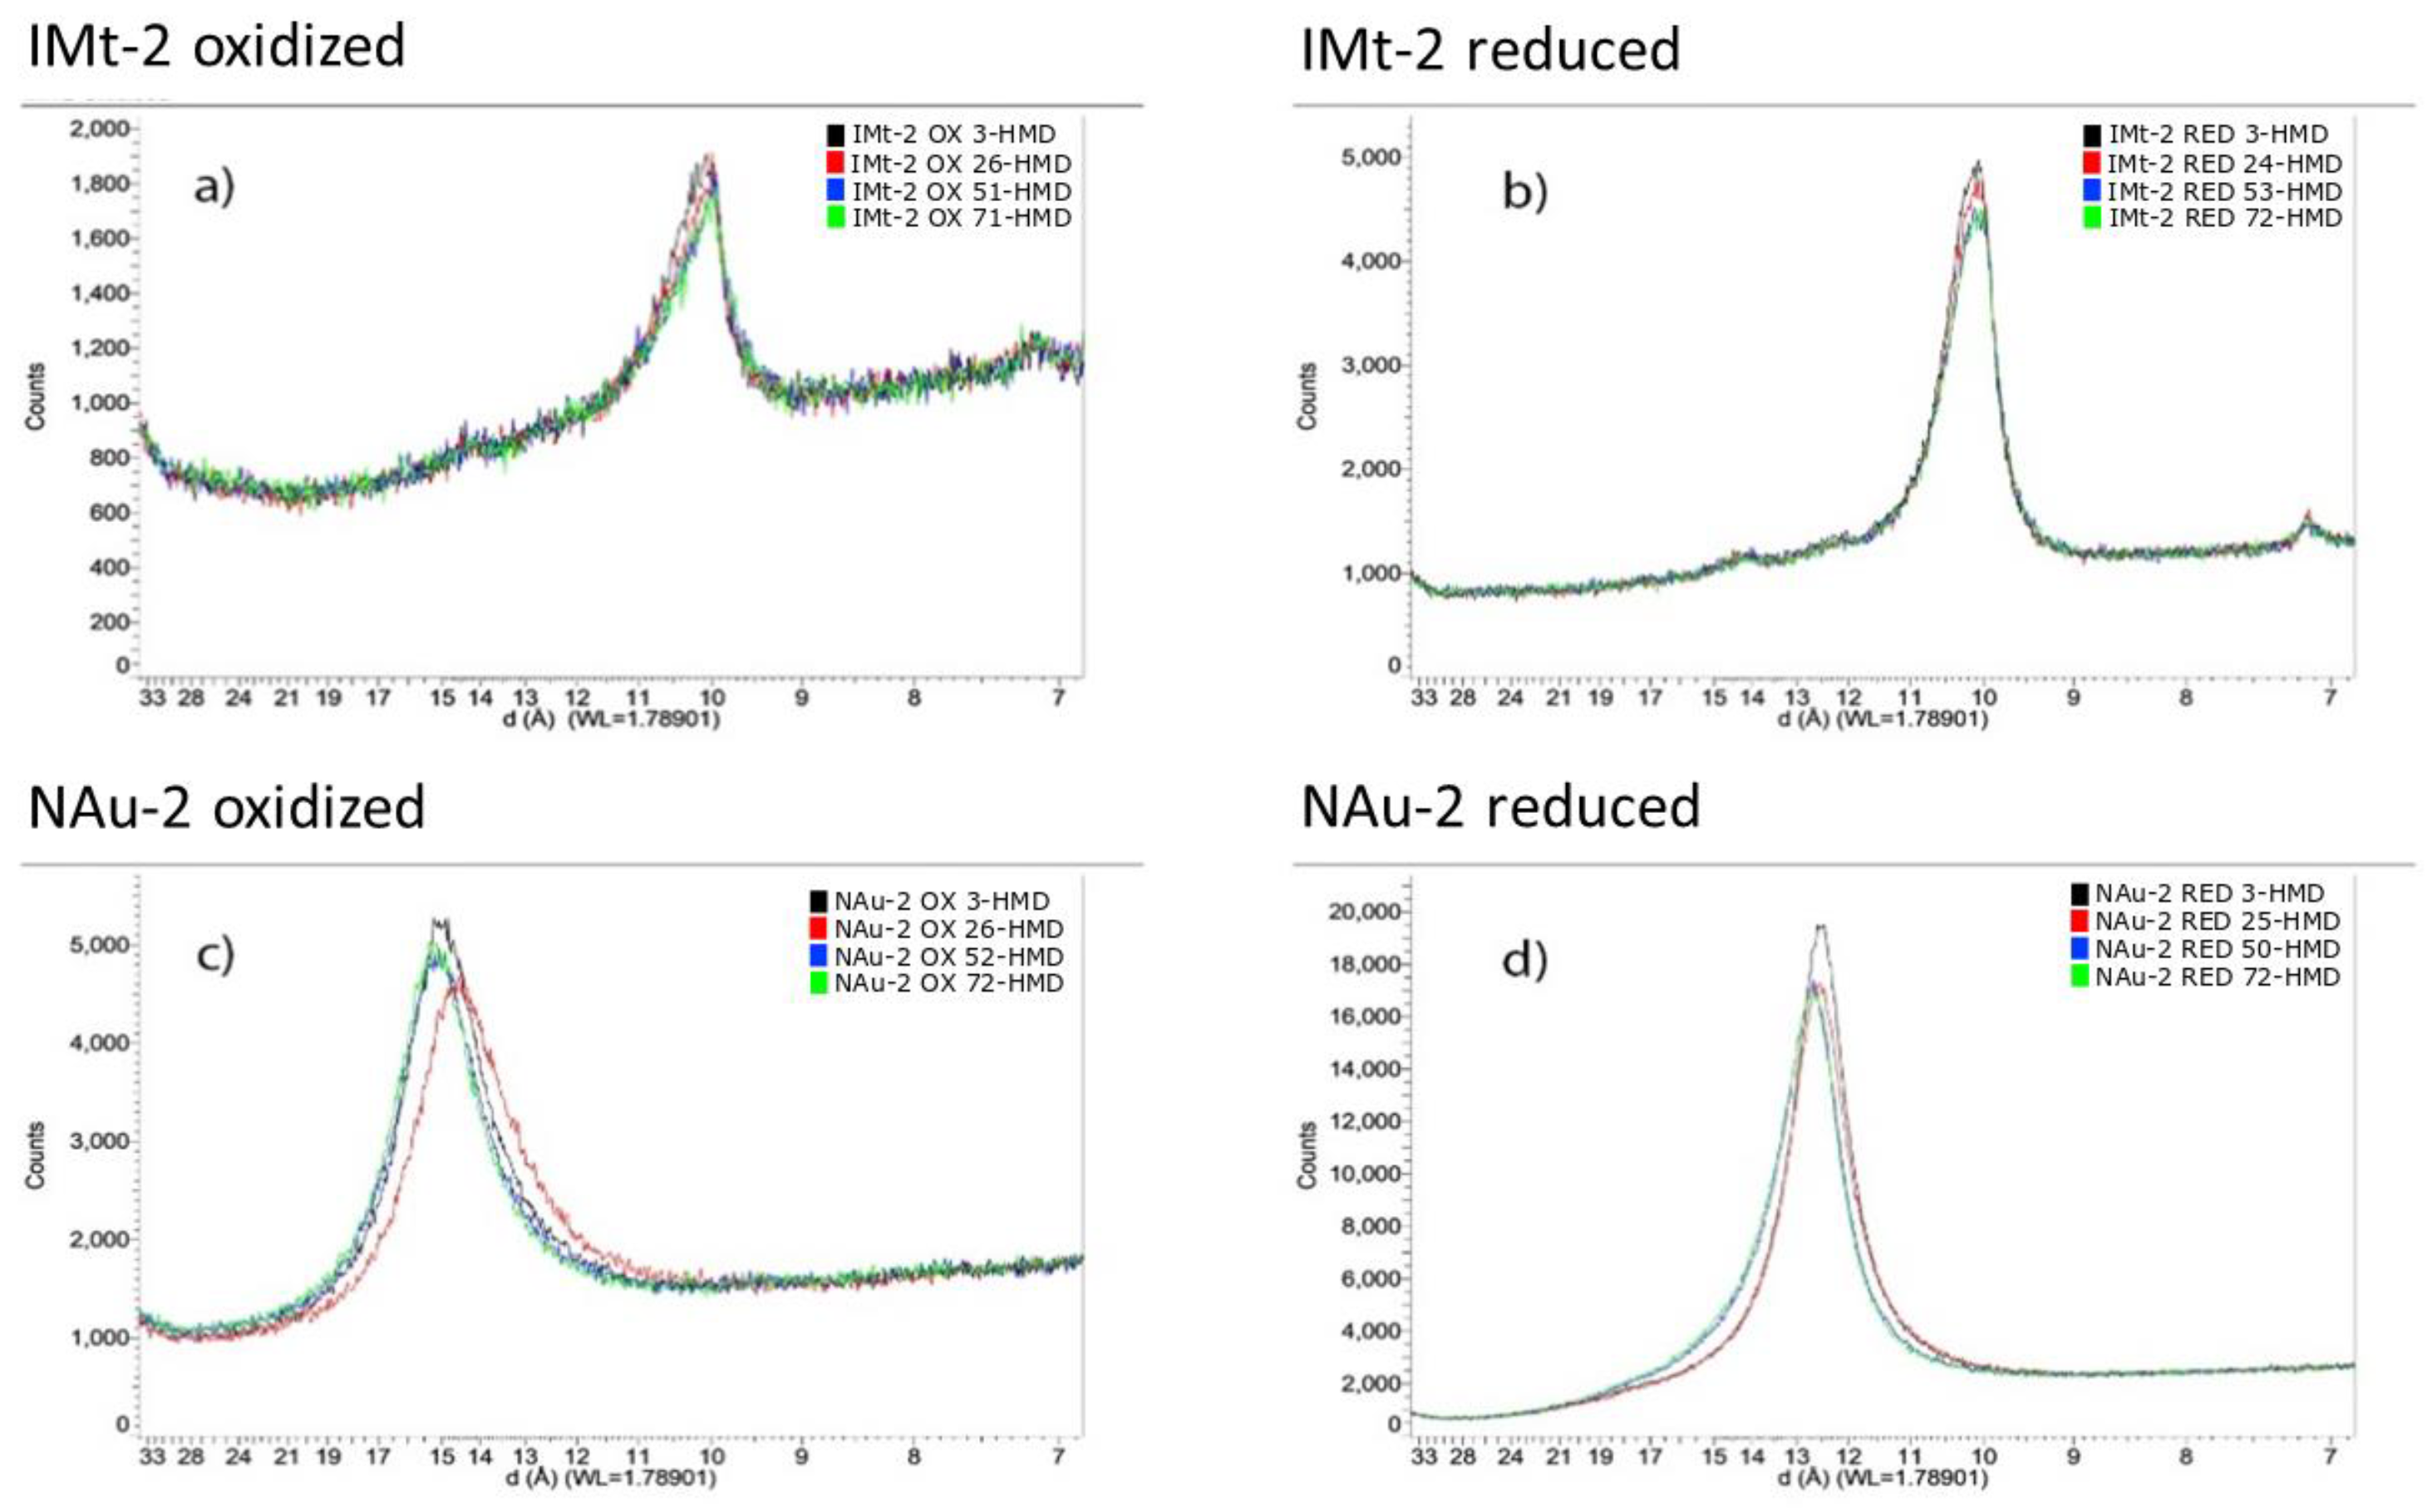
X-ray diffraction patterns showing the 001 basal reflection for the clay minerals (a) IMt-2 OX (b) IMt-2 RED (c) NAu-2 OX and (d) NAu-2 RED, as a function of relative humidity (RH) with black = 3% RH; red = ca 25% RH; blue = ca 50% RH and green = ca 75% RH. Actual RH values are given in the legends of each figure. (a): illite oxidised (b): illite reduced (c): nontronite oxidized (d): nontronite reduced.
In contrast, the illite IMt-2 isotherms is classified as Type II, with no hysteretic effect present (Figure 2b). Adsorption isotherms of this type are present in non-porous materials, with pore diameter larger than micropores. Based on the classification of physisorption data presented by Sing [35], Type II indicates an unrestricted monolayer–multilayer adsorption. The mono–multilayer transition point was at a very low pressure of approximately 0.03 P/P0. However, due to the indistinct knee present at 0.03 P/P0, it is possible that an onset of the multilayer adsorption had occurred, along with an overlap of the monolayer coverage (see Figure 2b). Capillary condensation appeared at mid to high pressures of 0.8 P/P0. The near-zero hysteresis indicated reversibility of nitrogen adsorption on IMt-2. Nitrogen adsorption isotherms generated for partially and fully reduced IMt-2 (Figure S4) show insignificant differences compared to the adsorption isotherm of IMt-2 OX and indicate a limited effect of Fe reduction, the reason for which is discussed later.
Table 2 summarises BET parameters (SSA and C-constant) and porosity parameters for the oxidized and fully reduced nontronite NAu-2 and illite IMt-2. SSAN2 of fully reduced samples increased when compared with oxidized samples, from 31 to 121 m2/g, a significant 118% increase and from 20 to 24 m2/g, corresponding to a 22% increase, for NAu-2 and IMt-2, respectively. The mean pore diameter data showed mesopores decreasing in size from 9.5 to 3.6 nm and increasing from 11 to 18.3 nm for NAu-2 and IMt-2 upon reduction, respectively. An increase of the total available pore volume followed the trend in the SSAN BET increase in the fully reduced samples. More specifically, in the nontronite NAu-2 total pore volume increased from 0.074 to 0.111 cm3/g and, in illite IMt-2, from 0.054 to 0.112 cm3/g (P/P0 = 0.990), corresponding to a 40% and 70% total pore volume increase, respectively.
Table 2.
Nitrogen SSA BET and porosity parameters derived for oxidized and fully reduced NAu-2 and IMt-2 clays. The values were automatically generated using Belsorp Adsorption/Desorption Data Analysis Software (BEL Japan, Inc). Error is estimated to be <5%.
Figure S5a shows the linear regression diagram for nontronite NAu-2 (OX) and Figure S5b for NAu-2 (RED). Linear regression of both oxidized and fully reduced samples were plotted in the pressure range of 0–0.25 P/P0. The corresponding CBET constant values were calculated to be 240 and 212 for NAu-2 OX and NAu-2 RED, respectively (see Table 2). Figures S6 and S7 shows the linear regression diagrams for nitrogen adsorption on IMt-2, for the oxidized (Figure S6a), partly reduced (Figure S7) and reduced (Figure S6b) sample. The BET data were plotted for the range of 0–0.24 P/P0 using the multipoint method. The CBET constant values are 198 and 250 for oxidized and fully reduced illite, respectively (see Table 2). The partly and fully reduced illite showed negligible difference.
3.3. X-ray Diffraction Analyses of Oxidised and Reduced NAu-2 and IMt-2 at Varying Relative Humidity
The quantitative bulk and clay size fraction analysis data for the oxidised NAu-2 and IMt-2 clay minerals used within this study are given in Table 3 and the accompanying X-ray diffraction patters are presented in Figures S3 and S4, respectively. XRD analysis of both bulk sample and clay size fraction confirmed that the NAu-2 bulk sample was greater than 99% pure nontronite, with trace quartz, which was absent in the clay fraction. In contrast, the IMt-2 bulk sample contained 17% quartz, 5% feldspar and 77% illite. Analysis of the clay size fraction of IMt-2 confirmed very little change between XRD patterns recorded in the air dried, glycolated and heated states, but nonetheless some changes were apparent and indicate a small proportion (<5%) of expandable/swelling layers.
Table 3.
Bulk mineralogy and clay size fraction quantitative analysis by X-ray diffraction of the oxidized clay mineral samples NAu-2 and IMt-2.
The effect of relative humidity (RH) on the positions of the 001 basal reflections, and thus interplanar spacing, of the oxidized and reduced clay minerals is shown in Figure 3. With increasing hydration, the basal spacing showed negligible increase from 14.97 Å to 15.17 Å for NAu-2 OX, and a similarly small increase for NAu-2 RED from 12.52 Å to 12.70 Å. This data also indicates a significant decrease in basal spacing in NAu-2 upon reduction from around 15 Å to 12.5 Å. In illite IMt-2, in contrast, basal spacing remained constant with increasing humidity for both oxidized and reduced sample (10.09–10.04 Å and 10.13–10.10 Å, respectively) and was unaffected by clay mineral Fe reduction as the reduction extent of illite was minor, owing to the reductant being consumed in dissolution of Fe phases, as described below. However, changes in peak shape were apparent as measured by the full width at half maximum (FWHM) of the 3% RH samples. Using the Scherrer equation [36], the crystallite domain sizes along the c* direction were calculated and found to increase from 76.3 Å to 111.1 Å for NAu-2 upon reduction and from 111.0 Å to 132.5 Å for the reduction of IMt-2. Similar trends were noted in the other hydration states, as seen in Table S3, although the exact RH reached varied slightly across samples.
3.4. NAu-2 and IMt-2 Charge-Balancing Cation and Fe(II)/Fe(III) Composition
The amount of charge-balancing cations (Na+, K+ and Ca2+) before and after the reduction are shown in Table 4. From Table 3, bulk XRD analysis showed the NAu-2 sample was 99.5% nontronite, with a minor ~0.5% mass contribution of quartz, and thus the cation composition is representative of the exchangeable cation composition of the clay mineral phase. For IMt-2, the illite clay mineral fraction accounted for 76.8% by mass of the bulk sample (Table 3) with significant quartz (17.1%) and K-feldspar (4.9%) content, indicating contributions of exchangeable, and even more importantly, non-exchangeable cations from phases other than illite.
Table 4.
Exchangeable cation (Ca2+, Na+, K+) amounts and exchangeable cationic charge of oxidised and reduced NAu-2 and IMt-2 measured with ICP-OES, expressed as mmol/100 g. Overall surface charge was calculated based on Ca2+, Na+ and K+ amounts and charge; given in cmol(+)/kg.
Reduced samples of both NAu-2 and IMt-2 exhibit higher overall surface charge as determined by the relative amounts of charge-balancing cations (taken as Na+, K+ and Ca2+) compared to the oxidized samples. The overall surface charge in high Fe content clay mineral NAu-2 increased from 64.0 meq/100 g (NAu-2 OX) to 94.0 cmol(+)/kg (NAu-2 RED), much greater than observed for low Fe content clay mineral IMt-2, for which an increase from 179 cmol(+)/kg (IMt-2 OX) to 182 meg/100 g (IMt-2 RED) was observed. The apparent high overall charge of the IMt-2 samples arises from the presence of the ca 5% K-feldspar in the sample, contributing disproportionately to the overall and constant K+ content. Changes in charge-balancing cation composition in both clay minerals mainly arise due to an increase in Na+ content and a decrease in Ca2+ content.
Table S1 shows that relative to the oxidised NAu-2, Mössbauer spectra shown in Figure S1a, it was calculated that partial NAu-2 reduction resulted in 28% Fe(II)/Fe(total), shown in Figure S1b. IMt-2 reduction reduced some of the structural Fe remaining, from 26.5% in the native form to around 40% Fe(II)/Fe(total) in both partially and fully reduced samples. Comparing Figure S2a with Figure S2b, it can be observed that the Fe(III) sextets, indicative of admixed Fe oxide phases, are removed by the dithionite treatment. The initial Fe(II)/Fe(total) of the illite phase is around 34% (removing the areas of the two sextets). However, there is no apparent difference in Fe(II)/Fe(total) ratio for the partially (Figure S2b) and fully reduced samples (Figure S2c).
4. Discussion
The relative hydration properties of reduced and oxidised ferruginous clays have been an area of some interest as these minerals are important in soil horizons and petroleum reservoirs and the hydration of the minerals is a key control on transport of solutes within these systems [37]. However, owing to variable results being obtained according to different methodologies used, and size-scales considered, some uncertainty exists over whether ferruginous clay minerals hydrate more when reduced or when oxidised. Here, we attempt to understand the macroscopic hydration of Fe containing clay minerals using water vapour adsorption in relation to the changes in crystal structure/organisation using relative humidity X-ray diffraction and relate this to the changes in surface and pore structures using nitrogen adsorption-desorption volumetry and chemical changes by ICP-OES analysis. Owing to introduction of Na+ to the clay, via the reducing reagent, Na-dithionite, it is not possible in this present study to fully separate effects of reduction from effects due to cation exchange. Further challenges arose with the unpurified illite IMt-2 sample as other, non-illite, Fe phases present reacted with the reducing dithionite reagent preferentially to the Fe in the illite.
4.1. Effect of Reduction and Clay Mineral Type on Water Vapour Adsorption of NAu-2 and IMt-2
Increased water vapour adsorption is evident upon increasing structural Fe reduction in nontronite NAu-2, with an increase in monolayer water volume (Vm) from 28 cm3/g for NAu-2 OX to 36 cm3/g for NAu-2 PARED and 68 cm3/g in the case of NAu-2 RED. However, for illite IMt-2, a small decrease was noted upon reduction. More specifically, the increased uptake in NAu-2 is seen in mid to high P/P0 values that contributes significantly for the total increase of adsorbed water (%)gw/gclay after iron reduction (see water adsorption values in Table 1 and Figure 1), indicating that the water uptake is not arising during clay mineral surface coverage, which occurs at low P/P0 values
In terms of hysteresis effects, both reduced and oxidized NAu-2 nontronites show similar trends (Figure 1a), with the hysteresis of oxidized NAu-2 being more dominant in the mid-range pressures and the hysteresis of the reduced NAu-2 dominating in high and low pressures. During depressurising, the NAu-2 surfaces dehydrated and returned to their initial state less readily than they hydrated, indicated by the observed hysteresis. Hysteretic trends arise due to changes in pore size distribution, Table 1, and due to the hydration enthalpy of the exchangeable cations. Hence, the cation type is likely to dominate and thus, with higher charge, more cations are present as discussed further below.
Similar to the case of NAu-2, the totally reduced IMt-2 adsorbed more water vapour than the oxidized sample in higher P/P0 values, as observed in Figure 1b, suggesting changes in pore structure may be responsible. Overall, however, water volume uptake decreased, concomitant to a decrease in the water specific surface area (SSAw) (Table 1) [33]. Low to mid pressures may not be sufficient to cause vapour sorption onto the internal clay mineral surfaces, therefore higher pressure is needed. Potentially, the barrier of hydration in this regard can be attributed to large hydration heterogeneities due to differences in layer charge distributions [38,39], or the need to overcome the initial hydration energy required to form sequential hydration layers in the collapsed K+-containing interlayer of illite [40]. However, it should be noted that subsequent Mössbauer analysis showed that most of the dithionite reducing agent was consumed in removal of Fe oxyhydroxide phases present in the illite samples (see Figure S2 and Table S2) and, as such, structural Fe reduction was negligible.
Although illites and other potassium bearing clays do not swell owing to the low hydration enthalpy of K+, and only partially hold water [40], water vapour adsorption changes between the oxidized and reduced IMt-2 can be observed in Figure 1b. Overall, IMt-2 OX shows almost no hysteresis due to the non-expandable interlayers and low hydration enthalpy of the K+ cations. Upon reduction, there is a more pronounced hysteresis in IMt-2 RED, though this is smaller than the effects noted for NAu-2, reflecting the small changes in layer charge of this low Fe content clay mineral owing to incomplete reduction of structural Fe owing to the dithionite preferentially dissolving Fe oxyhydroxide phases, as evidenced by the Mössbauer spectroscopy.
Relatively few macroscopic studies on ferruginous clay hydration have been undertaken, with several reporting lower uptake of water by the reduced form [41]. However, attempting to understand the hydraulic conductivity in consolidated ferruginous smectite clay barriers, Shen et al. [41] noted that if the clay minerals were reduced post compaction, despite no change in bulk density upon reduction, the hydraulic conductivity increased. The authors rationalised this in terms of regions of collapsed interlayers in the reduced clay minerals creating micropores within the structure, holding more water and improving transport [41]. Other work, looking at contact angles of different fluids on NAu-2 and IMt-2 clay mineral films to indicate wettability, also noted increased water wetting preference upon reduction, relative to the oxidized sample [42]. Taken with the data presented here, both the NAu-2 and IMt-2 ferruginous clay minerals, with high and low Fe content, respectively, and with different exchangeable and fixed interlayer ions (Na+ vs. K+, see below), showed increased wettability upon reduction relative to their oxidized state.
4.2. Crystal Chemistry Controls on Hydration of NAu-2 and IMt-2 upon Reduction
It has previously been shown that a decrease in swelling capacity of the clay occurs as a result of structural Fe reduction in nontronite NAu-2 [43]. Structural Fe reduction in this high Fe content clay mineral was accompanied by structural rearrangements within the dioctahedral sheet, with the resulting Fe2+ forming trioctahedral domains and causing dehydroxylation of the mineral structure and a subsequent collapse of interlayers [5,43,44,45,46,47]. The X-ray diffraction data for NAu-2 in Figure 3c,d confirms this, with a basal spacing of 14.97–15.17 Å, becoming 12.52–12.70 Å upon reduction, with negligible variation in either sample across the range of applied relative humidity values. Changes in cation composition arising during the reduction process dominated basal spacing shift in the NAu-2, rather than extent of hydration. The lower Fe content illite IMt-2 showed no apparent change in basal spacing due to either humidity changes or Fe oxidation state change, as expected owing to the lack of removal of K+, as evidenced in Table 4. This data confirmed that the uptake of water in the reduced ferruginous clay minerals, NAu-2 and IMt-2, was not driven by interlayer expansion and subsequent clay mineral swelling.
Previous studies have shown that in both biologically and chemically reduced sodium saturated nontronites [5,6,46,47,48,49] less water adsorption occurs, at all partial pressures, upon Fe reduction when compared to the oxidized nontronite. That was evident both in the bulk, seen with gravimetric water content analysis and through assessing the effect of the cation by using trimethylphenylammonium (TMPA) to measure changes in the bulk, and at the clay mineral surface using ethylene glycol-monoethyl ether, EGME, specific surface area measurements analysis to measure the surface swelling of reduced samples [46,47]. This previous research suggested that decreased swelling upon reduction is due to the layer charge increase leading to fewer available interlayers participating in the swelling, as may be expected. Hitherto, we are unaware of previous studies of illite reduction and illite is generally considered a non-swelling clay mineral owing to the low enthalpy of hydration of the K+ cation and a higher net negative layer charge.
Analysis of the crystallite size in the c* direction from the FWHM data showed that the reduced samples consistently showed a narrower peak width, indicating increased crystallite domain size (see Table S3). The crystallite size of NAu-2 OX was 76.3 Å, which indicates crystallite domains of approximately 5 layers in total, with basal spacings recorded of ca 15 Å. In contrast, NAu-2 RED was found to have a crystallite domain length of 111.1 Å, which for a basal spacing of ca 12.5 Å yields a crystal domain containing 9 layers. Similar analysis for IMt-2 OX and IMt-2 RED (111.0 Å and 132.5 Å crystallite domain size, and basal spacing of ca 10 Å), gives 11 layers and 13 layers, respectively. A similar effect was noted by Stucki and Tessier, who studied a ferruginous smectite (SWa-1) using scanning electron microscopy and noted that upon reduction, ‘consolidation’ of smectite particles occurred and an extensive network of small crystals (1–6 layers thick) formed distinct particles about 20–40 layers thick [6]. Though the aggregation of layers is not as pronounced in the data in this present study, it nevertheless follows a similar trend. It was further noted that the XRD data also showed consistent increased intensity in basal reflections in the reduced samples, which may be indicative of more overall face-to-face contact/registration of clay (2:1) layers.
Additional hydration will arise from the increased levels of Na+ in the reduced sample, owing to Na+ balancing the additional charge caused by the reduction process (Fe3+ to Fe2+ conversion) and the exchange of Na+ from the sodium dithionite with other, less hydratable, cations such as K+ and increased cation numbers through exchange of Ca2+. ICP-OES analysis (Table 4) showed an increase in overall surface charge (based on charge-balancing cation content) upon reduction, from 64 to 94 cmol(+)/kg for NAu-2 upon reduction, and from 179 to 182 cmol(+)/kg for IMt-2, a much smaller change. Na+ content increased as a direct effect of the reduction in both NAu-2 and IMt-2 clay minerals as a result of this additional charge and cation exchange. Cation substitutions occurred mainly between Ca2+ and Na+, for both clay mineral types, with loss of Ca2+ and gain of Na+. The change to monovalent ions resulted in a significantly higher content of hydratable cations (see Table 4). The increased layer charge and exchange selectivity for Na+ within the chemical reduction process contributes to the increased water uptake in NAu-2 when reduced.
There is a scarcity of literature about the cation exchange capacity of the IMt-2 as a function of structural Fe reduction. Table 4 shows that illite IMt-2 also underwent Ca2+/Na+ exchange, however the change in K+ content was negligible. The K-rich interlayer remained relatively unaltered in the reduced conditions as the oxidized and reduced illite have consistent K+ content and modest change in overall sample surface charge with ca 9% increase in exchangeable cations. The presence of feldspar in the illite sample makes direct comparison difficult. Despite the increase in Na+, from 2.8 to 14.2 mmol/100 g in the IMt-2 (Table 4), no increase in water sorption was noted. As noted previously, owing to the reduction chemistry first removing Fe oxyhydroxide phases, very little structural Fe was reduced in the IMt-2 samples and, as such, there observations are consistent with this.
Total ΔHhydration is therefore expected to vary for the nontronite NAu-2 and illite IMt-2, since clay mineral hydration is also directly controlled by clay mineral composition and the type of cations present [50,51,52,53]. The ΔHhydration of the clay minerals can be attributed to the cations that balance the negative excess charge, located at the basal planes and interlayers and also on their accessibility and availability for hydration. Specifically, it is the effect of the increased layer charge, balanced by dithionite reagent Na+, and the exchange of Ca2+ with Na+ that may correlate with changes in NAu-2 swelling and water uptake. In the case of illite, though there is evidence of some exchange of Ca2+ with Na+, the majority of K+ ions are unchanged and IMt-2 remains non-swelling (Table 4). In natural systems, the composition of pore waters is likely to be more varied than the controlled systems studied here.
4.3. Effect of Clay Mineral Fe Reduction on Nitrogen Adsorption to NAu-2 and IMt-2
Nitrogen sorption was observed to be higher in the case of nontronite NAu-2 in terms of sorption isotherms (Figure 2a), when compared to illite IMt-2 (Figure 2b), for both the reduced and oxidized cases. Nitrogen adsorbs to external surfaces of the clay mineral particles, without penetrating into the interlayer domains, in contrast to water vapour [54,55]. Hence, lower specific surface area values were observed for nitrogen (SSAN, Table 1) compared to water vapour sorption (SSAw, Table 2).
Hysteresis was mainly present in the NAu-2 desorption isotherms, as opposed to the near-zero hysteresis seen in IMt-2 desorption. This can be attributed to the higher degree of structural charge in the high Fe, fully reduced NAu-2, with associated high hydratable Na+ content, resulting in an approximately 4-fold increased pore volume (Table 2) and surface area after reduction. Illite IMt-2 showed almost no hysteresis effect during desorption, owing to the low enthalpy of hydration of charge-balancing K+ as well as only a small change in nitrogen adsorption, pore volume and surface area increase upon reduction. As noted above, the reason for this latter result lies in the removal of reductant dithionite by dissolution of Fe oxyhydroxide phases within the IMt-2 sample.
Increased nitrogen adsorption occurred at the surfaces, mainly for the reduced swelling NAu-2 as the result of textural and possibly surface changes (i.e., increased pore volume and changes occurring during the observed aggregation of clay layers) due to reduction (see Table 2). The nitrogen adsorption method showed an increase in specific surface area and pore volume for the reduced clay minerals, as derived from the isotherm information. A Type IV and Type II curves indicate a hysteresis loop that is associated with capillary condensation occurring in the mesopores and a reversible unrestricted monolayer–multilayer adsorption for NAu-2 and IMt-2, respectively. A decrease in mean pore diameter was evident after the reduction for NAu-2 (possibly owing to changes in clay stacking domain size) and an increase for IMt-2 reduced samples (owing to removal of iron oxyhydroxide phases during reduction), with their porosity remaining in the mesoporous (2–50 nm diameter) category [56]. These findings were in line with and correlate well with the water vapour volumetry data, supporting the present understanding that chemical reduction can both suppress clay mineral swelling (whether through cation exchange [57] or structural changes [37]), as evidenced in the X-ray diffraction analysis under different humidities, and yet result in increased water wettability [42] and water vapour sorption.
5. Conclusions
In this study, the effect of structural Fe reduction on water uptake of two different Fe containing clay minerals, nontronite NAu-2 and illite IMt-2, has been examined at a crystal scale and as a powder. Crystal chemistry effects on water sorption were studied using variable relative humidity X-ray diffraction to probe basal spacing and crystallite size, and ICP-OES analysis on digested samples to identify changes in cation composition of the oxidized and reduced samples. At a bulk scale, macroscopic water vapour and nitrogen sorption volumetry methods gave insight into vapour adsorption (hydration), specific surface area and pore structure changes arising due to reduction. The clay minerals have different structures and differ in the amount of iron present and the type of the charge balancing cation, and showed different responses to structural Fe reduction, showing the importance of redox processes and understanding the nature of the Fe-bearing clay mineral on water and solute transport. The findings presented improve understanding of water vapour sorption at the surface of the reduced clay minerals that is key in constraining processes at the clay mineral–fluid interface and critical to understanding transport of solutes and water retention.
For high Fe content NAu-2 after iron reduction, X-ray diffraction analysis showed that the interlayer distance decreased and crystallite size (coherent diffraction domain size) increased through aggregation of more clay layers. Mössbauer analysis showed the NAu-2 PARED sample had not reduced commensurate to the amount of dithionite used, with only 28% reduction attained (compared to 50%), showing the importance of accurately ascertaining reduction extent. For low Fe content IMt-2, there was little change in interlayer distance, though some aggregation of more clay layers was noted. Interpretation of the effect of reduction on the IMt-2 sample, however, must be balanced by the results from Mössbauer analysis showing that little structural Fe reduction has occurred owing to the reduction first of admixed iron oxides/iron oxyhydroxides. ICP-OES analysis showed that cation retention occurred in IMt-2 upon reduction and the K+ was not exchanged by Na+ [58]. For both NAu-2 and IMt-2, the Ca2+ content decreased upon reduction, while the amount of Na+ increased through cation exchange/uptake with Na+ from the chemical reducing agent, potentially accounting for the change in interlayer distance reported above owing to Ca2+ forming outer sphere surface complexes with concomitant larger interplanar spacings than Na+, which forms inner sphere surface complexes [59]. Though interlayer distance decreased in NAu-2, water sorption was found to increase upon Fe reduction, which indicates that the increased water uptake was not due to uptake into the interlayer space. Rather, porosity analysis confirmed that more interparticle spaces became available through increased pore volume and surface area in the reduced Fe clay mineral, relative to the oxidized.
Overall, it can be concluded that chemical reduction of the high Fe NAu-2 nontronite clay minerals can result in increased water sorption, even though interlayer swelling may not change or even be suppressed. This is due to observed changes including increased pore volume and surface area, coupled with uptake of additional Na+ from the surrounding fluids during reduction to balance the additional layer charge [37,38]. In order to resolve the relative effects of interlayer cation composition and textural changes, nontronite that is cation saturated while oxidized, and post reduction, is being studied in ongoing work.
Understanding the causes of changes in hydration upon reduction/oxidation in clay minerals has implications for water retention in anoxic horizons of soils containing significant ferruginous clay fractions, where water content may be higher in the reduced form, with higher void space and thus mobility of solutes. Fines mobility in oil and gas reservoirs, which may start in a reduced state and then oxidize during production, might be expected to alter, both due to increased swelling arising owing to the change in layer charge, and through concomitant cation changes.
Supplementary Materials
The following supporting information can be downloaded at: https://www.mdpi.com/article/10.3390/min12040453/s1, Figure S1: Mössbauer spectra for the nontronite NAu-2 samples; Figure S2: Mössbauer spectra for the illite IMt-2 samples; Figure S3: Phase identification in nontronite NAu-2OX from X-ray diffraction analysis; Figure S4: Phase identification in illite IMT-2OX from X-ray diffraction analysis; Figure S5: BET linear regression plots, generated by multipoint calculation; Figure S6: BET linear regression plots, generated by multipoint calculation; Figure S7: BET linear regression plots, generated by multipoint calculation for the partially reduced IMt-2 sample.; Figure S8. Nitrogen Adsorption isotherms for the oxidized, partially and fully reduced IMt-2 illite; Table S1: Cation composition of the oxidized and fully reduced clay minerals NAu-2 and IMt-2; Table S2: Mössbauer parameters and peak areas for the samples prepared in this work. Table S3: Crystallite domain data from X-ray diffraction analysis [60,61].
Author Contributions
Conceptualization, C.V. and H.C.G.; methodology, C.V., A.N., H.C.G., C.C. and S.H.; software, C.C. and S.H.; validation, C.C. and S.H.; formal analysis, C.V., H.J.L.B., H.C.G., C.C. and S.H.; resources H.C.G., C.C., A.N. and S.H.; data curation, C.V., H.C.G., C.C. and S.H.; writing—original draft preparation, C.V.; writing—review and editing, H.C.G., C.C., S.H. and A.N.; visualization, C.V., H.C.G., C.C. and S.H.; supervision, H.C.G., C.C. and A.N.; project administration, H.C.G., C.C. and A.N.; funding acquisition, H.C.G. All authors have read and agreed to the published version of the manuscript.
Funding
This research received funding from BP [grant: Nanogeochemistry of Low Salinity Enhanced Oil Recovery] and via a PhD studentship from the Natural Environment Research Council [Oil and Gas Centre for Doctoral Training].
Acknowledgments
The authors would like to thank David Wray (University of Greenwich) for providing the ICP-OES data, Kuhan Chellappah (BP) for advising on the project, and Helen Pendlowski who ran the RH clay samples. Special thanks also go to the editors and anonymous reviewers for their input.
Conflicts of Interest
The authors declare no conflict of interest.
References
- Binoy, S.; Raj, M.; Sammani, R.; Nanthi, B.; Sik, O.Y. The role of soils in the disposition, sequestration and decontamination of environmental contaminants. Philos. Trans. R. Soc. 2021, 376, 20200177. [Google Scholar]
- Strawn, D.G. Sorption mechanisms of chemicals in soils. Soil Syst. 2021, 5, 13. [Google Scholar] [CrossRef]
- Stucki, J.W.; Golden, D.C.; Roth, C.B. Effect of reduction and reoxidation of structural iron on the surface charge and dissolution of dioctahedral smectites. Clays Clay Miner. 1984, 32, 350–356. [Google Scholar] [CrossRef]
- Neumann, A.; Petit, S.; Hofstetter, T.B. Evaluation of redox-active iron sites in smectites using middle and near infrared spectroscopy. Geochim. Cosmochim. Acta 2011, 75, 2336–2355. [Google Scholar] [CrossRef] [Green Version]
- Gates, W.P.; Wilkinson, H.T.; Stucki, J.W. Swelling properties of microbially reduced ferruginous fmectite. Clays Clay Miner. 1993, 41, 360–364. [Google Scholar] [CrossRef]
- Stucki, J.W.; Tessier, D. Effects of iron oxidation state on the texture and structural order of Na-nontronite gels. Clays Clay Miner. 1991, 39, 137–143. [Google Scholar] [CrossRef]
- Thomas, M.D. Aqueous vapour pressure of soils. Soil Sci. 1921, 11, 409–434. [Google Scholar] [CrossRef]
- Thomas, M.D. Aqueous vapour pressure of soils: II Studies in dry soil. Soil Sci. 1921, 17, 1–18. [Google Scholar] [CrossRef]
- Josheph, A.F. The moisture equivalent of heavy soils II. J. Agric. Sci. 1927, 17, 12–20. [Google Scholar] [CrossRef]
- Anderson, M.S. The influence of substituted cations on the properties of soil colloids. J. Agric. Res. 1929, 38, 505–584. [Google Scholar]
- Foster, M.D. The relation between composition and swelling in clays. Clays Clay Miner. 1954, 3, 205–220. [Google Scholar] [CrossRef]
- Norrish, K. The swelling of montmorillonite. Faraday Discuss. 1954, 18, 120–134. [Google Scholar] [CrossRef]
- Zhang, Z.Z.; Low, P.F. Relation between the heat of immersion and the initial water content of Li-, Na-, and K-montmorillonite. J. Colloid Interface Sci. 1989, 133, 461–472. [Google Scholar] [CrossRef]
- Anderson, R.L.; Ratcliffe, I.; Greenwell, H.C.; Williams, P.A.; Cliffe, S.; Coveney, P.V. Clay swelling—A challenge in the oilfield. Earth-Sci. Rev. 2010, 98, 201–216. [Google Scholar] [CrossRef]
- Mooney, R.W.; Keenan, A.G.; Wood, L.A. Adsorption of water vapour by montmorillonite. II. Effect of exchangeable ions and lattice swelling as measured by X-ray Diffraction. J. Am. Chem. Soc. 1952, 74, 1371–1374. [Google Scholar] [CrossRef]
- Karaborni, S.; Smit, B.; Heidug, W.; Urai, J.; van Oort, E. The swelling of clays: Molecular simulations of the hydration of montmorillonite. Science 1996, 271, 1102–1104. [Google Scholar] [CrossRef] [Green Version]
- Hensen, E.J.M.; Smit, B. Why clays swell. J. Phys. Chem. B 2002, 106, 12664–12667. [Google Scholar] [CrossRef] [Green Version]
- Tardy, Y.; Touret, O. Hydration energies of smectites: A model for glauconite, illite and corrensite formation. Clay Conf. Denver 1987, 46–52. [Google Scholar] [CrossRef]
- Tardy, Y.; Fritz, B. An ideal solid solution model for calculating solubility of clay minerals. Clay Miner. 1981, 16, 361–373. [Google Scholar] [CrossRef]
- Tardy, Y.; Duplay, J. A Method of estimating the Gibbs free energies of formation of hydrated and dehydrated clay minerals. Geochim. Cosmochim. Acta 1992, 56, 3007–3029. [Google Scholar] [CrossRef]
- Smalley, M.V. Clay Swelling and Colloid Stability, 1st ed.; CRC Press: Boca Raton, FL, USA, 2006. [Google Scholar]
- Langmuir, I. The adsorption of gases on plane surfaces of glass, mica and platinum. J. Am. Chem. Soc. 1918, 40, 1361. [Google Scholar] [CrossRef] [Green Version]
- Brunauer, S.; Emmett, P.H.; Teller, E. Adsorption of gases in multimolecular layers. J. Am. Chem. Soc. 1938, 60, 309. [Google Scholar] [CrossRef]
- Keeling, J.L.; Raven, M.D.; Gates, W.P. Geology and characterization of two hydrothermal nontronites from weathered metamorphic rocks at the Uley graphite mine, South Australia. Clays Clay Miner. 2000, 48, 537–548. [Google Scholar] [CrossRef]
- Nieto, F.; Mellini, M.; Abad, I. The role of H3O+ in the crystal structure of illite. Clays Clay Miner. 2010, 58, 238–246. [Google Scholar] [CrossRef] [Green Version]
- Chang, P.H.; Li, Z.; Jean, W.T.; Wang, C.J.; Lin, K.H. Adsorption of tetracycline on 2:1 layered non-swelling clay mineral illite. Appl. Clay Sci. 2011, 67, 158–163. [Google Scholar] [CrossRef]
- Hillier, S. Use of an air brush to spray dry samples for X-ray powder diffraction. Clay Miner. 1999, 34, 127–135. [Google Scholar] [CrossRef]
- Omotoso, O.; McCarty, D.K.; Hillier, S.; Kleeberg, R. Some successful approaches to quantitative mineral analysis as revealed by the 3rd Reynolds Cup contest. Clays Clay Miner. 2003, 54, 748–760. [Google Scholar] [CrossRef]
- Butler, B.; Hillier, S. Automated full-pattern summation of X-Ray powder diffraction data for high-throughput quantification of clay-bearing mixtures. Clays Clay Miner. 2021, 69, 38–51. [Google Scholar] [CrossRef]
- Hillier, S. Quantitative analysis of clay and other minerals in sandstones by X-ray powder diffraction (XRPD). Int. Assoc. Sedimentol. Spec. Publ. 2003, 34, 213–251. [Google Scholar]
- Kuila, U.; Prasad, M. Specific surface area and pore—Size distribution in clays and shales. Geophys. Prospect. 2013, 61, 341–362. [Google Scholar] [CrossRef]
- Brunauer, S.; Deming, L.S.; Deming, W.E. On a theory of the van der Waals adsorption of gases. J. Am. Chem. Soc. 1940, 62, 1723–1732. [Google Scholar] [CrossRef]
- Hagymassy, J., Jr.; Brunauer, S.; Mikhail, R.S. Pore structure analysis by water vapour adsorption: I. t-curves for water vapour. J. Colloid Interface Sci. 1969, 29, 485–491. [Google Scholar] [CrossRef]
- McClellan, A.L.; Harnsberger, H.F. Cross-sectional areas of molecules adsorbed on solid surfaces. J. Colloid Interface Sci. 1967, 23, 577–599. [Google Scholar] [CrossRef]
- Sing, K.S.W. Reporting physisorption data for gas/solid systems with special reference to the determination of surface area and porosity. Pure Appl. Chem. 1982, 54, 2201–2218. [Google Scholar] [CrossRef]
- Patterson, A. The Scherrer Formula for X-Ray Particle Size Determination. Phys. Rev. 1939, 56, 978–982. [Google Scholar] [CrossRef]
- Stucki, J.W. A review of the effects of iron redox cycles on the properties of smectites. Geosci. Rep. 2011, 343, 199–209. [Google Scholar] [CrossRef]
- Ferrage, E.; Lanson, B.; Michot, L.J.; Robert, J.L. hydration properties and interlayer organization of water and ions in synthetic na-smectite with tetrahedral layer charge. Part 1. Results from X-ray diffraction profile modeling. J. Phys. Chem. C 2010, 114, 4515–4526. [Google Scholar] [CrossRef] [Green Version]
- Salles, F.; Douillard, J.M.; Denoyel, R.; Bildstein, O.; Julien, M.; Beurroies, I.; Van Damme, H. Hydration sequence of swelling clays: Evolutions of specific surface area and hydration energy. J. Colloid Interface Sci. 2009, 333, 510–522. [Google Scholar] [CrossRef]
- Wentworth, S.A. Illite. Clay Sci. 1970, 3, 140–155. [Google Scholar]
- Shen, S.; Stucki, J.W.; Boast, C.W. Effects of structural iron reduction on the hydraulic conductivity of Na-smectite. Clays Clay Miner. 1992, 40, 381–386. [Google Scholar] [CrossRef]
- Apeiranthitis, N.; Neumann, A.; Greenwell, H.C. Redox dependency of wettability of iron bearing clay minerals; implications for enhanced oil recovery. Energy Fuels 2022. in submission. [Google Scholar]
- Manceau, A.; Lanson, B.; Drits, V.A.; Chateigner, D.; Gates, W.P.; Wu, J.; Stucki, J.W. oxidation-reduction mechanism of iron in dioctahedral smectites: I. Crystal chemistry of oxidized reference nontronites. Am. Miner. 2000, 85, 133–152. [Google Scholar] [CrossRef]
- Stucki, J.W.; Komadel, P.; Wilkinson, H.T. Microbial reduction of structural iron(III) in smectites. Soil Sci. Soc. Am. J. 1987, 6, 1663–1665. [Google Scholar] [CrossRef]
- Gates, W.P.; Stucki, J.W.; Kirkpatrick, R.J. Structural properties of reduced Upton montmorillonite. Phys. Chem. Miner. 1996, 23, 535–541. [Google Scholar] [CrossRef]
- Kostka, J.E.; Wu, J.; Nealson, K.H.; Stucki, J.W. The impact of structural Fe(III) Reduction by Bacteria on the Surface Chemistry of Smectite Clay Minerals. Geochim. Cosmochim. Acta 1999, 63, 3705–3713. [Google Scholar] [CrossRef]
- Stucki, J.W.; Kostka, J.L. microbial reduction of iron in smectite. Comptes Rendus Geosci. 2006, 338, 468–475. [Google Scholar] [CrossRef]
- Favre, F.; Stucki, J.W.; Pascal, B. Redox properties of structural Fe in ferruginous smectite. A discussion of the standard potential and its environmental implications. Clays Clay Miner. 2006, 54, 466–472. [Google Scholar] [CrossRef]
- Lear, P.R.; Stucki, J.W. Effects of iron oxidation state on the specific surface area of nontronite. Clays Clay Miner. 1989, 37, 547–552. [Google Scholar] [CrossRef]
- Pons, C.H. Evidence of Relationships between Texture and Structure in Smectite Systems by Small Angle Synchrotron X-ray Scattering. Ph.D. Thesis, INIS, Dublin, Ireland, 1980. Volume 48. [Google Scholar]
- Haitlim, A.; Robert, M.; Tessier, R.; Prost, R. Influence of exchangeable cations (Na, Ca, Mg) and salt concentration on the physical properties (water retention, hydraulic conductivity) of montmorillonite. Agronomie 1984, 4, 451–459. [Google Scholar]
- Ben Rhaiem, H.; Tessier, D.; Pons, C.H. comportement hydrique et evolution structurale et texturale des montmorillonites au cours d’un cycle de dessiccation-humectation partie I cas des montmorillonites calciques. Clay Miner. 1986, 21, 9–29. [Google Scholar] [CrossRef]
- Touret, O. Structure of Hydrated Clays: Thermodynamics of Dehydration and Compaction of Smectites. Ph.D. Thesis, University of Strasbourg, Strasbourg, France, 1988. Available online: www.theses.fr/1988STR13026 (accessed on 10 May 2021).
- Kraehenbuehl, F.; Stoecki, H.F.; Brunner, F.; Kahr, G.; Muller-Vonmoos, M. Study of the water-bentonite system by vapour adsorption, immersion calorimetry and X-ray techniques: 1. micropore volumes and internal surface areas, following Dubinin’s theory. Clay Miner. 1987, 22, 1–9. [Google Scholar] [CrossRef]
- Środoń, J.; McCarty, D.K. Surface area and layer charge of smectite from CEC and EGME/H2O-retention measurements. Clays Clay Miner. 2008, 56, 155–174. [Google Scholar] [CrossRef]
- Mays, T.J. A New Classification of Pore Sizes; Llewellyn, P.L., Rodriquez-Reinoso, F., Rouqerol, J., Seaton, N., Eds.; Studies in Surface Science and Catalysis; Elsevier: Amsterdam, The Netherlands, 2007; Volume 160, pp. 57–62. [Google Scholar]
- Brindley, G.H.; Brown, G. Crystal structures of clay minerals and their X-ray identification. Mineral. Soc. Monogr. 1980, 5, 411–438. [Google Scholar]
- Cervini-Silva, J.; Larson, R.A.; Stucki, J.W. Hydration/expansion and cation charge compensation modulate the Brønsted basicity of distorted clay water. Langmuir 2006, 22, 2962–2965. [Google Scholar] [CrossRef] [PubMed]
- Underwood, T.; Erastova, V.; Greenwell, H.C. Ion adsorption at clay-mineral surfaces: The Hofmeister series for hydrated smectite minerals. Clays Clay Miner. 2016, 64, 472–487. [Google Scholar] [CrossRef] [Green Version]
- Rancourt, D.G.; Ping, J.Y. Voigt-based method for arbritrary-shape static hyperfine parameter distributions on Mössbauer-spectroscopy. Nucl. Instrum. Methods Phys. Res. B 1991, 58, 85–97. [Google Scholar] [CrossRef]
- Lagarec, K.; Rancourt, D.G. Recoil-Mössbauer Spectral Analysis Software for Windows; Department of Physics, University of Ottawa: Ottawa, ON, Canada, 1998. [Google Scholar]

Publisher’s Note: MDPI stays neutral with regard to jurisdictional claims in published maps and institutional affiliations. |
© 2022 by the authors. Licensee MDPI, Basel, Switzerland. This article is an open access article distributed under the terms and conditions of the Creative Commons Attribution (CC BY) license (https://creativecommons.org/licenses/by/4.0/).