Abstract
Dissolution mechanisms and kinetics have a key role in better understanding of processes. In this work, magnetite and hematite powder were dissolved in oxalic and nitric acid mixtures at different temperatures. Higher temperature and higher amounts of oxalic acid in the system accelerated the dissolution kinetics but did not result in higher solubility levels. Oxalic acid had also drawbacks in the process since higher amounts in the system promoted formation of a solid product, humboldtine (Fe(II)C2O4∙2H2O), which, in turn, inhibited the dissolution. This problem may be overcome by adding even a small amount of nitric acid to the system. Kinetic analysis showed, in the variable-rate-controlling step, that two linear fits of the Kabai model described the dissolution better in an oxalic acid and acid mixture of 70/30. Thermodynamic data and special cubic models showed that the nitric acid concentration had a significant role in the solubility, whereas the concentration of oxalic acid had only minor effects on solubility. The results also showed that measuring the oxalate and nitrate concentrations did not provide additional information about the dissolution mechanism itself. The pH, however, might be a tool for following the extent of dissolution, even though it is not a direct indicator of the dissolution mechanism.
Keywords:
acidic dissolution; hematite; magnetite; humboldtine; oxalic acid; nitric acid; kinetics; mechanisms 1. Introduction
Due to decreasing amounts of high-grade deposits and increasing demand for metals, alternative metal resources have received increasing interest during recent decades. Iron is often found as an impurity in secondary resources; therefore, it should be removed prior to utilizing the target element [1,2,3,4]. Dissolution is an interesting option due to its high selectivity and mild process conditions. Rather often, dissolution can be carried out at room temperature or within a few hours at elevated temperatures [5]. An interesting practical application is the regeneration ceramic filter media used in iron ore processes by acidic dissolution [6]. Moreover, oxalic acid can be used to dissolve the magnetite oxide film, which forms the majority of the corrosion oxides in the cooling system of a nuclear power plant [7].
In the dissolution processes, dissolution kinetics play a vital role in terms of process optimization, because by knowing the kinetics and the rate-controlling step, the whole process can be manipulated. The kinetic models presented in the literature are not solely based on the dissolution phenomena but are often also based on mathematical data fitting. However, kinetic models give a good estimation on the rate-controlling step of a reaction. Markus et al. [8] pointed out that kinetic modelling alone cannot provide an answer to the dissolution mechanism. Understanding the dissolution mechanism also requires deep characterization of the solid phase. Considering that many kinetic models have either a purely mathematical background or are a combination of mathematics and theory on chemical reactions, the requirement to study the chemical system itself through characterization of the chemical species seems logical.
Nitric acid can be used as a leaching agent in copper and zinc hydrometallurgy, because it is selective and has a high oxidation capacity [9,10]. Moreover, the formed nitrogen gases can be regenerated back to nitric acid again [11]. On the other hand, oxalic acid is a more effective leaching agent for magnetite compared with nitric acid [12], but the use of oxalic acid can lead to undesired precipitation problems in full-scale operations. Oxalic acid, however, can improve the dissolution rate and solubility level of iron oxides in sulfuric acid [13,14,15]. Therefore, it is hypothesized that the addition of oxalic acid to nitric acid can contribute to faster processing.
The main aim of this paper is to investigate the thermodynamics and kinetics of magnetite and hematite dissolution in mixtures of oxalic and nitric acid to investigate the hypothesis presented above. The experimental part is carried out to respond to the following research questions: (1) Can the rate of dissolution of magnetite and hematite be accelerated by adding oxalic acid into nitric acid? (2) Can the dissolution mechanisms be identified in different acid systems using the existing kinetic models assisted with characterization of the solid particles?
2. Theory
2.1. Dissolution of Iron Oxides in Oxalic Acid
The whole reaction scheme for both magnetite and hematite dissolved in oxalic acid is presented in Equations (1)–(14). Dissociation of oxalic acid is the first step in the reaction scheme. Oxalic acid is a diprotic acid with two dissociation reactions, as shown in Equations (1) and (2) [16,17].
The dissociation constants are K1 = 5 × 10⁻² mol/L and K2 = 5 × 10⁻⁵ mol/L. Panias et al. [18] reconstructed the dependence of dissociated fractions of HC2O4− and C2O42− on the solution pH and found that HC2O4− is more favorable in highly acidic conditions (pH < 1).
Dissolution of magnetite in oxalic acid begins when a proton is adsorbed onto the solid surface, after which oxalate groups replace the OH groups on the solid surface, according to Equation (3) [19].
where the “>” symbol describes the solid surface and III is the oxidation state of iron in the solid phase.
Secondly, an Fe(III)–oxalate complex is dissolved during the slow induction period (Equation (4)).
where “…” is the adsorbed species on the solid surface and 3+ is the oxidation state of iron in the liquid phase.
As magnetite includes Fe(II) ions on the solid surface, the concentration of Fe2+ increases in the solution and once the critical quantity is achieved, the dissolution is accelerated by reductive dissolution (Equations (5) and (6)).
Either Equation (5) or (6) controls the rate of dissolution. If Fe2+ is initially added or present in the solution, then the induction period (Equation (4)) vanishes, and Equations (5) and (6) take place directly.
In the case of hematite, the dissolution begins with the adsorption of a proton onto the solid surface generating the active OH centers for dissolution, Equation (7), after which the ligand, denoted with L, is adsorbed onto these active centers, as in Equation (8) [20].
After this, the dissolution is described as a reductive dissolution process, which includes a slow induction period, during which the electron transfer takes place (Equation (9)) and the Fe2+ is detached from the solid surface, as in Equation (10).
Ferrous ions accelerate the dissolution and shifts the reaction towards an autocatalytic process (Equations (11)–(14)). The rate-controlling steps can be the ligand adsorption or electron transfer reaction.
Very often, the dissolution of hematite is described with these basic steps (Equations (7)–(14)), but Lee et al. [21], Salmimies et al. [14], and Vehmaanperä et al. [22], for example, have observed the formation of humboldtine precipitate during the dissolution of hematite in pure oxalic acid (Equation (15)).
Vehmaanperä et al. [22] showed that oxalate adsorption was stronger than bioxalate, suggesting that the ligand is an oxalate ion. The DFT calculations show that oxalate is oxidized, but the electron transfer reaction (Equation (9)) is not very significant, and the oxalate electron is shared by the whole hematite slab instead of reducing a particular iron on the surface. After the breakage of the C-C bond, reduction of Fe(III) to Fe(II) takes place by the C2O42−→2CO2 reaction and the remaining oxalate reacts with surface Fe(II) to form humboldtine (Equation (15)). The adsorption process alone does not lead to the surface reduction, but the adsorbed oxalate C-C bond has the key role in reducing Fe(III) to Fe(II).
2.2. Dissolution of Iron Oxides in Nitric Acid
Even though nitric acid can be used in several hydrometallurgical processes, i.e., leaching of electric arc furnace dust [23] or regeneration of ceramic filter medium [6], very detailed reaction mechanisms cannot be found in the literature; hence, some assumptions have to be made. The first assumption is that the dissolution in nitric acid systems begins with the dissociation of nitric acid. Nitric acid is a strong acid that dissociates almost completely in water according to Equation (16), and thus the assumption seems logical.
The dissociation constant is Ka = 4.36·101 mol/L [24]. The second assumption is, based on Stumm and Furrer [25], that nitrate is a non-complexing anion, leading up to the conclusion that iron oxides dissolve via the protonation mechanism in nitric acid. First, a proton is adsorbed onto the OH group on the solid surface, which changes the surface FeOHOH2 pair into a positively charged Fe(OH2)2+ group. Second, two more protons per Fe are adsorbed onto the OH group on the iron oxide surface, which leads to the detachment of Fe. The detachment step controls the rate of reaction as it requires the highest activation energy [18]. The overall dissolution reaction is summarized in Equation (17) for magnetite and in Equation (18) for hematite.
In addition, Ma et al. [26] have suggested that dissolution of magnetite in nitric acid could be a dissolution–oxidation–precipitation reaction. This mechanism contains three steps, where the first step is the dissolution of magnetite according to Equation (17), the second step the oxidation of Fe2+ to Fe3+, shown in Equation (19), and the third step is the precipitation of Fe3+ ions to solid hematite, shown in Equation (20).
If the reaction steps shown in Equations (19) and (20) proceed, the consumption of nitrates, formation of nitric oxide gas, and/or possible precipitation of solid hematite should be observed. On the other hand, Van Weert and Shang [10] pointed out that, based on the Pourbaix diagrams, Fe2+ and NO3− cannot coexist in acidic solutions. Droppert and Shang [27] also noticed that nitric acid has a strong oxidative power, and it can thus oxidate ferrous iron to ferric iron. Therefore, it is assumed that the dissolution of magnetite in nitric acid proceeds through Equations (17) and (19).
The Thermoddem database for the PHREEQC computer program showed that there was no binary interaction between Fe(III) and NO3− ions; therefore, it can be assumed that Fe3+, NO3−, and H+ ions are the only species in hematite–nitric acid system [28]. In this case, the dissolution proceeds though Equation (17).
2.3. Reaction of Oxalic Acid with Nitric Acid
The reaction between oxalic and nitric acid should also be considered in this paper. This reaction can be described by Equation (21) [29]. However, the initial reaction did not take into account the formation of NO2 gas as observed by Mason et al. [29]. Mason et al. suggested that this finding was due to (1) decomposition of nitric acid (Equation (22)), (2) oxidation of NO to NO2, or (3) some other reaction, not yet identified, produced NO2.
2.4. Modelling of Iron Oxide Solubility
Regression modelling offers an additional tool for the evaluation of the effect of different process parameters on dissolution. Statistical analysis methods have previously been used to describe the dissolution kinetics of iron from kaolin [30] and the effect of different variables (temperature and concentration) on the dissolution of manganiferous ores [31]. The simplest model is a pure linear model, but it often fails to explain the data especially for complex reaction systems; therefore, nonlinear interactions can be added to improve the fit. For example, Salmimies et al. [32] have shown that multiple linear regression modeling can successfully be used to describe the dissolution of synthetic and industrial magnetite powders in oxalic acid.
In this paper, the dissolution experiments were carried out in mixtures of oxalic and nitric acid; therefore, the modelling is performed with Scheffé polynomials [33,34]. The Scheffé polynomials are applied to mixtures and, for example, Castro Dantas et al. [35] have successfully planned the experiments of heavy metals extraction by microemulsions. The special cubic model, Equation (23), is one of the commonly applied mixture models:
The term Y is the dependent variable, x1,2,3 are explanatory variables, and βn is the slope coefficient for each explanatory variable. It should be kept in mind that mixture models, e.g., the special cubic model, do not include the constant term β0, because, otherwise, the β parameters become nonestimable [34].
In a statistical hypothesis test, p-value is an important tool in the evaluation of the statistical significance of each variable. The commonly accepted significance level is 5%, meaning that if the p-value is smaller than 0.05, the variable has a statistical significance. The goodness of fit can be evaluated using the coefficient of determination, R2, and the scatter plots of measured and modelled data. Adding terms can improve R2-values, but it does not necessarily improve the predictability of the model.
2.5. Kinetic Modelling
Kinetic modelling is often used for better understanding of the rate-controlling step of the dissolution. Knowledge of the rate-controlling step enables the whole dissolution process to accelerate. Cornell and Schwertmann [5] have collected an extensive summary of models that can describe the dissolution of several different solids. Based on an extensive set of preliminary experiments carried out for this work, the Kabai model [36] was the only one able to describe the kinetics of the studied systems; therefore, only this model is presented here (Equation (24)).
where α is the fraction of dissolved iron (−) at the time t (s), k is the reaction rate constant (s−1), and a is the system specific constant of the model. The dissolution kinetics are diffusion-controlled when a < 1, and are surface-chemical-reaction-controlled when a ≥ 1. The double logarithm may conceal the small scatter in the data; therefore, the evaluation of model suitability shall not be based on only the R2-values: the reconstructed models should be used.
The Kabai model is derived from the Nernst equation, which was able to describe only a limited number of systems; thus, the model was further modified. Weibull [37] introduced it the first time to describe the dissolution of pharmaceuticals. Kabai [36] stated that the constant a describes the dissolution mechanism as well as the rate-controlling step. However, several other studies [14,15,38,39,40] showed that a is not a constant and argued that it describes the point where the dissolution mechanism changes from one mechanism to another [14,15]. It should be kept in mind that the kinetic models presented in the literature are not solely based on dissolution phenomena but include a varying degree of pure mathematics [21,41,42].
3. Materials and Methods
3.1. Chemicals
A solid synthetic magnetite powder (97%, Alfa Aesar) and a synthetic hematite powder (98%, Alfa Aesar) were used in the dissolution experiments. The volumetric particle size distributions of these two powders were measured by a laser diffraction particle size analyzer and are shown in Figure 1. X-ray diffraction analysis (XRD) verified that magnetite and hematite were the only mineralogical phases, whereas scanning electron microscope with X-ray analyzer (SEM-EDS) showed that the concentrations of other impurities, carbon, and sulfur, were below 1%.
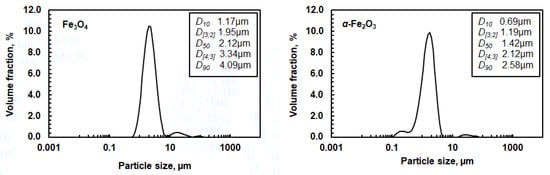
Figure 1.
Volumetric particle size distribution of magnetite and hematite powder. D [3;2] is the Sauter mean diameter and D [4;3] is the volume mean diameter. D10, D50, and D90 values correspond to the size of particles that are 10, 50, or 90% smaller than all the particles in the sample, respectively.
Oxalic acid solutions of 0.33 mol/L were prepared using an oxalic acid dihydrate powder from Merck (99%, Darmstadt, Germany) and 1.30 mol/L nitric acid solutions were prepared using a nitric acid solution from Merck (65%, Darmstadt, Germany). In addition, a strong, concentrated hydrochloric acid (37%, Darmstadt, Germany) was used for further preparing a 16 wt% HCl solution for sample dilutions and storage. Nitric acid has previously been used to store samples but could not be used here because nitrate concentrations during dissolution were also analyzed. All solutions were prepared using pure water (Merck Millipore). The concentrations were chosen to yield comparative results with the previous studies of the authors [12,14,15,22].
3.2. Analysis
All analyses were carried out at the temperature of 22 °C. The laser diffraction particle size analyzer (Mastersizer 3000, Hydro EV unit, Malvern, WR14 1XZ, United Kingdom) was used for analyzing the particle size distribution of solid powders. X-ray diffraction (XRD, Bruker D8 Focus, Karlsruhe, Germany) with a CuKα radiation was used to verify the mineralogical phase, whereas a Zeiss scanning electron microscope with X-ray analyzer (SEM-EDS, Madison, WI, USA) was used to verify the chemical composition. The pH was measured continuously from a reactor by Mettler Toledo FE20/FG2 m with a LE438 electrode. The concentration of total dissolved Fe was analyzed by a flame AAS (Thermo Scientific iCE3000 Atomic Absorption spectrometer, China), where the samples were diluted further with 14 wt% HNO3 to meet the calibration range (0 to 7 mg/L). The concentrations of oxalate and nitrate ions were measured using ion chromatography (IC, Thermo Scientific Dionex ICS-1100, CA, USA) in a pure water matrix. The pure water did not cause any solid precipitation in the samples.
3.3. Dissolution Experiments
The experiments were carried out using a similar setup as in previous studies of the authors [14,15,22,43]. The experiments were carried out in a jacketed reactor of 1 L volume with an inner diameter of 9.5 cm. The vessel included a heating and cooling mantel, which was connected to a Lauda proline RP855 thermostat to control the temperature. A pitched-blade turbine with a diameter of 4.4 cm and four baffles with a diameter of 1 cm yielded mixing conditions. First, the solution was thermostated to the desired temperature and a blank sample was drawn. Second, the dissolution experiment was started by adding the magnetite or hematite into the reactor and commencing the mixing. Mixing speed was 800 rpm in all experiments, as the previous studies showed [43]. Samples were collected from the liquid phase with a syringe, filtered through a 0.45 µm syringe filter, and diluted ten times with 16 wt% HCl to avoid unwanted precipitation in the samples.
The mass of solids varied between the thermodynamic and kinetic experiments. In the thermodynamic experiments, the aim was to reach the equilibrium solubility; therefore, excessive solids of 40 g/L were used. Complete dissolution was expected in kinetic experiments; hence, the pulp density used was 12 g/L. The data for the kinetic experiments showed both complete and incomplete dissolution.
Dissolution experiments were carried out by varying the volumetric ratio between 0.33 mol/L oxalic and 1.30 mol/L nitric acids. The studied ratios (Ox/HNO3) were 0/100, 30/70, 50/50, 70/30, and 100/0. In the thermodynamic experiments, all the acid ratios were studied at 50 °C (5 experiments for both magnetite and hematite) and 3 acid ratios, 0/100, 50/50, and 100/0, were studied at 35 °C. Additionally, 50/50 was studied at 15 °C. The kinetic experiments were carried out with all acid ratios at 35 °C (5 experiments for both magnetite and hematite). For additional clarification, Table 1 shows the corresponding concentrations of oxalic and nitric acid in different systems. The experimental error, ± 2%, was determined by repeating the thermodynamic experiment with the acid mixture of 50/50 at 50 °C, three times.

Table 1.
Corresponding oxalic and nitric acid concentrations in different acid systems.
4. Results and Discussion
4.1. Effect of Acid System and Reaction Temperature on Solubility
The data from the thermodynamic experiments is shown in Figure 2A,B for magnetite and in Figure 2C,D for hematite. The solubility of magnetite varied from 10,000 mg/L to 20,000 mg/L, whereas the solubility of hematite exhibited slightly lower values from 10,000 mg/L to 16,000 mg/L.
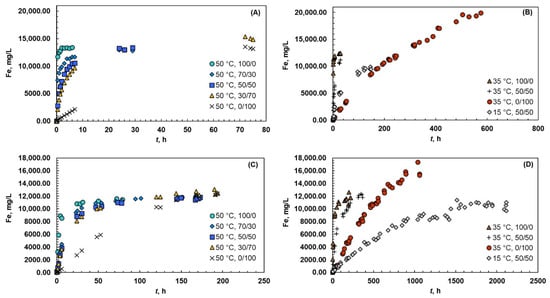
Figure 2.
Solubility of iron at 15, 35, and 50 °C and different acid systems (Ox/HNO3). The experiments were carried out with magnetite (A,B) and hematite (C,D).
The temperature had a positive effect on the kinetics when magnetite was dissolved in acid mixture of 50/50; the kinetics was accelerated, and the solubility increased from 10,000 mg/L to 13,500 mg/L when the temperature increased from 15 °C to 50 °C. This finding is in the line with the previous study of Salmimies et al. [14], where magnetite was dissolved in a 50/50 (Ox/H2SO4) mixture. When magnetite was dissolved in pure oxalic acid, the temperatures of 35 °C and 50 °C resulted in only a 10% difference in solubility levels. However, the higher temperatures increased the rate of dissolution, because the higher temperature favored the formation of Fe2+ ions in the solution, which in turn results in the increased rate of dissolution. Additionally, Taxiarchou et al. [44] found that the temperature had a significant effect on the rate of dissolution when dissolving magnetite in acidic oxalate solutions. They also noticed that the shape of the dissolution curve varied at different temperatures and, for example, the concave shape of the curve at 30 °C indicated the autocatalytic dissolution of magnetite. Interestingly, the temperature had an opposite effect on the solubility level in pure nitric acid than in pure oxalic acid, where the highest iron concentration was achieved at 35 °C, whereas the concentration was lower at 50 °C. Increase in temperature can favor unwanted side reactions (e.g., in the case of magnetite, shown in Equation (18)), which can inhibit the dissolution of iron.
In the case of hematite, increase in temperature from 15 °C to 50 °C increased the rate of dissolution, whereas the solubility level was roughly same in pure oxalic acid and in acid mixture of 50/50. Even though the equilibrium solubility did not change remarkably, the experimental time was significantly influenced by the temperature. In pure oxalic acid, the time required to reach equilibrium solubility was 100 h at 50 °C and 200 h at 35 °C. The experimental times were roughly 50% longer in acid mixture of 50/50, 150 h at 50 °C and 300 h at 35 °C. On the other hand, the temperature of 15 °C differed significantly, where the experimental time was 1500 h. As it was already observed with magnetite, the higher temperature of 50 °C resulted in lower solubility than at 35 °C in pure nitric acid. Additionally, the Thermoddem database for the PHREEQC computer program showed similar results. Sasaki et al. [45] observed that higher temperature resulted in lower solubility when dissolving goethite in sulfuric acid, whereas a similar finding was made by Liu et al. [46] when dissolving hematite in sulfuric acid. Liu et al. [46] did not, however, discuss the reason for this finding. The same conclusion as that with magnetite is valid here: the higher temperature promoted unwanted side reactions. One reason could be that increasing temperature introduces more heat into the system, and the system would balance to the excess heat energy by inhibiting the dissolution of iron in nitric acid. This phenomenon is surely of interest for future investigations.
With a closer look of different oxalic and nitric acid mixtures at 50 °C, higher amount of oxalic acid in the system had a positive effect on the dissolution rate. The solubility of magnetite and hematite was roughly the same, but the required dissolution time decreased when the amount of oxalic acid increased from 30% to 100%. In the case of magnetite, the decrease was from 75 h to 1 h, and in the case of hematite, the decrease was from 200 h to 100 h. Taxiarchou et al. [43] have also noticed that the concentration of oxalic acid (0.1–0.3 M) in the system did not influence the solubility level when dissolving magnetite in oxalic acid. Higher amounts of oxalic acid in the system can facilitate the precipitation of iron oxalate, hence inhibiting the dissolution. A study by Lee [47] showed that an increase in oxalic acid concentration from 0.037 mol/L to 0.112 mol/L increased the rate of dissolution. However, the dissolution did not proceed to an equilibrium solubility; hence, an extensive comparison cannot be carried out. Considering only the kinetics aspect, the findings of our study are in line with Lee’s findings [47]; a higher amount of oxalic acid in a system accelerates the dissolution.
Magnetite dissolved roughly ten times faster than hematite in systems containing oxalic acid. The reason can be found in the nature of the two solids and the dissolution mechanisms, which are expected to be complex formation and reductive dissolution. Magnetite naturally contains Fe(II) on its lattice, that can be directly liberated to the solution accelerating the dissolution. The reduction of Fe(III) into Fe(II) is not required, unlike in the case of hematite, that does not contain readily available Fe(II). Panias et al. [20] have also found that Fe2+ ions accelerated the dissolution. With a closer look of the systems containing only nitric acid, the finding is in line with the original assumption of the dissolution mechanism: the dissolution in nitric acid is expected to proceed via protonation.
4.2. Behavior of pH during the Experiments
Even though the pH of the solution was not adjusted during the experiments, it was monitored over the whole reaction time. The initial pH varied between 0 and 1 depending on the temperature and on the acid system; the pH was higher with higher amount of oxalic acid in the system and higher temperatures and close to 0 in pure nitric acid. The behavior of pH was similar for magnetite and hematite. An illustrative example is shown in Figure 3 for magnetite and hematite. In all cases, the shape of the t–pH curve followed the shape of the dissolution curve and reached a steady level at the end of the dissolution reaction. This finding indicates that pH can be a preliminary tool in the evaluation of the extent of dissolution. The change in pH, however, does not provide direct information about the dissolution mechanism, as the pH behaved similarly in both acids and the dissolution mechanisms are most probably different in oxalic and nitric acid. The dissolution in oxalic acid is expected to proceed via complex formation and reductive dissolution, whereas in the nitric acid it is expected to proceed via protonation. It is worth noting that the pH values were rather low in all cases, leaving the changes in the pH difficult to observe and increasing the experimental error.
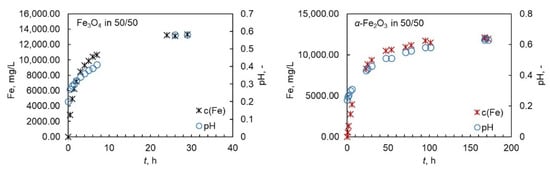
Figure 3.
An illustrative example of behaviour of pH during the dissolution of magntite and hematite in Ox/HNO3 system at 50 °C.
4.3. Statistical Analysis of Thermodynamic Data
The aim here was to statistically investigate the effect of process parameters on the solubility of magnetite and hematite. The data analysis tools of Excel were used to generate the regression models describing the effect of temperature and acid concentrations on the solubility of iron. The data used for modelling was the concentration of iron in the final stages of dissolution found during the thermodynamic experiments (response), temperature (variable), and the initial oxalic and nitric acid concentrations (variables). At first, linear regression models were tested for both magnetite and hematite, because Salmimies et al. [32] previously showed that the data could be described with these models. In the case of pure linear model, the R2-values were low in all cases, 0.33–0.70, and the modelled data varied up to 17% from the measured values. The interaction and quadratic terms were also included in the model, but the fits did not improve significantly (up to 0.76). Moreover, the concentration of oxalic acid was considered only in one interaction term. The relatively poor R2 values mean that the dissolution phenomenon cannot be explained with simple statistical models, because there is no linear interaction between the variables. Previously, Salmimies et al. [32] found that the dissolution of synthetic magnetite powder in oxalic acid could be described well with a linear model, whereas industrial magnetite required the full quadratic model. Impurities and competing reactions when dealing with real industrial raw materials might explain why a quadratic model was needed for industrial magnetite. Salmimies et al. [32] carried out the experiments using a single acid system, which might explain the need for more complex models in acid mixtures.
As the multiple linear regression models failed, the special cubic model was generated (Equation (21)). The R2-values were good (0.9988 for magnetite and 0.9997 for hematite). The results for special cubic model Equation (25) for magnetite and Equation (26) for hematite are presented in Figure 4, which illustrates the scatter plots for both solids.
where [Fe] is the concentration of dissolved iron at the equilibrium stage (mg/L), T is the temperature (°C), and [Ox] and [HNO3] are the initial concentration of oxalic and nitric acid (mol/L), respectively. It should be noted that neither of the models contain the interaction term of T∙[Ox] because its coefficient is zero. This finding means that there is no linear interaction between the oxalic acid concentration and temperature.
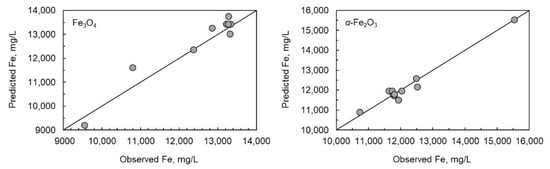
Figure 4.
Scatter plots of measured and modelled Fe concentration for magnetite and hematite dissolved in different oxalic and nitric acid systems.
The observed and modelled data suggested an excellent prediction of equilibrium solubility of iron. The relative error between the modelled and observed values was less than 8% for magnetite, whereas the relative error was less than 4% for hematite. Based on the p-values listed in Table 2, there was a slight difference in the statistical significance of variables between magnetite and hematite. In the case of magnetite, the temperature, oxalic acid concentration, and the interaction term of T∙[HNO3] did not have statistical significance (p < 0.05) for the solubility of iron, whereas in the case of hematite, temperature alone was the only variable that did not have statistical significance. The interaction terms have a strong statistical significance; therefore, the impact of individual variables should not be evaluated very precisely.
Table 2.
p-values of each variable in linear model with interaction terms.
In addition to the equilibrium iron solubility, the effect of temperature and acid concentration on the solubility level is investigated. The equilibrium concentration is calculated based on the models in Equations (25) and (26), and the influence of studied parameters is illustrated. Surface plots for magnetite, Figure 5A–C, and for hematite, Figure 5D,E, are shown to illustrate the effect of different variables at fixed oxalic acid concentration, nitric acid concentration, and temperature. As can be seen from Figure 5, the highest equilibrium iron concentration can be achieved with high nitric acid concentration at moderate temperature with low oxalic acid concentration. This finding is similar for both solids. Purely statistical models, however, do not consider the kinetic aspect or possible solid product precipitation. For example, the experimental time is an important topic to keep in mind when evaluating the dissolution process from an economic point of view, as the experimental time can be significantly longer in a pure nitric acid system, bypassing the positive effect of high iron content (Section 4.1).
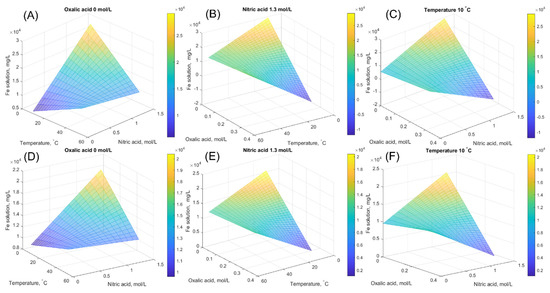
Figure 5.
Surface plots of equilibrium iron concentration calculated by the developed model at fixed oxalic acid concentration, at fixed nitric acid concentration, and at fixed temperature. (A–C) are for magnetite and (D–F) are for hematite.
4.4. Kinetics of Dissolution
The fraction of iron dissolved from magnetite and hematite during the kinetic experiments are shown in Figure 6. The shape of the dissolution curve varied depending on the acid system. In pure oxalic acid, a clear sigmoidal trend indicating an induction step can be seen in the case of magnetite and hematite (Figure 6A,B). This induction step was shorter when the amount of nitric acid increased (Figure 6C–J). In pure nitric acid systems (Figure 6I,J), the dissolution showed almost a linear trend, i.e., the rate of reaction was stable during the whole process and no accelerating effect of nitrate ions (NO3−) could be seen. The linear shape indicates that the dissolution proceeded via protonation, which confirms the initial hypothesis made on the reaction mechanism.
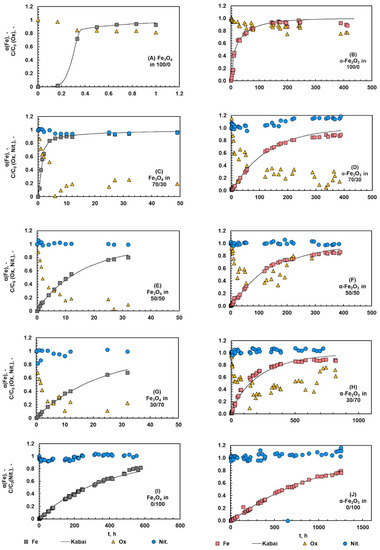
Figure 6.
Fraction of dissolved iron and the normalized oxalate and nitrate ion concentrations during the dissolution of magnetite (A,C,E,G,I) and hematite (B,D,F,H,J) in different Ox/HNO3 systems. The temperature was 35 °C.
To have a closer look at the role of anions, the normalized concentration of oxalate and nitrate ions is presented in the same figures. The normalization was carried out by dividing the measured ion concentration by the measured initial concentration for two different acids to be compared. The main findings can be clearly pointed out: a systematic decrease in oxalate concentration can be seen in pure oxalic acid, whereas no remarkable changes can be seen in nitrate concentrations, either in the pure nitric acid or the acid mixtures. The decrease in oxalate concentration indicates the dissolution proceeding via complexation and the solid product formation, both of which consumed oxalate ions. The color of the solid phase changed from black magnetite or red hematite to the yellowish solid, which clearly indicated similar solid product formation as observed by Salmimies et al. [14] and Vehmaanperä et al. [22]. The concentration of nitrate did not appear to change during the dissolution that supports the initial assumption of the dissolution mechanism, protonation. In the case of magnetite, the reaction scheme and the literature indicated that nitrates would oxidize Fe2+ to Fe3+, but here the concentration of nitrates remained rather stable over the whole reaction time. The initial concentration of nitrate was rather high, at 80 g/L; therefore, the samples required several dilutions, and these dilutions may mask small changes in the nitrate concentration. Additional analysis supported that iron was present in the solution only as Fe3+; therefore, the reaction step shown in Equation (18) took place. The solid phase was further characterized after the dissolution and the discussion can be found in Section 4.5.
As can be seen, the amount of oxalic acid in the system had a significant effect on the dissolution kinetics: the higher the amount of oxalic acid in the system, the more accelerated the dissolution of magnetite and hematite. In pure oxalic acid systems, a systematic decrease can be seen in the normalized oxalate ion concentration, which can be explained by two reactions consuming oxalates: (1) complexation followed by reductive dissolution, and (2) the formation of a solid iron oxalate. This finding is line with the previous work of the authors [22]. The formation of a solid product is discussed in Section 4.5. In acid mixtures, the decrease in oxalate concentration can also be explained with the reaction between oxalic and nitric acid (Equation (21), which consumes oxalates, but does not form the solid iron oxalate product).
The data from the kinetic experiments was analyzed by the Kabai model, introduced in Section 2.4. As can be seen from Figure 6, the reconstructed Kabai model described the data of magnetite and hematite dissolution in different acid systems well. The reconstructed Kabai model represents a case where two linear fits yield better results than one linear fit. Table 3 summarizes the rate-controlling steps and the parameters of the Kabai model. In pure oxalic acid, two different linear fits were required for both magnetite and hematite, where dissolution was first controlled with the rate of the chemical reaction, after which the dissolution changed to become diffusion-controlled. Most likely, the chemical reaction is the formation of ferrous ions in the solution and the formation of the solid product layer. Once a sufficient number of ferrous ions was formed, the dissolution was shifted to the diffusion-controlled dissolution, where oxalic acid diffused through the solid product layer formed during the reaction. For example, Martínez-Luévanos et al. [48] found out that the dissolution of kaolin was diffusion-controlled. Lee et al. [21] dissolved hematite in oxalic acid and found also that the dissolution was diffusion-controlled and that a solid product phase, FeC2O4, was formed in the system containing 0.21 M oxalic acid.
Table 3.
Parameters of the Kabai model for different acid ratios. I represents the first linear fit, whereas II represents the second linear fit. The experiments were carried out at 35 °C.
Again, as Salmimies et al. [13] showed, the solid specific constant a varied depending on the acid system, which is argued to describe the changes in the dissolution mechanism. After several contradictory findings against Kabai [36], it can be stated that a is not a solid specific constant; however, it can describe the point when one dissolution mechanism changes to another. No other model summarized by Cornell and Schwertmann [5] could be adequately fitted with the data. Kabai [36] did not use oxalic acid in the experiments and did not account for the possibility of a solid product forming. For example, Salmimies et al. [14] observed humboldtine formation when dissolving magnetite in oxalic acid, and Vehmaanperä et al. [22] observed humboldtine formation when dissolving hematite in oxalic acid.
As it was observed during the thermodynamic experiments, the dissolution rate of magnetite was faster than the dissolution rate of hematite. This finding can again be explained with the nature of the two solids. Magnetite contains both Fe(II) and Fe(III) ions on the solid surface. The Fe(II)-O bond is kinetically less stable than the Fe(III)-O bond because of the differences in the ionic radius of the iron atom. The ionic radius of Fe(II) is 0.74 Å, meaning that the Fe(II)-O bond is longer and therefore weaker than the Fe(III)-O bond (the ionic radius of Fe(III) is 0.64 Å) [49]. Hematite contains only shorter and more stable Fe(III)-O bonds. The dissolution of magnetite and hematite requires the breaking of the Fe-O bonds, indicating the faster dissolution of the oxides containing weaker Fe-O bonds. Moreover, magnetite contains Fe2+ ions, which, when liberated into the solution, accelerate the rate of dissolution. Additionally, Sidhu et al. [48] observed that magnetite dissolved faster than hematite in hydrochloric acid.
4.5. Solid Phase after Dissolution
The residual solids were analyzed using XRD patterns shown in Figure 7 with SEM figures and SEM-EDS data. Figure 8 shows SEM figures for magnetite and Figure 9 shows SEM figures for hematite. XRD patterns and SEM-EDS analysis were in good agreement with pure magnetite and hematite, except in the pure oxalic acid systems where the yellowish-colored solid phase was identified to be iron oxalate dihydrate, known also as humboldtine.
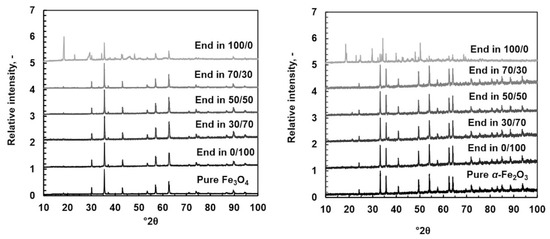
Figure 7.
XRD patterns for original powder and dissolved in different (Ox/HNO3) systems at 35 °C. Original powder: magnetite on the left and hematite on the right.
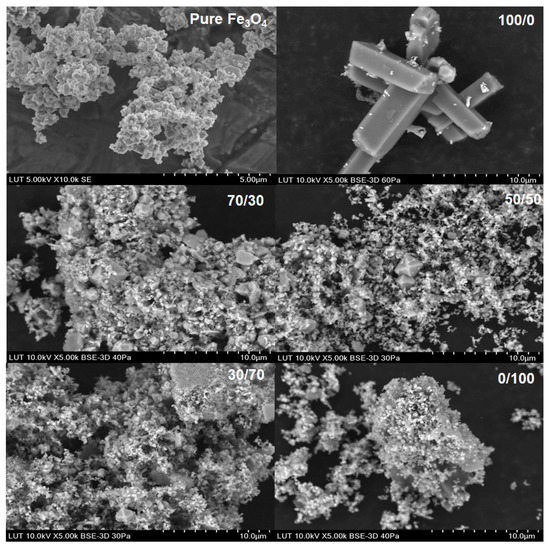
Figure 8.
SEM images for the original Fe3O4 powder dissolved in different acid systems (Ox/HNO3).
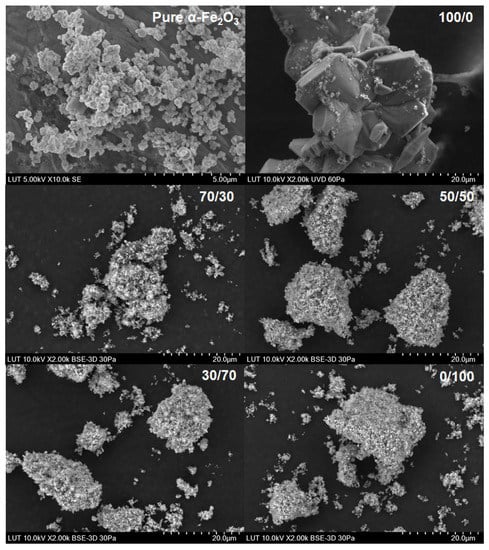
Figure 9.
SEM images for the original α-Fe2O3 powder dissolved in different Ox/HNO3 systems.
The SEM images showed a clear difference compared with the original solid powder only in the case of pure oxalic acid, where relatively large regularly shaped crystals can be seen. The shape of crystals was different in magnetite and hematite origins even though the XRD data showed humboldtine for both cases. Different crystal shapes indicate that different solid origin resulted in different crystallography of humboldtine. For example, Zhang et al. [50] showed that humboldtine can crystallize in different forms, such as α-FeC2O4, β-FeC2O4, or phase transformation of α@β-FeC2O4. The α-FeC2O4 forms were polygonal prism-shaped, the β-FeC2O4 forms were sub-micrometer-sized lamellar plates, and α@β-FeC2O4 had mixed shapes. In addition, it seemed that the small particles were attached onto the surface of the large crystals. These small crystals might be from the original solid powder, since the shape and size of the original sample solids were similar to these small particles after the dissolution in oxalic acid. The SEM images for all other systems showed the same phenomenon: the solids seem to form very large aggregates. Based on the SEM figures, a specific direction of dissolution cannot be confirmed. The previous paper [22] showed that DFT calculations would help to deepen the understanding of the dissolution direction and the steps leading to the solid formation, but those are not in the scope of this paper. The solids formation, however, influenced the observed equilibrium solubilities of iron (in Section 4.1 and Section 4.4).
The kinetic data, the SEM images, and the XRD patterns for pure oxalic acid strongly supported solid product formation, which justifies the existence of a solid formation step (Equation (15)) in the reaction scheme. The pH of the solution was below 1 during all the dissolution experiments, which indicated that the species in the solution should be undissociated oxalic acid and HC2O4− [20]. The DFT calculations in the previous study [22] and the IC measurements in this paper showed that there were oxalate ions in the solution; therefore, the reaction shown in Equation (15) can take place. The pH was measured from the bulk slurry, so the pH at the solid–liquid interface might be higher than 1 and favor the formation of oxalate ions in the solution. To investigate the humboldtine formation kinetics, a separate set of experiments focusing only on the solid humboldtine phase combined with DFT calculations should be carried out.
5. Conclusions
The dissolution of magnetite and hematite in mixtures of oxalic and nitric acid was studied to address both reaction mechanisms and kinetics. The thermodynamic studies were carried out at 15 °C, 35 °C, and 50 °C, whereas the kinetic experiments were carried out only at 35 °C.
The results show that oxalic acid as part of the overall acid system has a profound effect on the kinetics; however, increasing the quantity of acid in the system does not automatically result in higher solubility. The nitric acid concentration plays a significant role in the dissolution process, whereas the quantity of oxalic acid only has a minor effect. The increase in temperature from 35 °C to 50 °C did not automatically result in higher solubilities; however, lower temperature leads to lower energy demand and consequent operational costs. The effect of operational parameters on the solubility of iron can also be described with the special cubic models, which is an advantage in the design of subsequent experiments. The experimental models make it easier for practitioners to find optimal parameters without laborious and long-lasting dissolution test series. The modeling results also show that the reactions are much more complex for acid mixtures than for individual acid systems. In addition, the results show that the oxalate and nitrate concentrations do not provide information about the dissolution mechanism itself. However, pH might be a useful enough tool to monitor the extent of a reaction, even though it does not provide direct information about the dissolution mechanism.
In pure oxalic acid, the formation of a solid product, Fe(II)C2O4·2H2O, inhibited the dissolution of both magnetite and hematite. However, the inhibiting effect was overcome by adding nitric acid into oxalic acid, because the formation of a solid product does not take place in systems containing nitric acid. These findings are important for practitioners as it shows how them to avoid unwanted solid formation, which is a potential drawback in an industrial process. On the other hand, humboldtine itself can be an interesting material as it can be used as an anode material in battery production.
With a closer look at dissolution mechanisms, the dissolution of magnetite and hematite in nitric acid proceeds via slow protonation, whereas complex formation and reductive dissolution are the main operative mechanisms in the systems containing oxalic acid. In pure oxalic acid, the solid product formation should also be added to the reaction scheme. In addition, this study shows that the constant, a, of the Kabai model describes the rate-controlling step of dissolution and the point where the dissolution mechanism changes from one mechanism to another. The original study of Kabai does not consider the possibility of solid product formation, which is shown to be the case in our study.
Author Contributions
Conceptualization, P.V.; data curation, P.V.; formal analysis, P.V.; funding acquisition, A.H.; investigation, P.V.; methodology, P.V. and R.S.; project administration, A.H.; resources, A.H.; software, P.V. and T.S.; supervision, R.S. and A.H.; validation, P.V., T.S. and R.S.; visualization, P.V. and T.S.; writing—original draft preparation, P.V.; writing—review and editing, P.V. and R.S. All authors have read and agreed to the published version of the manuscript.
Funding
This research received no external funding.
Acknowledgments
The authors would like to acknowledge Joonas Liikanen for his contribution in the experimental part.
Conflicts of Interest
The authors declare no conflict of interest.
References
- Lu, Y.; Wang, W.; Xu, J.; Ding, J.; Wang, Q.; Wang, A. Solid-phase oxalic acid leaching of natural red palygorskite-rich clay: A solvent-free way to change color and properties. Appl. Clay Sci. 2020, 198, 105848. [Google Scholar] [CrossRef]
- Tanvar, H.; Mishra, B. Hydrometallurgical recycling of red mud to produce materials for industrial applications: Alkali separation, iron leaching and extraction. Metall. Mater. Trans. B 2021, 52B, 3543–3557. [Google Scholar] [CrossRef]
- Turan, M.D.; Sarı, Z.A.; Erdemoğlu, M. Copper enrichment in solid with selective reverse leaching with oxalic acid. J. Sustain. Metall. 2020, 6, 428–436. [Google Scholar] [CrossRef]
- Yang, C.-Q.; Li, S.-Q. Kinetics of iron removal from quartz under ultrasound-assisted leaching. High Temp. Mater. Process. 2020, 39, 395–404. [Google Scholar] [CrossRef]
- Cornell, R.M.; Schwertmann, U. The Iron Oxides, 2nd ed.; Wiley-VHC: Weinheim, Germany, 2003. [Google Scholar]
- Smith, J.; Sheridan, C.; van Dyk, L.; Naik, S.; Plint, N.; Turrer, H.D.G. Optimal ceramic filtration operating conditions for an iron ore concentrate. Miner. Eng. 2018, 115, 1–3. [Google Scholar] [CrossRef]
- Kim, H.R.; Park, J.K.; Lee, S.I.; Oh, W.; Kim, J.; Kim, C.; Lee, B.-C. Kinetics of Reductive Dissolution of a Magnetite Specimen Using Oxalic Acid. Processes 2022, 10, 696. [Google Scholar] [CrossRef]
- Markus, H.; Fugleberg, S.; Valtakari, D.; Salmi, T.; Murzin, D.Y.; Lahtinen, M. Reduction of ferric to ferrous with sphalerite concentrate, kinetic modelling. Hydrometallurgy 2004, 73, 269–282. [Google Scholar] [CrossRef]
- Prater, J.D.; Queneau, P.B.; Hudson, T.J. Nitric acid route to processing copper concentrates. Transactions 1973, 254, 117–122. [Google Scholar]
- Van Weert, G.; Shang, Y. Iron control in nitrate hydrometallurgy by (auto) decomposition of iron (II) nitrate. Hydrometallurgy 1993, 33, 255–271. [Google Scholar] [CrossRef]
- Bas, A.D.; Devaci, H.; Yazici, E.Y. Treatment of manufacturing scrap TV boards by nitric acid leaching. Sep. Purif. Technol. 2014, 130, 151–159. [Google Scholar] [CrossRef]
- Salmimies, R.; Mannila, M.; Kallas, J.; Häkkinen, A. Acidic dissolution of magnetite: Experimental study on the effects of acid concentration and temperature. Clays Clay Miner. 2011, 59, 136–146. [Google Scholar] [CrossRef]
- Ambikadevi, V.R.; Lalithambika, M. Effect of organic acids on ferric iron removal from iron-stained kaolinite. Appl. Clay Sci. 2000, 16, 133–145. [Google Scholar] [CrossRef]
- Salmimies, R.; Vehmaanperä, P.; Häkkinen, A. Acidic dissolution of magnetite in mixtures of oxalic and sulfuric acid. Hydrometallurgy 2016, 163, 91–98. [Google Scholar] [CrossRef]
- Vehmaanperä, P.; Salmimies, R.; Häkkinen, A. Thermodynamic and kinetic studies of dissolution of hematite in mixtures of oxalic and sulfuric acid. Mining Metall. Explor. 2021, 38, 69–80. [Google Scholar] [CrossRef]
- Pimienta, V.; Lavabre, D.; Levy, G.; Micheau, J.C. Kinetic Modeling of the KMNO4/H2C2O4/H2SO4 Reaction: Origin of the Bistability in a CSTR. J. Phys. Chem. 1995, 99, 14365–14371. [Google Scholar] [CrossRef]
- Riemenschneider, W.; Tanifuji, M. Oxalic acid. In Ullmann’s Encyclopedia of Industrial Chemistry. Electronic Release; Organic Chemicals; Wiley-VHC: Weinheim, Germany, 2012; pp. 529–549. [Google Scholar]
- Panias, D.; Taxiarchou, M.; Douni, I.; Paspaliaris, I.; Kontopoulos, A. Thermodynamic analysis of the reactions of iron oxides: Dissolution in oxalic acid. Can. Metall. Q. 1996, 35, 363–373. [Google Scholar] [CrossRef]
- Baumgartner, E.; Blesa, M.A.; Marinovich, H.; Maroto, A.J.G. Heterogeneous electron transfer as a pathway in the dissolution of magnetite in oxalic acid solutions. Inorg. Chem. 1993, 22, 2224–2226. [Google Scholar] [CrossRef]
- Panias, D.; Taxiarchou, M.; Paspaliaris, I.; Kontopoulos, A. Mechanisms of dissolution of iron oxides in aqueous oxalic acid solutions. Hydrometallurgy 1996, 42, 257–265. [Google Scholar] [CrossRef]
- Lee, S.O.; Tran, T.; Park, Y.Y.; Kim, S.J.; Kim, M.J. Study on the kinetics of iron oxide leaching by oxalic acid. Int. J. Miner. Process. 2006, 80, 144–152. [Google Scholar] [CrossRef]
- Vehmaanperä, P.; Gong, B.; Sit, P.H.-L.; Salmimies, R.; Barbiellini, B.; Häkkinen, A. Formation of humboldtine during the dissolution of hematite in oxalic acid- Density functional theory (DFT) calculations and experimental verification. Clays Clay Miner. 2021, 69, 655–662. [Google Scholar] [CrossRef]
- Kaya, M.; Hussaini, S.; Kursunoglu, S. Critical review on secondary zinc resources and their recycling technologies. Hydrometallurgy 2018, 195, 105362. [Google Scholar] [CrossRef]
- Gordon, A.J.; Ford, R.A. Chemist’s Companion—A Handbook of Practical Data, Techniques, and References—1.9.3.2 Dissociation Constants of Common Acids in Water; John Wiley & Sons: Hoboken, NJ, USA, 1972; p. 59. [Google Scholar]
- Stumm, W.; Furrer, G. The dissolution of oxides an aluminum silicate: Examples of surface-coordination-controlled kinetics. In Aquatic Surface Chemistry; Stumm, W., Ed.; John Wiley & Sons: New York, NY, USA, 1987; pp. 197–219. [Google Scholar]
- Ma, B.; Wang, C.; Yang, W.; Yang, B.; Zhang, Y. Selective pressure leaching of Fe(II)-rich limonitic laterite ores from Indonesia using nitric acid. Miner. Eng. 2013, 45, 151–158. [Google Scholar] [CrossRef]
- Droppert, D.J.; Shang, Y. The leaching behaviour of nickeliferous pyrrhotite concentrate in hot nitric acid. Hydrometallurgy 1995, 39, 169–182. [Google Scholar] [CrossRef]
- Thermoddem. Thermochemical and Mineralogical Tables for Geochemical Modeling. Available online: http://thermoddem.brgm.fr/databases (accessed on 27 February 2019).
- Mason, C.; Brown, T.L.; Buchanan, D.; Maher, C.J.; Morris, D.; Taylor, R.J. The decomposition of oxalic acid in nitric acid. J. Solut. Chem. 2016, 45, 325–333. [Google Scholar] [CrossRef]
- Volkan, A.; Oktay, B. Removal of Fe from kaolin by chemical leaching and bioleaching. Clays Clay Miner. 2009, 57, 787–794. [Google Scholar]
- Beolchini, F.; Petrangeli Papini, M.; Toro, L.; Trifoni, M.; Vegliò, F. Acid leaching of manganiferous ores by sucrose: Kinetic modelling and related statistical analysis. Miner. Eng. 2001, 14, 175–184. [Google Scholar] [CrossRef]
- Salmimies, R.; Huhtanen, M.; Kallas, J.; Häkkinen, A. The solubility of two magnetite powders in oxalic acid—Applicability of empirical modelling. J. Powder Technol. 2013, 2013, 164239. [Google Scholar] [CrossRef]
- Brown, L.; Donev, A.N.; Bisset, A.C. General blending models for data from mixture experiments. Technometrics 2015, 57, 449–456. [Google Scholar] [CrossRef]
- Sinha, B.K.; Mandl, N.K.; Pal, M.; Das, P. Optimal Mixture Experiments; Springer eBooks: New Delhi, India, 2014. [Google Scholar]
- Castro Dantas, T.N.; Dantos Neto, A.A.; Moura, M.C.P.A.; Barros Neto, E.L.; Forte, K.L.; Leite, R.H.L. Heavy metals extraction by microemulsions. Water Res. 2003, 37, 2709–2717. [Google Scholar] [CrossRef]
- Kabai, J. Determination of specific activation energies of metal oxides and metal oxide hydrates by measurement of the rate of dissolution. Acta Chim. Acad. Sci. Hung. 1973, 78, 57–73. [Google Scholar]
- Weibull, W. A statistical distribution function of wide applicability. J. Appl. Mech. 1951, 18, 293–297. [Google Scholar] [CrossRef]
- Ruan, H.D.; Gilkes, R.J. Acidic dissolution of synthetic aluminous goethite before and after transformation to hematite by heating. Clay Miner. 1995, 30, 55–65. [Google Scholar] [CrossRef]
- Schwertmann, U.; Cambier, P.; Murad, E. 1985. Properties of goethites of varying crystallinity. Clays Clay Miner. 1985, 33, 369–378. [Google Scholar] [CrossRef]
- Schwertmann, U.; Latham, M. Properties of iron oxides in some New Caledonia, oxisoils. Geoderma 1986, 39, 105–123. [Google Scholar] [CrossRef]
- Costa, P.; Lobo, J.M.S. Modeling and comparison of dissolution profiles. Eur. J. Pharm. Sci. 2001, 13, 123–133. [Google Scholar] [CrossRef]
- Khawam, A.; Flanagan, D.R. Solid-State Kinetic Models: Basics and Mathematical Fundamentals. J. Phys. Chem. B 2006, 110, 17315–17328. [Google Scholar] [CrossRef]
- Salmimies, R.; Mannila, M.; Kallas, J.; Häkkinen, A. Acidic dissolution of hematite: Kinetic and thermodynamic investigations with oxalic acid. Int. J. Miner. Process. 2012, 110–111, 121–125. [Google Scholar] [CrossRef]
- Taxiarchou, M.; Panias, D.; Douni, I.; Paspaliaris, I.; Kontopoulos, A. Dissolution of magnetite in acidic oxalate solutions. Miner. Process Ext. Metall. 1998, 107, 37–41. [Google Scholar]
- Sasaki, K.J.; Ootsuka, K.; Tozawa, K. Solubility of goethite into sulphuric acid Solutions from 70 °C to 110 °C. Shigen-To-Sozai 1995, 111, 505–511. [Google Scholar] [CrossRef][Green Version]
- Liu, H.; Papangelakis, V.G.; Alam, M.S.; Singh, G. Solubility of hematite in H2SO4 solutions at 230–270 °C. Can. Metall. Q. 2003, 42, 199–207. [Google Scholar] [CrossRef]
- Lee, S.O. Dissolution of Iron Oxides by Oxalic Acid. Ph.D. Thesis, The University of New South Wales, Sydney, Australia, September 2005. [Google Scholar]
- Martínez-Luévanos, A.; Rodríguez-Delgado, M.G.; Uribe-Salas, A.; Carrillo-Pedroza, F.R.; Osuna-Alarcón, J.G. Leaching kinetics of iron from low grade kaolin by oxalic acid solutions. Appl. Clay Sci. 2011, 51, 473–477. [Google Scholar] [CrossRef]
- Sidhu, P.S.; Gilkes, R.J.; Cornell, R.M.; Posner, A.M.; Quirk, J.P. Dissolution of iron oxides and oxyhydroxides in hydrochloric and perchloric acids. Clays Clay Miner. 1981, 29, 269–276. [Google Scholar] [CrossRef]
- Zhang, K.; Li, Y.; Wang, Y.; Zhao, J.; Chen, X.; Dai, Y.; Yao, Y. Enhanced electrochemical properties of iron oxalate with more stable Li+ ions diffusion channels by controlling polymorphic structure. Chem. Eng. J. 2020, 384, 123281. [Google Scholar] [CrossRef]


Publisher’s Note: MDPI stays neutral with regard to jurisdictional claims in published maps and institutional affiliations. |
© 2022 by the authors. Licensee MDPI, Basel, Switzerland. This article is an open access article distributed under the terms and conditions of the Creative Commons Attribution (CC BY) license (https://creativecommons.org/licenses/by/4.0/).