Article

Effect of Pyrite on the Leaching Kinetics of Pitchblende in the Process of Acid In Situ Leaching of Uranium

1
School of Resource Environment and Safety Engineering, University of South China, Hengyang 421001, China
2
School of Civil Engineering, Hunan City University, Yiyang 413000, China
3
Central South Exploration & Foundation Engineering Co., Ltd., Wuhan 430081, China
*
Author to whom correspondence should be addressed.
Minerals 2022, 12(5), 570; https://doi.org/10.3390/min12050570
Submission received: 16 February 2022 / Revised: 24 April 2022 / Accepted: 27 April 2022 / Published: 30 April 2022
(This article belongs to the Section Mineral Processing and Extractive Metallurgy)

Abstract

:
In the process of acid in situ leaching of sandstone uranium ore, pyrite, which is a common associated mineral of pitchblende, would inevitably participate in the reaction. Therefore, it is important to study the influence of pyrite on the leaching kinetics of pitchblende. In this study, we compared the difference leaching rates of pitchblende in the systems of sulfuric acid–hydrogen peroxide, sulfuric acid–hydrogen peroxide–pyrite and sulfuric acid–pyrite and studied the influence of temperature and pyrite quantity on the leaching rate of pitchblende. The results show that the leaching process of pitchblende follows the shrinking particle model controlled by a chemical reaction, and the apparent activation energy Ea of the leaching reaction is (3.74 ± 0.40) × 10 kJ/mol. Pyrite itself cannot promote the dissolution of pitchblende; however, it can promote the leaching of pitchblende in the presence of an oxidizer. Increasing the quantity of pyrite in a certain range can increase the leaching rate of pitchblende, and the reaction order of pyrite is 0.36.

1. Introduction

Sandstone uranium deposits are of great economic value and strategic significance, and they have been the major object of uranium mining in China nowadays [1], due to their characteristics of shallow burial, large reserves, suitable for in situ leaching and low cost [2,3]. The composition of a sandstone-type uranium ore is complex, including pitchblende (UO2), coffinite (U(SiO4)1−x(OH)4x, (x < 0.5)), ningyoite (Ca2−xUx(PO4)2·nH2O, (x ≤ 1, n = 1, 2)) and autunite (Ca(UO2)(PO4)2·(10–12)H2O). UO2 often occurs in symbiosis with pyrite (FeS2), chalcopyrite (CuFeS2) and marcasite (FeS2), among which pyrite (FeS2) is the most common symbiosis mineral in UO2 deposits [4].
Acid in situ leaching uranium mining is an important uranium mining method, in which the leaching solution is directly injected into the underground ore-bearing strata through drilling, and uranium is obtained by the chemical reaction of the mineral and aqueous solution. Sulfuric acid (H2SO4) is widely used in acid in situ leaching, because it is cheaply priced and has a quick reaction [5,6,7]. In spite of the advantages, such as low production cost and reduced damage to the surface of the ecological environment, a large amount of sulfuric acid injected will reach the underground ore aquifer and cause serious pollution to the groundwater environment. Furthermore, sulfuric acid leaching is a nonselective process resulting in other minerals being dissolved into the groundwater and affects the in situ leaching process. Uranium minerals containing uranyl (e.g., autunite) in the ore-bearing strata can react directly with H2SO4 and dissolve, while only a small part of U(IV) can dissolve in H2SO4 under natural conditions. However, most of the uranium in sandstone uranium deposits is UO2 [8]. The leaching of UO2 first requires oxidizing it into the U(VI) redox state, where it can more readily dissolve, as shown in Equation (1) [9]. Hydrogen peroxide (H2O2) is commonly used as the oxidant [10].
UO2 + H2SO4 + O ⇌ UO2SO4 + H2O
Some research on the effect of iron on the in situ leaching of uranium has been studied. Amme [11] investigated the impact of the reactions between hydrogen peroxide (H2O2) and iron (Fe2+/Fe3+) on UO2 dissolution in an oxygen-free batch reactor. The interaction in the absence of UO2 gave a stoichiometric redox reaction of Fe2+ and H2O2 when the H2O2 and Fe2+ were present in equal concentrations; however, the predomination of H2O2 resulted in the delayed catalytic decomposition of H2O2. With UO2 present, it either dissolved slowly or precipitated as uranium peroxide (UO4·nH2O), depending strongly on the ratio of H2O2 and Fe2+. Zhou et al. [12] studied the kinetics of uranium dissolution and migration under the action of an acidic solution containing Fe3+ and its relationship with Fe3+. They found that the uranium oxidized by Fe3+ migrates from the ore to the solution within 10 h; in addition, the reaction rate of uranium was positively correlated with the transformation rate of Fe2+ and Fe3+. When the transformation rate of Fe3+ to Fe2+ reached zero, the oxidation and dissolution of uranium nearly ceased, and the uranium concentration in the solution achieved an equilibrium. The reaction rate of uranium, v(U), with respect to Fe3+, v(Fe3+), in the solution was shown to follow v(U) = 0.0206 + 0.0429 exp [−v(Fe3+)/5.07]. Filippov [13] studied the manganese dioxide oxidation of UO2 in the absence of iron ions, showing that the redox potential cannot be used as the only standard to judge the oxidation rate, and the real reaction rate depends on the reaction mechanism. After the addition of Fe3+, the dissolution percentage of UO2 and the redox potential rise sharply, which proves that iron ion plays a catalytic role in the process of oxidizing UO2. Kinetics can be interpreted as a tool for investigating the rates of chemical reactions and understanding the ways different processes are affected. The most commonly employed method for analyzing the kinetics of uranium leaching is shrinking particles with the shrinking core model [14,15]. There has been no report on the influence of the FeS2 coexistence in sandstone uranium ore on the leaching of UO2 under the conditions of a strong acid and oxidant in acid in situ leaching mining. Therefore, this study explores the influence of FeS2 on the leaching of U from FeS2 to obtain the basic kinetics of H2SO4.

2. Experiment

2.1. Materials

Both UO2 and FeS2 were powders below 74 μm (passed through a 74-μm sieve) from 272 Uranium Industry Co. Ltd., China National Nuclear Corporation. H2SO4 and H2O2 (30%) were purchased from Hengyang Kaixin Chemical Reagent Co., Ltd (Hengyang, China). The reagents used in the experiment were all analytically pure, and the water used was deionized water.

2.2. Methods

A 250-mL mixed solution of 5 g/L H2SO4 and 0.06 mol/L H2O2 was added into a 500-mL three-neck flask equipped with a condenser and was heated in an electric thermostatic water bath (Shanghai Kuntian, Shanghai, China) to the desired reaction temperature (15–45 ℃). Different amounts of FeS2 (0.1, 0.4, 0.8 and 1.2 g) and 0.2 g UO2 were added to the flask. The supernatant was extracted over a range of leaching times and filtered to obtain a 1-mL solution. The uranium concentration was analyzed by an atomic absorption spectrophotometer (Thermo Fisher, Waltham, America). The total iron and Fe2+ concentrations were analyzed by a UV spectrophotometer (Beifen-Ruili, Beijing, China); the difference between them was the concentration of Fe3+. The Eh value was measured by a redox potentiometer from Mettler (Zurich, Switzerland). Each experiment was repeated twice, and the average value was used.
Equation (2) was used to calculate the leaching rate of UO2,
η = c V m 0 × 100 %
where c is the concentration of U in the solution (mg/L), V is the volume of the solution (mL) and m0 is the initial mass of U in UO2 (mg).

3. Results and Discussion

In the cases of 5 g/L H2SO4, 0.06 mol/L H2O2 and 0.2 g UO2 at 25 °C, the influence of a pyrite addition amount on different systems of H2SO4-H2O2, H2SO4-H2O2-FeS2 was investigated. The concentrations of U and Fe under different FeS2 additions are shown in Figure 1. Without the addition of FeS2, the leaching rate of UO2 was slow. The maximum leaching rate was only 36.88%, with a U concentration of 260.06 mg/L at 360 min. After the addition of 0.1 g FeS2, there was no obvious rate change in the initial stage of the reaction; however, the relative rate of the reaction slowly increased after 120 min compared to that without FeS2, and the final leaching rate was 48.40% with a U concentration of 341.31 mg/L. With further increases of the FeS2 mass, the Fe3+ ion concentration quickly increased, resulting in an increase of the U concentration. When the Fe concentration was less than 5 mg/L, it had no obvious effect on the UO2 leaching. When the Fe concentration reached 5 mg/L, the reaction rate of U was obviously higher than that without Fe. When the Fe concentration was about 20 mg/L, the reaction rate of UO2 reached the maximum. The slope of the U concentration versus time gradually became smaller, indicating that the reaction rate of UO2 gradually slowed down at the end of the experiment, and the final leaching rates of U were 64.79%, 76.34% and 79.58%, corresponding to the FeS2 amounts of 0.4 g, 0.8 g and 1.2 g, respectively.
Figure 2 shows the fitted curves of the uranium leaching rate and the Eh value of the solution at 360 min versus the quantity of FeS2. Generally, the uranium leaching rate increased with the pyrite quantity added; however, the acceleration of the pyrite quantity on the leaching rate became small at 360 min. The Eh value decreased with the increase of pyrite, which may have been caused by the consumption of hydrogen peroxide in the dissolution of pyrite. The decrease of Eh, which was attributed to the decrease in the concentration of H2O2, may be the reason why the slope of the uranium leaching rate curve slowed down at the end of the experiment.

4. Reaction Mechanism

The following reactions may occur in the reaction system [16,17,18,19]:
H2O2 ⇌ •OH + •OH
UO2 + 2•OH+ H2SO4 ⇌ UO22+ + 2H2O + SO42−
FeS2 + 14•OH ⇌ Fe2+ + 2SO42− + 6H2O + 2H+
Fe2+ + •OH + H+ ⇌ Fe3+ + H2O
UO2 + 2Fe3+ ⇌ UO22+ + 2Fe2+
Hydrogen peroxide first dissociates into •OH (Equation (3)) and participates in the reactions. In the absence of FeS2, part of UO2 can be oxidized directly by •OH (Equation (4)). With the addition of FeS2, Fe plays an intermediary role in the leaching of UO2, as shown in Equations (5)–(7). Here, •OH first oxidizes FeS2 into 2SO42− and Fe2+ (Equation (5)) and then Fe2+ to Fe3+ (Equation (6)), which, in turn, oxidizes UO2 into the more soluble uranyl (UO22+) ion (Equation (7)), resulting in U leaching into the surrounding solution. The oxidation of Fe2+ by •OH (Equation (6)) regenerates the Fe3+ ion concentration, enabling the further leaching of U through Equation (7).
To prove the above speculation, we analyzed the FeS2 particles after leaching under the conditions of 5 g/L H2SO4, 0.2 g UO2 and 0.8 g of FeS2 without H2O2 at 25 °C. As we suspected, neither U (VI) nor Fe3+ were observed in the solution without the presence of an oxidizer. It shows that FeS2 itself cannot oxidize UO2. Since FeS2 does not contain any oxygen, it cannot be oxidized directly into another species. The only role of FeS2 in this study was to provide a source of Fe2+ ions (Equation (5)), which oxidize to Fe3+ (Equation (6)) through the reaction with •OH from the decomposition of H2O2 (Equation (3)). FeS2 promotes the leaching of UO2 only in the presence of an oxidizing agent.

5. Apparent Activation Energy and Kinetics Model

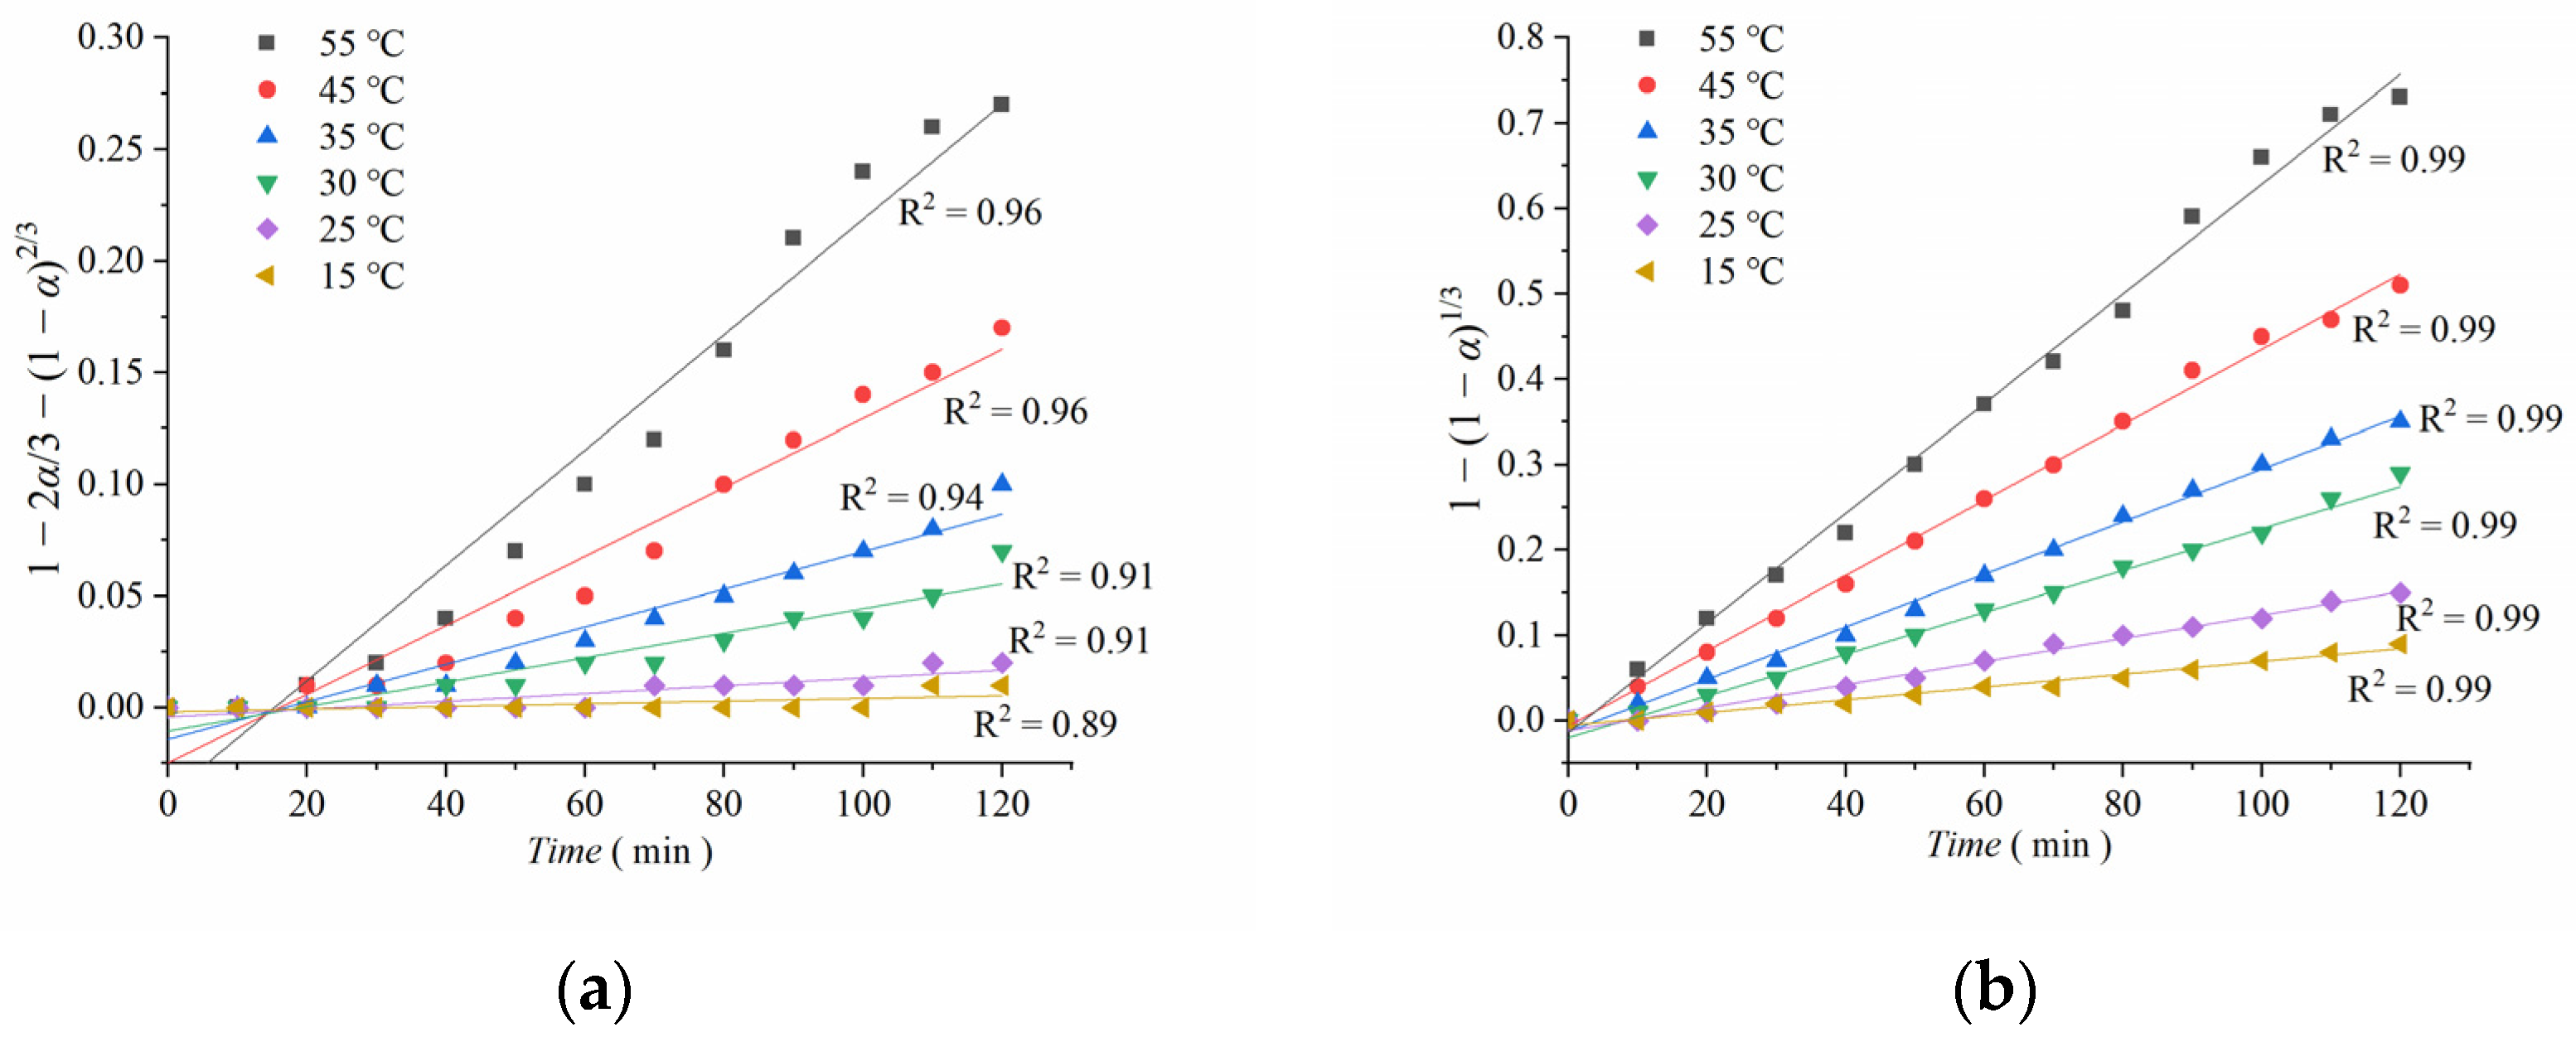
In the leaching reaction, the particles shrink, and the surface is not covered with other solids, which conforms to the shrinking particle model (SPM) [14]. According to the leaching kinetics model, uranium leaching is controlled by reactant diffusion and/or a surface chemical reaction. SPM was used to fit the leaching data at different temperatures with the kinetic reaction model [20,21,22]. For the following reactions:
aA(fluid) + bB(solid) → Products
If the leaching process is mainly determined by diffusion of the reactant inside the solid, the rate expression is:
1 2 α / 3 1 α 2 / 3 = k t
However, if the leaching process is mainly determined by the fluid–solid chemical reaction, then the rate expression becomes:
1 1 α 1 / 3 = k t
where k is the apparent reaction rate constant, min−1, and α is the reaction fraction.
The reaction fractions of UO2 under the conditions of 5 g/L H2SO4, 0.2 g UO2, 0.8 g of FeS2 and 0.06 mol/L H2O2 at different temperatures versus time are fitted in Figure 3. It can be seen that Equation (10) can better fit the experiment data, as the maximum R2 was 0.97 in the fitting results controlled by diffusion of the reactant inside the solid (i.e., Equation (9) and Figure 3a), but all the values of R2 were greater than 0.99 in the fitting results controlled by the chemical reaction (i.e., Equation (10) and Figure 3b). Therefore, the leaching process was controlled by the chemical reactions.
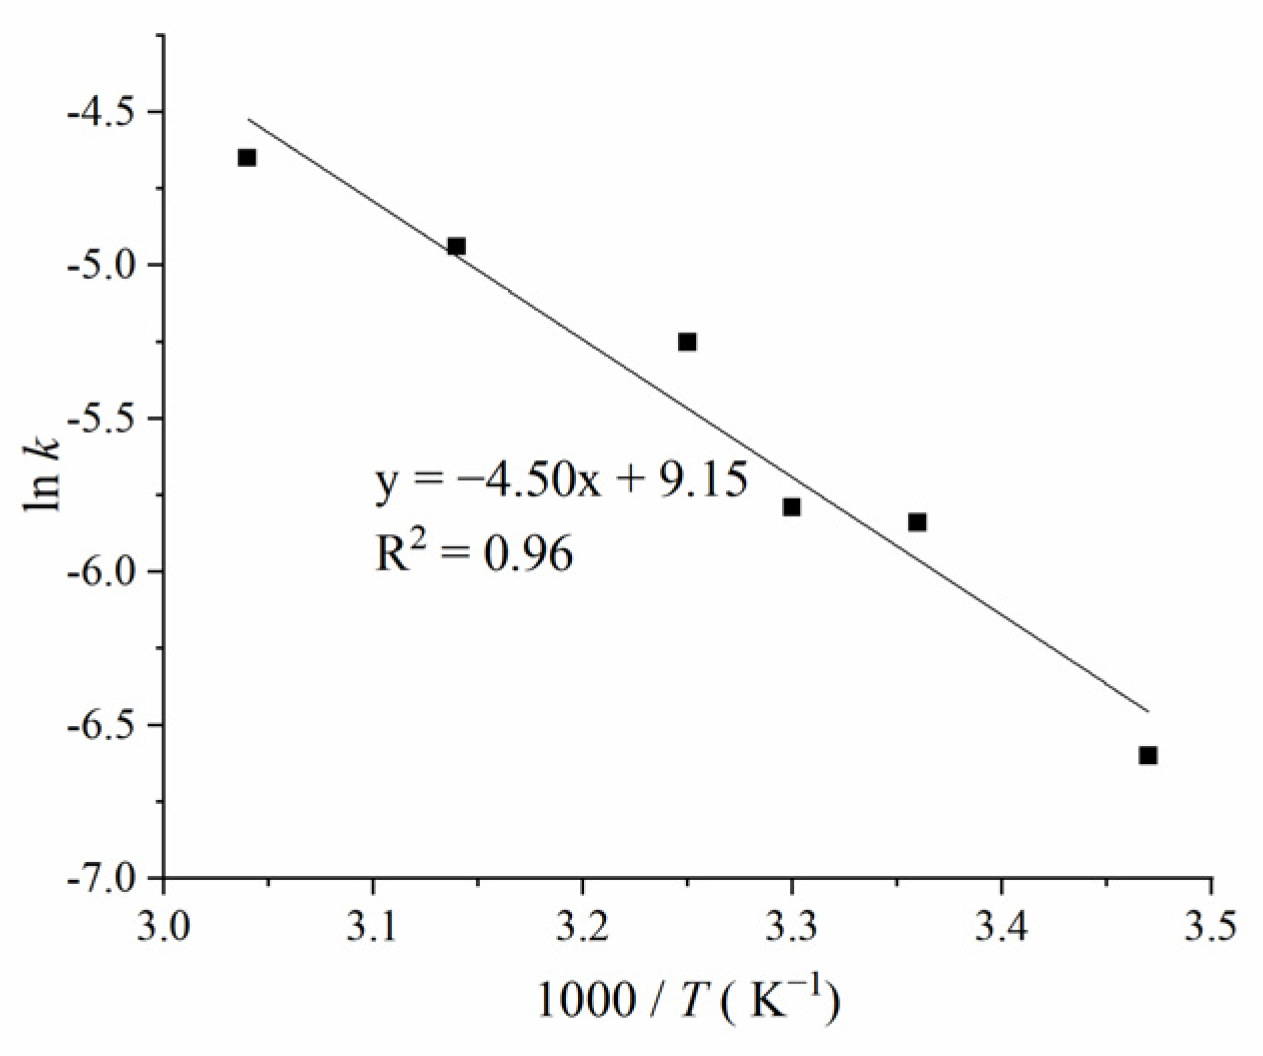
The reaction rate constant k obtained from the time-dependent gradients in Figure 3b was substituted into the following Arrhenius equation [10,14]:
ln   k = ln   A E a RT
where A is the pre-index factor; Ea is the apparent activation energy, kJ/mol; T is the thermodynamic temperature of the reaction, K and R is the molar gas constant (in J mol−1·K−1).
According to the fitting results in Figure 4, we calculated the pre-exponential factor A to be e(9.15 ± 1.56) min−1 and the apparent activation energy Ea to be (3.74 ± 0.40) × 10 kJ/mol. The evaluated activation energies were lower than 4.86 × 10 kJ/mol calculated by Park et al. [23].
The relationship between the leaching rate constant of UO2 and the quantity of FeS2 in the control stage of the chemical reactions can be expressed as:
k m = A   exp E a RT C 0 m p
where km is the rate constant based on the amount of pyrite added. C0 is the constant of the other experimental parameters, m is the mass of FeS2 and p is the reaction order of FeS2.
Set A   exp E a RT C 0 as k’, and Equation (12) can then be simplified as
k m = k m p
Figure 5a displays the 1 − (1 − α)1/3 versus time with different FeS2 additions. The slopes of these data are the reaction rate constant of UO2, which increases with the increasing amount of the coexistent Fe. This further demonstrates that the addition can accelerate the dissolution of UO2. We then plotted the reaction rate constant at different FeS2 additions in Figure 5b, showing that the influence of a FeS2 addition on the reaction rate becomes less obvious as the Fe amount increases; this is probably due to the leaching reaction tending towards completion, with an order of the reaction of 0.36.

6. Conclusions

The experiment of UO2 dissolution in H2SO4-H2O2, H2SO4-H2O2-FeS2 and H2SO4-FeS2 was conducted, and the effect of FeS2 on the dissolution of UO2 was investigated.
FeS2 can promote the dissolution of UO2 well in the presence of H2O2. When Fe3+ is 5 mg/L, the promoting effect of Fe3+ can be observed. With the increase of the concentration of Fe3+ in the solution, the promoting effect on the dissolution of UO2 will be more obvious. When Fe3+ was 20 mg/L, the reaction rate of UO2 reached the maximum, and any further increase of the Fe3+ concentration could not increase the reaction rate of UO2. When the mass of FeS2 increased from 0 g to 1.5 g, the uranium leaching rate increased by 45.7%. However, FeS2 cannot promote the dissolution of UO2 in the absence of an oxidant.
The dissolution of UO2 was controlled by a chemical reaction, and the apparent activation energy Ea was (3.74 ± 0.40) × 10 kJ/mol. The leaching process followed the shrinking particle model controlled by the chemical reaction. The reaction order of FeS2 was 0.36 at 25 °C.

Author Contributions

Conceptualization, P.W. and W.H.; Data curation, Z.L. and Y.T.; Formal analysis, P.W. and C.L.; Funding acquisition, K.T.; Investigation, Y.T. and W.H.; Methodology, P.W., K.T. and Y.L.; Project administration, W.T.; Resources, K.T. and C.L.; Software, P.W.; Supervision, W.T.; Validation, K.T.; Visualization, Z.L.; Writing—original draft, P.W.; Writing—review and editing, P.W., K.T. and Y.L. All authors have read and agreed to the published version of the manuscript.

Funding

This research was funded by the National Natural Science Foundation of China-Xinjiang Joint Fund (Grant No. U1703123), Research Foundation of Education Bureau of Hunan Province (No.18C0460) and the Innovation Project for Graduate students of the University of South China (203YXC001).

Data Availability Statement

The data presented in this study are available on request from the corresponding author.

Conflicts of Interest

The authors declare no conflict of interest.

References

  1. Akhtar, S.; Yang, X.; Pirajno, F. Sandstone type uranium deposits in the Ordos Basin, Northwest China: A case study and an overview. J. Asian Earth Sci. 2017, 146, 367–382. [Google Scholar] [CrossRef]
  2. Dai, M.; Peng, Y.; Wu, C.; Jiao, Y.; Liu, L.; Miao, A.; Zhang, C.; Zhang, Z.; Chen, S. Ore characteristics of the sandstone-type Daying uranium deposit in the Ordos Basin, northwestern China. Can. J. Earth Sci. 2017, 54, 893–901. [Google Scholar] [CrossRef]
  3. Li, Z.; Fang, X.; Chen, A.; Ou, G.; Xiao, X.; Sun, Y.; Liu, C.; Wang, Y. Origin of gray-green sandstone in ore bed of sandstone type uranium deposit in north Ordos Basin. Sci. China Ser. D Earth Sci. 2007, 50, 165–173. [Google Scholar] [CrossRef]
  4. Miao, P.; Jin, R.; Li, J.; Zhao, H.; Chen, L.; Chen, Y.; Si, Q. The First Discovery of a Large Sandstone-type Uranium Deposit in Aeolian Depositional Environment. Acta Geol. Sin. 2020, 94, 583–584. [Google Scholar] [CrossRef]
  5. Wang, P.; Tan, K.; Li, Y.; Xiao, W.; Liu, Z.; Tan, W.; Xu, Y. The adsorption of U(VI) by albite during acid in-situ leaching mining of uranium. J. Radioanal. Nucl. Chem. 2022, 1–9. [Google Scholar] [CrossRef]
  6. Satybaldiyev, B.; Lehto, J.; Suksi, J.; Tuovinen, H.; Uralbekov, B.; Burkitbayev, M. Understanding sulphuric acid leaching of uranium from ore by means of 234U/238U activity ratio as an indicator. Hydrometallurgy 2015, 155, 125–131. [Google Scholar] [CrossRef]
  7. Ma, Q.; Feng, Z.; Liu, P.; Lin, X.; Li, Z.; Chen, M. Uranium speciation and in situ leaching of a sandstone-type deposit from China. J. Radioanal. Nucl. Chem. 2017, 311, 2129–2134. [Google Scholar] [CrossRef]
  8. Zhao, L.; Deng, J.; Xu, Y.; Zhang, C. Mineral alteration and pore-plugging caused by acid in situ leaching: A case study of the Wuyier uranium deposit, Xinjiang, NW China. Arab. J. Geosci. 2018, 11, 707. [Google Scholar] [CrossRef]
  9. Chen, W. In-Situ Leaching of Uranium; China Atomic Energy Press: Beijing, China, 2018; pp. 145–148. [Google Scholar]
  10. Lasheen, T.A.; El-Ahmady, M.E.; Hassib, H.B.; Helal, A.S. Oxidative leaching kinetics of molybdenum-uranium ore in H2SO4 using H2O2 as an oxidizing agent. Front. Chem. Sci. Eng. 2013, 7, 95–102. [Google Scholar] [CrossRef]
  11. Amme, M.; Bors, W.; Michel, C.; Stettmaier, K.; Rasmussen, G.; Betti, M. Effects of Fe(II) and Hydrogen Peroxide Interaction upon Dissolving UO2 under Geologic Repository Conditions. Environ. Sci. Technol. 2005, 39, 221–229. [Google Scholar] [CrossRef]
  12. Zhou, Y.; Ji, H.; Sun, Z.; Liu, Y.; Xu, L.; Shi, W.; Liu, J. Characteristics of uranium dissolution and migration in acidic Solution containing Fe3+. Acta Geol. Sin. 2016, 90, 3554–3562. [Google Scholar]
  13. Filippov, A.P.; Kanevski, E.A. Oxidation-reduction potentials and the dearee ofuraniumm leaching in sulphuric acid solutions. J. Nucl. Energy Parts A/B React. Sci. Technol. 1965, 19, 575–580. [Google Scholar] [CrossRef]
  14. Safari, V.; Arzpeyma, G.; Rashchi, F.; Mostoufi, N. A shrinking particle—shrinking core model for leaching of a zinc ore containing silica. Int. J. Miner. Process. 2009, 93, 79–83. [Google Scholar] [CrossRef]
  15. Faraji, F.; Alizadeh, A.; Rashchi, F.; Mostoufi, N. Kinetics of leaching: A review. Rev. Chem. Eng. 2022, 38, 113–148. [Google Scholar] [CrossRef]
  16. Pan, Z.; Bartova, B.; LaGrange, T.; Butorin, S.M.; Hyatt, N.C.; Stennett, M.C.; Kvashnina, K.O.; Bernier-Latmani, R. Nanoscale mechanism of UO2 formation through uranium reduction by magnetite. Nat. Commun. 2020, 11, 4001. [Google Scholar] [CrossRef] [PubMed]
  17. Kwan, W.P.; Voelker, B.M. Decomposition of Hydrogen Peroxide and Organic Compounds in the Presence of Dissolved Iron and Ferrihydrite. Environ. Sci. Technol. 2002, 36, 1467–1476. [Google Scholar] [CrossRef] [PubMed]
  18. Wang, C. Leaching Uranium Mining; China Atomic Energy Press: Beijing, China, 1998; pp. 23–28. [Google Scholar]
  19. Pehrman, R.; Trummer, M.; Lousada, C.M.; Jonsson, M. On the redox reactivity of doped UO2 pellets—Influence of dopants on the H2O2 decomposition mechanism. J. Nucl. Mater. 2012, 430, 6–11. [Google Scholar] [CrossRef]
  20. Ray, H.S.; Ray, S. Kinetics of Metallurgical Process; Springer: Berlin/Heidelberg, Germany, 2018. [Google Scholar]
  21. Tan, K.; Li, C.; Liu, J.; Qu, H.; Xia, L.; Hu, Y.; Li, Y. A novel method using a complex surfactant for in-situ leaching of low permeable sandstone uranium deposits. Hydrometallurgy 2014, 150, 99–106. [Google Scholar] [CrossRef]
  22. Samadifard, N.; Devine, C.; Edwards, E.; Mahadevan, K.; Papangelakis, V. Ferric Sulfate Leaching of Pyrrhotite Tailings between 30 to 55 °C. Minerals 2015, 5, 801–814. [Google Scholar] [CrossRef]
  23. Park, B.H.; Seo, C.S. A semi-empirical model for the air oxidation kinetics of UO2. Korean J. Chem. Eng. 2008, 25, 59–63. [Google Scholar] [CrossRef]
Figure 1. Element U (a) and Fe3+ ion (b) concentration changes with time under different pyrite masses.
Minerals 12 00570 g001
Figure 2. Uranium leaching rate versus the quantity of FeS2 added.
Minerals 12 00570 g002
Figure 3. The fit of the diffusion rate expression versus time for (a) diffusion inside the solid and (b) chemical reaction.
Minerals 12 00570 g003
Figure 4. Arrhenius diagram of dissolved UO2.
Minerals 12 00570 g004
Figure 5. (a) Curve of 1 − (1 − α)1/3 with time under different FeS2 masses. (b) Fitting curve of km and m.
Minerals 12 00570 g005
Publisher’s Note: MDPI stays neutral with regard to jurisdictional claims in published maps and institutional affiliations.