Article

Gradation Design of Phosphorus Tailing–Graded Waste Rock Subgrade Filling Using Discrete Element Method

1
State Key Laboratory of Silicate Materials for Architectures, Wuhan University of Technology, Wuhan 430070, China
2
School of Materials Science and Engineering, Wuhan University of Technology, Wuhan 430070, China
3
Guizhou Chanhen Chemical Corporation, Fuquan 550500, China
*
Author to whom correspondence should be addressed.
Minerals 2022, 12(5), 573; https://doi.org/10.3390/min12050573
Submission received: 3 April 2022 / Revised: 29 April 2022 / Accepted: 29 April 2022 / Published: 1 May 2022

Abstract

:
The method of using silt phosphorus tailing instead of traditional sand and filler as subgrade filling has been suggested to greatly improve the comprehensive utilization of solid waste phosphorus tailing. A suitable combination of phosphorus tailing and graded waste rock can be adopted to improve the stability of the structure of filling, which can then improve the soil properties of phosphorus tailing and prevent the formation of quicksand and landslides. In this research, a discrete element model was established by combining a graded mixing method and the concept of equivalent particle size, and the discontinuous gradation design of a phosphorus tailing–graded waste rock mixture was carried out. Using the filling coefficient, different structural types of mixture composition were verified, and the California Bearing Ratio was used to test and analyze the specimens with different mixtures, grading, and structural type. The results show that the porosity of the main skeleton calculated with the model established using the discrete element software Particle Flow Code and the porosity obtained with the tamping test fit well, with the minimum porosity of the optimal main skeleton coarse aggregate being 30.44%. At the same time, by analyzing the effect of filling the porosity of graded waste rock with different mass fractions of phosphorus tailing and by determining the California Bearing Ratio of the corresponding filling structure, it was shown that the skeleton-dense structure with the best gradation of the mixture displayed better road performance and that the phosphorus tailing–graded waste rock system with improved performance can be used as subgrade filling or in the preparation of pavement base material.

1. Introduction

The development and utilization of phosphate rock resources in China has led to the stockpiling of solid waste phosphorus tailing [1,2], which has caused a series of environmental pollution and safety problems [3,4]. The consumption of phosphorus tailing is helpful in the promotion of the sustainable development of the phosphate rock industry. Ren et al. [5] found that low internal cohesion becomes a problem when phosphorus tail mining alone is used in road construction. Liu et al. [6] suggested that inorganic cementitious materials such as lime–fly ash and cement should be used to form a dense, consolidated body for phosphorus tailing. However, little research has been carried out regarding what mix of phosphorus tailing and graded waste rock might be suitable to improve the stability of the structure of filling and promote its application in road engineering. It has been found that the gradation of a mixture plays an important role in its bearing performance and that coarse aggregate and fine aggregate have two different functions in mixture gradation design [7]. Most designs adopt particle sizes greater than 4.75 mm; coarse aggregate is used for the main skeleton structure, and fine aggregate fills the porosity of the main skeleton to ensure the grading composition of the mixture has a strong skeleton-embedded structure and good internal friction [8,9,10,11]. At present, continuous grading is mostly used in terms of the particle size of fine aggregate. There is a lack of relevant research regarding whether phosphorus tailing can be directly used to replace sand and filler and then be applied in the form of discontinuous grading to the grading design of a mixture. In addition, the filling effect of fine aggregate is the filling coefficient λ [12]. Therefore, it is important to study the comprehensive performance of skeleton-void-type, skeleton-dense-type, and suspension-dense-type phosphorus tailing–graded waste rock mixtures.
In addition, it is difficult to determine the internal structural characteristics of a mixture using a real test. The macro-performance of a mixture is the internal representation of its meso-structure. The discrete element method can reflect heterogeneity and discontinuity inside an object from the meso point of view. When the grading of a raw material is poor, analyses pertaining to its grading design and the structural performance of the material in road engineering mixtures are suitable [13,14,15]. The discrete element analysis software Particle Flow Code (PFC) has good repeatability and reproducibility in the operation process and has a good three-dimensional visualization function [16,17,18]. The basic unit of PFC3D in the process of a simulated grading design is circular or spherical, which corresponds to different particle sizes and has great advantages in the generation of meso-models of mixtures and in the analysis of the mechanical properties of meso-structures [19,20]. At present, the discrete element method is rarely used to analyze the actual road performance of designed mixture gradations, while the California Bearing Ratio (CBR) is widely used to characterize the quality of subgrade and pavement base materials [21]. Tan Bo et al. [22] found that the larger the CBR value of graded, crushed stone specimen, the stronger the performance of the skeleton structure, and the stronger the deformation resistance and bearing capacity. Gao et al. [23] found that the larger the CBR value, the greater the shear strength and elastic modulus of the subgrade filler, which does not make it easy to produce settlement deformation.
Based on this, combined with PFC3D and a tamping density test, in this study, we calculated the stacking porosity of coarse aggregate with different mass proportions after grading and established the discrete element model for the grading design of coarse aggregate and phosphorus tailing mixtures. Combined with the characteristics of the physical properties of phosphorus tailing, by analyzing the effect of filling the porosity of graded waste rock with different mass fractions of phosphorus tailing and the mechanical properties of the corresponding filling structure, in this study, we laid a foundation for the grading design of phosphorus tailing–graded waste rock mixture and the application of phosphorus tailing so as to maximize the use of mine tailing and achieve excellent road performance with this material.

2. Materials and Methods

2.1. Phosphorus Tailing and Its Application in Filling Engineering

The phosphorus tailing used in this experiment was industrial waste produced by Guizhou Chanhen Chemical Corporation. Phosphate rock, the mineral composition of which is mainly dolomite, which contains a certain amount of quartz and fluorapatite, was floated [24]. The apparent density of the phosphorus tailing was 2820 kg/m3, with a specific surface area of 314.45 m2/kg, and the crushing value of dolomitic stripping waste rock mined in the same period, the composition of which is similar to that of phosphorus tailing, was 18.5%. Therefore, in terms of the mineral composition of phosphorus tailing, as the minerals in its composition are mainly dolomite and it does not contain expansive components such as kaolinite, no instability in its base course caused by large amounts of water absorption and expansion due to kaolinite or bentonite is apparent. Moreover, in terms of density and specific surface area, it has similar values to that of general engineering fillers, such as stone powder. In terms of the crushing value of dolomitic stripping waste rock, dolomite has fine hardness. These are the advantages of applying phosphorus tailing in engineering, although it also has a very obvious disadvantage, that is, its plasticity index is low, which is due to the silt content.
The plastic limit WL of phosphorus tailing was 13.23%, the liquid limit WP was 19.28%, the plasticity index IP was 6.05, and its plasticity index was less than 10. At the same time, the particle size distribution was tested (see Figure 1), from which it can be seen that the proportion of phosphorus tailing with particle sizes greater than 0.075 mm was 7.40%, the characteristic parameters were D10 = 1.50 µm, D50 = 24.70 µm, and D90 = 67.64 µm, the average surface area of the particle size D [3,2] = 4.56 µm, and the average volume of the particle size D [4,3] = 30.01 µm. The particle size distribution and plasticity index of the phosphorus tailing show that the phosphorus tailing is silt, so its cohesion is poor, which means it differs from common clay in subgrade and pavement engineering. If silt is located below the groundwater level and if the pores are filled with capillary water or gravity water, it has high compressibility and low mechanical strength. It is easy to produce liquefaction under seismic loads and quicksand under water head, and engineering accidents, such as subgrade landslides and pavement collapses, easily occur under dynamic loads or self-weight loads [25]. Therefore, when silt is directly used as a subgrade filler, it is often reinforced [26] with materials such as lime–soil compaction pile, gravel compaction pile, cement soil pile, etc. These reinforcement methods take a long time and have high costs. In terms of phosphorus tailing, more attention needs to be paid to this problem in direct applications, and it is necessary to find ways to enhance its structural stability. Therefore, in this study, we analyzed and discussed ways of improving the structural stability of phosphorus tailing by changing the soil properties of phosphorus tailing through the stacking state of the lifting system. In this study, the overall stability of the system was improved by optimizing the grading design of phosphorus tailing–graded waste rock mixtures and accurately designing the stacking state.

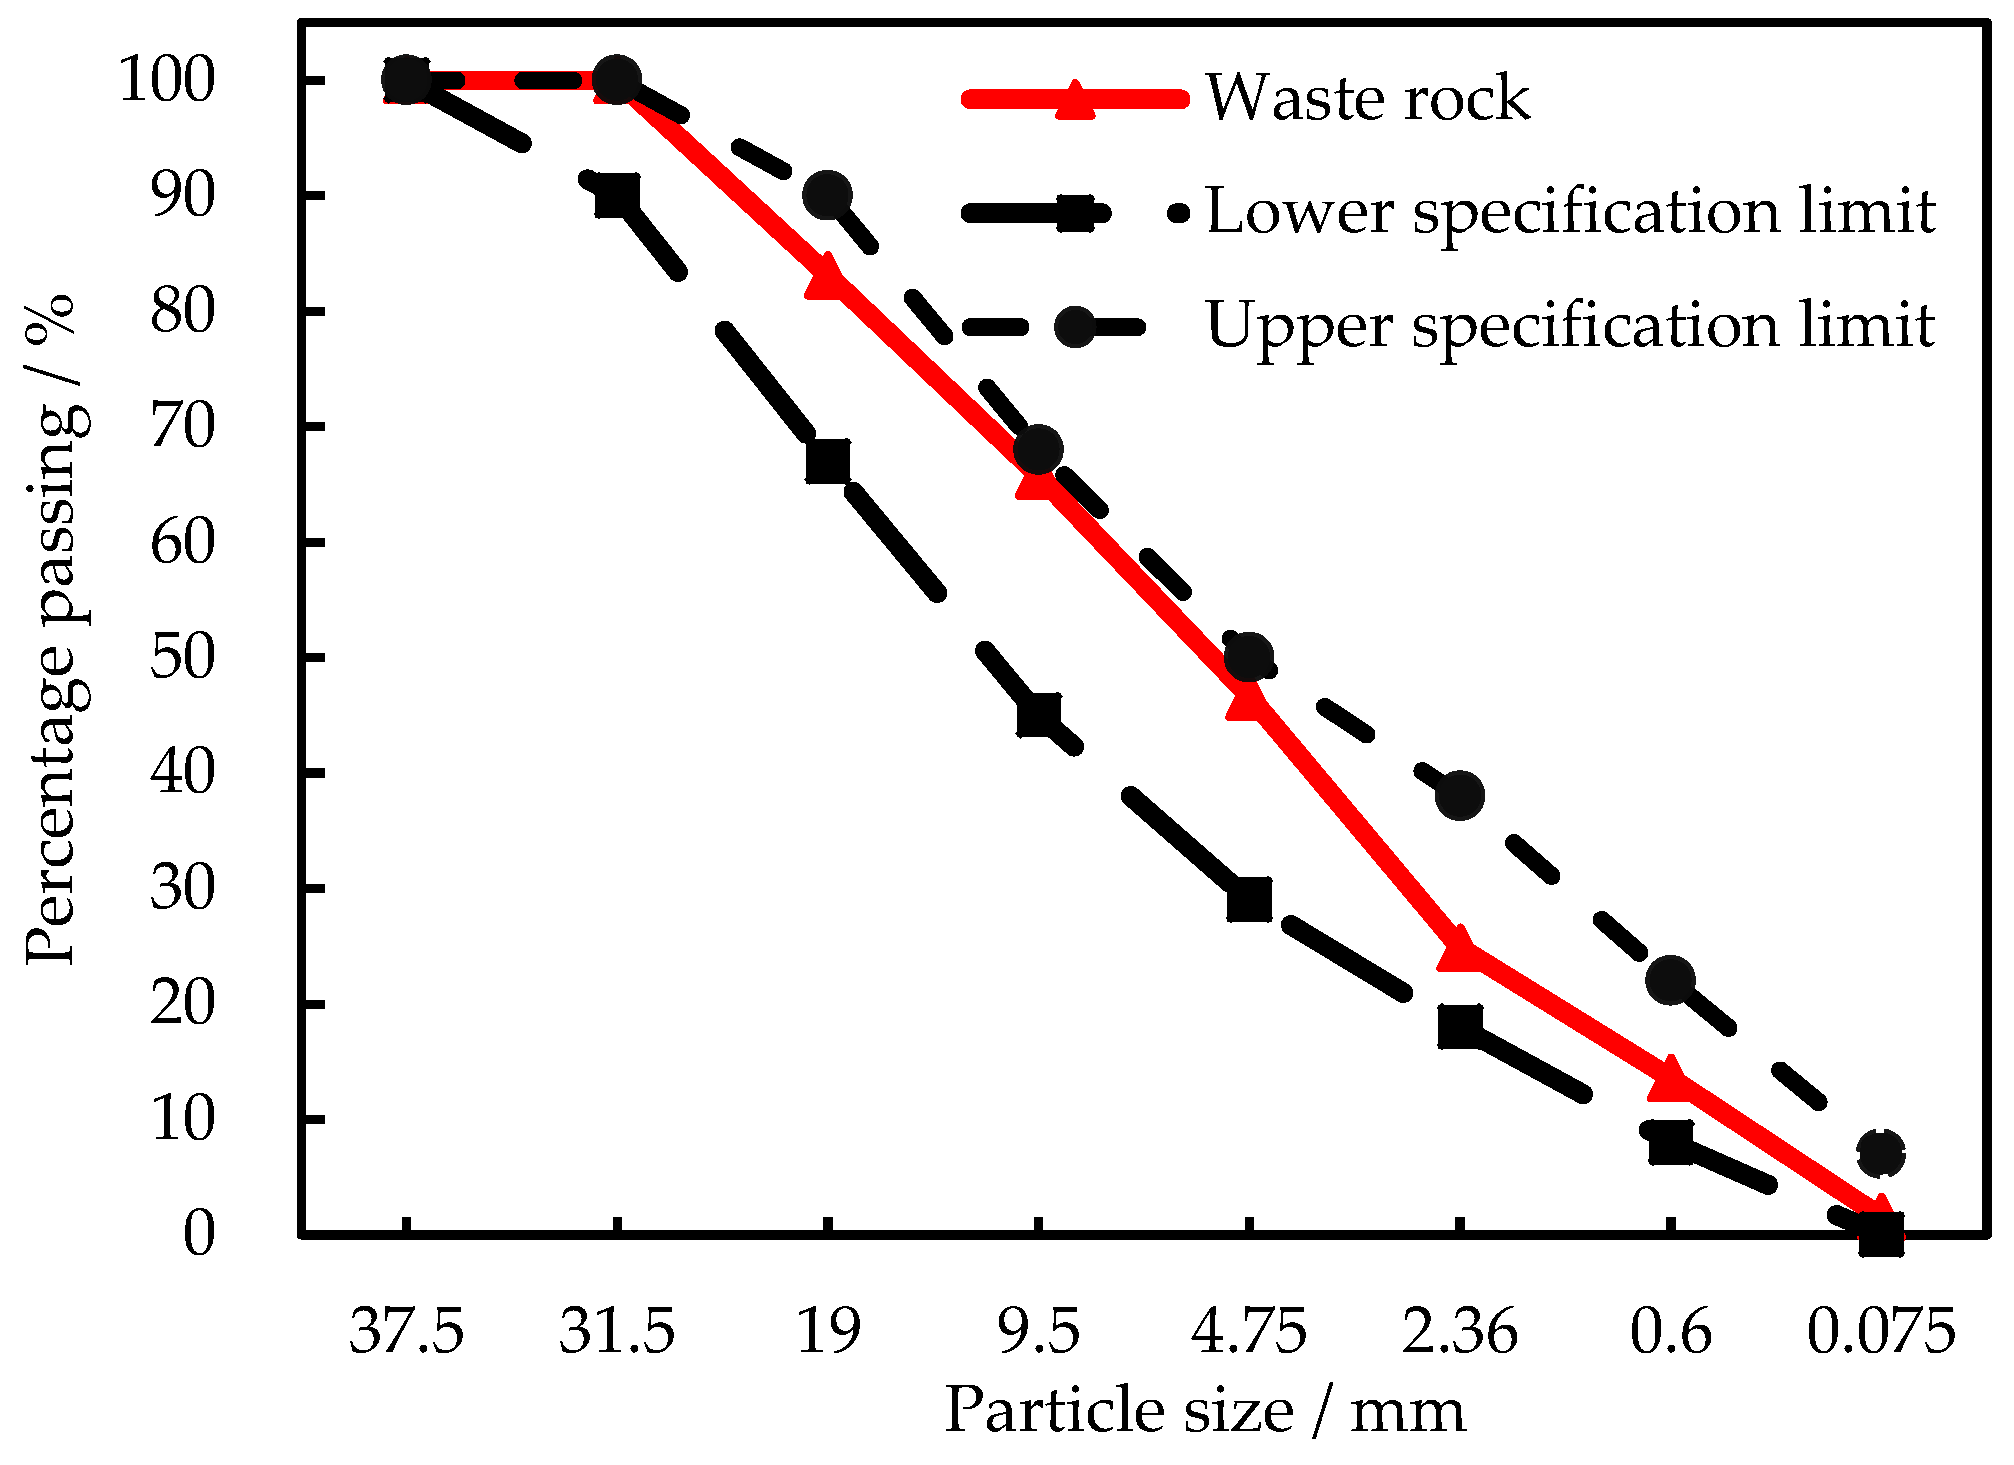
2.2. Graded Waste Rock

Graded waste rock aggregate was formed by crushing and grading stripped waste rock in Guizhou Province, the particle size distribution of which is shown in Figure 2. Although the natural grading of the waste rock basically adhered to the requirements of C-A-1 grading specified in Technical Guidelines for Construction of Highway Roadbases (JTG/T F20-2015) [27], the passing rate and median value of sieve 4.75 mm and sieve 9.5 mm deviated greatly and were close to the upper limit of grading, while the passing rate of sieve 0.075 mm was close to the lower limit of grading, so the grading of the mixture needed to be improved further. Other technical characteristics, shown in Table 1, meet those in JTG/T F20-2015.

3. Establishment of Mixture Discrete Element Model

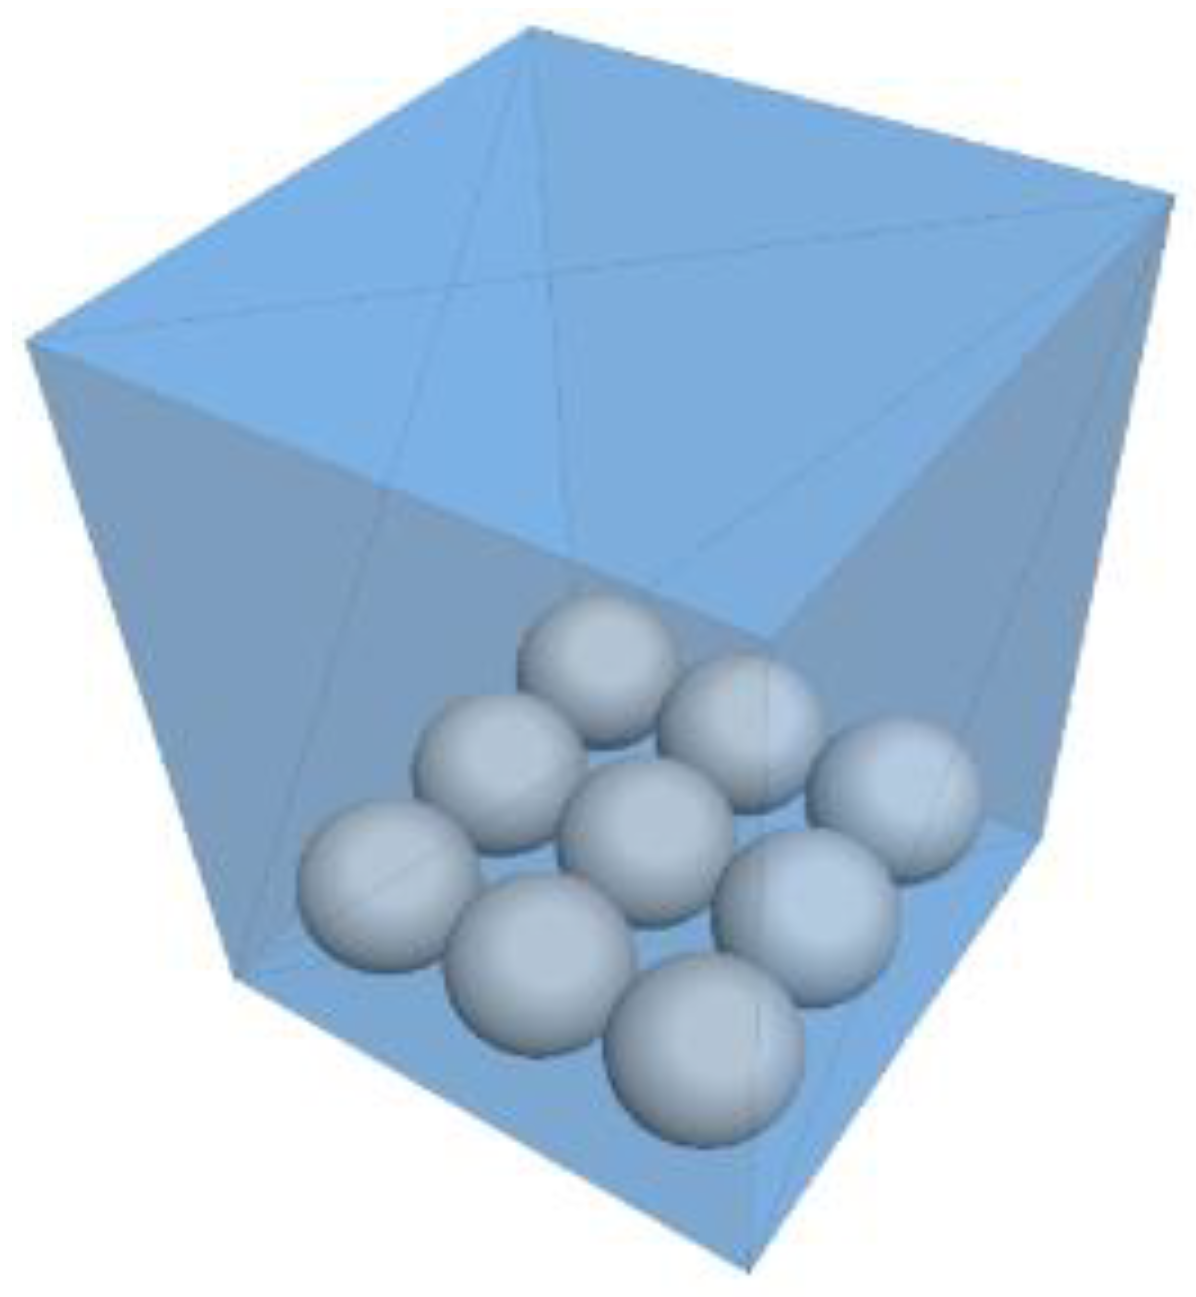
3.1. Graded Mixing Method for Coarse Aggregate

Graded mixing of the aggregate [28] was carried out as follows: A series of granular materials from coarse to fine were mixed to obtain the compactness (porosity) values of the aggregate under different mass proportions. When the aggregate mixing reached the minimum porosity, it was determined as the best mass proportion aggregate combination. However, the large difference in aggregate particle sizes posed a great challenge to the actual mixing process, as the phenomenon of aggregate segregation could easily occur, which would then distort the test data. Therefore, the aggregate was divided into particle sizes greater than 4.75 mm coarse aggregate and phosphorus tailing fine aggregate for PFC3D simulation. At the same time, in accordance with the Standard for Technical Requirements and Test Method of Sand and Crushed Stone (or Gravel) for Ordinary Concrete (JGJ 52-2006) [29], the dry compaction test was carried out to determine the quality of the coarse aggregate with different mass proportions to determine its actual porosity V c a , which was used to verify the correctness of the model construction. The calculation formula of V c a   is as follows (1):
V c a   = [ 1 ρ s c ρ t c ] × 100 %
where ρ t c   is the apparent density of the coarse aggregate, and kg/m3;   ρ s c is the tamping density of the coarse aggregate.

3.2. PFC3D Simulation

PFC3D is numerical simulation software that generally simplifies complex aggregate particles into ideal spheres to solve discontinuous media. Jia Wenbin [30] used PFC to carry out the gradation design of a mixture, which is simple to operate and improves the work efficiency. It was determined that the outlet performance was not lower than the gradation value in the specification. Yao et al. [31] used the discrete element method to simulate and analyze the accumulation of particles with different particle sizes, which made the calculation of the mixture void ratio more accurate. Ling et al. [32] found that the results of the tamping density test and PFC3D simulation were in good agreement. Therefore, PFC3D can be used to simulate the compaction test in the graded mixing of coarse aggregate, and the discrete element software PFC3D can be used for modeling.

3.2.1. Parameter Setting

To define the size of the calculation space, PFC3D was used to generate a 600 mm × 600 mm × 800 mm rigid wall of sufficient size in the domain area. The meso-parameters of the particles in the calculation model were set and determined through multiple trial calculations and adjustments [28], where the particle density was taken as 2820 kg/m3, the normal contact stiffness kn and tangential contact stiffness ks between particles as 2 × 10⁸ N/m, the normal bond strength n_bond and tangential bond strength s_bond as 1 × 10⁵ N, and the damping coefficient as 0.7.

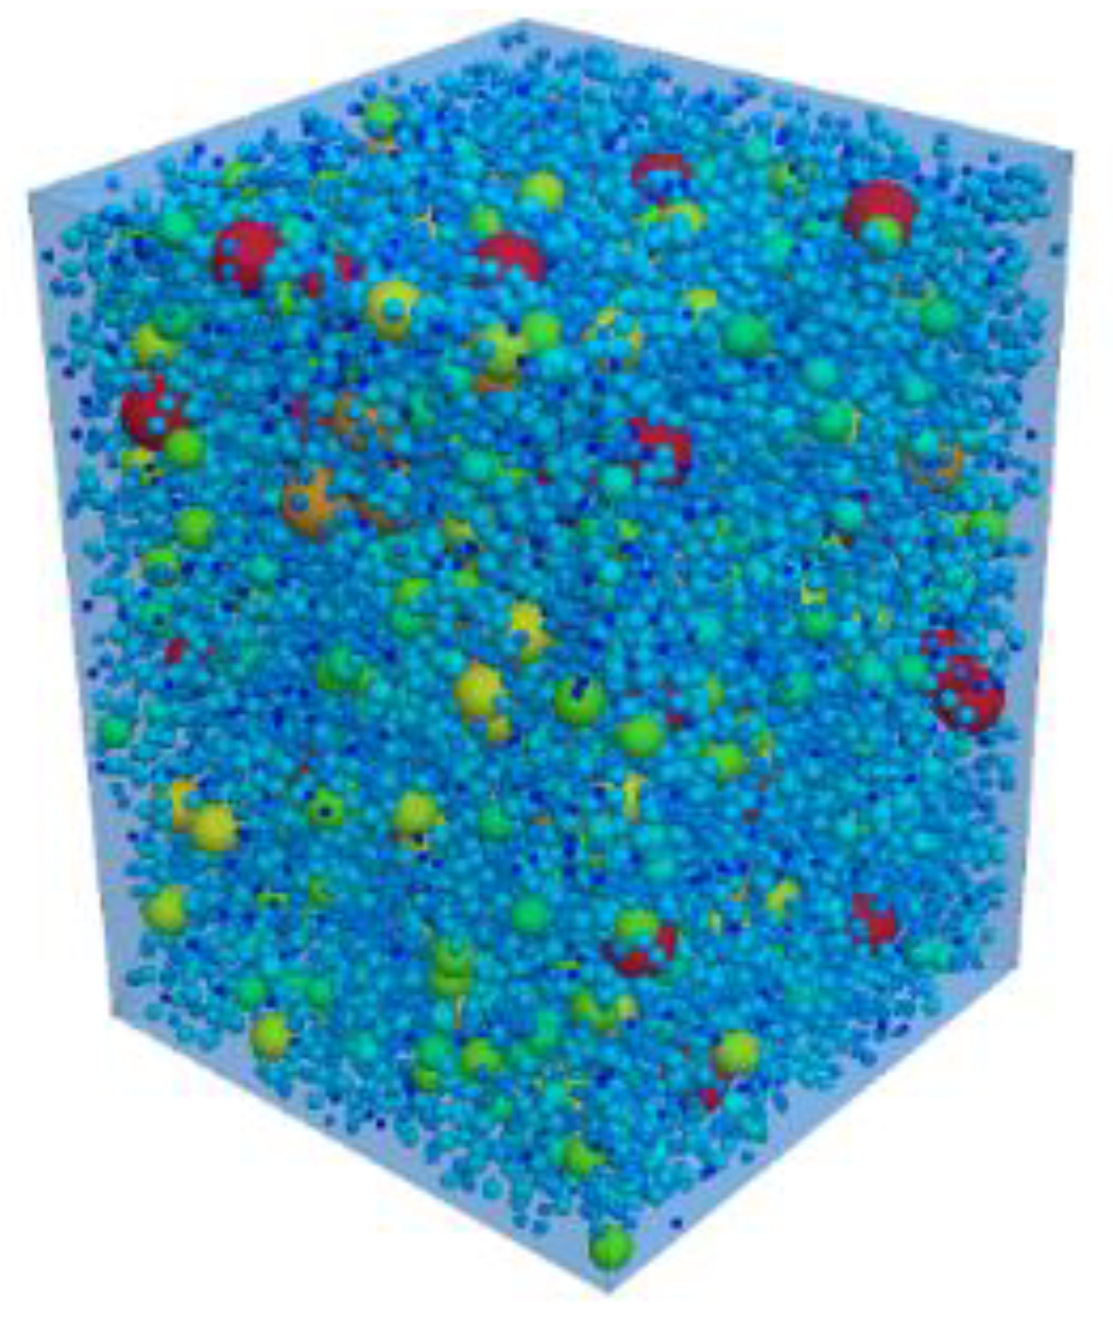
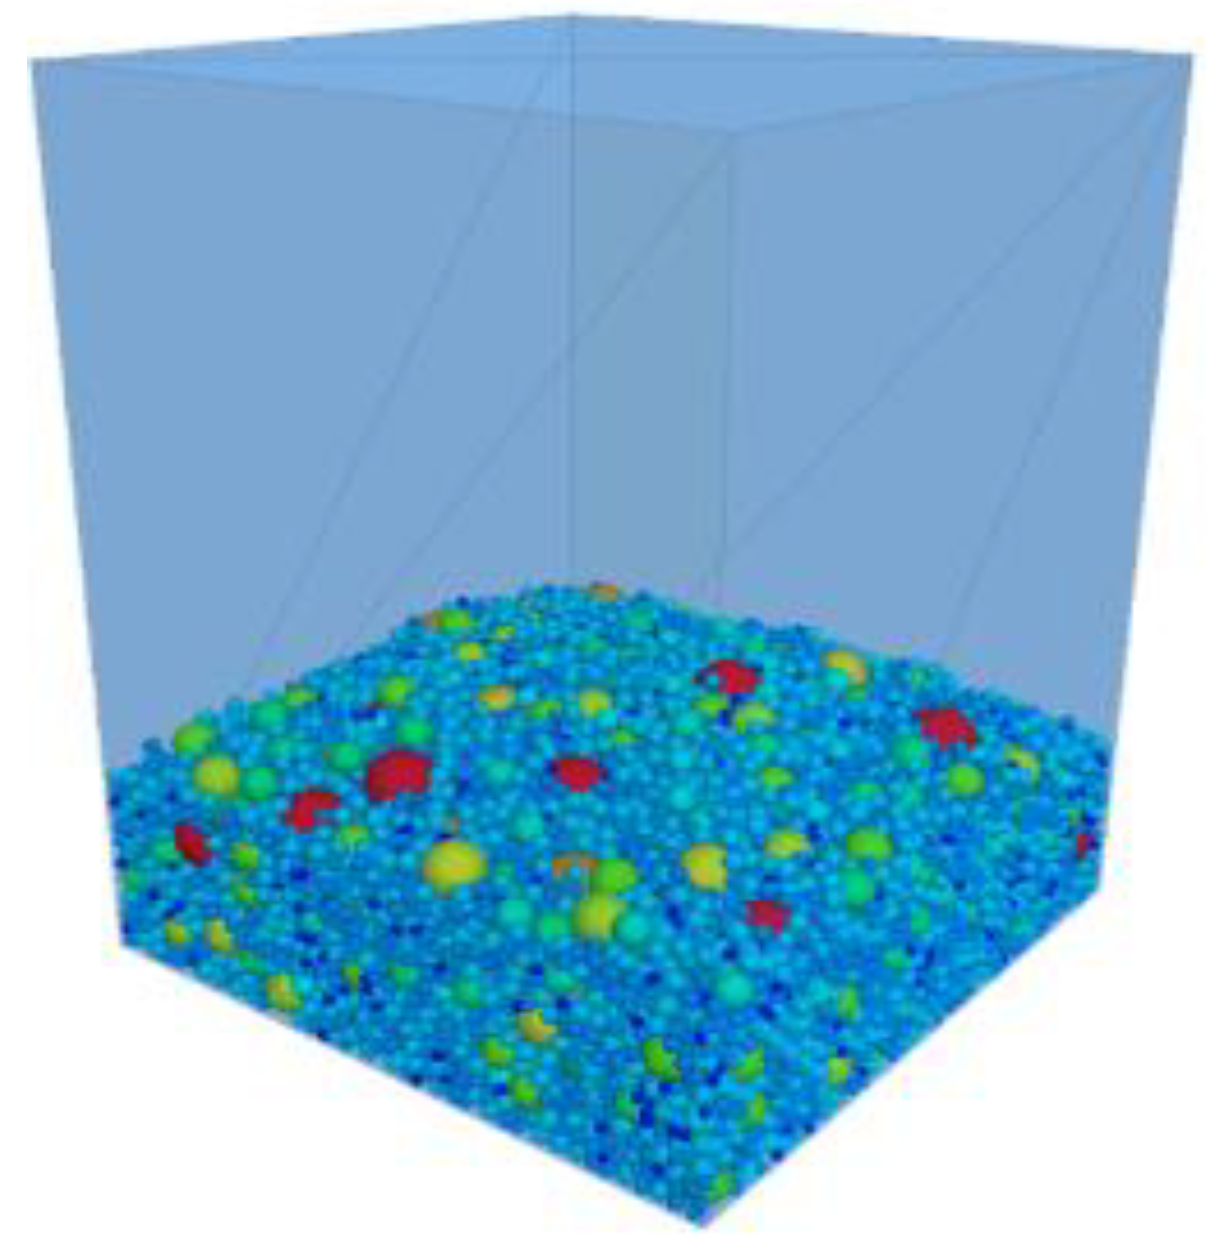
3.2.2. Particle Generation

Due to the continuous distribution of the graded particle size of the coarse aggregate, the number of particles at all levels needed to be taken into consideration when calculating the porosity generated in the stacking process of graded particles with different mass proportions. Therefore, the concept of equivalent particle size was proposed, which is used to replace typical particle sizes in a particle size range. After the particle size conversion, the discrete element analysis was more consistent with the mixture stacking state. The equivalent particle size of the system was calculated with reference to the relevant literature [28]. Considering the number of calculations made and the conformity of the results to the actual situation, the equivalent particle size of 19–31.5 mm aggregate   d ¯ 1   = 24.55 mm, the equivalent particle size of 9.5–19 mm aggregate   d ¯ 2   = 13.33 mm, and the equivalent particle size of 4.75–9.5 mm aggregate   d ¯ 3   = 6.59 mm.
Based on the equivalent particle size of each particle size aggregate, the number ratio of the aggregate rigid balls with different mass ratios was calculated. The Generate command in PFC3D was used to generate the randomly arranged particle model, and there were no overlaps in the particles, as shown in Figure 3.

3.2.3. Mixture Balance and Calculation of Mixture Porosity

The mixture particles were made to settle under the action of gravity by setting the gravity acceleration, the stress between particles was eliminated, and finally, a stable equilibrium state was achieved. In PFC3D, the Cycle command first calculated 5000 steps, and then the Solve command was used to enable the model to reach the equilibrium state, as shown in Figure 4. After the mixture reached equilibrium, PFC3D was used to generate nine measuring balls in the defined area to measure their porosity and calculate their average value, as shown in Figure 5. The average value was taken as the porosity of the mixture.

4. Determination and Evaluation of Gradation of Phosphorus Tailing–Waste Rock Mixture

4.1. Determination of Coarse Aggregate Gradation of Phosphorus Tailing–Gravel Mixture

4.1.1. The Best Mass Ratio of 19–31.5 mm and 9.5–19 mm Aggregate

Using the method of establishing a discrete element model, 19–31.5 mm (M1) aggregate and 9.5–19 mm (M2) aggregate were mixed in accordance with different mass proportions to generate a discrete element model. Figure 6 shows a schematic diagram of the stacking of 19–31.5 mm aggregate and 9.5–19 mm aggregate with different mass proportions, and Figure 7 shows the fitting results of the average porosity data calculated using PFC3D and the actual porosity measured using the tamping density test.
It can be seen from Figure 6 and Figure 7 that the actual porosity measured using tamping density was in good agreement with the porosity calculated using PFC3D. When M1 decreased continuously, the 9.5–19 mm aggregate filled the porosity formed by the 19–31.5 mm aggregate, which made the porosity of the mixture decrease. However, with the increase in the 9.5–19 mm aggregate, the 9.5–19 mm aggregate interfered with the skeleton formed by the 19–31.5 mm aggregate; the skeleton was stretched, and the porosity became larger. Only when M1:M2 = 30:70 was the porosity the smallest, where the voids formed by the 19–31.5 mm aggregate were most closely filled by the 9.5–19 mm aggregate, forming the optimal embedded skeleton structure.

4.1.2. The Best Mass Ratio of 9.5–31.5 mm and 4.75–9.5 mm Aggregate

On the basis of the optimal mass ratio of 19–31.5 mm aggregate and 9.5–19 mm aggregate, 4.75–9.5 mm aggregate was mixed into it in accordance with the different mass ratios to generate a discrete element model. Figure 8 shows the schematic diagram of the stacking of the 9.5–31.5 mm (M1 + M2) aggregate and 4.75–9.5 mm (M3) aggregate with different mass proportions, and Figure 9 shows the fitting results of the average porosity data calculated using PFC3D and the actual porosity measured using the tamping test.
It can be seen from Figure 8 and Figure 9 that the actual porosity measured using tamping density was in good agreement with the void calculated using PFC3D. There was still a lot of room for porosity to be reduced when 19–31.5 mm aggregate and 9.5–19 mm aggregate formed the optimal skeleton. With the increase in M3, the mixture became more embedded and stacked, so the porosity decreased. Similarly, when M3 increased to a certain extent, it would interfere with the formed optimal skeleton, destroy the accumulation of its optimal main skeleton, and then increase the porosity. Therefore, the gradation of coarse aggregate can determine the stacking state of an aggregate and affect the porosity of an aggregate [33]. When (M1 + M2):M3 = 70:30, that is, M1:M2:M3 = 21:49:30, the minimum porosity of the optimal main skeleton formed using the mixture was 30.44%.

4.1.3. Discontinuous Gradation Composition of Phosphorus Tailing–Graded Waste Rock Mixture

Phosphorus tailing was mixed into coarse aggregate (4.75–31.5 mm) with different mass fractions to generate a mixture discrete element model to compare and analyze different stacking states. Considering that the actual phosphorus tailing was in the closest stacking state under the maximum dry density, which was selected for the calculation of phosphorus tailing density when mixing, the phosphorus tailing particles and stacking voids were regarded as a whole. The maximum dry density was obtained in accordance with the heavy compaction test, which was carried out in accordance with JTG/T F20-2015. The maximum dry density of the phosphorus tailing was 2100 kg/m3, and the most closely packed porosity was 25.53%. The simulation results of the stacking effect calculation are shown in Figure 10. It can be seen from Figure 10a that when the mass fraction ( q f ) of phosphorus tailing was less than 23%, the coarse aggregates in the mixture contacted each other to form a skeleton, but the porosity of the mixture was greater than 10%. The content of phosphorus tailing was insufficient to completely fill the porosity of the coarse aggregate. There were several loose parts in the transmission path of contact stress, resulting in insufficient contact between the mixtures, which meant they were skeleton-void structures. It can be seen from Figure 10c that when the mass fraction ( q f ) of phosphorus tailing was greater than 30%, although the gap in the coarse aggregate was sufficiently filled, the main skeleton was stretched, meaning the porosity rate reached about 35%, that is, the actual porosity of the main skeleton was nearly 5% higher than that of the optimal main skeleton. The coarse aggregate was in a suspended state; only some coarse aggregates were embedded to form regional skeleton contact, but the transmission path of skeleton contact stress was interrupted, and the embedding and squeezing effect of the skeleton could not occur. Here, the mixture was a suspension-dense structure. It can be seen from Figure 10b that when the mass fraction ( q f ) of phosphorus tailing was in the range of 23%–30%, the porosity of the mixture was less than 10%, and the difference between the actual porosity of the main skeleton and the optimal one was less than 5%. The transmission path and contact points of skeleton contact stress were fully distributed in the mixture, which contacted each other to form a network structure. The remaining phosphorus tailing played an excellent role in the filling, enabling the mixture to reach a most closely connected state, which meant it was a skeleton-dense structure. It is particularly noted that when the mass fraction of phosphorus tailing was 24.38%, the porosity of the mixture reached the minimum value of 7.77% and reached the maximum dense state.

4.2. Verification of Gradation Structure Type of Phosphorus Tailing–Graded Waste Rock Mixture

Fine aggregate is mainly used to fill gaps among a main skeleton and plays excellent filling and supporting roles. Zhang et al. [34] determined that 1% porosity reduced the interference of fine aggregate on gradation, as it reduced error and improved the accuracy of a mixture gradation design. However, different kinds of fine aggregates have unique characteristics and differences in filling characteristics. So, here, we considered the filling characteristics of phosphorus tailing. In order to verify the rationality of the phosphorus tailing–graded waste rock mixture designed using the discrete element model, we used the filling coefficient λ (a parameter used to judge the type of structure type a mixture has) for comparison [35]. Here, λ is the ratio of the volume occupied by the mass fraction of phosphorus tailing to the porosity of the optimal main skeleton, and its formula is as follows:
λ = q f   /   ρ d q c ρ s c × V c a
where q c is the mass fraction of the coarse aggregate, %;   q f is the mass fraction of the fine aggregate, %; q c + q f = 1 ; ρ d is the maximum dry density of the phosphorus tailing, kg/m3; ρ s c is the tamping density of 1974 kg/m3; V c a is 30.44% of the void ratio of the optimal main skeleton.
In accordance with Formula (2), when λ = 1. 0, that is, when the accumulation had reached the maximum dense state, the mass fraction ( q f ) of phosphorus tailing was 24.46%. The mass fraction ( q f ) of the phosphorus tailing in the maximum dense state calculated using the discrete element model was 24.38%, which is basically consistent.
We used Formula (2) to further expand the calculation, the results of which are shown in Table 2.
Assuming that λ is 0.9–1.1, the accumulation of the system was dense. As shown in Table 2, when the mass fraction ( q f ) of the phosphorus tailing was < 23%, and λ was < 0.9, the phosphorus tailing did not completely fill the formed skeleton porosity, and the mixture had a skeleton gap structure. When the mass fraction ( q f ) of the phosphorus tailing was in the range of 23%–27% and λ ≈ 1 (λ at 0.9–1.1), the phosphorus tailing almost filled the porosity formed by the coarse aggregate, and the mixture had a skeleton-dense structure. When the mass fraction ( q f ) of the phosphorus tailing was > 27% and λ was > 1.1, the coarse aggregate particles were suspended in the phosphorus tailing system. At this moment, the mixture was based on λ and had a suspension-dense structure. The reason for the difference between the two is that, for the filling coefficient λ, when being calculated, Vca had a fixed value, which was the minimum porosity of the optimal main skeleton (such as 30.44% in this system), but in fact, when the coarse aggregate was suspended, the porosity among the coarse aggregates became larger, and the corresponding porosity was no longer the minimum value. From this perspective, the calculation results of the discrete element model are more accurate.

4.3. Road Performance Analysis of Phosphorus Tailing–Graded Waste Rock Mixtures with Different Structural Types

For a further comparative analysis of the different mass fractions ( q f ) for the road performance of the different mixture structure types of phosphorus tailing, a heavy compaction test was carried out in accordance with JTG/T F20-2015, and the results are shown in Figure 11.
The CBR test was conducted under 98% compactness. The expansion value of the three structural types of phosphorus tailing–graded waste rock mixtures was 0, and the CBR value results are shown in Figure 12. From Figure 12, it can be seen that with the increase in the mass fraction ( q f ) of the phosphorus tailing, the structure type of the mixture changed from the skeleton-void type to the skeleton-dense type, and finally, to the suspension-dense type. The CBR value of the mixture increased at first and then decreased. It is especially worth noting that when the mass fraction of the phosphorus tailing ( q f ) was at 23–30%, the CBR value of the skeleton-dense type met the requirements outlined in JTG/T F20-2015 that the CBR strength of graded waste rock material in extremely heavy expressways must be greater than 200, and the CBR of the skeleton-dense-type mixture was significantly better than that of the skeleton-void and the suspension-dense types. The reason for this is that the mixture with a skeleton-void structure was not closely connected but was in a loose state, meaning the mixture could not effectively bear pressure. The coarse aggregate with a suspension-dense structure could not be embedded or occluded, meaning the coarse aggregate contributed little to the strength and could not maximize the bearing capacity and strength of the mixture; however, the coarse aggregates in the skeleton-dense structure were embedded with each other to form the skeleton structure, and the gap of the coarse aggregate was filled with fine-aggregate phosphorus tailing. The filling effect was optimized and displayed good internal friction, meaning the skeleton-dense phosphorus tailing gravel mixture displayed the best compression resistance and bearing capacity.
In summary, the essential characteristics and internal laws of phosphorus tailing–graded waste rock mixtures are closely related to the gradation of the mixtures. It was shown that the main skeleton of coarse aggregate in the mixture has the ability to resist and transmit external load stress. In the suspension-dense mixture, too much phosphorus tailing makes the impaction of the main skeleton of the mixture open, meaning the coarse aggregate is suspended in the mixture and the contact stress transmission between the coarse aggregates is interrupted; hence, the transmission path is short and imperfect. The filling effect of the phosphorus tailing in these mixtures is also particularly important. In the skeleton-void-type mixture, porosity is unevenly distributed, which means it is easy to reduce the embedding and biting capacity of the main skeleton, the local damage affects the integrity of the mixture, and the ability to bear load is weakened; however, the coarse aggregate skeleton structure of the skeleton-dense mixture is complete, and the stress-transferring capacity is strong. The use of appropriate phosphorus tailing can improve the binding force and stability of the main skeleton so as to make the mixture more resistant to loads.

5. Conclusions

(1)
Combined with the graded mixing method and the concept of equivalent particle size, a discrete element model was established to design the gradation of phosphorus tailing–gravel mixtures. When the coarse aggregate M1 (19–31.5 mm):M2 (9.5–19 mm):M3 (4.75–9.5 mm) was 21:49:30, the main skeleton of the mixture formed the closest embedded structure, and the minimum porosity was 30.44%.
(2)
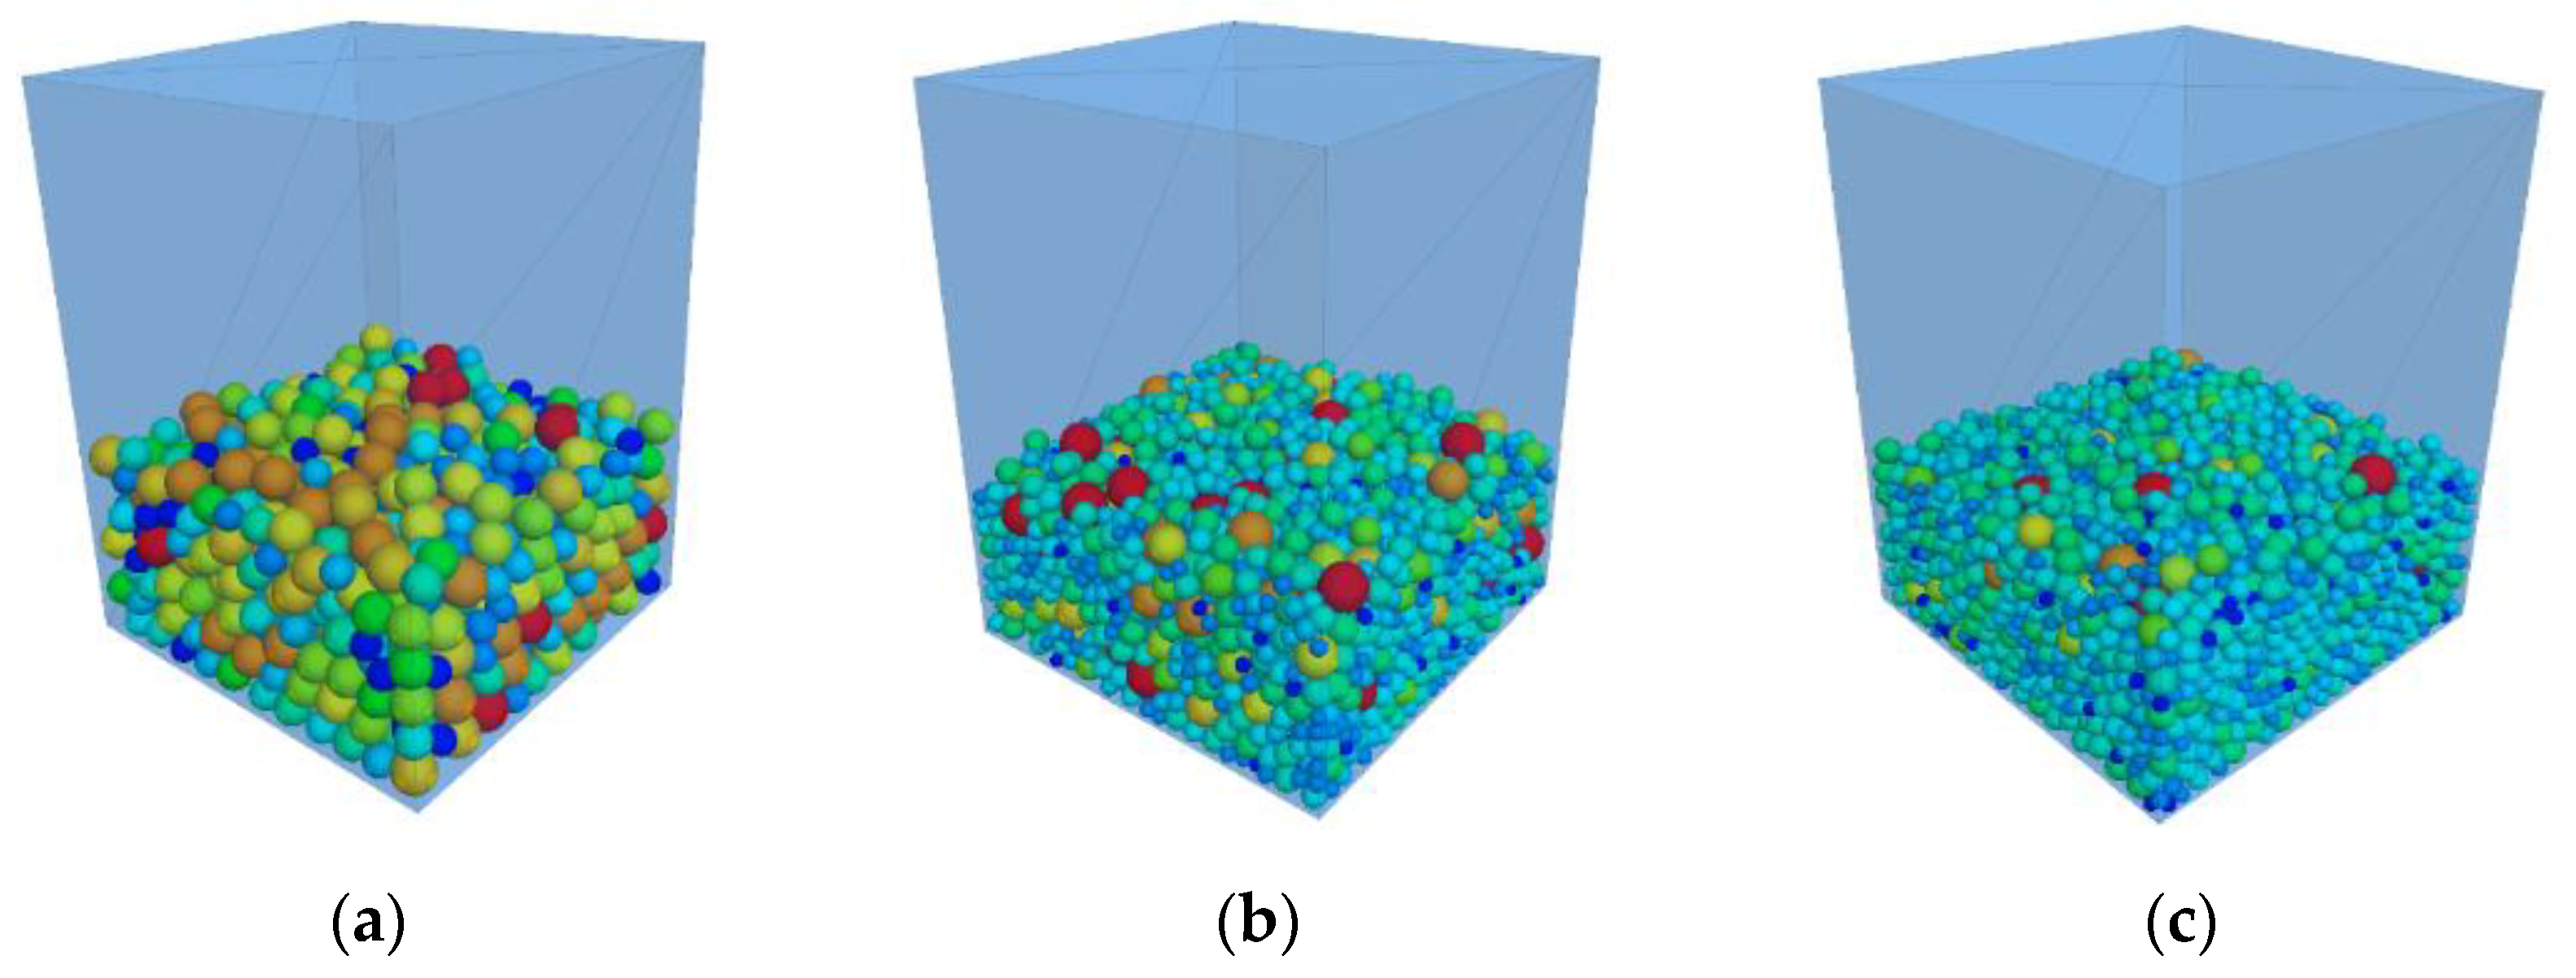
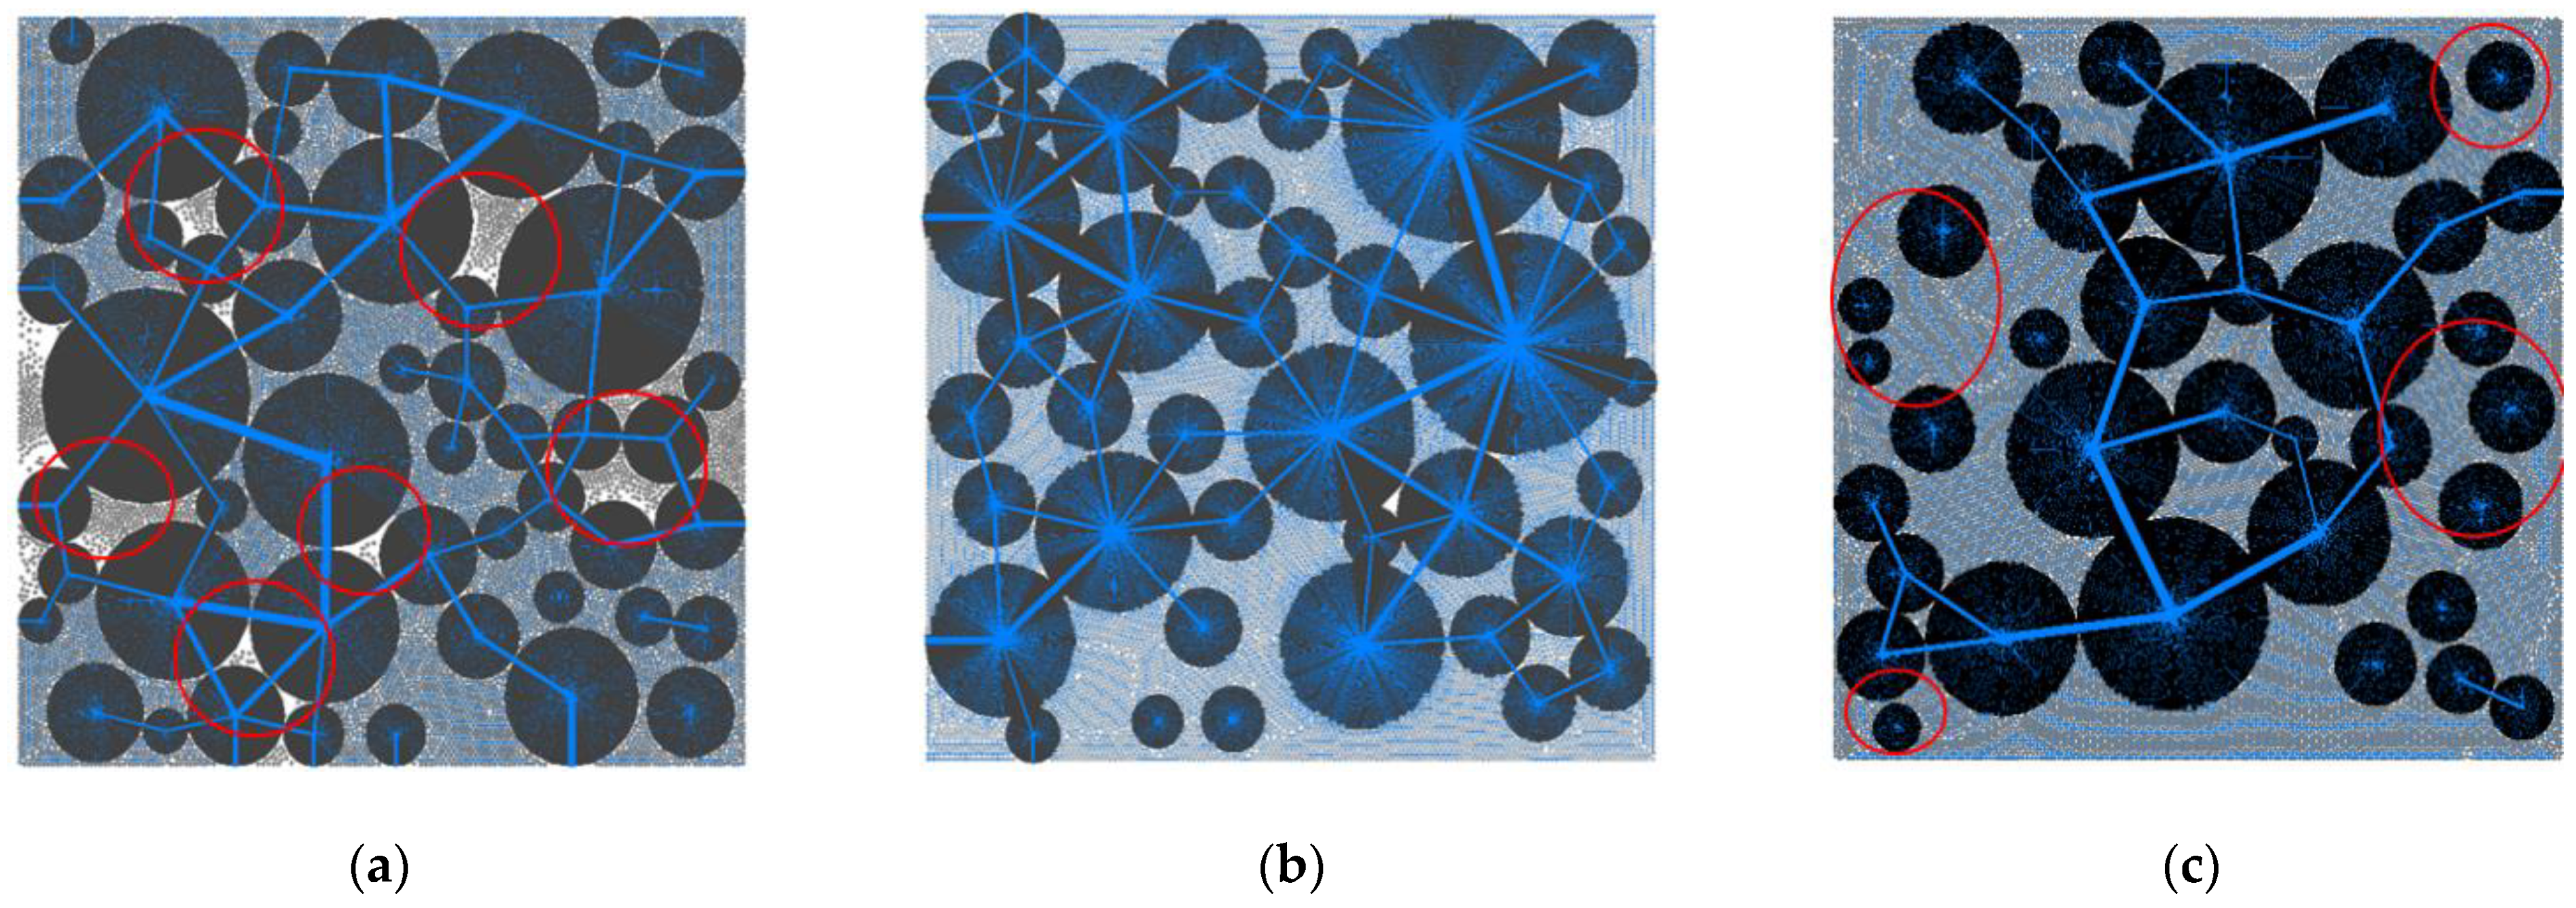
The discrete element model and filling coefficient λ of the phosphorus tailing–graded waste rock mixture were established. It was verified that when the mass fraction ( q f ) of the phosphorus tailing is less than 23%, the mixture of phosphorus tailing–graded waste rock has a skeleton-void structure; when the mass fraction ( q f ) of the phosphorus tailing is in the range of 23%–30%, the mixture of phosphorus tailing–graded waste rock has a skeleton-dense structure; when the mass fraction ( q f ) of the phosphorus tailing is greater than 30%, the mixture of phosphorus tailing–graded waste rock has a suspension-dense structure.
(3)
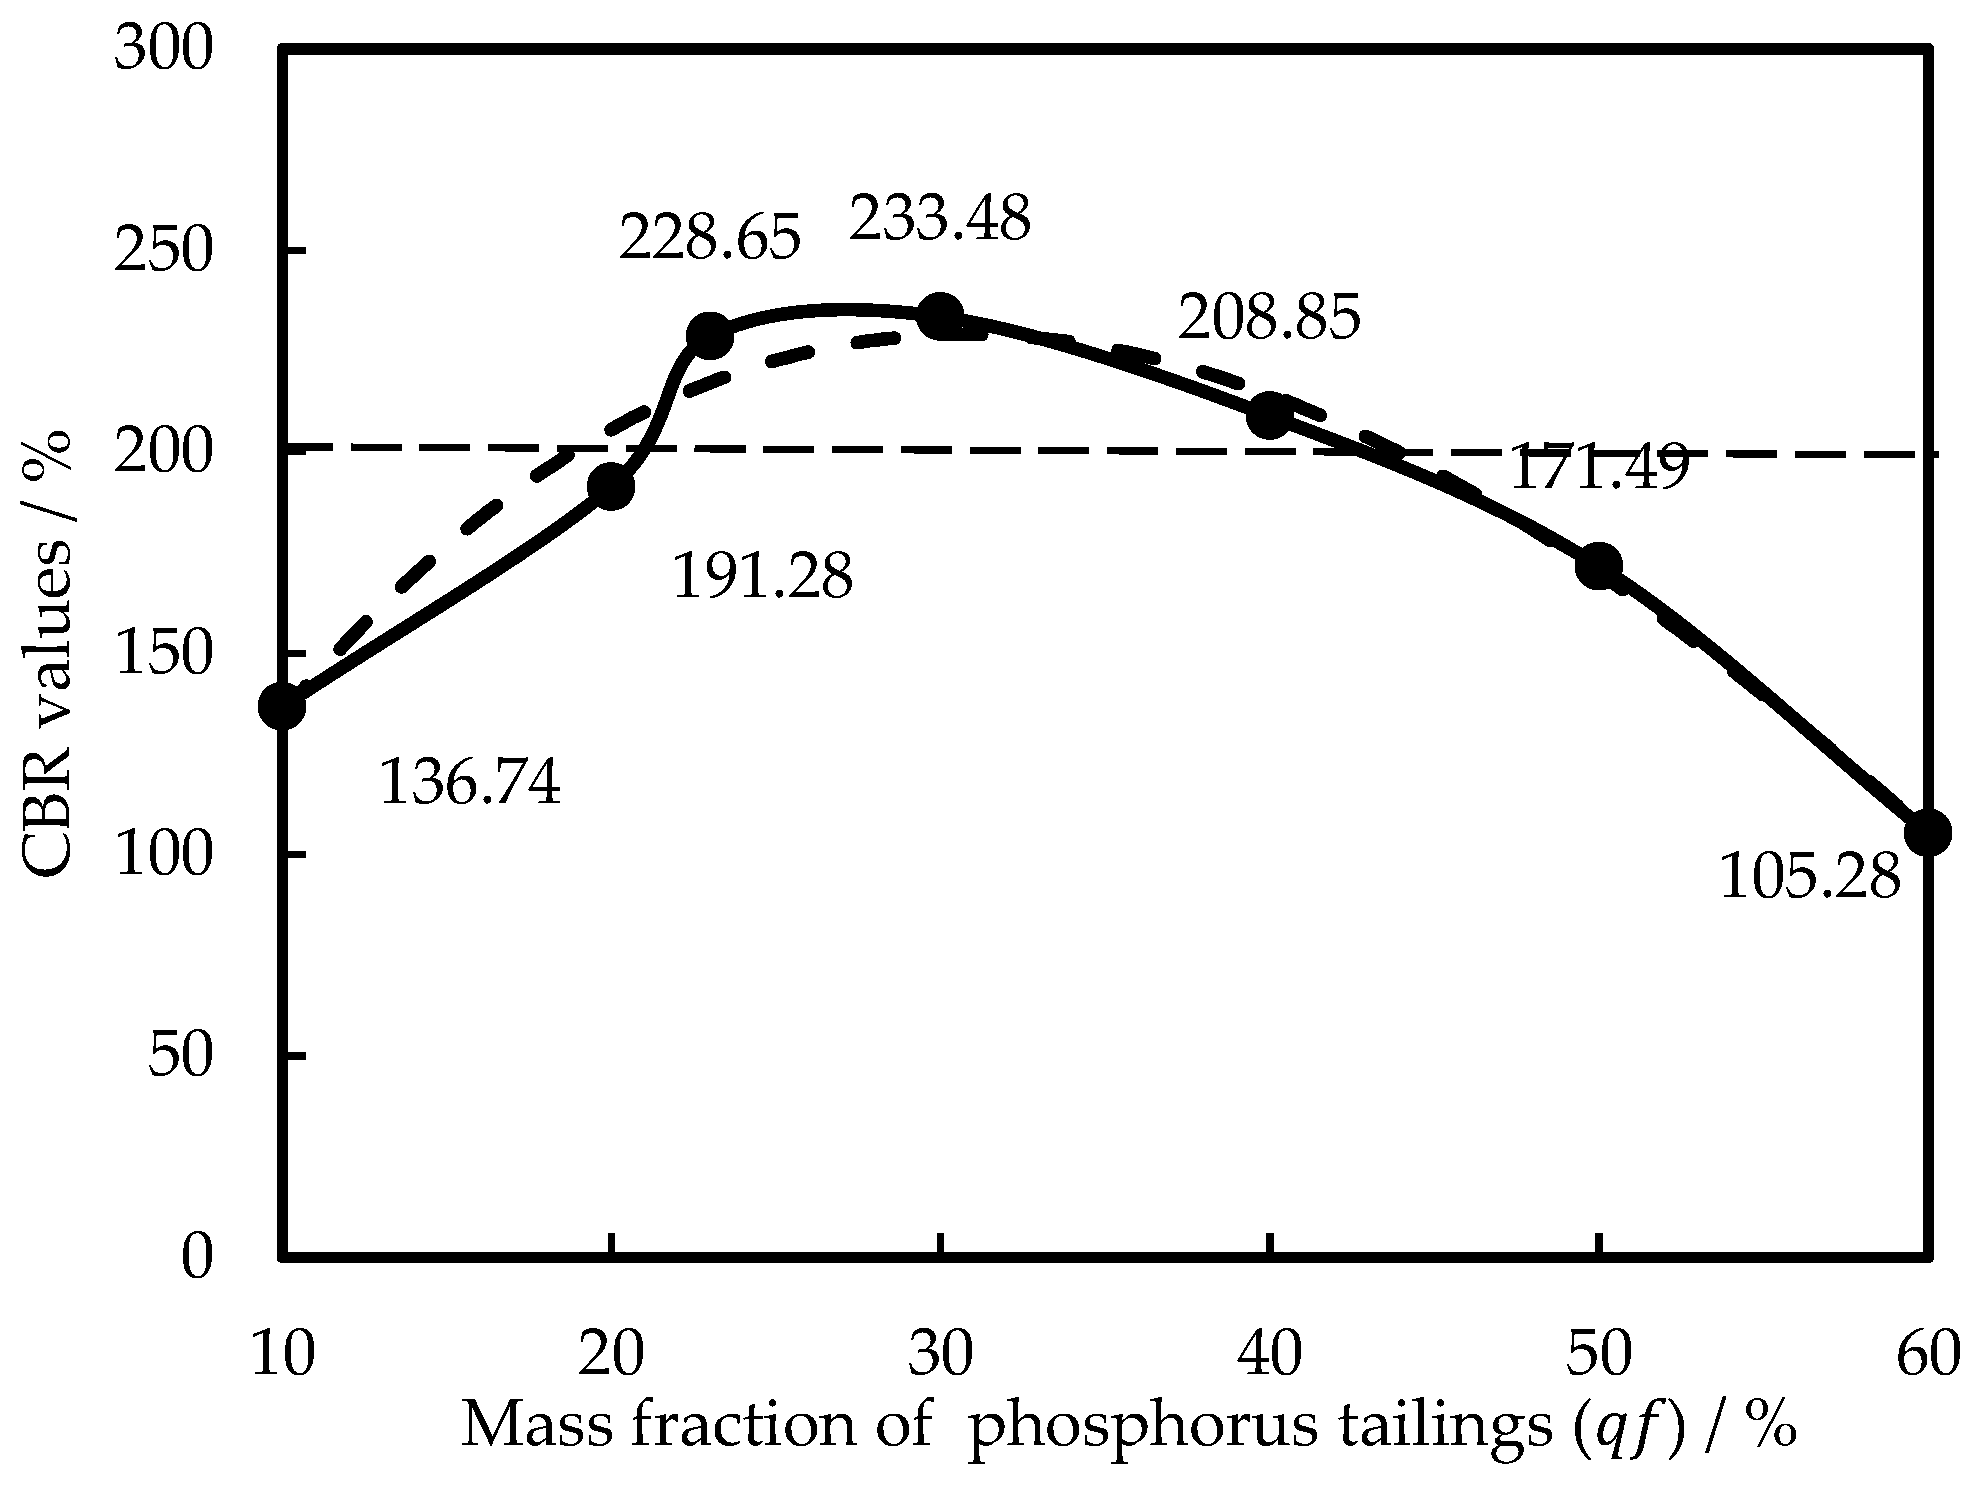
A suitable combination of phosphorus tailing and graded waste rock was used to improve the soil properties of phosphorus tailing. It was shown that the skeleton-dense phosphorus tailing–graded waste rock mixture had the best CBR value. The phosphorus tailing–graded waste rock mixture with improved performance can be used in subgrade filling.

Author Contributions

Conceptualization, Q.Z. (Qinglin Zhao); methodology, Z.L., J.L. and Q.Z. (Qinglin Zhao); software, Z.L.; validation, Q.Z. (Qinglin Zhao); investigation, Z.L., J.L., J.W. and Q.Z. (Qinggang Zhang); data curation, Z.L. and T.L.; writing—original draft preparation, Z.L. and Q.Z. (Qinglin Zhao); writing—review and editing, Z.L. and Q.Z. (Qinglin Zhao). All authors have read and agreed to the published version of the manuscript.

Funding

This research study was supported by the Department of Science and Technology of Guizhou Province, Local Science and Technology Development Foundation Project under the guidance of the Central Committee (Project No.[2021] 4035).

Data Availability Statement

Not applicable.

Conflicts of Interest

The authors declare no conflict of interest.

References

  1. Yang, Y.H.; Wei, Z.A.; Chen, Y.L.; Li, Y.J.; Li, X.Y. Utilizing phosphate mine tailings to produce ceramisite. Constr. Build Mater. 2017, 155, 1081–1090. [Google Scholar] [CrossRef]
  2. Moukannaa, S.; Loutou, M.; Benzaazoua, M.; Vitola, L.; Alami, J.; Hakkou, R. Recycling of phosphate mine tailings for the production of geopolymers. J. Clean. Prod. 2018, 185, 891–903. [Google Scholar] [CrossRef]
  3. Zheng, K.R.; Zhou, J.; Gbozee, M. Influences of phosphate tailings on hydration and properties of Portland cement. Constr. Build. Mater. 2015, 98, 593–601. [Google Scholar] [CrossRef]
  4. Chen, Q.S.; Zhang, Q.L.; Fourie, A.; Chen, X. Utilization of phosphogypsum and phosphate tailings for cemented paste backfill. J. Environ. Manag. 2017, 201, 19–27. [Google Scholar] [CrossRef]
  5. Ren, Y.; Shao, J. Study and application of clay modified phosphorus tailings used as embankment filler. Highway 2018, 63, 46–49. [Google Scholar]
  6. Liu, Z.Q.; Huang, W.; Wang, J.W. Test Study on application of LWK as materials of pavement base. J. Highw. Transp. Res. Dev. 2003, 2, 7–11. [Google Scholar]
  7. Michael, C.; Thanakorn, P. Effect of sand, fly ash, and coarse aggregate gradation on preplaced aggregate concrete studied through factorial design. Constr. Build. Mater. 2015, 93, 812–821. [Google Scholar]
  8. Mehdi, K.; Alireza, A. Assessment of drainage and filtration of sub-ballast course considering effect of aggregate gradation and subgrade condition. Transp. Geotech. 2020, 24, 84–95. [Google Scholar]
  9. Cai, X.; Wu, K.H.; Huang, W.H.; Wan, C. Study on the correlation between aggregate skeleton characteristics and rutting performance of asphalt mixture. Constr. Build. Mater. 2018, 179, 294–301. [Google Scholar] [CrossRef]
  10. Ashraf, W.B.; Noor, M.A. Performance-evaluation of concrete properties for different combined aggregate gradation approaches. Procedia Eng. 2011, 14, 2627–2634. [Google Scholar] [CrossRef] [Green Version]
  11. Herndon, D.A.; Xiao, F.P.; Amirkhanian, S.; Wang, H. Investigation of Los Angeles value and alternate aggregate gradations in OGFC mixtures. Constr. Build. Mater. 2016, 110, 278–285. [Google Scholar] [CrossRef]
  12. Huang, Z.M.; Xiao, M.; Peng, B.; Yu, X.L.; Zhu, Y.T. Study on performance of cement stabilized macadam based on filling coefficient of fine aggregate. Highway 2017, 62, 29–35. [Google Scholar]
  13. Yu, H.J.; Liu, H.L.; Hang, Y.J.; Liu, J.H.; Ma, S.Q. Deformation and failure mechanism of weakly cemented mudstone under Tri-Axial compression: From laboratory tests to numerical simulation. Minerals 2022, 12, 153. [Google Scholar] [CrossRef]
  14. Gong, F.Y.; Zhou, X.D.; You, Z.P.; Liu, Y.; Chen, S.Y. Using discrete element models to track movement of coarse aggregates during compaction of asphalt mixture. Constr. Build. Mater. 2018, 189, 338–351. [Google Scholar] [CrossRef]
  15. Zhang, Y.; Ma, T.; Ding, X.H.; Chen, T.; Huang, X.M.; Xu, G.J. Impacts of air-void structures on the rutting tests of asphalt concrete based on discretized emulation. Constr. Build. Mater. 2018, 166, 334–344. [Google Scholar] [CrossRef]
  16. Yang, S.Q.; Tian, W.L.; Huang, Y.H. Failure mechanical behavior of pre-holed granite specimens after elevated temperature treatment by particle flow code. Geothermics 2018, 72, 124–137. [Google Scholar] [CrossRef]
  17. Yoon, J. Application of experimental design and optimization to PFC model calibration in uniaxial compression simulation. Int. J. Rock Mech. Min. Sci. 2007, 44, 871–889. [Google Scholar] [CrossRef]
  18. Zhou, S.; Zhu, H.H.; Yan, Z.J.; Ju, J.W.; Zhang, L.Y. A Micromechanical study of the breakage mechanism of microcapsules in concrete using PFC2D. Constr. Build. Mater. 2016, 115, 452–463. [Google Scholar] [CrossRef]
  19. Ding, X.H.; Ma, T.; Gao, W. Morphological characterization and mechanical analysis for coarse aggregate skeleton of asphalt mixture based on discrete-element model. Constr. Build. Mater. 2017, 154, 1048–1061. [Google Scholar] [CrossRef]
  20. Ma, T.; Zhang, D.Y.; Zhang, Y.; Hong, J.X. Micromechanical response of aggregate skeleton within asphalt mixture based on virtual simulation of wheel tracking test. Constr. Build. Mater. 2016, 111, 153–163. [Google Scholar] [CrossRef]
  21. Zhang, J.H.; Li, J.; Yao, Y.S.; Zheng, J.L.; Gu, F. Geometric anisotropy modeling and shear behavior evaluation of graded crushed rocks. Constr. Build. Mater. 2018, 183, 346–355. [Google Scholar] [CrossRef]
  22. Tan, B.; Yang, T. Analysis of deformation law of large-size graded crushed stone under cyclic rotating axial pressure. J. Highw. Transp. Res. Dev. 2021, 38, 19–27. [Google Scholar]
  23. Gao, F.N.; Zhou, X.; Zhao, Z.X.; Bai, F.C.; Deng, X.P. Research on design and construction technology of CFB fly ash as subgrade material. Highway 2021, 66, 145–149. [Google Scholar]
  24. Liu, Z.D.; Li, J.Q.; Liu, T.H.; Zhang, Q.G.; Zhao, Q.L.; Wang, J.C. Study on stabilizing phosphorus tailings waste rock pavement base material with cement phosphorus slag powder. J. Wuhan Univ. Technol. 2021, 43, 19. [Google Scholar]
  25. Zhang, W.T.; Lv, Z.G.; Wang, H. The study on the engineering characteristics of silty soil as subgrade filling material. Shanxi Archit. 2019, 45, 1–2. [Google Scholar]
  26. Wang, M.P. Discussion on engineering characteristics of alluvial silt by the Yellow River in Huai’an. Geotech. Investig. Surv. 2012, 40, 16–20. [Google Scholar]
  27. Ministry of Transport of the People’s of China. Technical Guidelines for Construction of Highway Roadbases (JTG/T F20-2015); China Communications Press Co., Ltd.: Beijing, China, 2015; pp. 6–7, 27–29.
  28. Shi, L.W.; Wang, D.Y.; Xu, C.; Wu, L.L. Design of skeleton compact asphalt mixture based on discrete element method. Highway 2015, 60, 200–206. [Google Scholar]
  29. Ministry of Housing and Urban-Rural Development of the People’s Republic of China. Standard for Technical Requirements and Test Method of Sand and Crushed Stone (or Gravel) for Ordinary Concrete (JGJ 52-2006); China Architecture & Building Press: Beijing, China, 2006; pp. 59–61.
  30. Jia, W.B. Gradation design of ATB-30 asphalt gravel mixture based on discrete element method. Shanxi Transp. Sci. Technol. 2020, 3, 47–50. [Google Scholar]
  31. Yao, L.Y.; Ma, Q.; He, Z.M. OGFC aggregate gradation design based on discrete element theory. J. Beijing Univ. Technol. 2013, 39, 902–908. [Google Scholar]
  32. Ling, T.Q.; Yang, Y.L.; Zhao, C.; Zhu, T.Q.; Chen, Q.Q. Research on design of low void ratio asphalt mixture based on PFC3D. J. Chongqing Jiaotong Univ. 2020, 39, 73–80. [Google Scholar]
  33. Jiao, D.W.; Shi, C.J.; An, X.P.; Liu, Y.; He, F.Q. Optimization of coarse aggregate gradation based on rheological behavior. Bull. Chin. Ceram. Soc. 2017, 4, 1064–1070. [Google Scholar]
  34. Zhang, X.N.; Wang, S.H.; Wu, G.H. CAVF method for asphalt mixture composition design. Highway 2001, 12, 17–20. [Google Scholar]
  35. Chen, Q.C.; Wang, L.; Wang, D.Y. Study on pavement performance of lime-fly ash micro-bonded graded aggregates. J. Highw. Transp. Res. Dev. 2009, 26, 31–35. [Google Scholar]
Figure 1. Particle size distribution of phosphorus tailing.
Minerals 12 00573 g001
Figure 2. Particle size distribution of waste rock.
Minerals 12 00573 g002
Figure 3. Formation of mixture particles.
Minerals 12 00573 g003
Figure 4. Balance of mixture.
Minerals 12 00573 g004
Figure 5. Calculation of porosity of mixture.
Minerals 12 00573 g005
Figure 6. Schematic diagram of 19–31.5 mm aggregate and 9.5–19 mm aggregate in different mass proportions. (a) M1:M2 = 100:0, (b) M1:M2 = 30:70, (c) M1:M2 = 0:100.
Minerals 12 00573 g006
Figure 7. Fitting results of 19–31.5 mm aggregate and 9.5–19 mm aggregate porosity in different mass proportions.
Minerals 12 00573 g007
Figure 8. Schematic diagram of 9.5–31.5 mm aggregate and 4.75–9.5 mm aggregate in different mass ratios. (a) (M1 + M2):M3 = 100:0, (b) (M1 + M2):M3 = 70:30, (c) (M1 + M2):M3 = 80:20.
Minerals 12 00573 g008
Figure 9. Fitting results of void ratio of 9.5–31.5 mm aggregate and 4.75–9.5 mm aggregate in different mass ratios.
Minerals 12 00573 g009
Figure 10. Element model of phosphorus tailing–graded waste rock mixture. (a) q f < 23%, (b) 23% <   q f < 30%, (c) 30% < q f .
Minerals 12 00573 g010
Figure 11. Heavy compaction results of phosphorus tailing–graded waste rock mixture.
Minerals 12 00573 g011
Figure 12. Value of mixture with different mass fractions of phosphorus tailing.
Minerals 12 00573 g012
Table 1. Technical characteristics of graded waste rock.
Crushing Value/wt%Apparent Density/kg/m3Stone Powder Content/wt%Sediment Percentage/wt%
15.828500.30.3
Table 2. Application of λ to determine the structure type of phosphorus tailing–graded waste rock mixture.
q f Filling Factor λJudgeMixture Structure State
503.08λ > 1Suspension-dense structure
301.30 λ > 1Suspension-dense structure
271.10 λ ≈ 1Skeleton-dense structure
230.90λ ≈ 1Skeleton-dense structure
200.77λ < 1Skeleton-void structure
Publisher’s Note: MDPI stays neutral with regard to jurisdictional claims in published maps and institutional affiliations.

