Pilot Scale Validation of a Chemical Process for Uranium, Cesium, and Mercury Recovery from Cemented Radioactive Wastes
Abstract
:1. Introduction
2. Materials and Methods
2.1. Chemicals
2.2. Surrogate Cemented Radioactive Wastes
2.3. Leaching Experiment
2.4. Ion Exchange Experiment
2.5. Purification of Uranium via Precipitation and Calcination
2.6. Elemental Analysis
3. Results and Discussion
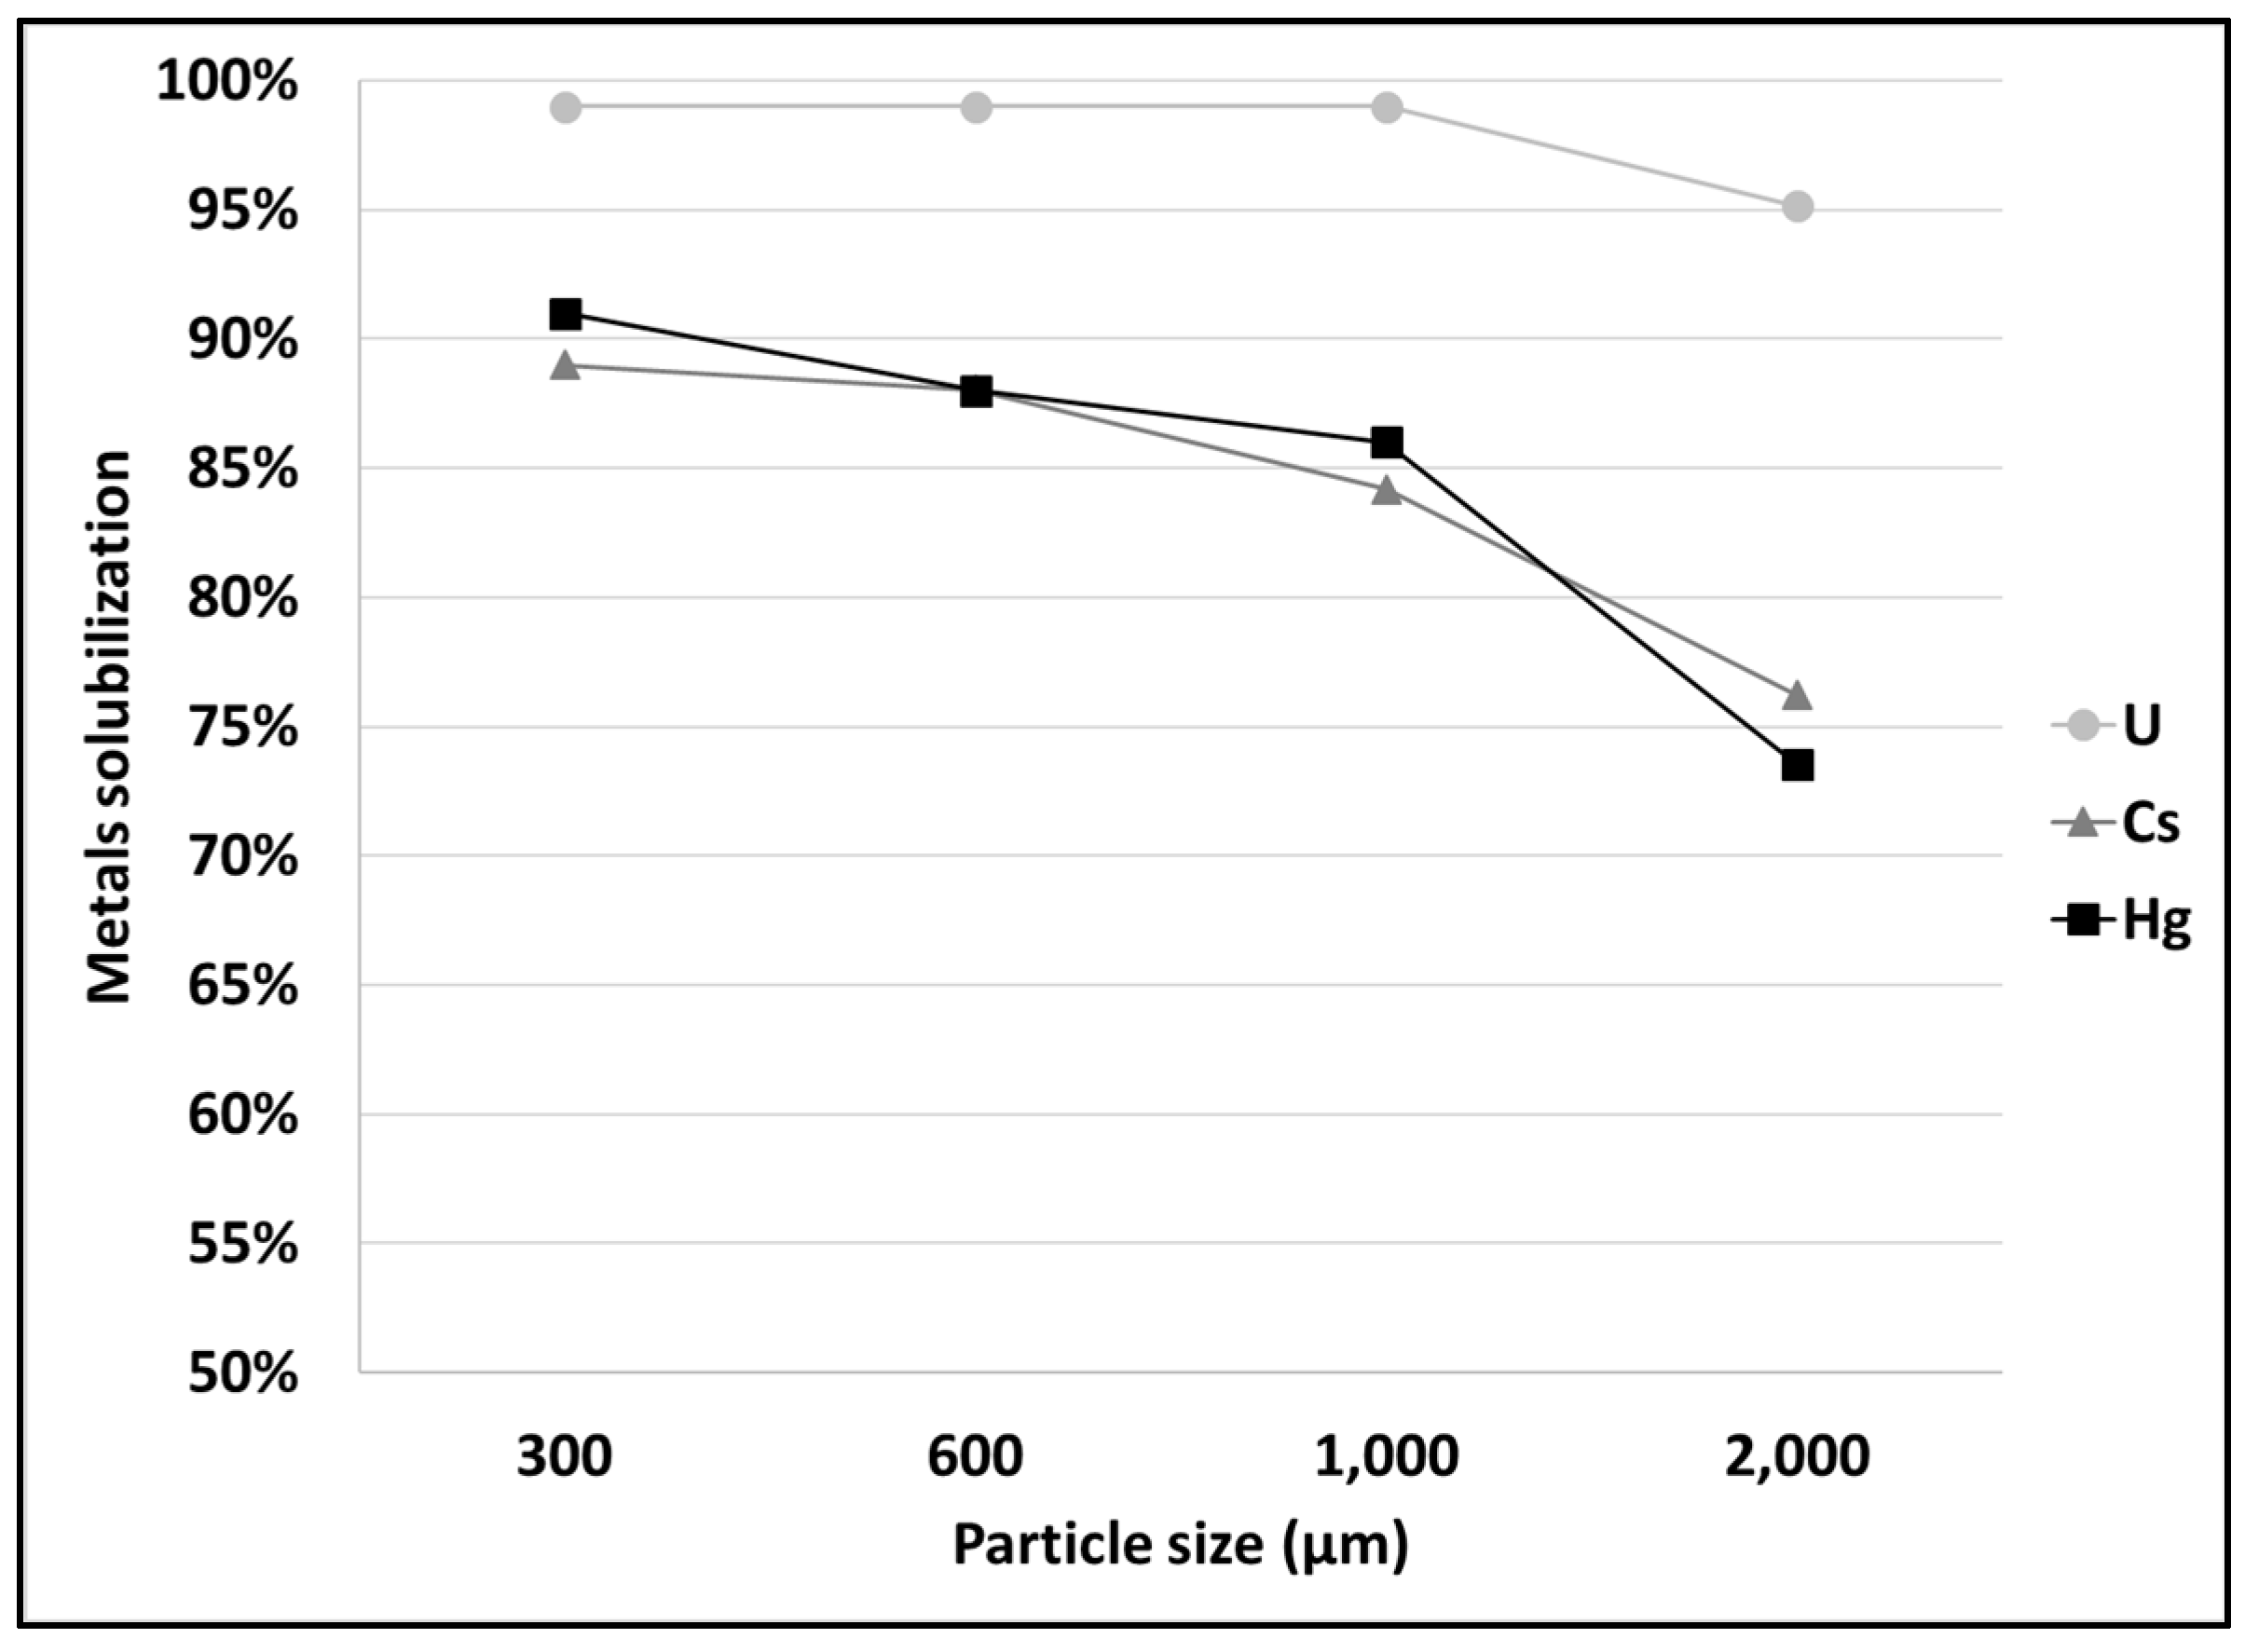
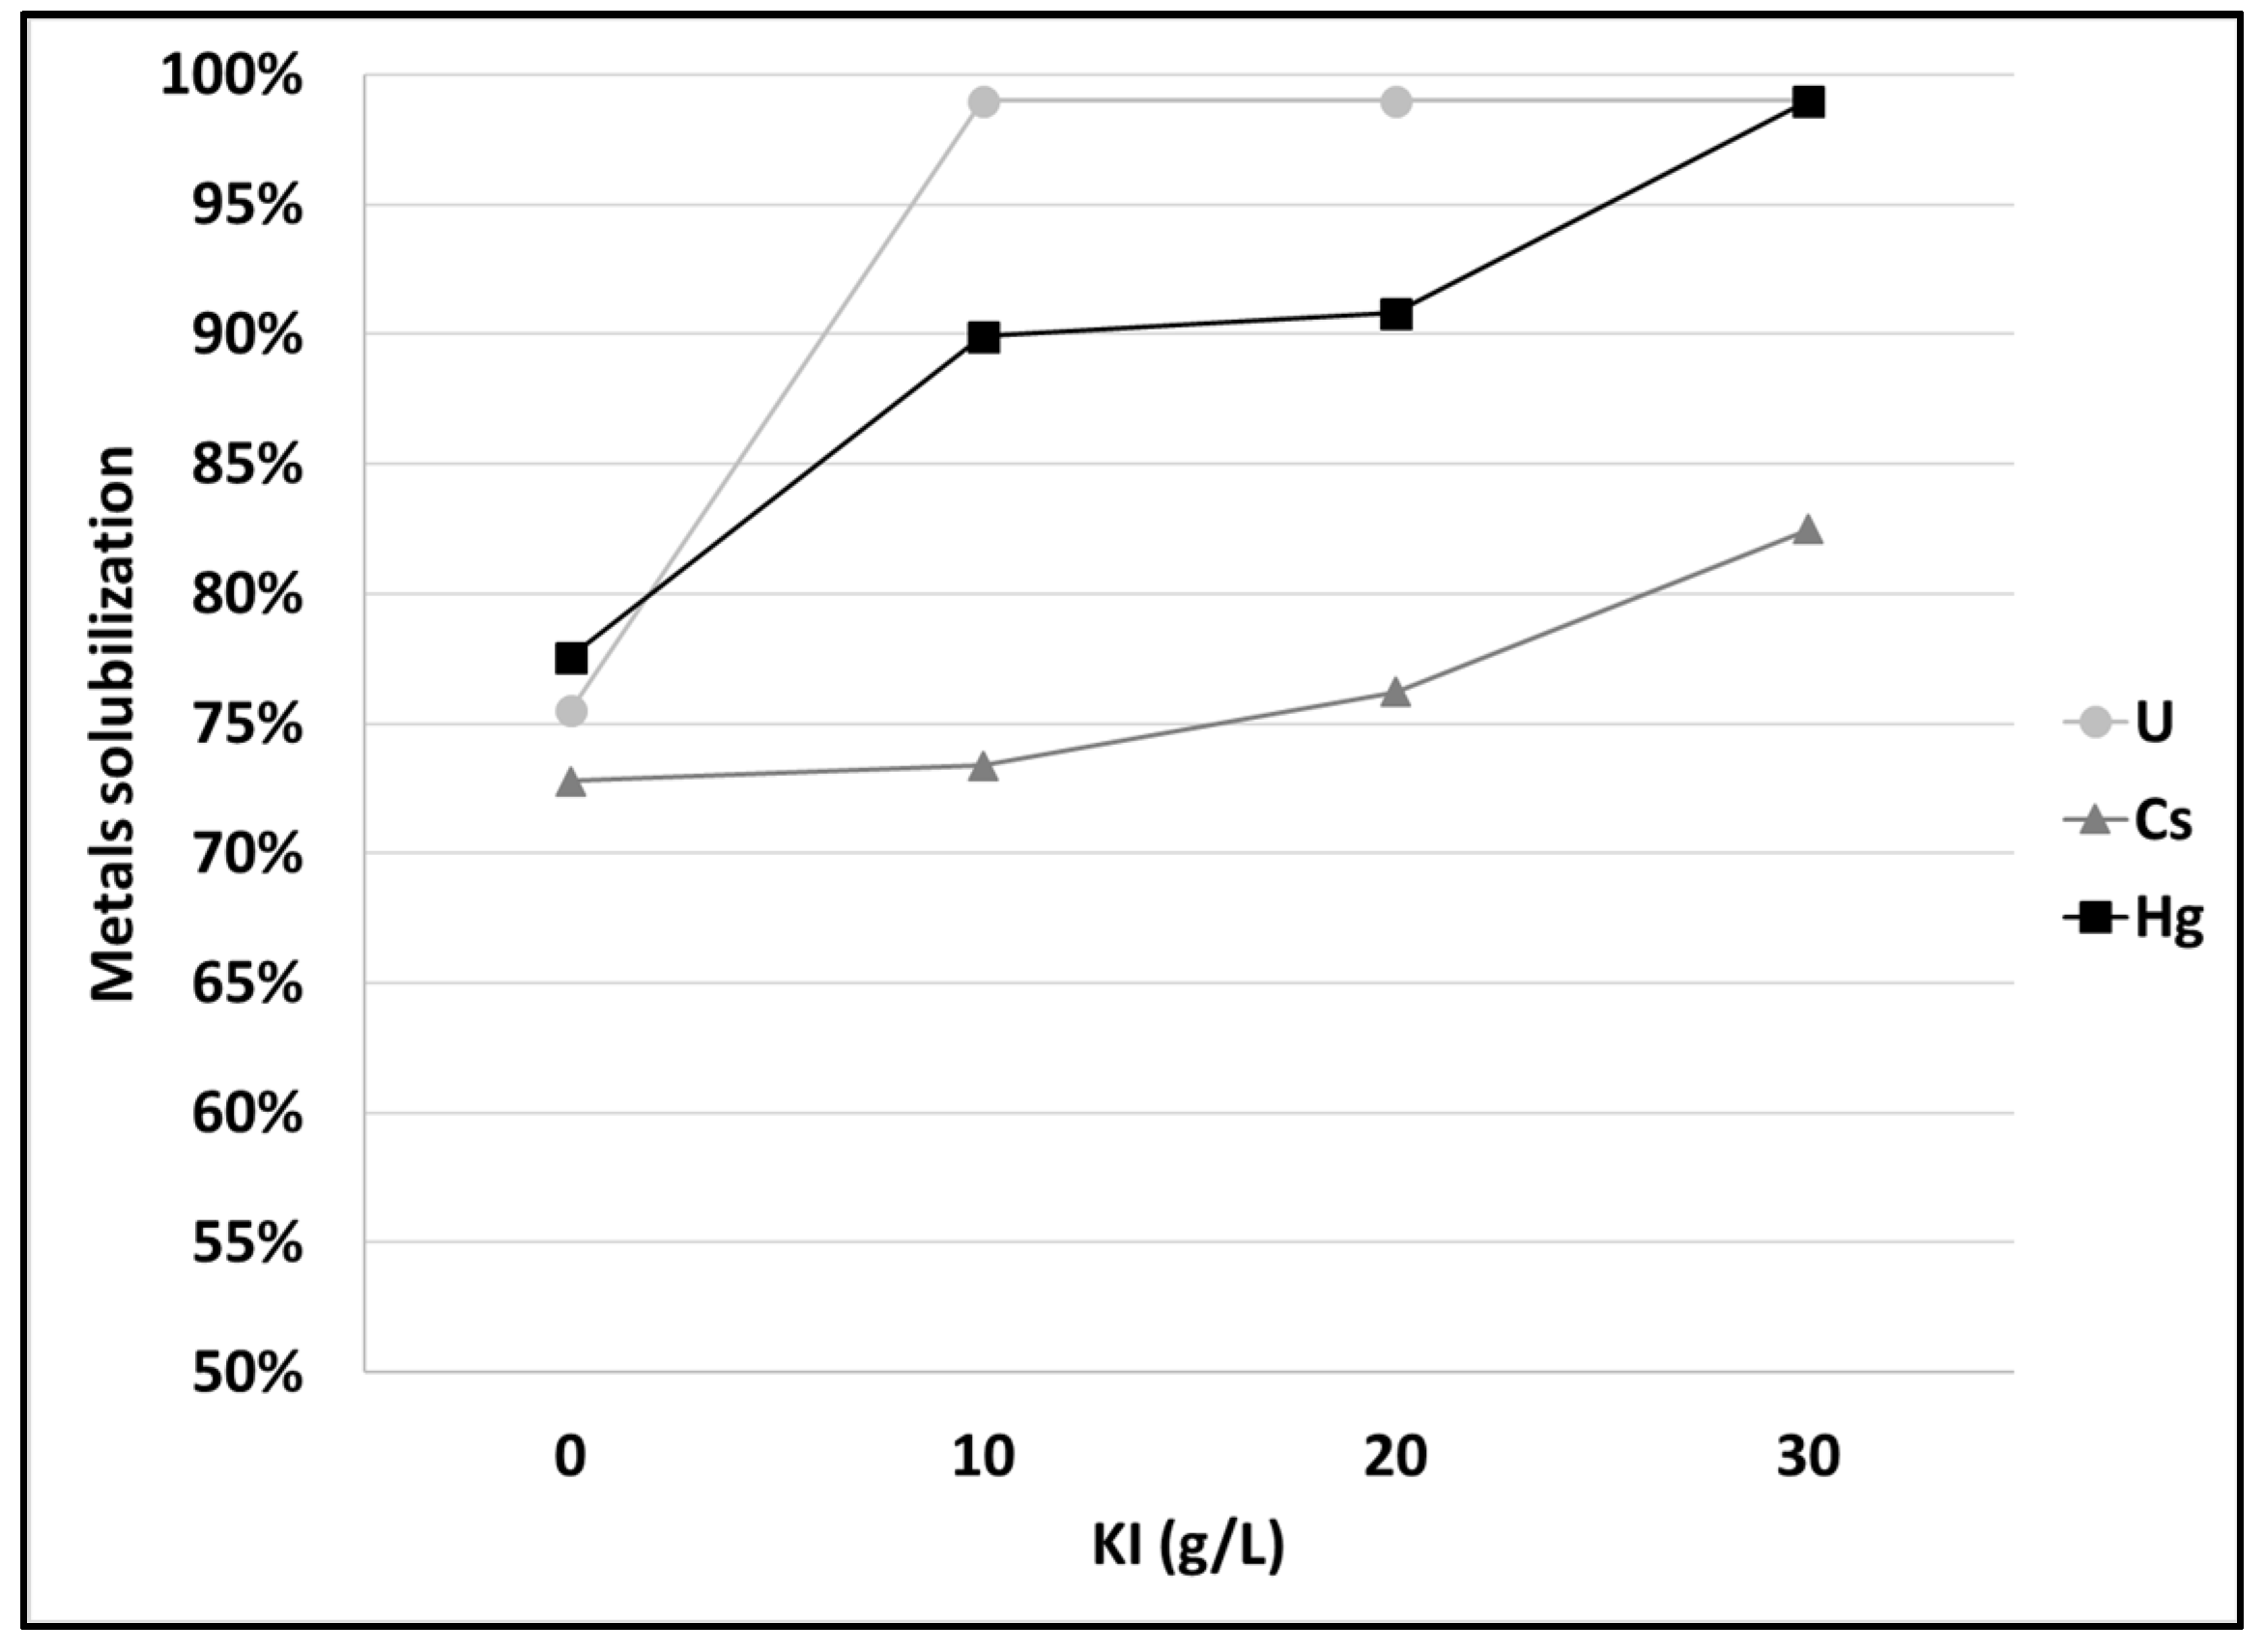
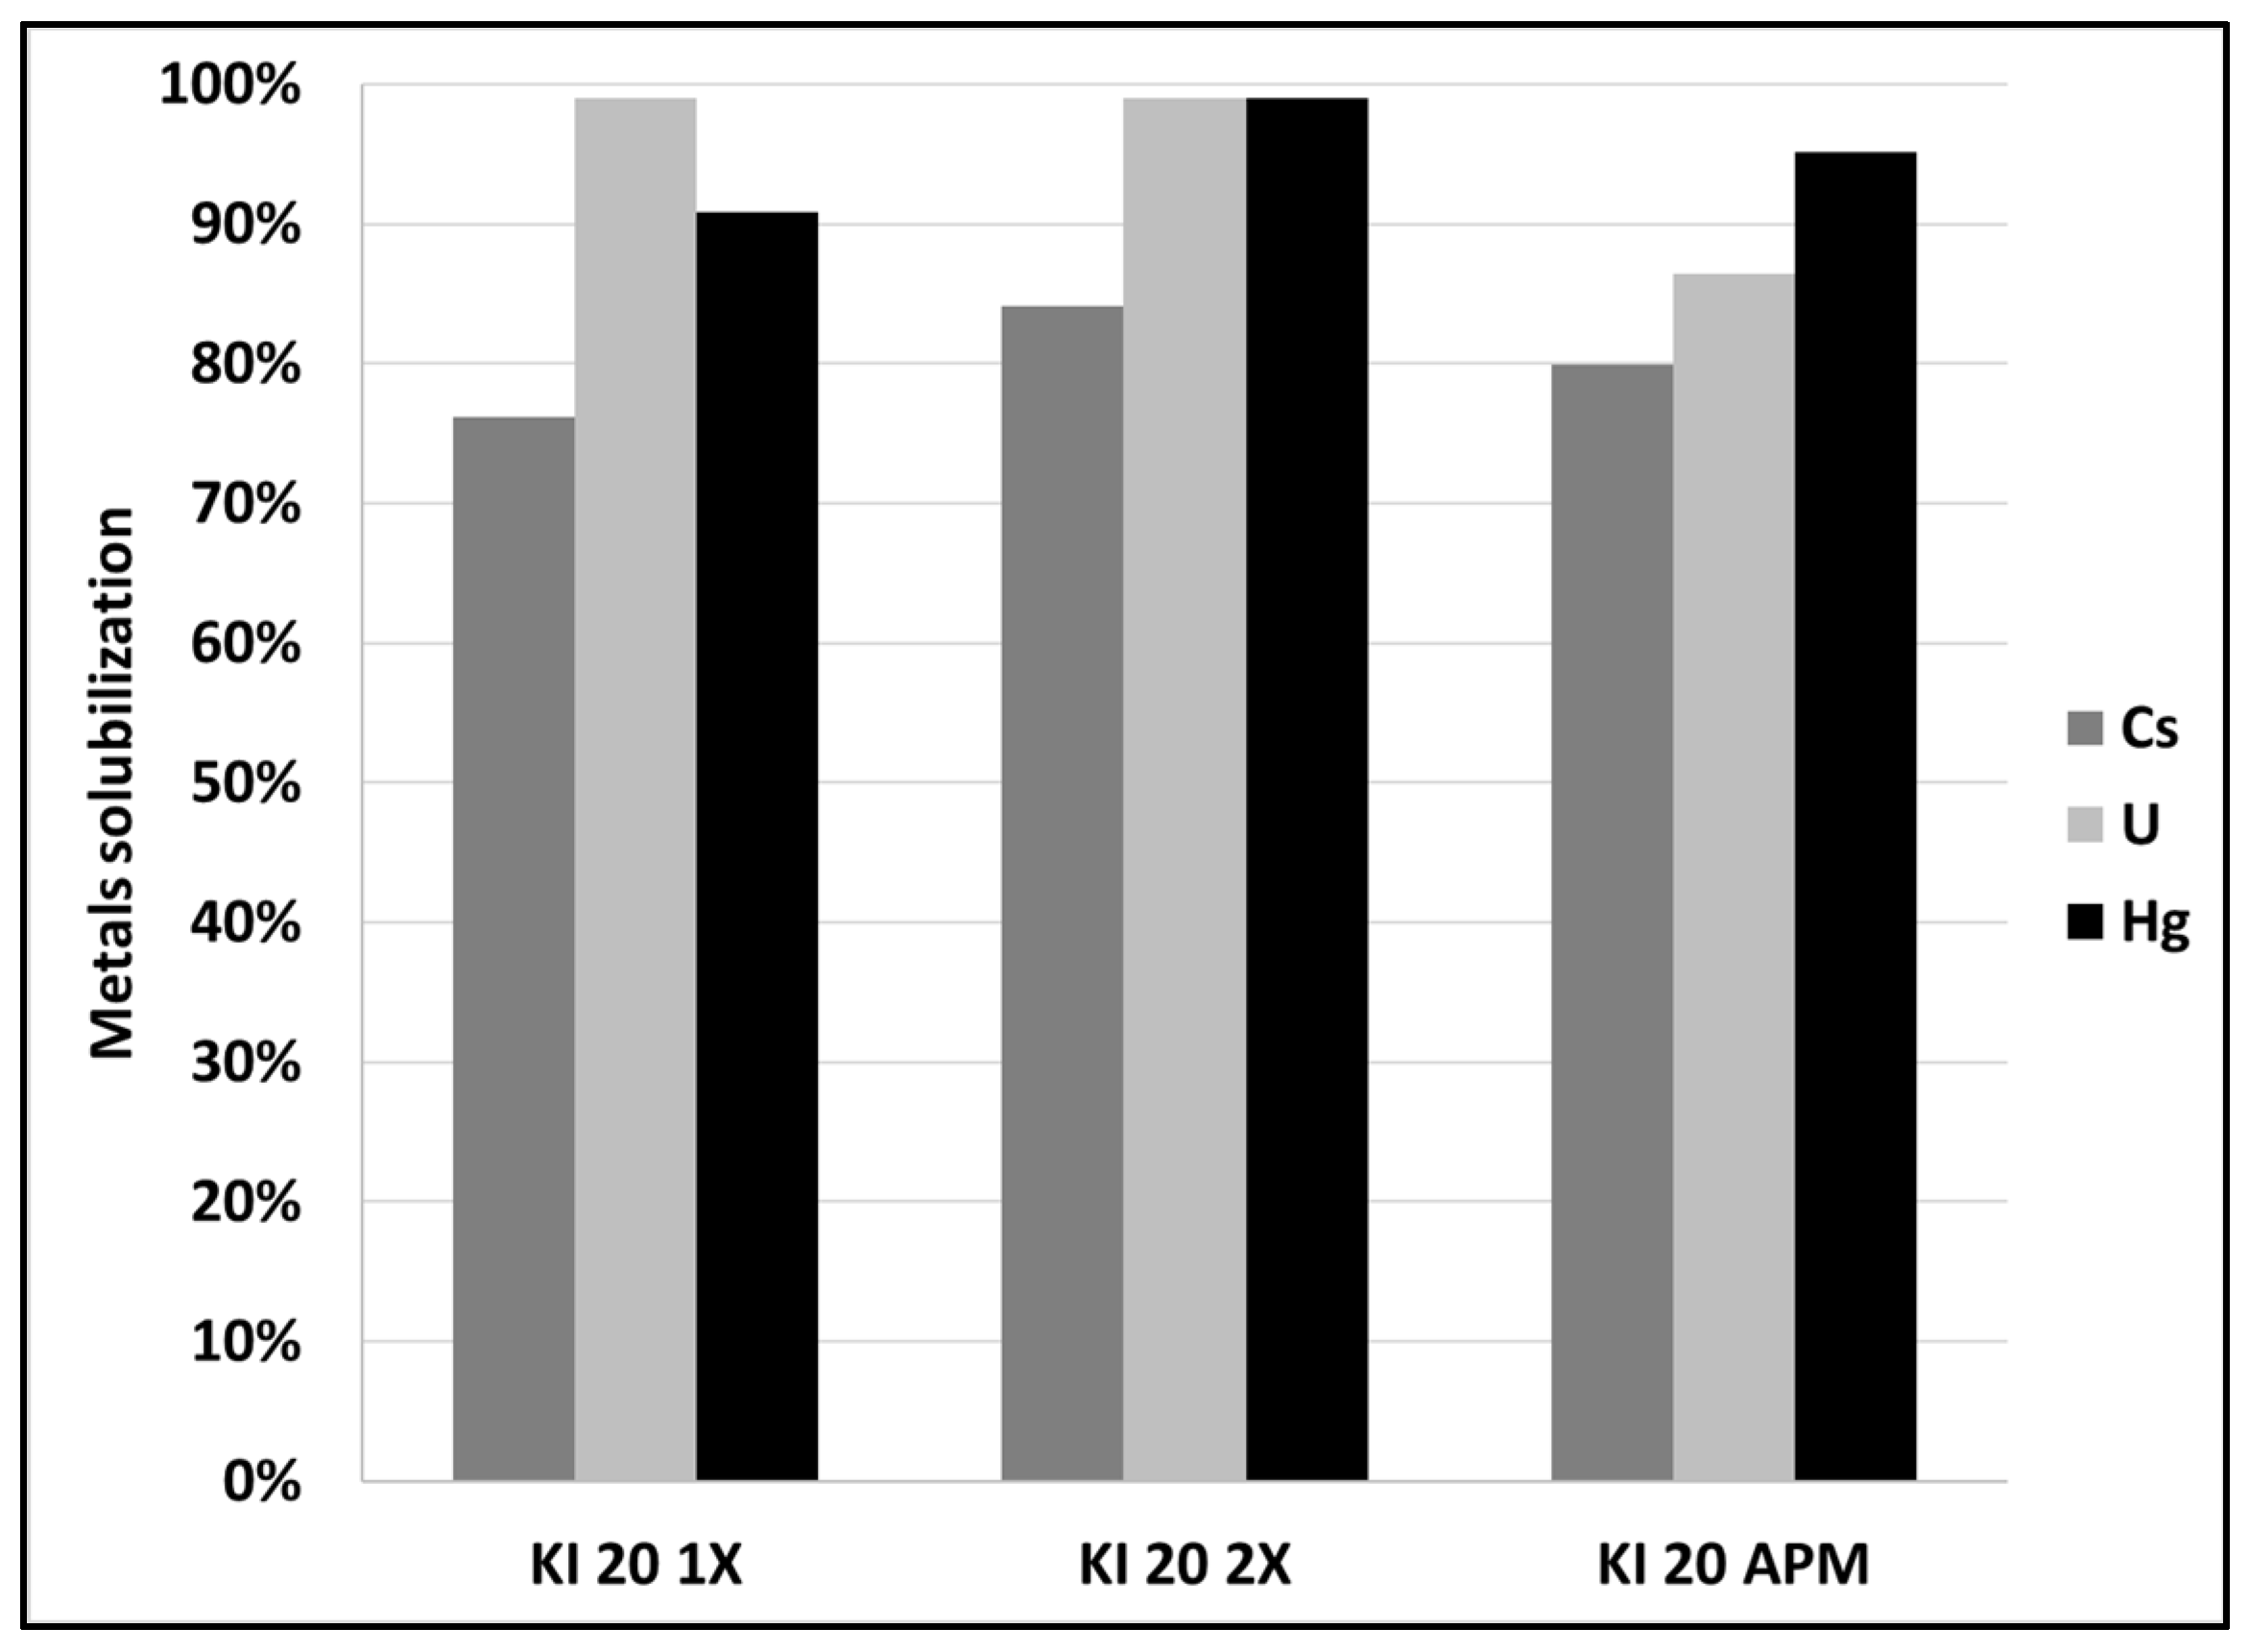
3.1. Leaching of SCRW at Pilot Scale
3.2. Mercury and Cesium Separation from SCRW Liquor at Lab Scale
3.3. Mercury and Cesium Separation from SCRW Liquor at Pilot Scale
3.4. Uranium Extraction and Elution at Pilot Scale
3.5. Uranium Precipitation and Characterization
4. Conclusions
Author Contributions
Funding
Data Availability Statement
Acknowledgments
Conflicts of Interest
References
- NRC. Committee on Medical Isotope Production without Highly Enriched Uranium, Nuclear and Radiation Studies Board, Division on Earth and Life Studies, National Research Council; National Academies Press: Washington, DC, USA, 2009; p. 220. [Google Scholar]
- Lemire, R.J.; Larouche, M.M.A.; Tosello, N.B. Scoping Studies on the Treatment of Cemented Waste from 99Mo Production; Technical report AECL-RC-1245; Atomic Energy of Canada Limited: Chalk River, ON, Canada, 1994. [Google Scholar]
- Bilodeau, A.; Bouzoubaâ, N.; Chevrier, R.; Kwong, Y.T.J.; Nkinamubanzi, P.C.; Riveros, P.A. Literature Review Related to Cemented Nuclear Wastes; CANMET-MMSL Report 07-061(CR); CanmetMINING: Ottawa, ON, Canada, 2008. [Google Scholar]
- Riveros, P.A. A Literature Survey of the Cement-Based Solidification/Stabilization of Radioactive Wastes Containing Cesium, Mercury and Uranium; CANMET-MMSL Report 10-016(CR); CanmetMINING: Ottawa, ON, Canada, 2010. [Google Scholar]
- Fiset, J.F.; Laviolette, C.; Bouzoubaâ, N. Commissioning and Operation of a Glove Box Enclosure to Produce Surrogate Radioactive Cemented Waste; CANMET-MMSL Report 11-006(CR); CanmetMINING: Ottawa, ON, Canada, 2012. [Google Scholar]
- Fiset, J.F.; Lastra, R.; Demers, A.; Khandelwal, A.; Price, J.; Joyce, B.; Laviolette, C.; Morin, L.; Chapman, M. Characterization of Surrogate Cemented Radioactive Waste; CanmetMINING Final Report 13-012(CR); CanmetMINING: Ottawa, ON, Canada, 2013. [Google Scholar]
- Merritt, R.C. The Extractive Metallurgy of Uranium; Colorado School of Mines Research Institute; Johnson Publishing Company: Boulder, CO, USA, 1971. [Google Scholar]
- Wilkinson, W.D. Uranium Metallurgy, Volume I (Uranium Process Metallurgy); John Wiley and Sons: New York, NY, USA, 1962. [Google Scholar]
- Queneau, P.B.; Berthold, C.E. Silica in hydrometallurgy: An overview. Can. Met. Q. 1986, 25, 201–209. [Google Scholar] [CrossRef]
- Ritcey, G.M.; Wong, E.W. Influence of cations on crud formation in uranium circuits. Hydrometallurgy 1985, 15, 55–61. [Google Scholar] [CrossRef]
- Wang, J.; Zhuang, S. Removal of cesium ions from aqueous solutions using various separation technologies. Rev. Environ. Sci. Bio/Technol. 2019, 18, 231–269. [Google Scholar] [CrossRef]
- Sierra, M.J.; Millán, R.; López, F.A.; Alguacil, F.J.; Cañadas, I. Sustainable remediation of mercury contaminated soils by thermal desorption. Environ. Sci. Pollut. Res. 2015, 23, 4898–4907. [Google Scholar] [CrossRef] [PubMed]
- Obermoller, H.R.; White, D.A.; Lagos, S. Resin adsorption of anionic chloride complexes for uranium isotope chemical exchange reactions. Hydrometallurgy 1991, 27, 63–74. [Google Scholar] [CrossRef]
- Kraus, K.A.; Nelson, F. Anion exchange studies of the fission products. In The World’s Requirements for Energy: The Role of Nuclear Energy, Proceedings of the First International Conference on the Peaceful Uses of Atomic Energy, Geneva, Switzerland, 8–20 August 1955; Columbia University Press: New York, NY, USA, 1956; Volume 7, pp. 113–125. [Google Scholar]
- Googin, J.M.; Phillips, L.R.; Schmitt, C.R. Anion Exchange of Uranium in Nitrate Solutions. J. Chem. Eng. Data 1961, 6, 217–219. [Google Scholar] [CrossRef]
- Zhang, H.; Jeffery, C.A.; Jeffrey, M.I. Ion exchange recovery of gold from iodine–iodide solutions. Hydrometallurgy 2012, 125–126, 69–75. [Google Scholar] [CrossRef]
- Riveros, P.A.; Lastra, R.; Kwong, J.; Khandelwal, A.; Smith, D. Task C: Determination of the Chemical Characteristics of Surrogate Cemented Wastes. Part 1: Evaluation of Lixiviants for Cs, Hg and U, and Mineralogical Analysis of the Resulting Leach Residues; CANMET-MMSL Report 11-018(CR); CanmetMINING: Ottawa, ON, Canada, 2011. [Google Scholar]
- Riveros, P.A.; Lastra, R.; Khandelwal, A. Task C: Determination of the Chemical Characteristics of Surrogate Cemented Wastes. Part 2: Development and Optimization of a Leaching Scheme; CANMET-MMSL Report 12-028(CR); CanmetMINING: Ottawa, ON, Canada, 2012. [Google Scholar]
- Riveros, P.A.; Lastra, R.; Khandelwal, A.; Laviolette, C.; Demers, A. Task C: Determination of the Chemical Characteristics of Surrogate Cemented Wastes; Final Report; CANMET-MMSL Report 13-013(CR); CanmetMINING: Ottawa, ON, Canada, 2013. [Google Scholar]
- Reynier, N.; Lastra, R.; Laviolette, C.; Bouzoubaâ, N.; Chapman, M. Optimization and validation of a chemical process for uranium, mercury and cesium leaching from cemented radioactive wastes. AECL Nucl. Rev. 2015, 4, 131–139. [Google Scholar] [CrossRef]
- Reynier, N.; Fiset, J.F.; Bilodeau, M.; Bilodeau, A.; Kassimi, F.; Lastra, R. Effect of Plastic and Corrosion Products on the Lixiviation Process and Strontium Behavior; CanmetMINING Final Report; CanmetMINING: Ottawa, ON, Canada, 2016. [Google Scholar]
- Reynier, N.; Lastra, R.; Laviolette, C.; Demers, A.; Courchesne, M.; Chapman, M. Process scale-up for uranium, mercury and cesium recovery from surrogate radioactive cemented waste. In Proceedings of the Uranium 2020 Conference, Saskatoon, SK, Canada, 10–13 May 2020. [Google Scholar]
- Fiset, J.F.; Lastra, R.; Bilodeau, A.; Bouzoubaâ, N. Characterization of Surrogate Radioactive Cemented Waste: A Laboratory Study. In Proceedings of the Waste Management, Decommissioning and Environmental Restauration for Canada’s Nuclear Activities, Toronto, ON, Canada, 11–14 September 2011. [Google Scholar]
- Trambouze, P. Countercurrent two-phase flow fixed bed catalytic reactors. Chem. Eng. Sci. 1990, 45, 2269–2275. [Google Scholar] [CrossRef]
- Subramonian, S.; Clifford, D.; Vijjeswarapu, W. Evaluating Ion Exchange for Removing Radium From Groundwater. J. Am. Water Work. Assoc. 1990, 82, 61–70. [Google Scholar] [CrossRef]
- Quinn, J.E.; Sedger, D.S.; Brennan, A.T.; Ring, R.J.; Soldenhoff, K. Recovery of uranium from carbonate solutions using Lewatit TP 107 resin. Hydrometallurgy 2020, 194, 105360. [Google Scholar] [CrossRef]
- Gupta, R.; Pandey, V.; Pranesh, S.; Chakravarty, A. Study of an improved technique for precipitation of uranium from eluted solution. Hydrometallurgy 2004, 71, 429–434. [Google Scholar] [CrossRef]
- Pappas, R.S. Sample Preparation Problem Solving for Inductively Coupled Plasma-Mass Spectrometry with Liquid Introduction Systems I. Solubility, Chelation, and Memory Effects. Spectrosc. (Springf. Or.) 2012, 27, 20–31. [Google Scholar]
- Reynier, N.; Bilodeau, M.; Demers, A.; Laviolette, C.; Fiset, J.F.; Bouzoubaâ, N. Technologies Optimization—CRW Research; CanmetMINING Final Report; CanmetMINING: Ottawa, ON, Canada, 2018. [Google Scholar]
- Reynier, N.; Lastra, R.; Laviolette, C.; Fiset, J.-F.; Bouzoubaâ, N.; Chapman, M. Comparison of Uranium Recovery by Ion Exchange from Sulfuric Acid Liquor in Iodide and Chloride Media. Solvent Extr. Ion. Exch. 2016, 34, 188–200. [Google Scholar] [CrossRef]
- Liu, Z.; Wang, D.; Yang, S.; Liu, H.; Liu, C.; Xie, X.; Xu, Z. Selective recovery of mercury from high mercury-containing smelting wastes using an iodide solution system. J. Hazard. Mater. 2018, 363, 179–186. [Google Scholar] [CrossRef] [PubMed]
- Kameník, J.; Dulaiova, H.; Šebesta, F.; Šťastná, K. Fast concentration of dissolved forms of cesium radioisotopes from large seawater samples. J. Radioanal. Nucl. Chem. Artic. 2012, 296, 841–846. [Google Scholar] [CrossRef]
- Turgis, R.; Leydier, A.; Arrachart, G.; Burdet, F.; Dourdain, S.; Bernier, G.; Miguirditchian, M.; Pellet-Rostaing, S. Uranium Extraction from Phosphoric Acid Using Bifunctional Amido-Phosphonic Acid Ligands. Solvent Extr. Ion. Exch. 2014, 32, 478–491. [Google Scholar] [CrossRef]
- Ivanov, N.S.; Abilmagzhanov, A.Z.; Shokobayev, N.M.; Adelbayev, I.Y.; Nurtazina, A.E. Scandium Extraction by Phosphorus-Containing Sorbents; News of the National Academy of Sciences of the Republica o Kazakhstan, Series of Geology and Technical Sciences: Almaty, Kazakhstan, 2020; Volume 4, pp. 156–165. ISSN 2224-5278. [Google Scholar] [CrossRef]
- Lewatit MonoPlus TP260. Product Information. Edition: 2021-08-31. Available online: https://lanxess.com/en/Products-and-Solutions/Products/l/LEWATIT-MonoPlus-TP-260 (accessed on 9 March 2022).


| SCRW | Series | Cs (mg/kg) | U (mg/kg) | Hg (mg/kg) |
|---|---|---|---|---|
| SCRW-10 | U-series | 6.26 | 1129 | 1297 |
| SCRW-11 | U-series | 7.12 | 1203 | 1344 |
| SCRW-12 | U-series | 6.10 | 1127 | 1320 |
| SCRW-13 | U-series | 7.53 | 1189 | 1388 |
| SCRW-14 | U-series | 7.78 | 1232 | 1339 |
| SCRW-15 | U-series | 7.82 | 1189 | 1347 |
| SCRW-16 | W-series | 7.68 | 1226 | 1283 |
| SCRW-17 | W-series | 8.67 | 1222 | 1339 |
| SCRW-18 | W-series | 7.87 | 1103 | 1427 |
| SCRW-19 | W-series | 7.03 | 1099 | 1400 |
| SCRW-20 | W-series | 7.06 | 1103 | 1287 |
| SCRW-W | W-series | 7.65 | 1153 | 1267 |
| SCRW-U | U-series | 8.57 | 1130 | 1251 |
| Mean | 7.47 | 1162 | 1330 | |
| STD (mg/kg) | 0.76 | 50.0 | 53.0 | |
| STD (%) | 10% | 4% | 4% |
| Concentration (mg/L) | Cs | U | Hg |
|---|---|---|---|
| SCRW liquor KI 0 g/L | 0.46 | 59.67 | 68.82 |
| SCRW liquor KI 20 g/L | 0.46 | 58.29 | 80.92 |
| SCRW liquor KI 30 g/L | 0.48 | 58.18 | 80.22 |
| Mean (for KI liquor) | 0.47 | 58.24 | 80.57 |
| Adsorption on Lewatit TP214 | Cs (%) | U (%) | Hg (%) |
| KI 0 | 3.8 | 10.9 | 98.8 |
| KI20 | 4.1 | 0.0 | 98.9 |
| KI30 | 0.0 | 0.0 | 99.8 |
| Adsorption on XUS43604 | Cs (%) | U (%) | Hg (%) |
| KI 0 | 3.5 | 0.0 | 98.9 |
| KI20 | 6.2 | 0.1 | 99.2 |
| KI30 | 0.0 | 0.0 | 99.8 |
| Elution Fraction | U (mg/L) | Mg (mg/L) | Fe (mg/L) | Ca (mg/L) | Al (mg/L) |
|---|---|---|---|---|---|
| Fraction 1 | 388 | 9 | 12 | 15 | 6 |
| Fraction 2 | 2342 | <3 | 20 | 9 | 5 |
| Fraction 3 | 1524 | <3 | 30 | 11 | 4 |
| Fraction 4 | 236 | <3 | 15 | 6 | 233 |
| Fraction 5 | 88 | <3 | 11 | <3 | 366 |
| Fraction 6 | 41 | <3 | 8 | <3 | 401 |
| Mass eluted | 3694 mg | 7 mg | 75 mg | 32 mg | 812 mg |
| Metal recovery | 99% | 1% | 2% | 3% | 29% |
| Precipitation Agent and pH | U (%) | Fe (%) | Al (%) |
|---|---|---|---|
| H2O2—pH 3 | 78 | 85 | 13 |
| H2O2—pH 4 | 85 | 85 | 85 |
| H2O2—pH 5 | 100 | 85 | 89 |
| NaOH—pH 13 | 99 | 48 | 9 |
| Precipitation Agent | U (mg/kg) | Mg (mg/kg) | Hg (mg/kg) | Fe (mg/kg) | Ca (mg/kg) | Al (mg/kg) |
|---|---|---|---|---|---|---|
| H2O2—pH 3 | 1553 | <4 | <4 | 79 | <6 | 35 |
| * H2O2—pH 3 | 2481 | <4 | <4 | 116 | <6 | 54 |
| H2O2—pH 4 | 2333 | <4 | <4 | 54 | <6 | 53 |
| * H2O2—pH 4 | 2633 | <4 | <4 | 60 | <6 | 60 |
| H2O2—pH 5 | 2117 | <4 | <4 | 49 | <6 | 149 |
| * H2O2—pH 5 | 2569 | <4 | <4 | 58 | 7 | 173 |
| NaOH—pH 13 | 3308 | 11 | <4 | 24 | 40 | <2 |
| * NaOH—pH 13 | 3442 | 11 | <4 | 25 | 42 | <2 |
Publisher’s Note: MDPI stays neutral with regard to jurisdictional claims in published maps and institutional affiliations. |
© 2022 by the authors. Licensee MDPI, Basel, Switzerland. This article is an open access article distributed under the terms and conditions of the Creative Commons Attribution (CC BY) license (https://creativecommons.org/licenses/by/4.0/).
Share and Cite
Reynier, N.; Courchesne, M.; Anderson, J.; Williams, K.; Schinnour, K. Pilot Scale Validation of a Chemical Process for Uranium, Cesium, and Mercury Recovery from Cemented Radioactive Wastes. Minerals 2022, 12, 594. https://doi.org/10.3390/min12050594
Reynier N, Courchesne M, Anderson J, Williams K, Schinnour K. Pilot Scale Validation of a Chemical Process for Uranium, Cesium, and Mercury Recovery from Cemented Radioactive Wastes. Minerals. 2022; 12(5):594. https://doi.org/10.3390/min12050594
Chicago/Turabian StyleReynier, Nicolas, Maxime Courchesne, Javed Anderson, Kevin Williams, and Kyle Schinnour. 2022. "Pilot Scale Validation of a Chemical Process for Uranium, Cesium, and Mercury Recovery from Cemented Radioactive Wastes" Minerals 12, no. 5: 594. https://doi.org/10.3390/min12050594
APA StyleReynier, N., Courchesne, M., Anderson, J., Williams, K., & Schinnour, K. (2022). Pilot Scale Validation of a Chemical Process for Uranium, Cesium, and Mercury Recovery from Cemented Radioactive Wastes. Minerals, 12(5), 594. https://doi.org/10.3390/min12050594


