Article

Hydrodynamic Simulation of the Influence of Injection Flowrate Regulation on In-Situ Leaching Range

1
School of Resource Environment and Safety Engineering, University of South China, Hengyang 421001, China
2
Beijing Research Institute of Chemical Engineering and Metallurgy, CNNC, Beijing 101149, China
3
China Petroleum Pipeline Engineering Co., Ltd., China National Petroleum Corporation, Langfang 065000, China
4
National New Energy Vehicle Technology Innovation Center, Beijing 100176, China
*
Authors to whom correspondence should be addressed.
Minerals 2022, 12(7), 787; https://doi.org/10.3390/min12070787
Submission received: 26 April 2022 / Revised: 16 June 2022 / Accepted: 20 June 2022 / Published: 21 June 2022
(This article belongs to the Section Mineral Processing and Extractive Metallurgy)

Abstract

:
Reasonable control of the leaching range is one of the critical indicators of the in-situ leaching uranium mining process. However, there is currently no mature control technology. To verify and improve the current control technology of the leaching range in the industry, this work proposes an injection control mode for a small flow around the well-site and establishes a hydrodynamic model of the leaching range under eight different pumping and injection conditions by using the groundwater modeling system (GMS). The model calculation, range prediction, comparative analysis, and on-site SO42− and S isotope verification tests were carried out. Results show that with the change of liquid injection ratio, the area ratios of fixed pumping injection ratio (total pumping flowrate is greater than 0.3% of the total injection flowrate) and model leaching range under four pumping injection equilibrium conditions were 99.10%, 99.99%, 98.30%, and 97.95%, respectively. The farthest migration distance ratios of the leaching solution were 99.37%, 100%, 98.02%, and 97.58%, respectively. It is considered that the operation mode with a fixed pumping injection ratio has no noticeable control effect on the leaching range; selecting a reasonable proportion to regulate the flowrate of injection wells at different positions can effectively reduce the area of the groundwater flow field and realize the effective control of the leaching range. The research results are conducive to saving a lot of evaporation pool construction, land acquisition, human and material resource investment, and environmental policy pressure.

1. Introduction

In-situ leaching uranium mining is a new centralized mining and smelting method. It can dissolve uranium in ore-bearing layers under natural burial conditions through drilling engineering, and with the help of chemical reagents, without causing displacement of the ore [1,2]. After nearly half a century of development, in-situ leaching of uranium has become China’s most crucial uranium mining technology. By 2020, the annual uranium production from in-situ leaching accounted for about 85% of the total domestic natural uranium production. Rock-ore reaction and leaching agent migration during in-situ leaching are interactive [3]. Under the action of multiple influencing factors, such as hydrodynamics and chemical reaction kinetics, the infusion flow and natural groundwater form a leaching area [4]. This area is not only where chemical reagents come into contact with and react with in-situ ore, but also where environmental remediation is carried out after mining is completed [5]. To reduce the pollution of groundwater caused by chemical reagents while obtaining a higher resource recovery rate, the current method for controlling the range of leaching is to set a fixed pumping-injection ratio to suppress the diffusion of the leaching solution [6]. That is, the total pumping flowrate of the well-site is greater than the total flowrate of liquid injection by 0.3~1% [7,8]. This method has been used in China’s in-situ leaching uranium production practice for a long time. With the expansion of the natural uranium production scale, in-situ leaching mines need to pump up to several hundred cubic meters of solution every day (calculated based on the minimum extraction ratio of 0.3%). The more solution is discharged into the evaporation pond, the larger the supporting evaporation pond will be, which brings about problems such as a high capital investment, a large occupied area, and poor environmental friendliness.
The in-situ leaching uranium flow field is a coupled flow field composed of groundwater hydrodynamic, solute dispersion, and chemical reaction fields [9]. The natural groundwater flow system depends on the hydrogeological conditions of the deposit itself, while the pumping liquid flow system is an artificial flow field controlled by humans, the latter of which is the key to determining the size of the leaching range. When the total pumping flowrate of the local leaching uranium mining area is greater than the total injection flowrate, a falling funnel will be formed in the mining area [10]. According to the principle of groundwater hydrodynamics, the underground fluid in the descending funnel tends to flow to the well-site, inhibiting the leaching agent’s outflow and controlling the leaching range [11]. Therefore, in theory, it is feasible to control the leaching range with the total pumping flowrate greater than the total injection flowrate. In-situ leaching researchers have also carried out much exploratory research on this. Mercer et al. [12] focused on analyzing the response of groundwater systems to remediation measures by depicting groundwater simulation results from hazardous waste sites in four regions. They confirmed that the results of such simulations could be used iteratively and demonstrated the use of the model in evaluating various remedies. Hao et al. [13] conducted a simulation calculation on an in-situ leaching mine, and the results proved that maintaining the overall flow and pumping balance would not cause a large amount of leachate to diffuse and migrate to the periphery. Ababou et al. [14] proposed a numerical simulation method for the flow field in random porous media that satisfies Darcy’s equation locally. Each hydraulic parameter is expressed as an implementation form of a three-dimensional random field. They used the discretization method and iterative solution method of seven-point finite-difference to discuss the optimal strategy for solving the problem. Cao et al. [15] believed that the influence of different pumping ratio conditions on the in-situ flooding flow field is basically the same. Grubb [16] studied the analytical solution form of pumping wells in the confined aquifer and phreatic aquifer under the steady flow state and studied its practical effect in the complex aquifer. Ji et al. [17] believed that more attention should be paid to the rational distribution of the flow rate of each borehole in the mining area and the balance of injection of each subunit rather than the overall injection ratio of the mining area. By precisely adjusting the single-well flowrate, Xu [18] makes the well-site pumping and injection flowrate reach 1:1, preventing the solution from contaminating the groundwater outside the mining area. Gräsle et al. [19] used numerical simulation to study the effect of fluid parameters and hydraulic properties of fractured crystalline crusts on the groundwater level under pumping conditions. Li and Duan [20] optimized the infusion liquid system through in-situ leaching and adopted a differentiated micro-unit extraction and injection balance management method to control the leaching range effectively. Saghravani et al. [21] combined the experimental method to simulate the migration of phosphorus elements in confined aquifers and analyzed them with numerical simulation software. Li et al. [22] adopted the non-uniform flow pumping method to increase the flowrate of the boundary pumping wells while reducing the flowrate of the peripheral liquid injection wells and obtained the pronounced control effect of leachate migration. Hudak et al. [23] evaluated and studied the production planning of the well-site system near the groundwater pollution source. They used the numerical simulation method of groundwater flow to generate the head settings under different mining schemes. Under certain conditions, the pollution sensitivity is evaluated by comparing the head distribution of the two aquifer units with the location of pollution sources and drainage wells. The results show that groundwater flow simulation can be useful for producing and treating aquifers that may be polluted by artificial pollution. Chang et al. [24] conducted a numerical simulation of the hydrodynamics of the mining area and found that the pumping and injection flow of a single well had a decisive impact on the rise and fall of the wellbore water level and the migration speed and distance of the leaching solution. May et al. [25] evaluated the impact of groundwater extraction on the interaction between the mining area, river, and aquifer system in Langat basin, Malaysia, through a three-dimensional numerical simulation. Their research results provide a technical reference for the interaction and groundwater treatment between the river, mining area, and aquifer system in the Langat basin regarding groundwater extraction. Differences in the infusion ratio between units can lead to differences in the leaching range. It can be seen that the effect of controlling the leaching range is not achieved by controlling the total pumping flowrate to be greater than the total injection flowrate.
This paper calculates and analyzes the leaching range under different liquid injection volume control methods through the hydrodynamic numerical simulation of the in-situ leaching well-site. This paper also presents the field test verification of in-situ leaching of uranium and compares the control effect of the leaching range under the condition of a fixed extraction and infusion ratio (total extraction is greater than 0.3% of total injection) and the overall extraction and infusion solution. A method of small-flow liquid injection at the periphery of the well-site is proposed. The different mechanisms of fluid seepage under the fixed pumping solution ratio and overall pumping solution balance are clarified, and the hydrodynamics of solution leachate in the in-situ leaching uranium mining process is deepened.

2. Materials and Methods

The commonly used in-situ leaching uranium well types in China are five-point and seven-point types, and the ratio of the number of pumping wells corresponding to the five-point structure will gradually approach one as the scale of the well-site increases [26]. In this paper, the calculation of the liquid injection flowrate adopts the five-point drilling arrangement. The well-site comprises two types of wells, a pumping well and an injection well, and the edges are all injection wells. Zhang et al. [9] put forward the theory of “unit flow micro-balance in mining area”. Moreover, by adjusting the unit pumping flow, the flow field shape can be changed, and the range of leaching can be controlled. Based on this theory, this paper proposes a method for controlling the leaching range of “small flow injection at the periphery of the well-site”. The injection wells in the production area are divided into edge injection wells, top corner injection wells, and internal injection wells. As shown in Figure 1, under the premise of the balance of the overall pumping liquid flowrate, the total pumping flowrate is evenly distributed to all pumping wells, and the in-situ flooding flow field and control are achieved only by changing the flow rate of the edge and top corner liquid injection wells.
This work uses the comparative study method and computer numerical simulation technology to predict the hydrodynamic state and flow field shape of the in-situ flooding flow field under different liquid injection conditions. Additionally, this work compares the actual control effect of the peripheral low-flow liquid injection mode on the leaching range under the current extraction and injection ratio (total extraction > 0.3% of total injection) and the changing trend of the leaching range gradually reducing the proportion of liquid injection at the periphery of the well-site. The detailed comparison and research ideas are shown in Figure 2, and the conditions of the extraction and injection ratio and the proportion of liquid injection at different positions are shown in Table 1.

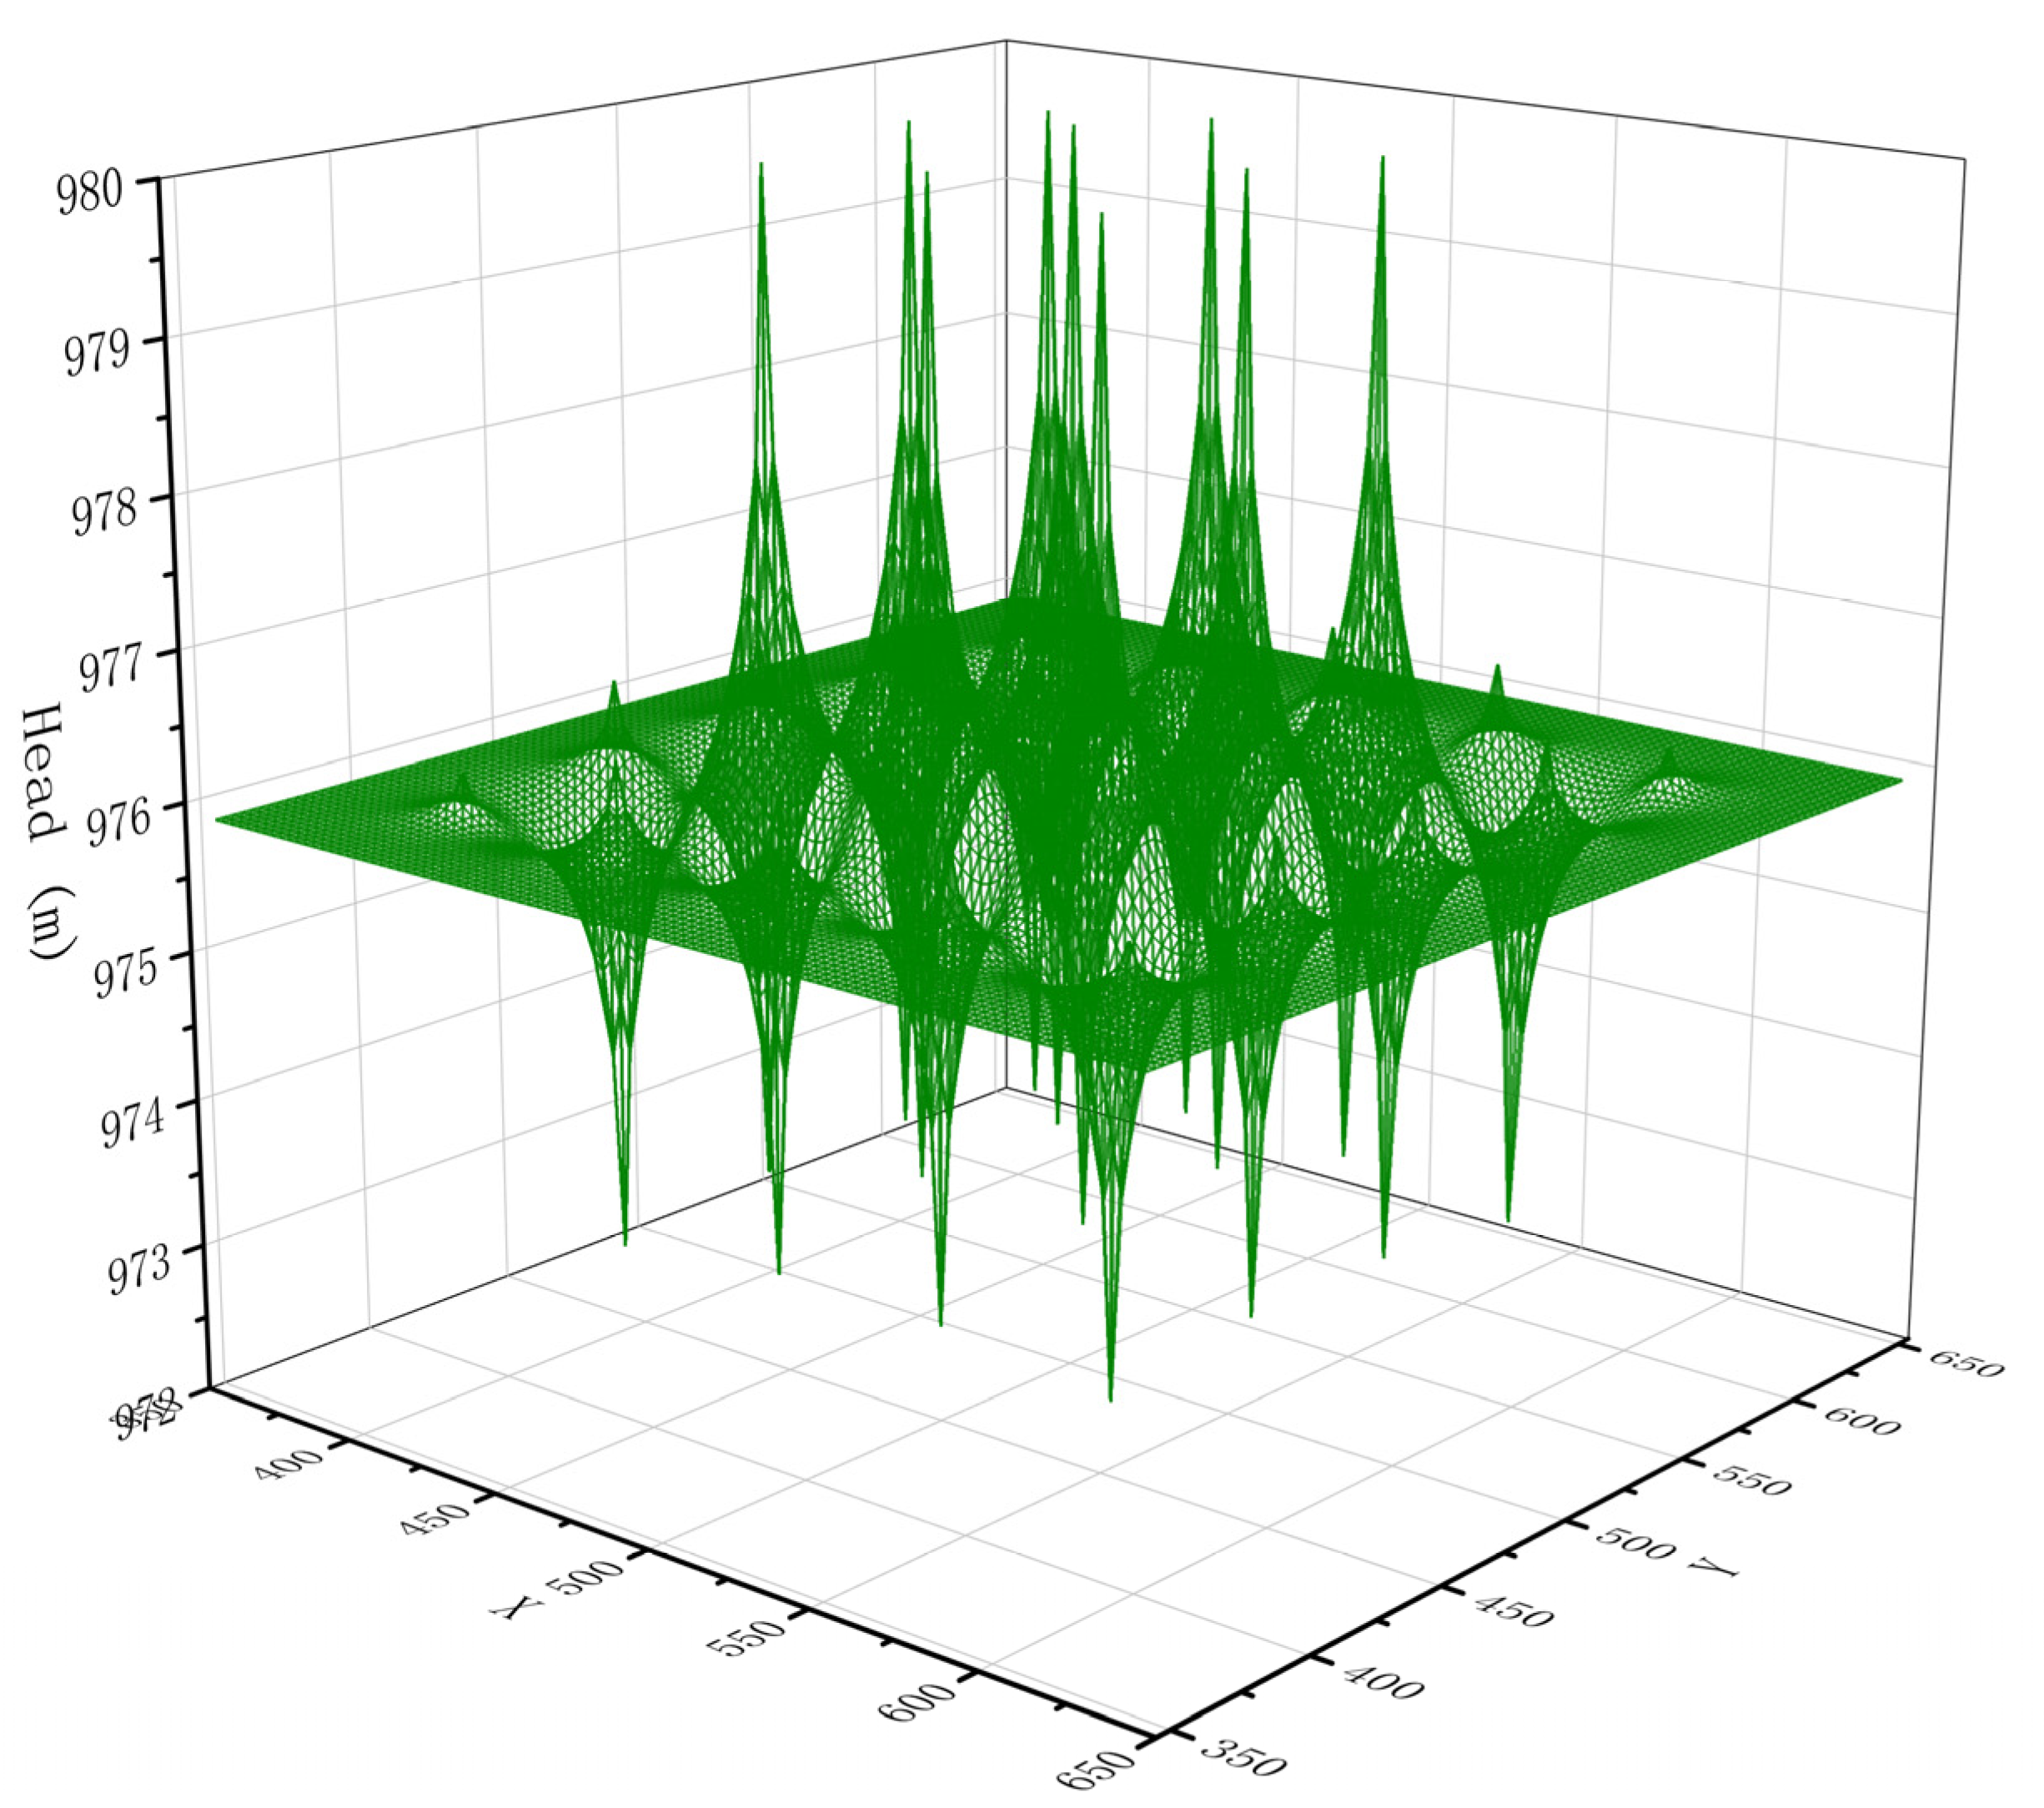
3. Hydrodynamic Model of the Submerged Flow Field

3.1. Discussion on the Range of Leaching

The scope of in-situ leaching uranium mining is the basic concept of the technology. The former Soviet Union scientist B.A. Grabovnikov defined the leaching range as the area in which the leaching agent seeps into the ore-bearing layers and surrounding rocks [27]. Wang et al. [28] believed that the area where the leaching agent flows in the formation is called the leaching range. Wang et al. [29] believe that the so-called leaching range refers to the coverage of the leaching agent in the ground during the in-situ leaching process. Que et al. [6] agree with Wang et al. [29] ’s viewpoint. Tan et al. [4] found that the leaching range is the range formed by a coupled flow field composed of extracted liquid flow and natural groundwater flow under the action of multiple factors such as groundwater dynamics and chemical reaction kinetics. It can be seen that the above definitions are general descriptions, lacking the elaboration of their essential components.
The transport of solutions in in-situ leaching uranium-bearing aquifers is controlled by three fields: the hydrodynamic seepage field formed by the hydraulic gradient of the extracted liquid; the solute dispersion field formed by the leaching agent under the effect of the concentration gradient; and the physicochemical reaction leaching field formed by the chemical reaction between the leaching agent and the ore. The interaction of the seepage, dispersion, and leaching fields promotes the migration and diffusion of the solution, which constitute the in-situ leaching uranium flow field [9]. The leaching reagent and solution move continuously under the action of this flow field, forming a time-varying spatial range in the formation. This range includes two spaces corresponding to the above fields: the convection migration space range of in-situ leaching liquid formed by the hydrodynamic seepage field and the diffusion and migration space range of in-situ leaching liquid formed by the solute dispersion field. The time-varying spatial range formed by the convection and diffusion migration of the in-situ leaching solution is the in-situ leaching uranium leaching range as defined by scholars such as Wang et al. [28]. In addition, the chemical reaction between the leaching agent and the ore can only occur within this range.
The uranium-containing leaching solution extracted from the in-situ leaching production pumping wells comes from the spatial range formed by the convection migration of the in-situ leaching solution. It includes the leaching dead zone and ineffective dispersion area caused by the heterogeneity of the formation [29]. This space is the most crucial research object for in-situ leaching uranium production, and some scholars define this space as the in-situ leaching uranium leaching range.
In order to distinguish the two leaching ranges, we define the spatial range formed by the convection and dispersion of the in-situ leaching liquid as the generalized leaching range and the spatial range formed by the convection of the in-situ leaching liquid as the narrow leaching range. The leaching range in a broad sense is the coverage space of the ground leaching solution, and the leaching range in the narrow sense is the production space of the uranium-containing leaching solution.
Controlling the leaching range by adjusting the pumping flow regulates the hydrodynamic flow field. Therefore, the influence of the injection flow rate regulation on the leaching range discussed in this paper should be the leaching range in a narrow sense. The following will calculate and analyze the change of the narrow-sense leaching range under different flow ratios. All the leaching ranges are narrow-sense leaching ranges unless otherwise specified.

3.2. Simulation Software and Numerical Methods

This simulation work uses the GMS (Groundwater modeling system) software based on the finite difference method [30], mainly involving two model software packages, Modflow and Modpath [31]. At the same time, due to the complex hydrogeological conditions and the precise adjustment requirements of a large number of parameters in the process of in-situ leaching of uranium, the numerical method was selected to calculate the quantitative data.

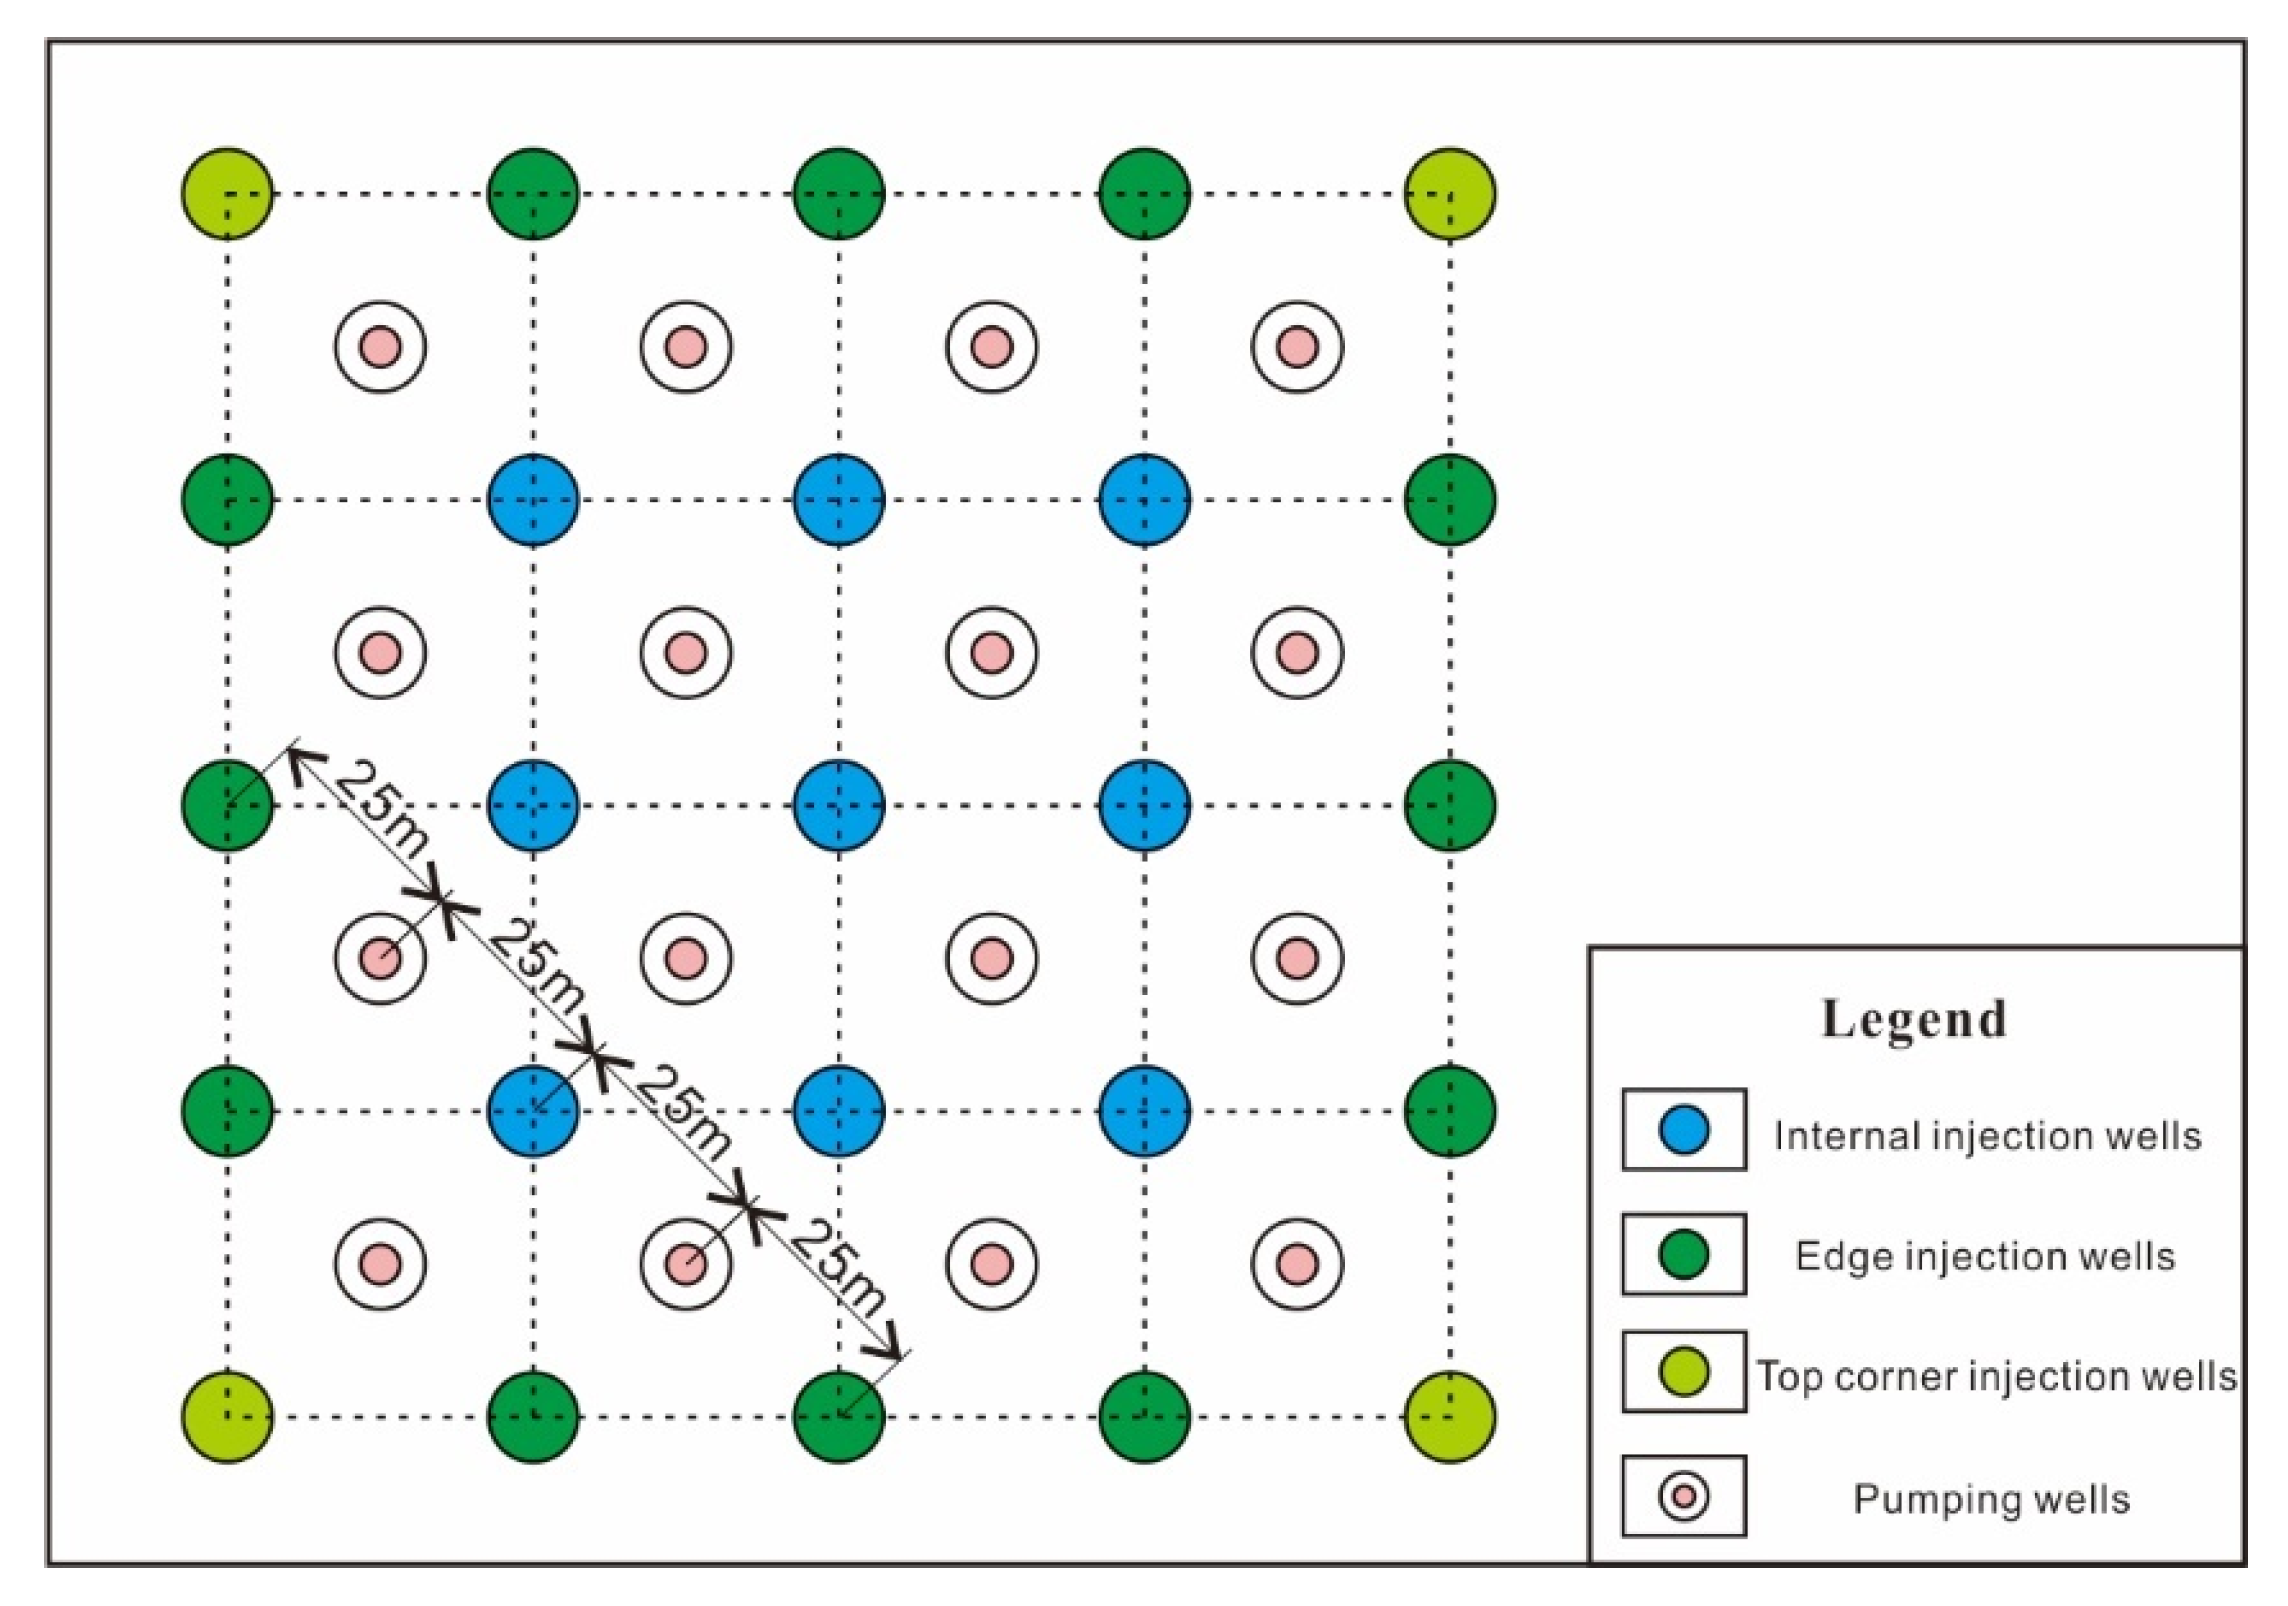
3.3. Model Generalization

3.3.1. Mock Object Overview

Based on the primary hydrogeological conditions of a sandstone-type uranium deposit in Xinjiang, China, a homogeneous and ideal in-situ uranium leaching model for the flow field was established. Specifically: the horizontal permeability coefficient of the ore-bearing aquifer Kx = Ky = 7.7 m/d, and the ratio of the vertical permeability coefficient Kz to the horizontal permeability coefficient is 0.1; the effective porosity is 0.28; the top elevation of the ore-bearing aquifer is 776 m, and the thickness is 60 m; the initial water level elevation is 976 m; the ore body roof elevation is 746 m, and the ore body thickness is 6 m. A total of 41 in-situ leaching process wells were arranged, including 16 liquid pumping wells and 25 liquid injection wells. The well was a five-point arrangement, and the well spacing of the liquid injection wells was 25 m. The horizontal layout of the well-site is shown in Figure 1. All process drilling filters were compared with the ore body horizon, the length was 6 m, and the flowrate of a single pumping well was stable at 10 m3/h.

3.3.2. Stratigraphic Generalization and Boundary Conditions

The model was used to calculate the migration range of the leaching solution. The solution migration during the pumping process is strictly controlled in the ore-bearing aquifer. It has no hydraulic connection with the upper and lower aquifers due to the hydraulic constraints of the water-retaining roof and floor. The flow law of groundwater in the field conforms to the three-dimensional mathematical equation of saturated water flow, so the simulation horizon of this model can ignore other horizons and is limited to the ore-bearing aquifer. Therefore, the boundary conditions of the model’s top and bottom plates were set as zero-flux boundaries [32].
H n = 0
Define model side boundaries as flow boundaries.
K H n = v ( x , y , z , t )
The water head difference generated during the pumping process is usually larger than the original water head drop of the groundwater in the area, so the flow change of the boundary measured by this model only needs to calculate the superposition of the water level caused by the pumping well on the boundary point. Therefore, the formula for calculating the water head drawdown s at the boundary point p was [33]:
s ( t ) = s 1 + s 2 + + s n
s ( t ) = 1 4 π T [ Q 1 W ( r 1 2 4 a ( t t 1 ) ) + Q 2 W ( r 2 2 4 a ( t t 2 ) ) + + Q n W ( r n 2 4 a ( t t n ) ) ]
When ( r n 2 4 a t ) approaches infinitely small, we get:
s ( t ) = 1 4 π T [ Q 1 ln 2.25 a ( t t 1 ) r 1 2 + Q 2 ln 2.25 a ( t t 2 ) r 2 2 + + Q n ln 2.25 a ( t t n ) r n 2 ]
In the formula: Q 1 Q 2 Q n is the flow rate of No. 1, 2, …, n wells in the well-site (the liquid extraction and injection are marked with the positive and negative of the Q value, respectively); r 1 r 2 r n are the actual distances from drill wells 1, 2, …, n in the well-site to point p; T is the specific moment for calculating the water level drawdown at the boundary point p; and t 1 t 2 t n are the specific moments when drilling wells 1, 2, …, n in the well-site start to extract fluid.

3.3.3. Model Segmentation

The horizontal simulation range of the flow field model was a circular area with the center point of the mining area as the center and a radius of 500 m. The model was vertically divided into ten layers by the wellhead intensification subdivision method. Each layer was 6 m thick, with 207,360 model grids and 231,275 nodes (Figure 3). The model operation time was assumed to be a leaching cycle of 1800 d (about five years), the calculation step was 300, and the step unit was increased by 1.1 times.

4. Simulation Results and Discussion

According to the model mentioned above, a sampling model of the in-situ leaching uranium mining area was built, and the model Modflow software package was run to calculate the contour map of the water level in the in-situ leaching uranium mining area, as shown in Figure 4. A total of 20 moving particles were placed into all injection wells, and the Modpath software package was run to calculate the particle migration path and capture range, and further determine the capture zone boundary of the hydraulic control system through particle tracking calculation [34]. The simulated leaching ranges are the particle capture range and capture zone boundaries that form the convection region [35].
According to the previous research and analysis, the above-mentioned in-situ leaching flow field model was used to calculate the leaching range under eight groups of different injection flowrate distribution conditions, as shown in Table 2. The pumping volume of each pumping well in the two groups of models was 10 m3/h, and the total pumping volume was 160 m3/h. A total of eight shapes, areas, and solute migration distances of two groups of A-B-C-D and A1-B1-C1-D1 were obtained. The calculation results are shown in Figure 5 and Figure 6.

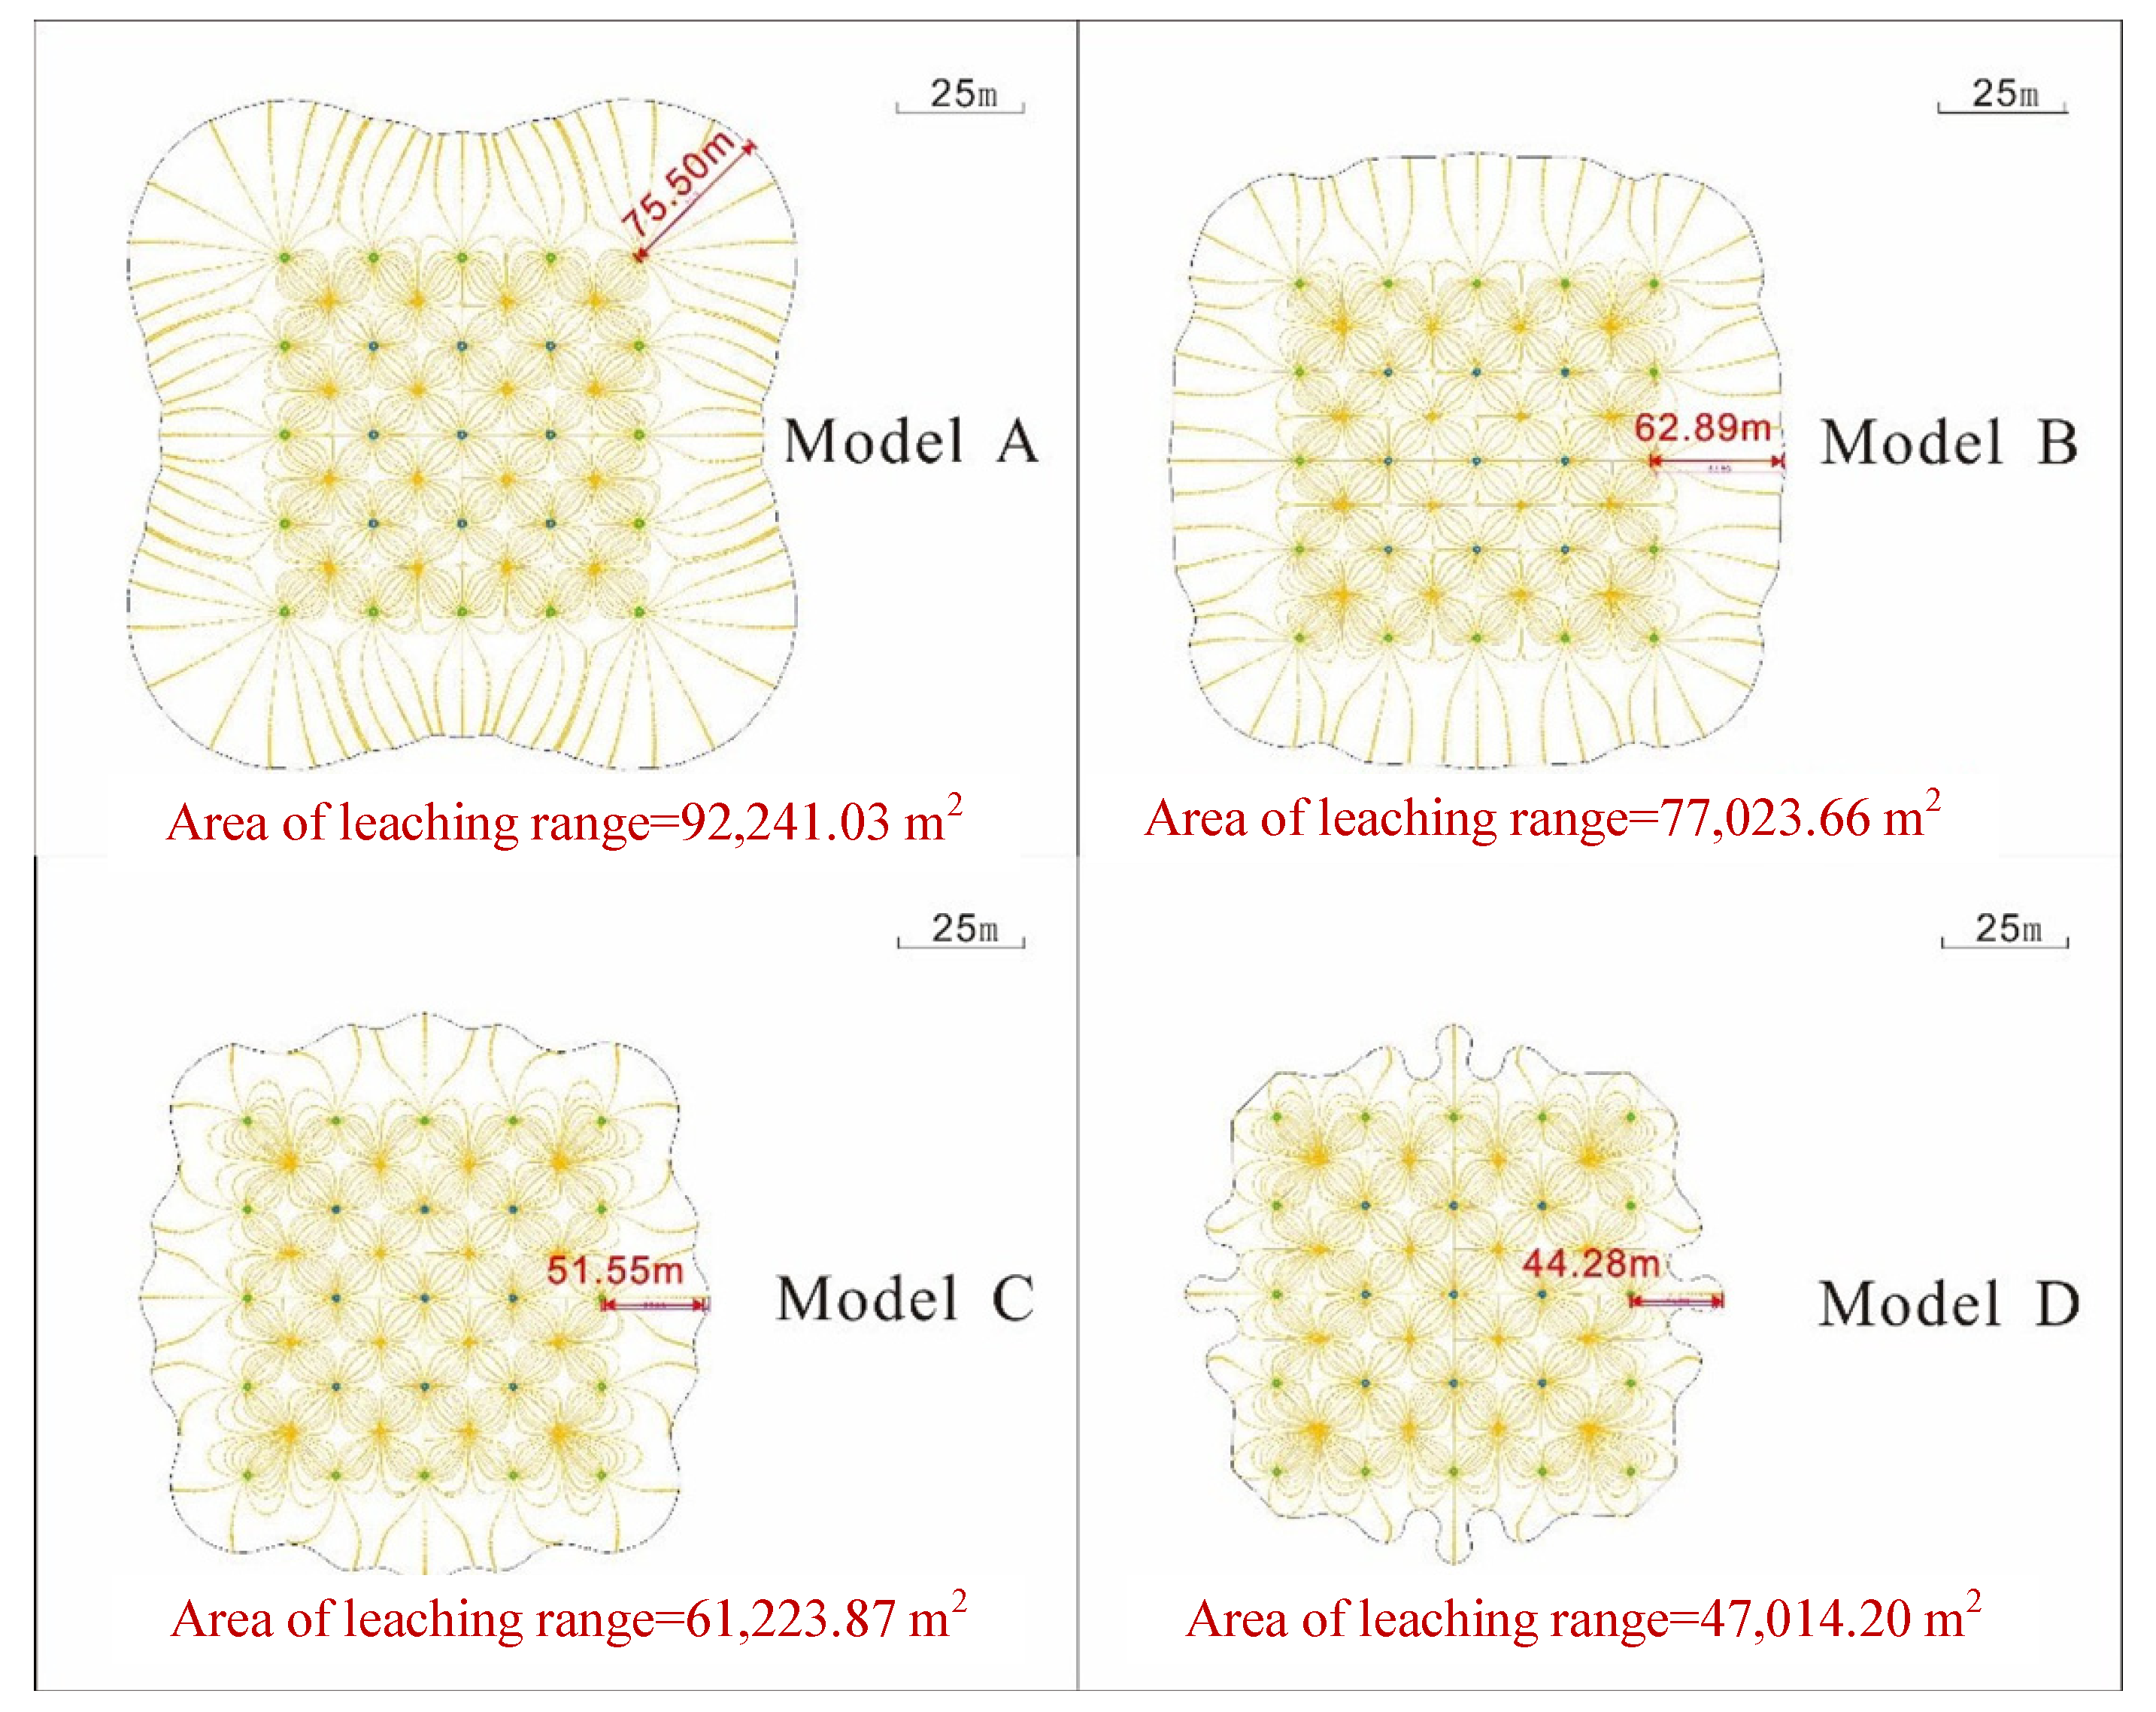
4.1. Influence of Different Peripheral Low-Flow Liquid Injection Ratios on the Leaching Range

In this work, the simulation results of four groups of A-A1, B-B1, C-C1, and D-D1 were compared by gradually reducing the water injection ratio of the peripheral water injection wells. The results are as follows:
From the simulation results of models A and A1, the area of model A is 0.90% smaller than that of A1 at the end of the leaching cycle (at the 1800th day), and the farthest migration distance of the leaching solution is 0.63% shorter. The liquid injection ratio of 1:1:1 is the liquid injection condition that does not distinguish the position of the liquid injection well, and the liquid injection flowrate of all the wells is the same, which is closest to the actual operation of most current in-situ leaching uranium mines. This shows that the current fixed injection ratio has a specific effect under this condition. However, the difference in the control effect between the two models in the calculation results is slight, indicating that the current pumping and injection ratio (total extraction > 0.3% of total injection) does not have a strong control effect on the flow field range.
From the simulation results of models B and B1, it can be seen that after the leaching cycle ends, the calculation results of models B and B1 are highly similar. The flow field shape of the two is abnormally close, and the coincidence rate of the leaching range area is as high as 99.99%. They also have the same farthest migration distance of the leaching solution of 62.89 m, and the direction is the same. Although the leaching range of model B is slightly smaller than that of model B1, the injection flowrate distribution model with the control ratio of 1:1/2:1/4 has a more obvious control effect on the in-situ leaching flow field, which also proves that this control effect has little relationship with the total pumping and injection ratio.
Similarly, from the simulation results of models C and C1, it shows that at the end of the leaching cycle, the leaching area of model C is 1.70% smaller than that of C1, the farthest migration distance of the leaching solution is 1.98%, and the difference is still minimal. At the same time, the edge morphology of the two leaching ranges shows some differences, indicating that the hydrodynamic action mechanism of controlling them is different, but the control effect is not different. It shows that the adjustment of the injection ratio is the main influencing factor, and the control mode of setting the total injection ratio has no apparent effect on reducing the leaching range. Models D and D1 show similar results.
To sum up, for the underground leaching range of in-situ leaching uranium mining, if no control technology is applied, the leaching range will be huge, which also means that it is essential to control the leaching range. However, the current fixed total injection ratio is not ideal; under certain conditions, a similar effect can be achieved by the peripheral small flow injection method. In order to further clarify the effect of the peripheral low-flow liquid injection method on the leaching range, the following will make a comparative study on the trend of gradually reducing the liquid injection flowrate.

4.2. Trend Comparison

In this work, two groups of peripheral small-flow liquid injection parallel experiments were carried out. The differences in the leaching range under the condition of a fixed infusion ratio (total extraction greater than 0.3% of total injection) and the overall extraction and infusion were compared.
A-B-C-D and A1-B1-C1-D1 models are parallel comparative tests under different total pumping injection ratios. Figure 5 and Figure 6 show that the area of the two groups of leaching range decreased by .83 m2 (A-D area difference) and .54 m2 (A1-D1 area difference), respectively, with a difference of 1.9%; The farthest migration distance of leaching solution was shortened by 31.22 m (A-D distance difference) and 30.6 m (A1-D1 distance difference), with a difference of 2.0%. As the only different condition in this comparison is that the total pumping is greater than the total injection by 0.3%, it can be seen that the area of the leaching range of the current extraction and injection ratio model (total extraction > 0.3% of total injection) is slightly smaller than the simulation effect under the overall equilibrium condition of the extraction and injection. This proves that the method of the total extraction greater than 0.3% of the total injection has a specific range of leaching control effects. However, the slight data difference (only about 2%) indicates a weak control effect. Moreover, with the decrease in the proportion of liquid injection at the periphery of the well-site, the shape of the leaching range of the two models continued to decrease and the area gradually decreased. This indicates that the low-flow liquid injection method at the well-site periphery can effectively control the range of leaching, which is the main factor in reducing the area of the leaching range and inhibiting the migration of the leaching solution to the periphery.
The leaching range from model A to model D decreased by 49%, resulting from the combined effect of “total pumping is greater than total injection 0.3%” and “peripheral small flow injection”. From model A1 to model D1, the leaching range was reduced by 48%, which is only affected by the "peripheral small flow injection". Compared with the leaching range of A-D, the difference in the affected area is only 1%. The above studies show that the small peripheral flowrate of liquid injection is the main reason for controlling the leaching range, and the fixed total injection ratio has little effect.

4.3. Verification

The difference between the leaching range under the fixed pumping and injection liquid ratio (total extraction > 0.3% of total injection) and overall pumping and injection equilibrium is calculated and compared through numerical simulation. The results basically verify the conjecture of this paper. In order to further verify the effect of peripheral small flow liquid injection, a field test was carried out on a well-site of acid in-situ leaching uranium mining in Yili Basin, Xinjiang.
The D1 model was selected to control the amount of pumping liquid. After six months, groundwater samples were taken from the pumping well in the well-site and the monitoring well outside the well-site (the monitoring well was 50–60 m away from the drilling well at the boundary of the well-site). The SO42− and S isotopic composition in the water samples were analyzed to investigate whether the leaching liquid in the well-site had migrated out of the simulated leaching range. The concentration of SO42− was determined by ion chromatography (883 basic Ic plus ion chromatography). Sulfur isotopes were determined by the standard method. That is, SO42− in the water sample was transformed into barium sulfate by the sodium carbonate zinc oxide semi-melting method, and then barium sulfate was transformed into sulfur dioxide by vanadium pentoxide. The sulfur dioxide was purified and collected, and the sulfur isotope composition was determined by the Delta-V plus gas isotope mass spectrometer. The thousandth ratio of the relative difference relative to the international standard substance Vienna-Canyon Diablo Troilite (V-CDT) was adopted as δ34SV-CDT (‰) indicates.
Water samples from ten pumping wells and six monitoring wells were collected and analyzed. The results are listed in Table 3. There are many differences in the concentration and sulfur isotopic composition of SO42− in the groundwater in the well-site. The concentration of SO42− in the groundwater around the well-site was 141–237 mg/L, which is within the background value (50.4–243 mg/L) [1] of the groundwater in this area and is also lower than the national III groundwater quality limit (250 mg/L). The concentration of SO42− in the groundwater in the well-site was as high as 17,447–40,203 mg/L, which is dozens to more than 100 times the groundwater background value in the area and the national III groundwater quality limit. This was due to the injection of industrial sulfuric acid as a leaching agent. The δ34SV-CDT value of the groundwater in the monitoring wells outside the well-site ranged from −11.1 to −6.9‰, and the isotopic composition difference was 4.2‰; the δ34SV-CDT value of the groundwater in the well-site was from −0.6 to +1.0‰, the sulfur isotopic composition was relatively uniform, and the difference was within 1.6‰. The sulfur isotopic compositions of the two were significantly different, indicating that the sources of sulfur were different. The high concentration of SO42− in the groundwater in the well-site came from artificially injected industrial sulfuric acid. If SO42− in the groundwater in the well-site migrates to the periphery of the well-site and exceeds the leaching range under the action of groundwater dynamics, although the additional dilution of groundwater can lead to a significant decrease in the concentration of SO42− in the peripheral groundwater, the dilution will not cause isotope fractionation and changes in isotopic composition. Therefore, there is a significant difference between the δ34SV-CDT values of the groundwater in the well-site and the surrounding groundwater, indicating that the SO42− in the surrounding groundwater does not come from the well-site but the groundwater. This also shows that the balanced overall pumping peripheral small-flow liquid injection method proposed in this paper can obtain a more effective control effect of the leaching range.

5. Conclusions

Through the groundwater dynamics simulation and field verification test of different pumping situations, the following conclusions were drawn:
(1)
It is difficult to control the leaching range by adopting a complete infusion flowrate balance method, and specific control measures must be taken. That is to say, using a reasonable proportion to control the flowrate of the injection wells at different positions can significantly change the shape of the underground flow field and achieve effective control of the uranium leaching range in in-situ leaching mining.
(2)
The traditional method of setting the ratio of total extraction and infusion (total extraction > 0.3% of total injection) has a specific control effect, but has little effect on the leaching range.
(3)
This paper proposes a control method of peripheral small-flow liquid injection. Both field tests and numerical simulation studies show that this method has the most success in controlling the leaching range. In addition, compared with the traditional method of setting the ratio of total extraction and injection (total extraction > 0.3% of total injection), the process of this method is more straightforward, and the control effect is better.

Author Contributions

Conceptualization, C.Z. and K.T.; methodology, K.T.; software, T.X. and Y.Y.; validation, Y.W. and C.L.; formal analysis, C.Z.; investigation, Y.L.; writing—review and editing, C.Z., Y.Z. and H.W. All authors have read and agreed to the published version of the manuscript.

Funding

This research was funded by the National Natural Science Foundation of China-Xinjiang Joint Fund number U1703123.

Data Availability Statement

Data are contained within the article.

Conflicts of Interest

The authors declare no conflict of interest.

References

  1. Jiang, Y.; Yao, Y.X.; Liao, W.S.; Li, X.J.; Liu, C.; Wang, L.M. Cause Analysis of Formation Damage during In-situ Leaching of Uranium. China Nuclear Society. In Proceedings of the 2009 Annual Meeting of China Nuclear Society, Beijing, China, 18 November 2009; pp. 752–762. [Google Scholar]
  2. Seredkin, M.; Zabolotsky, A.; Jeffress, G. In Situ Recovery, an Alternative to Conventional Methods of Mining: Exploration, Resource Estimation, Environmental Issues, Project Evaluation and Economics. Ore Geol. Rev. 2016, 79, 500–514. [Google Scholar] [CrossRef]
  3. Nguyen, V.V.; Pinder, G.F.; Gray, W.G.; Botha, J.F. Numerical simulation of uranium in-situ mining. Chem. Eng. Sci. 1983, 38, 1855–1862. [Google Scholar] [CrossRef]
  4. Tan, K.X.; Wang, Q.L.; Hu, E.M.; Zhou, Q. Multiple Processes Coupling and Reaction Front Propagation during In-situ Leach Mining: 1. Theoretical Analyses. Uranium Min. Metall. 2005, 24, 14–18. [Google Scholar]
  5. Omar, R.; Bruce, T.; José, M.C.; Rodriguez-Freire, L. Groundwater Restoration Following In-Situ Recovery (ISR) Mining of Uranium. Appl. Geo-Chem. 2019, 109, 104–408. [Google Scholar]
  6. Que, W.M.; Tan, Y.H.; Zeng, Y.J.; Wang, S.D. Geochemical Kinetics and Mass Transport of In-Situ Uranium Leaching; Atomic Energy Press: Beijing, China, 2002; pp. 43–44. [Google Scholar]
  7. Wang, H.F.; Su, X.B. Discussion of Push-pull Equilibrium in Well Field at Yining In-situ Leaching Mine, Xinjiang. Uranium Min. Metall. 1999, 18, 145–149. [Google Scholar]
  8. China National Nuclear Corporation. Code for Design of Uranium Mining and Metallurgy Engineering in Nuclear Industry; GB/T 50521-2009; Ji Hua Press: Beijing, China, 2010. [Google Scholar]
  9. Zhang, C.; Tan, K.X.; Xie, T.T.; Tan, Y.; Fu, L.; Gan, N.; Kong, L. Flow Microbalance Simulation of Pumping and Injection Unit in In Situ Leaching Uranium Mining Area. Processes 2021, 9, 1288. [Google Scholar] [CrossRef]
  10. Liu, Z.B.; Wang, H.F.; Wen, Z.Q.; Ding, Y.; Jiang, Y.; Xie, T.; Xu, G.; Wang, G. Study on the Characteristics of Solution Migration and Drawing and Injection Control at Well Field In-Situ Leaching Uranium. Uranium Min. Metall. 2017, 36, 23–26. [Google Scholar]
  11. Zhou, Y.P.; Shen, Z.L.; Sun, Z.X.; He, J.T.; Xing, Y.G. Study on the Influence of Pumping-injection Equilibrium on Outflow of Leaching Solution and Inflow of Groundwater during In-situ Leaching of Uranium. Nonferrous Met. (Min. Sect.) 2013, 65, 1–4. [Google Scholar]
  12. Mercer, J.W.; Faust, C.R.; Cohen, R.M.; Andersen, P.F.; Huyakorn, P.S. Remedial action assessment for hazardous waste sites via numerical simulation. Waste Manag. Res. 1985, 3, 377–387. [Google Scholar] [CrossRef]
  13. Hao, Y.; Liu, J.H.; Zhou, Y.P. Influence of In-situ Leaching on Groundwater around a Sandstone Type Uranium Mine in Xinjiang. Nonferrous Met. Eng. 2013, 3, 50–52. [Google Scholar]
  14. Ababou, R.; McLaughlin, D.; Gelhar, L.W.; Tompson, A.F. Numerical simulation of three-dimensional saturated flow in randomly heterogeneous porous media. Transp. Porous Media 1989, 4, 549–565. [Google Scholar] [CrossRef]
  15. Cao, Y.X.; Zuo, W.; Bao, Z.X.; Gu, P.; Ye, T. Practice and Exploring of Different Proportional Control of Drawing and Injection of Leaching Solution for the In-situ Leaching Uranium and Its Impact on the Groundwater Environment. Uranium Min. Metall. 2017, 36, 134–143. [Google Scholar]
  16. Grubb, S. Analytical model for estimation of steady-state capture zones of pumping wells in confined and unconfined aquifers. Groundwater 1993, 31, 27–32. [Google Scholar] [CrossRef]
  17. Ji, H.B.; Huang, Q.Y.; Zhou, Y.P.; Zhang, Q. Influence of In-situ Leaching Solution Diffusion with Drawing Injection flux Distribution and Drawing Injection proportion. Uranium Min. Metall. 2017, 36, 172–181. [Google Scholar]
  18. Xu, Q. Study on Influence of the Ratio of Drawing-injection to In-situ Leaching Solution Diffusion Range. Uranium Min. Metall. 2017, 36, 93–97. [Google Scholar]
  19. Gräsle, W.; Kessels, W.; Kümpel, H.J.; Li, X. Hydraulic observations from a 1 year fluid production test in the 4000 m deep KTB pilot borehole. Geofluids 2006, 6, 8–23. [Google Scholar] [CrossRef]
  20. Li, D.; Duan, B.S. Microscopic Equilibrium Optimization of Leaching Range in In-situ Leaching Mining Field. Uranium Min. Metall. 2017, 63, 279–283. [Google Scholar]
  21. Saghravani, S.R.; Mustapha, S.A.; Ibrahim, S.; Azwan, M.; Zawawi, M.; Randjbaran, E. Simulation of phosphorus movement in unconfined aquifer by means of visual MODFLOW. J. Comput. Sci. 2010, 6, 446. [Google Scholar]
  22. Li, M.J.; Lian, G.X.; Cao, F.B.; Yang, B. Study on Application of Non-uniform Drawing and Injection Flow Technology in Groundwater Protection during In-situ Leaching of Uranium. Uranium Min. Metall. 2017, 36, 98–104. [Google Scholar]
  23. Hudak, P.F. Groundwater modeling applied to production well management in a contaminated aquifer. Environ. Geol. 1994, 23, 119–124. [Google Scholar] [CrossRef]
  24. Chang, Y.X.; Tan, K.X.; Zhang, C.; Yao, Y.X.; He, C.Y.; Liu, Y. Simulation Study on Groundwater Dynamics Control of Leaching Range of In-situ Uranium Well Field. J. Univ. South China (Sci. Technol.) 2020, 36, 134–143. [Google Scholar]
  25. May, R.; Yusoff, I.; Tahir, W. Effects of Groundwater Withdrawal on the Interaction of Ex-mining Pond, River, and Aquifer. In Applied Mechanics and Materials; Trans Tech Publications Ltd.: Baech, Switzerland, 2014; Volume 567, pp. 38–43. [Google Scholar]
  26. Cheng, H. Calculation Method of Number of Pumping and Injection Holes in In-situ Leaching Well Field. China Nuclear Society. Progress Report on Nuclear Science and Technology in China (Volume V)—Proceedings of 2017 Annual Meeting of China Nuclear Society Volume 2 (Uranium Geology Sub Volume (2), Uranium Mining and Metallurgy Sub Volume). China Nucl. Soc. China Nucl. Soc. 2017, 4, 144–147. [Google Scholar]
  27. Solodov, I.N. The retardation and attenuation of liquid radioactive wastes due to the geochemical properties of the zone of injection. Geol. Soc. Lond. Spec. Publ. 1998, 128, 265–280. [Google Scholar] [CrossRef]
  28. Wang, X.W. Overview of In-situ Leaching of Uranium. Uranium Min. 1996, 1, 1–12. [Google Scholar]
  29. Wang, H.F. Technology and Practice of In-Situ Leaching of Uranium; Atomic Energy Press: Beijing, China, 1998; Volume 32, pp. 121–124. [Google Scholar]
  30. Lu, H.; Xu, Z.D.; Iseley, T.; Matthews, J.C. Novel data-driven framework for predicting residual strength of corroded pipelines. J. Pipeline Syst. Eng. 2021, 12, 04021045. [Google Scholar] [CrossRef]
  31. Chen, C.X.; Tang, Z.H. Numerical Method of Groundwater Flow; China University of Geosciences Press: Beijing, China, 1994; pp. 7–10. [Google Scholar]
  32. Wang, J.X. The Water Potential Description, Theoretical Models Study of Rainfall Infiltration and Application. Ph.D. Thesis, Tsinghua University, Beijing, China, 2010. [Google Scholar]
  33. Patrick, A.D.; Franklin, W.S. Physical and Chemical Hydrogeology; Wang, Y.X., Translator; High Education Press: Beijing, China, 2012; pp. 186–190. [Google Scholar]
  34. Chen, C.X.; Lin, M.; Cheng, J.M. Groundwater Dynamics; Geological Publishing House: Beijing, China, 2011; Volume 32, pp. 126–129. [Google Scholar]
  35. Zheng, C.M.; Gordon, D.B. Applied Contaminant Transport Modeling, 2nd ed.; Sun, J.Y.; Lu, G.P., Translators; High Education Press: Beijing, China, 2002; pp. 99–106. [Google Scholar]
Figure 1. Distribution of injection wells in the in-situ leaching mining area.
Minerals 12 00787 g001
Figure 2. Comparative study process of leaching range control effect.
Minerals 12 00787 g002
Figure 3. Schematic diagram of model meshing (z-axis magnified 2.5 times).
Minerals 12 00787 g003
Figure 4. Water level contour map of the in-situ leaching mining area.
Minerals 12 00787 g004
Figure 5. Comparison chart of leaching range under the 0.3% pumping injection ratio (TEF > 0.3%TIF).
Minerals 12 00787 g005
Figure 6. Comparison chart of leaching range under the condition of equilibrium pumping injection ratio (TEF = TIF).
Minerals 12 00787 g006
Table 1. Conditions of the comparison test.
ModelTotal Infusion Flow RatioFlow Ratio of Injection Wells at Different Positions
Edge Orifice Flow/Internal Orifice FlowVertex Orifice Flow/Internal Orifice Flow
Model A0.00311
Model B0.0031/21/4
Model C0.0031/41/8
Model D0.0031/61/12
Model A10.00011
Model B10.0001/21/4
Model C10.0001/41/8
Model D10.0001/61/12
Note: Total infusion flow ratio equal to (QteQti)/Qte. Qte is the total extraction flow; Qti is the total injection flow.
Table 2. Flow distribution table of injection wells at different positions.
Drill NumberInjection Well LocationQA
(m3/h)
QB
(m3/h)
QC
(m3/h)
QD
(m3/h)
QA1
(m3/h)
QB1
(m3/h)
QC1
(m3/h)
QD1
(m3/h)
Z7Internal6.389.9712.76214.086.4010.0012.8014.12
Z8Internal6.389.9712.76214.086.4010.0012.8014.12
Z9Internal6.389.9712.76214.086.4010.0012.8014.12
Z12Internal6.389.9712.76214.086.4010.0012.8014.12
Z13Internal6.389.9712.76214.086.4010.0012.8014.12
Z14Internal6.389.9712.76214.086.4010.0012.8014.12
Z17Internal6.389.9712.76214.086.4010.0012.8014.12
Z18Internal6.389.9712.76214.086.4010.0012.8014.12
Z19Internal6.389.9712.76214.086.4010.0012.8014.12
Z2Edge6.384.993.1902.356.405.003.202.35
Z3Edge6.384.993.1902.356.405.003.202.35
Z4Edge6.384.993.1902.356.405.003.202.35
Z6Edge6.384.993.1902.356.405.003.202.35
Z10Edge6.384.993.1902.356.405.003.202.35
Z11Edge6.384.993.1902.356.405.003.202.35
Z15Edge6.384.993.1902.356.405.003.202.35
Z16Edge6.384.993.1902.356.405.003.202.35
Z20Edge6.384.993.1902.356.405.003.202.35
Z22Edge6.384.993.1902.356.405.003.202.35
Z23Edge6.384.993.1902.356.405.003.202.35
Z24Edge6.384.993.1902.356.405.003.202.35
Z1Top corner6.382.491.5951.176.402.501.601.18
Z5Top corner6.382.491.5951.176.402.501.601.18
Z21Top corner6.382.491.5951.176.402.501.601.18
Z25Top corner6.382.491.5951.176.402.501.601.18
Table 3. SO42− concentration and sulfur isotopic composition of groundwater in and around an in-situ leaching well-site in Xinjiang.
Sampling LocationSample NumberSO42− Concentration
(mg/L)
δ34S
(‰)
Inside the well-siteC123,0470.4
C217,447−0.4
C323,3750.4
C426,875−0.5
C527,778−0.6
C628,760−0.2
C731,525−0.3
C839,2031.0
C940,2030.3
C1036,453−0.3
Monitoring well outside the well-siteJ1194−11.1
J2210−8.2
J3212−10.5
J4237−9.7
J5216−8.3
J6141−6.9
Publisher’s Note: MDPI stays neutral with regard to jurisdictional claims in published maps and institutional affiliations.

