1. Introduction
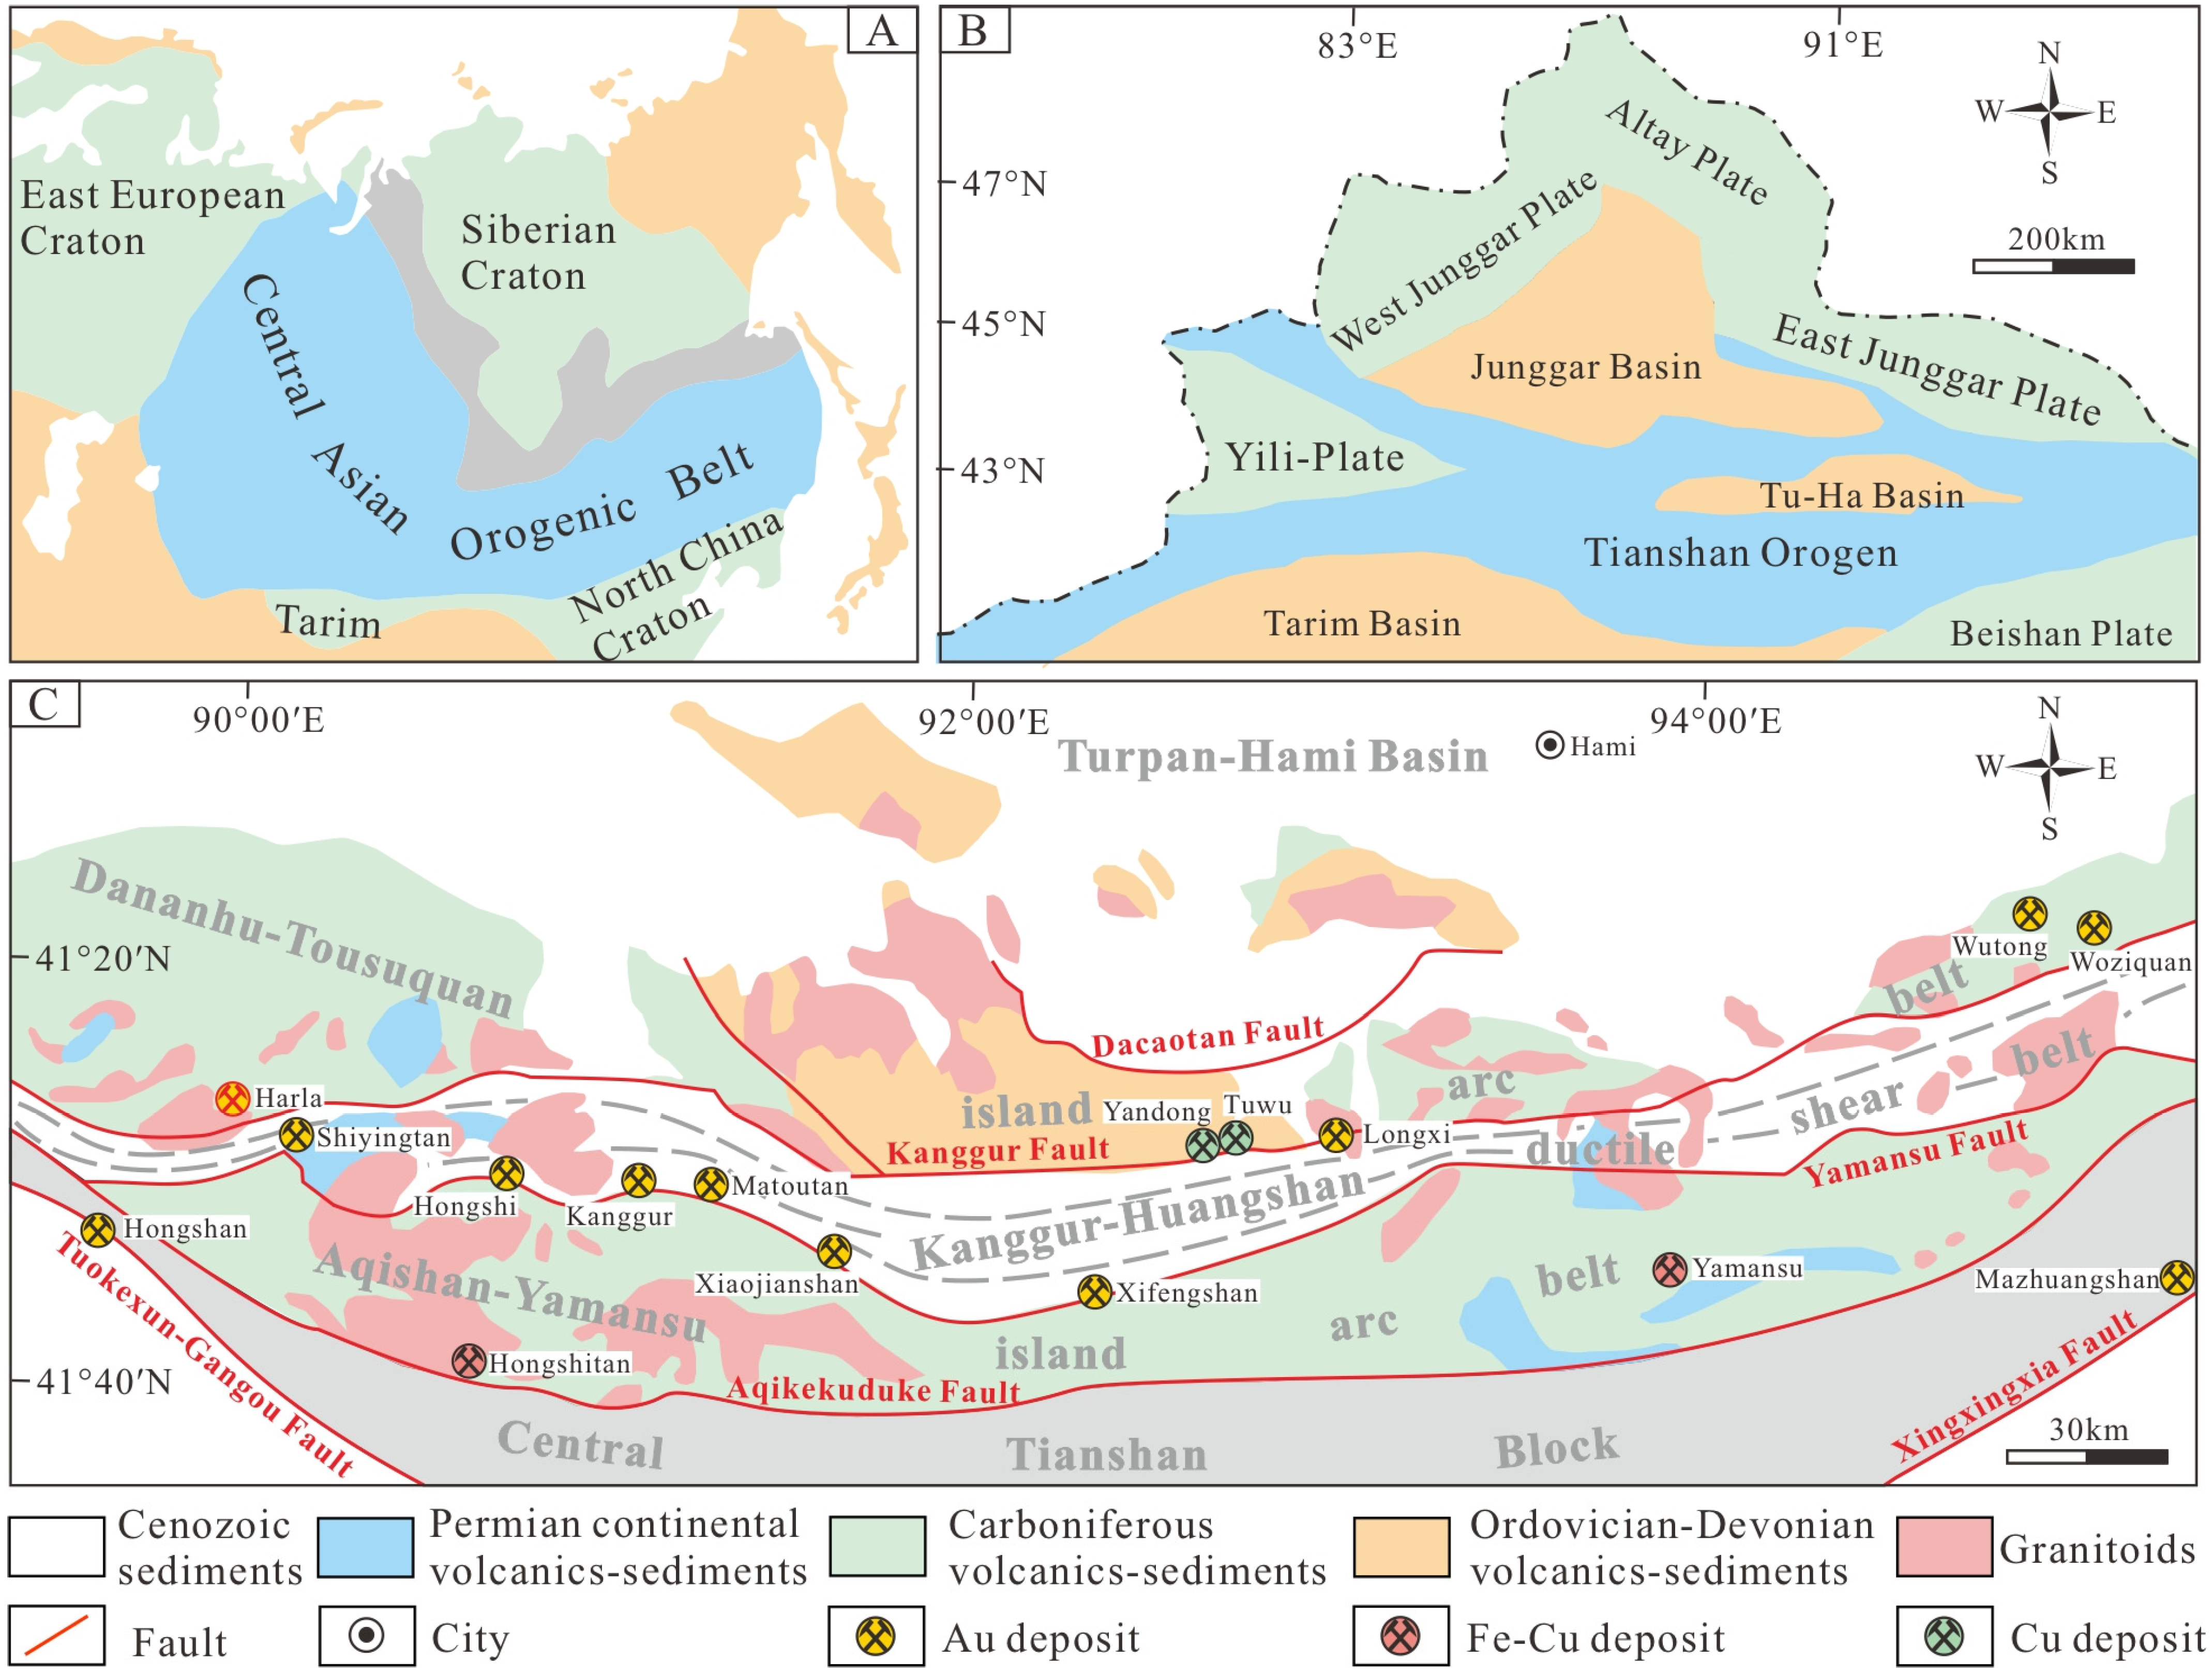
The Tianshan Orogen is located at the southeastern margin of the Central Asian Orogenic Belt, which represents the largest tectonic assembly of accretionary complexes in the world (
Figure 1A). The Eastern Tianshan Orogen (ETO), comprising the eastern segment of the Tianshan Orogen (
Figure 1B), experienced a complex tectonic evolutionary process of subduction, accretion, and collision and is known for hosting massive Au–Cu–Ni mineralizations [
1,
2,
3]. At present, more than 10 gold deposits have been discovered in the ETO (such as the Kanggur, Shiyingtan, and Xifengshan gold deposits, among others) providing more than 100 tons of gold reserves [
4]. These deposits are all hosted within or close to the Kanggur-Huangshan ductile shear belt (
Figure 1C), and their genesis still remains controversial. While an orogenic-type genesis has been widely accepted by numerous scholars, others have reported a genetic association with Late Paleozoic granitic intrusions for some of these gold deposits, which could thus be classified as epithermal [
4,
5,
6].
The Harla gold deposit, located in the western Kanggur-Huangshan ductile shear belt of the ETO, was discovered by the Geological Party No. 11 of the Xinjiang Bureau of Geology and Mineral Exploration during the 1:50,000 regional geological survey in 1994. At present, the deposit has proven reserves of 1.5 t Au, with an average grade of 5.43 g/t. There have only been a few research studies of this area, with their main focus on geology, tectonic framework, and mineralization [
7,
8]. Hence, the source of ore-forming fluids and materials, as well as the ore-forming mechanism has not been adequately constrained until now. This limited our understanding of gold mineralization regularity and the potential for exploring additional gold resources in the ETO.
The scope of this paper is twofold. Firstly, we aim to carry out a detailed petrographic and fluid inclusion (FI) study on the Harla gold deposit to constrain the thermal and depth conditions of mineralization. Secondly, we combine FI data with H-O-C-S-Pb isotope data to examine the source of ore-forming fluids and materials, in order to propose a genetic model for the Harla gold deposit. With this study, we aim to further promote research on similar gold deposits in the Tianshan Orogen.
2. Regional Geology
The ETO is a typical Paleozoic island arc system characterized by diverse mineralization styles. Regional structures are dominated by a series of near EW-trending faults. These faults controlled the emplacement of granitoids and strata and divided the region into three sections from north to south, namely the Dananhu-Tousuquan island arc belt, the Kanggur-Huangshan ductile shear belt, and the Aqishan-Yamansu island arc belt, respectively (
Figure 1C) [
2].
The Dananhu-Tousuquan island arc belt is composed of Ordovician Dahongliu Formation basalts with interlayered pyroclastic rocks, Silurian Hongliuxia Formation tuff and tuff sandstone, Devonian Dananhu Formation and Carboniferous Qieshanzu Formation andesites, dacites, and pyroclastic rocks [
3,
4,
5]. Typical ore deposits include Tuwu-Yandong porphyry Cu deposits. The Kanggur-Huangshan ductile shear belt is sandwiched between the Kanggur fault and the Yamansu fault, spanning 600 km lengthwise and 10–30 km in width [
4,
5,
6]. This shear belt comprises a series of mylonites and mylonitized rocks. Several gold and Cu–Ni sulfide deposits occur in the ductile shear zone, such as the Shiyingtan gold deposit, the Kanggur gold deposit, and the Huangshandong Cu-Ni deposit. The Aqishan-Yamansu island arc belt is comprised of Carboniferous Aqishan Formation andesitic-dacitic tuff, Yamansu Formation basalt, andesite and dacite, Tugutubulake Formation rhyolite, and Xiaorequanzi Formation basalt, andesite, and pyroclastic rocks [
3,
4,
5]. Typical ore deposits include Yamansu and Hongyuntan skarn Cu–Fe deposits.
Late Paleozoic granitoids are widespread and consist of quartz porphyry, diorite porphyry, granite porphyry, and rhyolite porphyry, many of which are associated with polymetallic mineralization.
3. Deposit Geology and Mineralization
The Harla Au deposit (lat. 42°11′ N, long. 90°07′ E) is located approximately 80 km southeast of the city of Trupan. The strata exposed in the deposit are mainly Lower Carboniferous Xiaorequanzi Formation volcanic rocks and Quaternary sediments (
Figure 2A). The Xiaorequanzi Formation strikes approximately EW, dips 160–170° at an angle of 70–75° and is divided into two lithological units. The lower unit is a set of volcanic lava with intercalated pyroclastic rocks—mainly andesite and basalt with interbedded andesitic tuff—while the upper unit is a set of clastic rocks with intercalated volcanic lava and pyroclastic rocks—mainly tuffaceous sandstone, andesite, and andesitic tuff. The dominant structures are NE-trending faults, along with secondary NW-trending and near EW-trending faults. The main igneous lithologies include dacite porphyry, plagiogranite, and potassium granite.
A total of 21 industrial orebodies have been described in the Harla gold deposit. Orebodies are primarily hosted in the upper unit of the Xiaorequanzi Formation and are controlled by the aforementioned EW-trending faults. Mineralization occurs as lenticular orebodies and veins, with a NE-trending, near-parallel distribution. Orebody No. L9 is the most economically valuable (
Figure 2B). Orebody No. L9 is 110 m long and 0.6–14.4 m thick, extends to a depth of 88 m, dips 160° at an angle of 45–85°, and yields average grades of 5.84 g/t Au with such trace elements as Ag (26.50 g/t), As (36.80 g/t), Sb (2.50 g/t), and Bi (0.21 g/t).
Ore minerals include pyrite, specularite, jarosite, chalcopyrite, and gold, along with minor galena, sphalerite, limonite, and malachite (
Figure 3). Gangue minerals include quartz, sericite, muscovite, calcite, alunite, chlorite, and kaolinite. Wall rock alteration consists of silicification, carbonation, sericitization, and kaolinization (
Figure 3K,L). Based on the paragenetic relationships of minerals and crosscutting relationships between veins, three paragenetic stages of mineralization have been recognized (
Figure 4).
The early stage consists of specularite–pyrite–quartz veins (
Figure 3A,B). Blade-shaped specularite is the most abundant ore mineral (
Figure 3G), varying in size from a few millimeters up to 1 cm, and locally as fine- to medium-grained aggregates. The intermediate stage is characterized by pyrite–chalcopyrite–gold–quartz veins (
Figure 3C), which account for the majority of the gold production. Most of the native gold is granular or flakily distributed in quartz grains (
Figure 3H). Pyrite is found as euhedral to subhedral grains, while chalcopyrite grains are anhedral and intergrown with pyrite (
Figure 3I,J). Some ores underwent hypergene oxidation, forming jarosite, limonite and malachite (
Figure 3D). Individual pyrite–chalcopyrite–gold–quartz veins crosscut specularite–pyrite–quartz veins (
Figure 3E), indicating a more recent occurrence. The late stage is dominated by calcite–quartz veins (
Figure 3F), with minor galena, sphalerite, and pyrite.
4. Materials and Methods
Twenty-five representative samples, including 19 quartz vein samples and 6 pyrite samples, were collected from the Harla deposit for petrographic, FI, and H-O-C-S-Pb isotope studies.
Petrographic studies were carried out to identify the sequence of mineral growth and paragenetic relations, with special focus on the generation of host quartz. Three generations of host quartz were identified, with six to seven samples for each paragenetic stage. Early stage quartz is ivory-white, medium-coarse-grained, and symbiotic with specularite and pyrite. Intermediate stage quartz is off-white, medium-fine-grained, and symbiotic with native gold, chalcopyrite and pyrite. Late stage quartz is gray smoky, medium-fine-grained, devoid of sulfides, and symbiotic with calcite. Nineteen double polished 0.20–0.25 mm thick sections were prepared for FI analyses. FI analyses were carried out at the Geofluids Lab, Xinjiang University, Urumqi, China, using a Linkam THMS600 heating-freezing stage, which was calibrated using synthetic FIs of known compositions (Tmelt-H2O = 0 °C, Tmelt-CO2 = −56.6 °C, Tmelt-K2Cr2O7 = 398 °C). Temperature measurement precision was ±0.2 °C during freezing below 0 °C, and ±2 °C during heating between 100 °C and 600 °C.
H-O-C-S and Pb Isotopic analyses were performed at the Beijing Geoanalysis Co., Ltd. (Beijing, China), using a MAT-253 plus mass spectrometer and a Thermo Fisher Neptune plus MC-ICP-MS, with analysis accuracy of ±0.2‰ and ±0.005%, respectively. Monomineral quartz grains—representative of each of the paragenetic stages—were prepared for H-O-C isotopic analyses. The effects of multi-stage FI mixing in the quartz samples were eliminated by the gradual thermal crack method. Quartz δ
18O was measured in CO
2 obtained using the BrF
5 method [
9]. δD values were measured in FI water decrepitated from host quartz, and the water was converted to H
2 by reaction with glassy carbon particles at 1420 °C [
10]. δC values were measured in FI water by treatment with orthophosphoric acid at 50 °C to generate CO
2 [
11]. Monomineral pyrite grains—representative of early and intermediate stages—were prepared for S-Pb isotopic analyses. δ
34S values were determined from SO
2, obtained by reaction with Cu
2O [
12]. Pb isotopic compositions were measured by the dissolution of pyrite in a mixture of HNO
3 and HCl, and separation with the AG1-X8 anion exchange resin method [
13].
Isotopic data were reported in relation to Vienna Standard Mean Ocean Water (VSMOW) for δ18O and δD, Pee Dee Belemnite (PDB) for δC, and Vienna Canyon Diablo Troilite (VCDT) for δ34S. Pb ratios were corrected using the ANBS-981 standard.
5. Results
5.1. Fluid Inclusion Petrography
Based on their entrapment mechanism and their relationship with the host quartz, FIs were classified into the following groups (
Figure 5A): (1) primary FIs entrapped in the growth zones of the host quartz crystal; (2) pseudo-secondary FIs entrapped in fractures during crystal growth; and (3) secondary FIs entrapped in fractures after formation of the host quartz crystal [
14]. Only the first two groups could potentially characterize the ore-forming fluids. However, it is often difficult to determine the accurate origin of FIs (i.e., primary, pseudo-secondary, or secondary). We attempted to define the origin of FIs through a detailed description of their occurrence.
Based on room temperature phase compositions and phase transition behavior during heating and freezing, three types of FIs were recognized in the Harla deposit: (1) daughter mineral-bearing triphase FIs (S-type), (2) liquid-dominated biphase FIs (LV-type), and (3) liquid-only monophase FIs (L-type).
S-type FIs are comprised of a liquid phase, a vapor phase, and a cubic crystal at room temperature, with vapor/liquid ratios of ~10% and crystal/total ratios of ~15% by visual estimate (
Figure 5B,C). These FIs occur with irregular and sub-rounded shapes and are 10 to 15 μm in size. During heating of S-type FIs, cubic crystals—considered as halite—dissolved at consistent temperatures and are regarded as daughter minerals. S-type FIs were totally homogenized to the liquid phase.
LV-type FIs are composed of a liquid phase and a vapor phase at room temperature, with consistent vapor/liquid ratios of 5%–15% by visual estimate (
Figure 5D–F). These FIs occur as negative quartz crystals or ellipsoidal shapes and are 5 to 15 μm in size. LV-type FIs were homogenized to the liquid phase.
L-type FIs are comprised of a single liquid phase at room temperature, with sub-rounded or irregular shapes, and range from 5 to 10 μm in size (
Figure 5G,H).
5.2. Fluid Inclusion Microthermometry
The fluid inclusion assemblage (FIA) concept [
15] was introduced to verify the validity of microthermometric data. When it is difficult to observe a cluster of FIs occurring along growth zones of host quartz (FIA), a cluster of FIs within a limited area with similar vapor/liquid ratios and homogenization temperatures (T
h) can also be used for microthermometric measurements [
16,
17]. All FIs used for microthermometry were entrapped as a homogeneous phase without significant post-entrapment modification (e.g., the necking, stretching, or deformation of the host crystal). Fluid compositions were estimated according to the first melting temperatures (T
first-melt) of observable LV-type FIs and approximated to the H
2O-NaCl system [
15]. FI salinities were calculated using ice-melting (T
melt-ice) and halite-melting temperatures (T
melt-halite) [
18,
19]. A total of 21 FIAs and 129 FIs were chosen for microthermometric analysis. Detailed data and diagrams are present in
Figure 6 and
Table 1.
Early stage quartz is characterized by the presence of LV-type (90%) and S-type (10%) FIs. These two types of FIs occurred separately without obvious crosscutting relationships (
Figure 5B). LV-type FIs were dominant and commonly occurred as short trails or clusters within crystals, with a probable pseudo-secondary origin. A few T
first-melt were measured at −23 to −22 °C, which are close to the eutectic point for the NaCl-KCl-H
2O system (−23.5 °C). Ice-melting temperatures (T
melt-ice) of LV-type FIs range from −5.8 to −4.2 °C, which correspond to salinities of 6.7–8.9 wt.% NaCl eqv. LV-type FIs homogenized to the liquid phase (V+L→L) with vapor disappearing at 199–222 °C. S-type FIs are scattered and occur in isolation within host quartz crystals, which indicates they are likely to be primary FIs. S-type FIs show two different homogenization behaviors. When heating, most S-type FIs totally homogenize to liquid (V+L+S→ L), with the vapor phase disappearing completely at 216–225 °C. Daughter minerals dissolved before the vapor phase disappeared at 206–217 °C, with salinities of 32.2–32.8 wt.% NaCl eqv. While some S-type FIs totally homogenized to liquid (V+L+S→L) and daughter minerals dissolved completely at 218–229 °C—with salinities of 32.8–33.4 wt.% NaCl eqv. The vapor phase disappeared before the dissolution of daughter minerals.
Intermediate stage quartz is characterized by the presence of LV-type FIs only. LV-type FIs occur in clusters or are randomly distributed within quartz crystals (
Figure 5F), indicating a most likely primary origin. The measured T
first-melt for a few FIs range from −22 °C to −21 °C, indicating a NaCl-H
2O system (−21.2 °C). T
melt-ice range from −4.7 °C to −3.4 °C, corresponding to salinities of 5.6–7.4 wt.% NaCl eqv. LV-type FIs homogenize to a liquid phase (V+L→L) with the vapor phase disappearing at 163–191 °C.
Late stage quartz is characterized by the presence of LV-type (~80%) and L-type (~20%) FIs. LV-type FIs commonly occur in short, healed fractures or clusters within crystals, which are most likely of pseudo-secondary or primary origin. L-type FIAs were observed occasionally crosscutting LV-type FIAs (
Figure 5G), indicating their later formation. The fluid is close to the NaCl-H
2O system (T
first-melt= −22 °C to −21 °C). FIs have a T
melt-ice range from −3.4 to −2.2 °C, with salinities of 3.7 to 5.6 wt.% NaCl eqv. and T
h ranging from 135 to 158 °C. Some LV-type FIs are interpreted to have a secondary origin since they occur in long trails across grains.
5.3. H-O-C-S-Pb Isotopes
Twelve quartz samples representing the early, intermediate, and late stages were analyzed for H-O-C isotopes. δD
H2O values of fluids from the early, intermediate, and late stages range from −63.5 to −61.4‰, −69.8 to −64.2‰, and −88.1 to −84.6‰, respectively. δ
18O
quartz values of fluids from the early, intermediate, and late stages are 10.5 to 13.6‰, 7.2 to 9.8‰, and 5.6 to 6.9‰, respectively. Isotopic fractionation between quartz and water was calculated using the following equation: 1000lnαqz − H
2O = 3.38 × 10
6/T
2 − 3.40 [
20]. The average homogenization temperature of FIs was calculated for the same samples. Calculated δ
18O
H2O values are −0.4 to 3.3‰, −6.5 to −3.1‰, and −10.7 to −8.5‰, respectively. Fluid δC
H2O values show a narrow range from −8.9 to −6.2‰.
Six pyrite samples representing the early and intermediate stages were analyzed for S-Pb isotopic composition. Three early-stage pyrite samples show δ34Spyrite values of 0.2 to 1.6‰ with an average of 0.7‰. Another three pyrite samples from the intermediate stage show δ34Spyrite values of 0.8 to 2.5‰ with an average of 1.5‰. Pb isotopic compositions show that six pyrite samples have 206Pb/204Pb ratios ranging from 17.709 to 17.992 with an average of 17.876, 207Pb/204Pb ratios ranging from 15.483 to 15.569 with an average of 15.520, and 208Pb/204Pb ratios ranging from 37.533 to 37.754 with an average of 37.655.
Results from H-O-C and S-Pb isotope analyses are shown in
Table 2 and
Table 3, respectively.
6. Discussion
6.1. Characteristics of Ore-Forming Fluids
Geofluids play a pivotal role in mineralization processes, since they record the connection between the evolution of the ore-forming fluid and ore deposition [
21].
Early stage fluids are characterized by the presence of LV-type and S-type FIs. However, these two types of FIs were not entrapped synchronously. Although there is no obvious crosscutting relationship, T
h and salinities of S-type FIs (216–229 °C, 32.2–33.4 wt.% NaCl eqv.) are higher than those of LV-type FIs (199–222 °C, 6.7–8.9 wt.% NaCl eqv.). These two FI types homogenized to liquid with significantly different salinities, which could never be trapped together as a homogeneous fluid (
Figure 7A). We speculate that the high salinity S-type FIs may be derived from magmatic water, as reported in many magmatic hydrothermal deposits. While the CO
2-poor, low-temperature, and low-salinity LV-type FIs are more likely to be sourced from meteoric water. Orebodies occur as veins hosted in near-EW trending faults, which indicates they were formed by open-space filling under hydrostatic pressure. For homogeneously entrapped assemblages in which the FIs contain a daughter mineral with T
melt-halit higher than the vapor disappearance temperature (V+L+S→L+S), then T
melt-halit may be considered as the minimum trapping temperature, and the pressure at this temperature may be considered as the minimum trapping pressure [
22,
23]. Estimated minimum trapping pressures of the main gold mineralization were ~30 bar, which corresponds to ~0.3 km—assuming hydrostatic pressure (
Figure 7B) [
24].
Intermediate stage fluids are characterized by the presence of LV-type FIs only. These FIs show consistent Th (163–191 °C), salinities (5.6–7.4 wt.% NaCl eqv.), and vapor-liquid ratios (10%–15%), which indicates they were trapped from a single homogeneous fluid. In contrast to early-stage fluids, the disappearance of high salinity S-type FIs may be related to the gradual dilution of low-temperature and low-salinity fluids, which also suggests an increasing contribution of meteoric water.
Late stage fluids are characterized by the presence of LV-type and L-type FIs. These two types of FIs were found within individual quartz grains. Compared to the earlier stages, FIs were trapped under lower temperatures (135–158 °C) and lower salinities (3.7–5.6 wt.% NaCl eqv.). The decreased vapor–liquid ratio of LV-type FIs (5%–10%) compared to intermediate stage FIs also suggests a gradual decrease in trapping temperatures. L-type FIs are interpreted to have been entrapped in the near-surface vadose zone, with a shallower mineralization depth.
6.2. The Origin of Ore-Forming Fluids
H-O-C isotopic data were used to trace fluid sources and deduce fluid evolution processes.
The δ
18O
H2O (−10.7 to 3.3‰) and δD
H2O (−88.1 to −61.4‰) values of quartz samples of the Harla gold deposit are similar to the range of most published data for typical epithermal gold deposit elsewhere (
Figure 8) [
25,
26,
27,
28,
29,
30], such as the Shiyingtan gold deposits in China (δ
18O
H2O = −12.7 to −1.7‰, δD
H2O = −119.5 to −90.2 ‰ [
26]), the Sunshin gold deposit in South Korea (δ
18O
H2O = −10.1 to −1.9‰, δD
H2O = −100 to −82 ‰ [
27]), and the Porgera gold deposit in Papua New Guinea (δ
18O
H2O= −1.4 to 3.4‰, δD
H2O = −81 to −53 ‰ [
28]). The large variation of δ
18O
H2O values in quartz samples of the three mineralization stages indicates that the ore-forming fluids were not sourced from a single reservoir. When plotted on the δD
H2O vs. δ
18O
H2O diagram, early-stage sample data fall between the magmatic water box and the meteoric water line, indicating a hybrid origin for the ore-forming fluids. Compared to the early stage, the intermediate stage data points define a trend towards the meteoric water line, reflecting an increasing contribution of meteoric water over time. On the other hand, late-stage sample data fall close to the meteoric water line, indicating a predominantly meteoric water origin. Relatively low δD values from the bulk extraction of FIs are often considered to reflect the formation of secondary FIs after mineralization, during uplift of the deposits. δ
18O
H2O and δD
H2O values of quartz samples gradually decrease from early to late mineralization stages, with data points shifting from the magmatic water box towards the meteoric water line. This suggests an evolving nature and source of ore-forming fluids. Evidence from FIs shows that the initial fluid belonged to a medium- to low-temperature NaCl–KaCl–H
2O system with uneven salinity, which evolved to a low temperature and low salinity NaCl–H
2O system. Thus, we infer that the ore-forming fluids gradually evolved from a mixed magmatic–meteoric water source to a meteoric water-dominant source.
Carbon isotopic data for FI water in the Harla gold deposit show narrow variation values (−8.9 to −6.2‰), which overlap with δC values of other typical gold deposits in the ETO (
Figure 9) [
31,
32,
33], such as the Shiyingtan deposit (δC = −6.75 to −2.02‰ [
32]) and the Hongshi deposit (δC = −11.57 to −5.14‰ [
32]). Most carbon isotopic compositions (>−10‰) show an inorganic carbon origin, close to pyroclastic rocks (δC = −6.11‰ [
33]) and mylonites (δC = −7.93 to −5.87‰ [
32]) in the region. This indicates extensive water–rock reaction during the metallogenic process. Mineralization at the Harla deposit is believed to be closely related to the convective circulation of heated meteoric water in the wall rocks.
6.3. Sources of Ore-Forming Materials
Sulfur and lead isotope compositions help to trace the source of ore-forming materials.
The δ
34S compositions of 6 pyrite samples at the Harla deposit exhibit a narrow δ
34S range of 0.2 to 2.5‰, and broadly overlap with other epithermal gold deposits in the Tianshan orogen (
Figure 10) [
29,
30,
32,
34]. For instance, the Bogutu deposit (0.9 to 5.5‰ [
29]), the Axi deposit (−4.0 to 1.4‰ [
30]), and the Shiyingtan deposit (1.16‰ [
32]). Near-zero δ
34S values indicate a possible magmatic source [
35]. FI and H-O-C isotope compositions also support the contribution of magma, but it is difficult to distinguish whether this magmatic sulfur derived from volcanic rocks or intrusions. Geochemical analyses reveal that the lower Carboniferous Xiaorequanzi Formation (volcanic rocks) and plagiogranite exposed in the mine have Au concentrations of 22.88 × 10
−9 and 34 × 10
−9 [
8], which is higher than the Au Clarke value (5 × 10
−9). Both of these host rocks could provide important source materials for Au mineralization at the Harla deposit. The high gold content in the wall rocks allows for meteoric water leaching and extraction of ore constituents from wall rocks.
Six pyrite samples from gold mineralization stages exhibit limited variability in Pb isotope composition. In the
206Pb/
204Pb vs.
208Pb/
204Pb, and
206Pb/
204Pb vs.
207Pb/
204Pb diagrams (
Figure 11) [
29,
32,
34,
36], pyrite plots are linearly distributed between the orogenic evolution curves and mantle evolution curves, or between the orogenic evolution curves and lower crustal evolution curves, which suggest a hybrid mantle and crustal origin. At the Harla deposit, the high radiogenic end-member is similar to the crustal lead reservoir [
36] and is possibly represented by host rocks of the Xiaorequanzi Formation. The low radiogenic end-member is similar to the mantle reservoir, which may correspond to the plagiogranite.
6.4. Genesis of the Harla Deposit
The Kanggur-Huangshan ductile shear belt is well known for abundant gold resources. Gold deposits hosted in or close to the ductile shear zone can be roughly divided into two genetic types: epithermal type deposits (such as the Shiyingtan deposit [
6,
26,
32]), and orogenic type deposits (such as the Kanggur deposit [
3,
4,
5]).
Based on the above discussion and the comparison with typical gold deposits in the ETO, the Harla gold deposit shows many features that are comparable with epithermal gold deposits and different from orogenic gold deposits (
Table 4). These features include: (1) the orebodies are hosted in volcanic rocks and controlled by faults; (2) sulfide minerals are represented by pyrite with minor chalcopyrite, which account for ~10% of the ore; (3) wall rock alteration is dominated by silicification and carbonatization; (4) CO
2-poor liquid-dominated briphase FIs with low salinity (2.0–20.7 equiv. wt% NaCl) are the major ore-forming fluids; (5) relatively low FI T
h (100 to 300 °C) with shallow estimated mineralization depths (<1.0 km); (6) the ore-forming fluid is dominated by meteoric water with minor magmatic water contribution; (7) wall rocks provide the necessary ore-forming materials.
Geological and geochemical features show that the Harla gold deposit is a typical epithermal-type gold deposit. Based on geology, FIs, and isotope signatures, we propose a possible genesis model for the Harla gold deposit. The strong ductile deformation within the Kanggur-Huangshan ductile shear belt results in a number of open spaces and faults forming in the strata. These open spaces provide pathways for meteoric water infiltration. Magma upwelling and emplacement provided a thermal driving force and fluids for the mineralization system. The convective circulation of heated meteoric water in the wall rocks continuously extracted ore-forming materials from wall rocks. As magma crystallization and continuous dilution by meteoric water occurred, the ore-forming system gradually cooled, and ore constituents began to precipitate. Disseminated mineralization precipitated in the wall rocks and vein-like mineralization precipitated in the faults.
7. Conclusions
(1) FI studies and H-O-C isotope data for three mineralization stages in the Harla gold deposit demonstrate the evolution of ore-forming fluids from a mixed magmatic-meteoric water source to a meteoric water-dominant source. Sulfur and lead isotope compositions indicate that ore-forming materials were most likely derived from Xiaorequanzi Formation volcanic rocks and plagiogranite.
(2) According to the petrography, microthermometry, and H-O-C-S-Pb isotope systematics of the Harla gold deposit, combined with the deposit geology and regional geological evolution, we suggest that the Harla gold deposit is an epithermal gold deposit.
(3) The genesis model for the Harla gold deposit provides the basis for deep and peripheral prospecting and exploration. Comparing the Harla gold deposit to other typical deposits in the region will further deepen our understanding of the regional gold mineralization regularity and promote the research on epithermal gold deposits in the ETO or CAOB.
Author Contributions
Conceptualization: C.C.; methodology: F.X.; software: L.G.; validation: S.L.; formal analysis: S.L.; investigation: C.C.; resources: C.C.; data curation: F.X.; writing—original draft preparation: C.C.; writing—review and editing: S.L.; visualization: S.L.; supervision: F.X.; project administration: S.L. and L.G.; funding acquisition: S.L. and X.Z. All authors have read and agreed to the published version of the manuscript.
Funding
This work was supported by the Natural Science Foundation of the Xinjiang Uygur Autonomous Region (2020D01C075), Higher Educational Science and Research Program of Xinjiang, China (XJEDU2021Y015), and Tianshan Innovation Team Program (2020D14023).
Data Availability Statement
The data used to support the findings of this study are included in the article.
Acknowledgments
We would like to thank the managing editor and reviewers for their positive and constructive comments, which significantly improved this paper.
Conflicts of Interest
The authors declare no conflict of interest.
References
- Jahn, B.M.; Wu, F.Y.; Chen, B. Granitoids of the Central Asian Orogenic Belt and continental growth in the Phanerozoic. Trans. R. Soc. Edinb. Earth Sci. 2000, 91, 181–193. [Google Scholar]
- Chen, Y.J.; Pirajno, F.; Wu, G.; Qi, J.P.; Xiong, X.L. Epithermal deposits in North Xinjiang, NW China. Int. J. Earth Sci. 2012, 101, 889–917. [Google Scholar] [CrossRef]
- Wang, Y.H.; Xue, C.J.; Zhang, F.F.; Liu, J.J.; Gao, J.B.; Qi, T.J. SHRIMP zircon U–Pb geochronology, geochemistry and H–O–Si–S–Pb isotope systematics of the Kanggur gold deposit in Eastern Tianshan, NW China: Implication for ore genesis. Ore Geol. Rev. 2015, 68, 1–13. [Google Scholar] [CrossRef]
- Zhang, L.C.; Shen, Y.C.; Ji, J.S. Characteristics and genesis of Kanggur gold deposit in the eastern Tianshan mountains, NW China: Evidence from geology, isotope distribution and chronology. Ore Geol. Rev. 2003, 23, 71–90. [Google Scholar] [CrossRef]
- Wang, Z.L.; Jiang, N.; Wang, Y.T.; Mao, J.W.; Yang, J.M. Genesis of Kanggur gold deposit in Eastern Tianshan Orogenic Belt, NW China: Fluid inclusion and oxygen and hydrogen isotope constraints. Resour. Geol. 2004, 54, 177–185. [Google Scholar] [CrossRef]
- Wang, Z.L.; Mao, J.W.; Wu, G.G.; Yang, J.M.; Ma, T.L.; Han, C.M. Geochemistry of fluid inclusions from the Shiyingtan gold deposit in Eastern Tianshan, Xinjiang. Geol. Prospect. 2003, 39, 6–10, (In Chinese with English abstract). [Google Scholar]
- Yin, D.G. Geological characteristics and genesis of Harla gold deposit, Xinjiang. West-China Explor. Eng. 2006, S1, 266–268, (In Chinese with English abstract). [Google Scholar]
- Chen, Q.Z.; Gong, Z.G. Metallogenic mechanism and prospecting in Harla gold deposit. 2005 Express Inf. Min. Ind. 2005, 7, 30–31, (In Chinese with English abstract). [Google Scholar]
- Clayton, R.N.; Mayeda, T.K. The use of bromine pentafluoride in the extraction of oxygen from oxides and silicates for isotopic analysis. Geochim. Cosmochim. Acta 1963, 27, 43–52. [Google Scholar] [CrossRef]
- Gong, B.; Zheng, Y.F.; Chen, R.X. An online method combining a thermal conversion elemental analyzer with isotope ratio mass spectrometry for the determination of hydrogen isotope composition and water concentration in geological samples. Rapid Commun. Mass Spectrom. 2007, 21, 1386–1392. [Google Scholar] [CrossRef]
- Zhou, J.; Huang, Z.; Zhou, M.; Li, X.; Jin, Z. Constraints of C-O-S-Pb isotope compositions and Rb-Sr isotopic age on the origin of the Tianqiao carbonate-hosted Pb-Zn deposit, SW China. Ore Geol. Rev. 2013, 53, 77–92. [Google Scholar] [CrossRef]
- Robinson, B.W.; Kusakabe, M. Quantitative preparation of sulfur dioxide, for 34S/32S analyses, from sulfides by combustion with cuprous oxide. Anal. Chem. 1975, 47, 1179–1181. [Google Scholar] [CrossRef]
- White, W.M.; Albarède, F.; Télouk, P. High-precision analysis of Pb isotope ratios by multi-collector ICP-MS. Chem. Geol. 2000, 167, 257–270. [Google Scholar] [CrossRef]
- Roedder, E. Fluid inclusions. Rev. Miner. 1984, 12, 644. [Google Scholar]
- Goldstein, R.H.; Reynolds, T.J. Systematics of Fluid Inclusions in Diagenetic Minerals; SEPM Short Course; Sepm Society for Sedimentary: Tulsa, OK, USA, 1994; Volume 31, pp. 1–199. [Google Scholar]
- Chi, G.X.; Lu, H.Z. Validation and representation of fluid inclusion microthermometric data using the fluid inclusion assemblage (FIA) concept. Acta Petrol. Sin. 2008, 24, 1945–1953, (In Chinese with English abstract). [Google Scholar]
- Li, S.D.; Chen, C.; Gao, L.L. Fluid evolution in the Beidabate porphyry Cu-Mo deposit, Xinjiang, northwest China: Evidence from fluid inclusions and H-O-C-S isotopes. Ore Geol. Rev. 2021, 135, 104198. [Google Scholar] [CrossRef]
- Bodnar, R.J. Revised equation and table for determining the freezing point depression of H2O–NaCl solutions. Geochim. Cosmochim. Acta 1993, 57, 683–684. [Google Scholar] [CrossRef]
- Bodnar, J.R.; Vityk, M.O. Interpretation of microthermometric data for H2O–NaCl fluid inclusions. In Fluid Inclusions in Minerals: Methods and Applications; De Vivo, B., Frezzotti, M.L., Eds.; Virginia Technical Institute: Blacksburg, VA, USA, 1994; pp. 117–130. [Google Scholar]
- Clayton, R.N.; O’Neil, J.R.; Mayeda, T.K. Oxygen isotope exchange between quartz and water. J. Geophys. Res. 1972, 77, 3057–3067. [Google Scholar] [CrossRef]
- Li, S.D.; Zhang, X.B.; Gao, L.L. Ore genesis at the Jinchang gold–copper deposit in Heilongjiang Province, Northeastern China: Evidence from geology, fluid inclusions, and H–O–S isotopes. Minerals 2019, 9, 99. [Google Scholar] [CrossRef] [Green Version]
- Roedder, E.; Bodnar, R.J. Geologic pressure determinations from fluid inclusion studies. An. Rev. Earth Planet Sci. 1980, 8, 263–301. [Google Scholar] [CrossRef]
- Chi, G.; Diamond, L.W.; Lu, H.; Lai, J.; Chu, H. Common Problems and Pitfalls in Fluid Inclusion Study: A Review and Discussion. Minerals 2021, 11, 7. [Google Scholar] [CrossRef]
- Driesner, T.; Heinrich, C.A. The system H2O–NaCl. Part I: Correlation formulae for phase relations in temperature–pressure–composition space from 0 to 1000 °C, 0 to 5000 bar, and 0 to 1 XNaCl. Geochim. Et Cosmochim. Acta 2007, 71, 4880–4901. [Google Scholar] [CrossRef]
- Taylor, H. The application of oxygen and hydrogen isotope studies to problems of hydrothermal alteration and ore deposition. Econ. Geol. 1974, 69, 843–883. [Google Scholar] [CrossRef]
- Zhang, L.C. Geochemical characteristics and source of two-type ore-forming fluids in Kanggultage gold ore belt, east Tianshan. Acta Petrol. Sin. 2000, 16, 535–541, (In Chinese with English abstract). [Google Scholar]
- Kim, K.H.; Lee, S.; Nagao, K.; Sumino, H.; Yang, K.; Lee, J.I. He-Ar-H-O isotopic signatures in Au\Ag bearing ore fluids of the Sunshin epithermal gold-silver ore deposits, South Korea. Chem. Geol. 2012, 320, 128–139. [Google Scholar] [CrossRef]
- Ronacher, E.; Richards, J.P.; Reed, M.H.; Bray, C.J.; Spooner ET, C.; Adams, P.D. Characteristics and Evolution of the Hydrothermal Fluid in the North Zone High-Grade Area, Porgera Gold Deposit, Papua New Guinea. Econ. Geol. 2004, 99, 843–867. [Google Scholar] [CrossRef]
- ShengSheng, S.; ChunJi, X.; JianFeng, T.; HaiQiang, J. H-O-S-Pb isotopic tracing and Re-Os dating of Bogutu gold deposit, western Tien Shan, Xinjiang. Acta Petrol. Sin. 2016, 32, 1346–1360, (In Chinese with English abstract). [Google Scholar]
- Zhai, W.; Sun, X.; Sun, W.; Su, L.; He XWu, Y. Geology, geochemistry, and genesis of Axi: A Paleozoic low-sulfidation type epithermal gold deposit in Xinjiang, China. Ore Geol. Rev. 2009, 36, 265–281. [Google Scholar] [CrossRef]
- Clark, I.D.; Fritz, P. Environmental Isotopes in Hydrogeology; Lewis Publishers: New York, NY, USA, 1997; pp. 1–328. [Google Scholar]
- LiJuan, W.; JingBin, W.; YuWang, W.; HePing, Z. S, Pb, C isotopes geochemistry from gold deposits in Junggar-East Tianshan mountains area and the indication for gold mineralization, North Xinjiang. Acta Petrol. Sin. 2006, 22, 1437–1447, (In Chinese with English abstract). [Google Scholar]
- Wang, L.J.; Wang, J.B.; Wang, Y.W.; Zhu, H.P.; Qu, L.L. The study of ore-fluid and C-S-Pb isotope of rich in S and poor in S types in epithermal gold deposits, Junggar area, Xinjiang. Acta Petrol. Sin. 2005, 21, 1382–1388, (In Chinese with English abstract). [Google Scholar] [CrossRef]
- Li, X.J.; Liu, W. Fluid inclusion and stable isotope constraints on the genesis of the Mazhuangshan gold deposit, eastern Tianshan Mountains of China. Acta Petrol. Sin. 2002, 18, 551–558, (In Chinese with English abstract). [Google Scholar]
- Hoefs, J. Stable Isotope Geochemistry, 6th ed.; Springer: Berlin, Germany, 2009. [Google Scholar]
- Zartman, R.E.; Doe, B.R. Plumbotectonics-the model. Tectonophysics 1981, 75, 135–162. [Google Scholar] [CrossRef]
| Publisher’s Note: MDPI stays neutral with regard to jurisdictional claims in published maps and institutional affiliations. |
© 2022 by the authors. Licensee MDPI, Basel, Switzerland. This article is an open access article distributed under the terms and conditions of the Creative Commons Attribution (CC BY) license (https://creativecommons.org/licenses/by/4.0/).


