Abstract
Experiments on divalent cation distribution between Mg–Fe olivine solid solutions and 1 mol/L (Ni2+, Mg2+, Co2+, Zn2+, Fe2+, Mn2+)Cl2 aqueous solutions were carried out at 700 °C and 100 MPa. Regardless of the composition of the Mg–Fe olivine solid solutions, the tendency of divalent cation distribution into the olivine solid solutions against the aqueous chloride solutions was in the order of Ni2+ > Mg2+ > Co2+ > Mn2+ > Fe2+ > Zn2+. Excluding Zn2+, this order corresponds to the order of the sixfold coordinated ionic radius in olivine. This indicates that a smaller ionic radius allows the cation to more easily enter the olivine solid solutions. However, Zn2+ showed a negative distribution anomaly and did not easily enter the sixfold coordinated site of the olivine solid solutions, regardless of the ionic radius. This is because Zn2+ has a strong preference for fourfold coordinated sites. The Mg–Fe olivine solid solutions with more fayalite endmembers have smaller differences in the distribution coefficient of cations. This means that the gradient of the PC–IR curve becomes smaller as the content of fayalite endmembers increases. This trend indicates that fayalite consisting of a large cation (Fe2+) tends to exchange other cations more easily than forsterite consisting of a small cation (Mg2+).
1. Introduction
Goldschmidt [1] proposed the theoretical foundation for trace element partitioning of minerals and considered that the key variables controlling partitioning are charge and size of the trace ion relative to the charge and size of the lattice site [2]. The partitioning behavior of elements between groundmass (magma) and major rock-forming minerals such as olivine, pyroxene, hornblende, and biotite in volcanic rocks was investigated by Matsui et al. [3], and the results were interpreted using diagrams of the partition coefficient vs. ionic radius (PC–IR) (so-called “Onuma” diagrams). The PC–IR curve for an isovalent series of ions shows a parabola-shaped peak on the diagram. Blundy and Wood [4] and Wood and Blundy [5] presented a quantitative model (a lattice strain model) using the theory by Brice [6] to describe the partitioning of trace elements between mineral and silicate melt using the radius of the site, the elastic response of the site to lattice strain caused by ions (Young’s modulus), and the strain-free (optimum) partition coefficient for a fictive ion radius. A modified quantitative model was proposed by Karato [7].
Olivine is one of major silicate minerals of ultramafic and mafic igneous rocks. Olivine also produced by the involvement of hydrothermal fluids occurring in skarns formed by replacing dolomite or magnesite (e.g., [8]). Granitic rocks are often involved in the formation of the skarns. Studies on fluid inclusions have shown that the natural hydrothermal fluids involved in the formation of skarns are often aqueous chloride solutions [9]. The purpose of this study is to elucidate the factors governing the partitioning of divalent metal cations between minerals and aqueous chloride solutions by conducting experiments using hydrothermal fluid instead of magma. In this study, olivine was selected as the experimental target mineral, and partitioning experiments of Ni2+, Mg2+, Co2+, Zn2+, Fe2+, and Mn2+ between olivine solid solutions and 1 mol/L aqueous chloride solutions were conducted. Because olivine is often produced in nature as a solid solution of forsterite (Fo) and fayalite (Fa), experiments were conducted by varying the composition of Mg–Fe olivine solid solutions in this study. Olivine is a nesosilicate and belongs to the orthorhombic system. In olivine, the divalent metal cation is located in sixfold coordinated sites, and Si4+ is located in fourfold coordinated sites. There are two different sites, M1 and M2, in the sixfold coordinated sites of olivine, but there is almost no difference in their size [10]. Therefore, in this study, M1 and M2 sites were treated as the same site in the distribution of divalent metal cations. Experiments on partitioning of trace elements between olivine and aqueous carbonate-, chlorine-, and NaOH-bearing fluids were conducted at 1.0 GPa and 1000 °C by Brenan and Watson [11].
Ion-exchange experiments between aqueous chloride solutions and sulfide minerals (pyrite, pyrrhotite, sphalerite, and alabandite), arsenic sulfide minerals (arsenopyrite and cobaltite), and arsenide minerals (löllingite and sufflorite) were conducted by Uchida et al. [12,13,14,15,16]. Covalent bonds predominate in these minerals, and their electronegativity has been shown to influence the element distribution. Unlike these minerals, ionic bonds predominate in olivine solid solutions. In this study, we considered the effect of this difference in bonding type on element distribution.
2. Materials and Methods
2.1. Methods
The 30 mg of solid starting material mentioned in Section 2.2, 30 μL of liquid starting material mentioned in the Section 2.3 (Table 1), and 0.3 mg of the reducing agent anthracene (C14H10) to keep iron as Fe2+ were contained in a gold tube with an outer diameter of 3.0 mm, inner diameter of 2.7 mm, and length of approximately 35 mm that was welded shut. The gold capsules were placed in an oven at 105 °C overnight to confirm that no leakage occurred. Then, the gold capsules containing the starting materials were inserted into a standard cold-seal reaction vessels made of Stellite 25 (HP-MRA-114S type, HP Technos Co., Ltd., Ibaraki, Japan) together with a stainless-steel rod (SUS316) with a length of 200 mm and a diameter of 5 mm to reduce the temperature gradient. The reaction vessels were placed in an electric furnace installed laterally. The temperature was measured using a chromel–alumel thermocouple attached to the outside of the reaction vessels, and the temperature was controlled by a temperature controller (DSS83, Shimaden Co., Ltd., Tokyo, Japan). Water was used as the pressure medium, and the pressure was adjusted using a hand pump (HP-W, max. 200 MPa, Nikkiso Co., Ltd., Tokyo, Japan) via a capillary tube connected to the reaction vessels. The pressure was measured using a pressure gauge (A 200-MPa, Yamazaki Keiki Co., Ltd., Tokyo, Japan). In consideration of the reaction rate and the pressure resistance of the reaction vessels, the reaction temperature and pressure were fixed at 700 °C and 100 MPa, respectively, in all experiments, and the reaction duration was 5 days. Uchida et al. [17] conducted cation exchange experiments using starting materials with different compositions in the two or three component system of Mg2SiO4–Fe2SiO4–Mn2SiO4 under the conditions of 600 °C and 100 MPa. As a result, it was confirmed that the experimental results were in agreement despite the difference in the starting material compositions. This suggests that the reaction reached equilibrium in the reaction period of 5 to 7 days under the conditions of 600 °C and 100 MPa. Judging from this, it was considered that the reaction reaches equilibrium in the reaction period of 5 days under the reaction conditions of 700 °C and 100 MPa in this experiment. The temperature and pressure variations during experiments were within ±3 °C and ±1 MPa, respectively.

Table 1.
Experimental conditions in the olivine solid solution–(Ni2+, Mg2+, Co2+, Zn2+, Fe2+, Mn2+)Cl2–H2O system.
After completion of the reaction, the reaction vessels were immersed in a stainless-steel bucket filled with cold water and rapidly cooled. The gold capsules were then removed from the reaction vessels and weighed on a chemical balance to ensure that there had been no leaks. One side of the gold capsules was opened, and the reactants were rinsed in a beaker with distilled water using a syringe. Then, suction filtration was performed using an aspirator (ASPIRATOR DAS-01, As One Corporation, Osaka, Japan) with a membrane filter (0.45 μm HA, Millipore filter, Merck Millipore, Ltd., Danvers, MA, USA) to separate the solid phase from the liquid phase. The filtrated aqueous chloride solution was adjusted by adding distilled water so that the volume was 50 cm3.
A portion of the solid-phase product was ground in an agate mortar, and then a few drops of distilled water were added. This paste was applied to a glass plate and dried. Phase identification was performed using a powder X-ray diffractometer (RINT-Ultima III, Rigaku, Tokyo, Japan). In addition, a portion of solid run product was placed on a carbon tape on a glass slide, carbon-coated (Quick Carbon Coater SC-701C, Sanyu Denshi Co. Ltd., Tokyo, Japan), and then analyzed using a scanning electron microscope (JSM-6360, JEOL, Tokyo, Japan). The chemical composition was obtained using an energy-dispersive X-ray analyzer (INCA ENERGY, Oxford Instruments, Abingdon, UK). The acceleration voltage was set to 15 kV, and the current was adjusted so that the X-ray count on Co was 2000 counts/s. Measurements were performed on Ni, Mg, Co, Zn, Fe, Mn, and Si. NiO, MgO, Co, ZnO, Fe2O3, MnO, and SiO2 were used as standard samples for Ni, Mg, Co, Zn, Fe, Mn, and Si analyses, respectively. The solid-phase analysis was performed on the surface of the olivine crystal, and the analysis time at one point was 1000 s. Measurements were made on five olivine crystals, and the average value was used as the chemical composition of the solid product. The analytical precision (1σ) for the solid phase was less than 0.25 mol.% for major elements and less than 0.1 mol.% for minor elements.
The liquid phase was analyzed using an inductively coupled plasma atomic emission spectrometer (iCAP6300, Thermo Fisher Scientific Inc., Waltham, MA, USA). Analysis was performed on Ni, Mg, Co, Zn, Fe, and Mn. The measurement wavelengths were 221.647, 280.270, 228.616, 206.200, 239.562, and 257.610 nm, respectively. As standard solutions, aqueous solutions containing 0.0, 0.1, 0.5, 1.0, 5.0, or 10.0 ppm of each element were used. The analysis time was 10 s; measurements were repeated three times, and the average value was used as the analysis value. The analytical precision (1σ) for the aqueous solution was less than 5% for major elements and less than 1% for minor elements.
2.2. Solid Starting Materials
In order to synthesize olivine of varying compositions, a mixture of MgO (99.99%, Rare Metallic Co., Ltd., Tokyo, Japan), Fe (99.5%, Junsei Chemical Co., Ltd., Tokyo, Japan), and SiO2 (99.99%, Rare Metallic Co., Ltd., Tokyo, Japan) was used as the starting materials. Iron (Fe) was used as the solid starting material instead of FeO to stabilize ferrous iron; metallic iron did not remain after the end of the experiments. Five solid starting materials were obtained by mixing so that the molar ratios of the forsterite endmember component (Fo) and the fayalite endmember component (Fa) were Fo100Fa0, Fo75Fa25, Fo50Fa50, Fo25Fa75, and Fo0Fa100. These five mixtures were used for experiments.
2.3. Liquid Starting Materials
The aqueous solutions used as starting materials were mixtures of 1 mol/L NiCl2, MgCl2, CoCl2, ZnCl2, FeCl2, and MnCl2 aqueous solutions The salts used to prepare each aqueous chloride solution were all reagent-grade, obtained from Junsei Chemical Co., Ltd., Tokyo, Japan. The compositions of the starting aqueous chloride solutions are given in Table 1. The composition of the aqueous chloride solutions was adjusted so that the concentration of certain elements did not become extremely low in the chemical composition analysis of the olivine solid solution and the aqueous chloride solution after the reaction.
3. Results
3.1. Solid Products
The powder X-ray diffraction analysis showed that the only solid product detected was olivine (Figure 1). The amorphous pattern in Figure 1 was due to the glass plate to which the sample (about 20 mg) was attached. The lattice parameter tended to increase as the fayalite endmember component in olivine solid solutions increased. Scanning electron microscopy shows that the olivine solid solutions exhibited granular to short columnar crystals, and that no starting materials remained (Figure 2). The color of the olivine solid solutions was pale pink when the solid starting material was Fo100, and greenish-brown in other cases. The olivine solid solutions tended to increase in particle size as the fayalite endmember component increased, with ~10 μm for Fo100, ~15 μm for Fo75Fa25, ~20 μm for Fo50Fa50, ~30 μm for Fo25Fa75, and ~40 μm for Fa100.
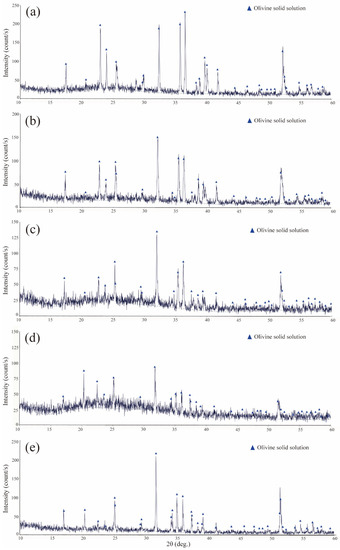
Figure 1.
Powder X-ray diffraction patterns of synthesized olivine solid solutions: (a) Fo100-3, (b) Fo75Fa25-8, (c) Fo50Fa50-4, (d) Fo25Fa75-4, and (e) Fa100-6.
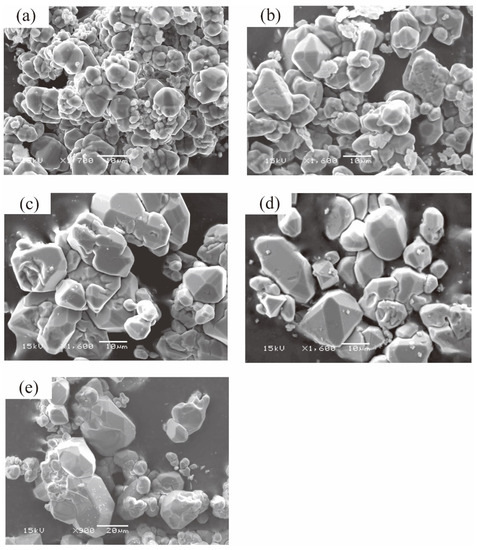
Figure 2.
SEM images of solid run products at 700 °C and 100 MPa: (a) Fo100-2, (b) Fo75Fa25-7, (c) Fo50Fa50-3, (d) Fo25Fa75-2, and (e) Fa100-6.
Table 2 shows the ratios of each endmember component in the synthesized olivine solid solutions. The compositions of the forsterite endmember component in the synthesized olivine solid solutions were around 96 mol.% for the starting material Fo100, 75 mol.% for Fo75Fa25, 55 mol.% for Fo50Fa50, 28 mol.% for Fo25Fa75, and 1 mol.% for Fa100. The compositions of the fayalite endmember component in the olivine solid solutions were around 0.6 mol.% for the starting material Fo100, 20 mol.% for Fo75Fa25, 40 mol.% for Fo50Fa50, 65 mol.% for Fo25Fa75, and 91 mol.% for Fa100.
Table 2.
Experimental results for the olivine solid solution–(Ni2+, Mg2+, Co2+, Zn2+, Fe2+, Mn2+)Cl2–H2O system at 700 °C and 100 MPa.
3.2. Liquid Products
Table 2 shows the proportions of each divalent metal cation in all divalent metal cations in the aqueous chloride solutions after the reaction. The proportions of the Mg2+ cation against all divalent metal cations in the aqueous chloride solutions were around 47 mol.% for the solid starting material Fo100, 16 mol.% for Fo75Fa25, 9.8 mol.% for Fo50Fa50, 4.4 mol.% for Fo25Fa75, and 0.4 mol.% for Fa100. The proportions of the Fe2+ ion in all divalent metal cations in the aqueous chloride solutions were around 4.1 mol.% for the solid starting material Fo100, 40 mol.% for Fo75Fa25, 56 mol.% for Fo50Fa50, 62 mol.% for Fo25Fa75, and 70 mol.% for Fa100.
4. Discussions
4.1. Ion-Exchange Reaction and Aqueous Neutral Species Concentration
The ion-exchange reaction between olivine solid solutions and aqueous chloride solutions is expressed as follows on the basis of Mg:
where Me indicates a divalent metal cation other than Mg. The equilibrium constant K for the reaction in Equation (1) is expressed as follows:
where a is the activity of the given phase.
where γ is the activity coefficient of the given phase, x is the molar fraction of a MeSi0.5O2 endmember component other than the forsterite endmember component in the olivine solid solutions, and m is the molality of the dissolved neutral species MeCl2aq in the aqueous chloride solutions. The distribution coefficient KDN (D is an abbreviation of distribution, and N is that of neutral species) for the reaction in Equation (1) is expressed as follows [18,19]:
The concentration of the dissolved neutral species in the aqueous chloride solutions was calculated as described below. The following reactions can be considered for the dissolved species of Mg (reactions (5) and (6)) and dissolved species other than Mg (reaction (7)):
The following mass balance Equations (8)–(10) hold for each divalent metal cation and chloride anion:
In addition, the following mass action Equations (11)–(13) can be written for the reactions (5)–(7), respectively:
where ai is the activity of the i aqueous species. The activity coefficient of the i aqueous species was set to 1 for neutral aqueous species and was calculated using the Debye–Hückel equation for other charged aqueous species (e.g., [20]). The molality of each aqueous species can be obtained by simultaneously solving the mass balance Equations (8)–(10) and the mass action Equations (11)–(13). The data of Frantz and Marshall [21] were used for the dissociation constants of MgCl+aq in the Equation (11) and MgCl20aq in the Equation (12). The data of Uchida et al. [22] and Uchida and Tsutsui [23] were used for the dissociation constants of the aqueous trichloro complexes of the transition metals in the Equation (13) (Table 3). The concentrations of each neutral aqueous species obtained from these calculations are shown in Table 2.
Table 3.
Dissociation constants (Ki) at 700 °C and 100 MPa.
4.2. Distribution Coefficient and PC–IR Diagram
Table 2 shows the logarithmic values of the distribution coefficients obtained from Equation (4) using the ratio of each endmember component in the olivine solid solutions and the molality of the neutral aqueous species obtained in Section 4.1. Figure 3 shows the diagram of the logarithmic distribution coefficient vs. ionic radius (PC–IR). The ionic radii in the sixfold coordinated site reported by Shannon and Prewitt [24] were used in the construction of the diagrams.
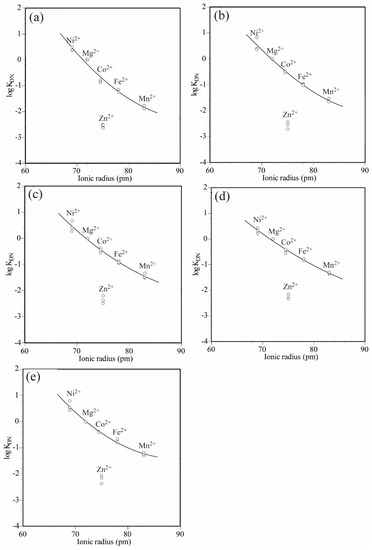
Figure 3.
Logarithmic distribution coefficient (log KDN) vs. ionic radius (PC–IR) diagrams for the olivine solid solution–(Ni, Mg, Co, Zn, Fe, Mn)Cl2–H2O system. PC–IR curves were obtained by the least-square method using a quadratic curve and assuming that Ni2+, Mg2+, Co2+, Fe2+, and Mn2+ showed distribution behaviors based on their ionic radii. The solid starting material compositions were (a) Fo100, (b) Fo75Fa25, (c) Fo50Fa50, (d) Fo25Fa75, and (e) Fa100.
The logarithmic values of the distribution coefficients of each cation showed the same tendency regardless of which solid starting materials were used. Their order was as follows: Ni2+ > Mg2+ > Co2+ > Fe2+ > Mn2+ > Zn2+.
In the PC–IR diagrams, the distribution coefficients tended to decrease from Ni2+, which had the smallest sixfold coordinated ionic radius, to Mn2+, which had the largest sixfold coordinated ionic radius, except for Zn2+. This trend indicates that the cations with smaller ionic radii were more likely to enter the olivine solid solutions. However, the differences between the distribution coefficients of Mg2+ and Fe2+ tended to decrease as the fayalite endmember component in the solid starting materials increased: 1.18 for Fo100Fa0, 1.00 for Fo75Fa25, 0.92 for Fo50Fa50, 0.82 for Fo25Fa75, and 0.73 for Fo0Fa100 in logarithmic values. This trend indicates that fayalite consisting of a large cation (Fe2+) tended to exchange other cations more easily than forsterite consisting of a small cation (Mg2+).
In the PC–IR diagrams, except for Zn2+, a curve showing a negative gradient was drawn from Ni2+, with the smallest ionic radius, toward Mn2+, with the largest ionic radius. According to Matsui et al. [3], the PC–IR curve for olivine solid solutions should show a maximum near Ni2+. Thus, Ni2+, which has the optimum ionic radius, exchanges readily with other cations. Matsui et al. [3] obtained the PC–IR curve of trivalent metal cations between olivine phenocrysts and groundmass in tholeiitic basalt, showing that the apex exists near the ionic radius of 70 pm. As mentioned above, with the exception of Zn2+, the distribution coefficients of the cations between the olivine solid solutions and the aqueous chloride solutions decreased from Ni2+, with the smallest ionic radius, toward Mn2+, with the largest ionic radius, indicating that the distribution coefficient was determined by the ionic radius.
In these diagrams, Zn2+ did not follow the trend of the other cations and deviated significantly downward from the PC–IR curves regardless of the solid starting material compositions. The logarithmic value of the distribution coefficient of Zn2+ was approximately 2 to 2.5 lower than that of Mg2+. Such a negative distribution anomaly of Zn2+ was not observed in sphalerite, which is a sulfide mineral with a fourfold coordinated site [16]. However, in arsenopyrite, cobaltite, alabandite, löllingite, and sufflorite, which are sulfide or arsenide minerals with sixfold coordinated sites, the negative distribution anomaly of Zn2+ is remarkable [11,12,13,14]. The appearance of a distribution anomaly for minerals with sixfold coordinated sites indicates that Zn2+ prefers the fourfold coordinated sites, as explained from the ligand field theory, showing normal distribution behavior in the four-fold coordinated sites, whereas entry into sixfold coordinated sites is difficult for Zn2+. In addition, willemite is a mineral with a Zn2SiO4 composition similar to olivine. In willemite, Zn2+ shows a four-coordination structure, indicating that Zn2+ prefers fourfold coordinated sites [25].
Figure 4 shows the logarithmic distribution coefficient vs. electronegativity diagrams for olivine (Fo100) and sphalerite at 700 °C and 100 MPa, except for Zn2+. In the case of sphalerite, where covalent bonds are dominant, there is a positive correlation between the logarithmic distribution coefficient and electronegativity; however, in the case of olivine (Fo100), there is no positive correlation. This suggests that ionic bonds are predominant with respect to covalent bonds in olivine.
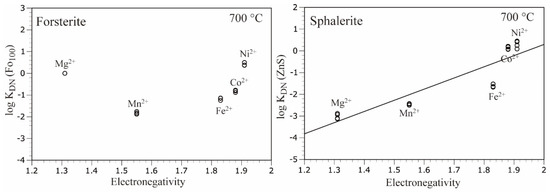
Figure 4.
Logarithmic distribution coefficient (log KDN) vs. electronegativity (Pauling) diagrams for olivine (Fo100) and sphalerite, except for Zn2+. Electronegativity data were taken from Emsley [26]. Distribution coefficient values for sphalerite were taken from Uchida et al. [16].
5. Conclusions
Distribution experiments of Ni2+, Mg2+, Co2+, Zn2+, Fe2+, and Mn2+ cations between olivine solid solutions and aqueous chloride solutions at 700 °C and 100 MPa were carried out with varying starting material compositions of the olivine solid solutions. The distribution coefficient increased with decreasing ionic radius except for Zn2+, indicating that cations with smaller ionic radii were more likely to enter olivine solid solutions. This trend indicates that the ionic radius dominated the distribution of divalent metal cations. Zn2+ tended to form a fourfold coordinated bond and did not easily enter the sixfold coordinated sites of the olivine solid solutions. In addition, the gradient of the PC–IR curve was smaller for the fayalite endmember component than for the forsterite endmember component. This trend indicates that fayalite consisting of a large cation (Fe2+) tends to exchange other cations more easily than forsterite consisting of a small cation (Mg2+).
Author Contributions
Conceptualization, E.U.; methodology, E.U.; formal analysis, M.O.; investigation, M.O..; data curation, E.U. and M.O.; writing—original draft preparation, E.U. and M.O.; writing—review and editing, E.U.; visualization, E.U. and M.O.; supervision, E.U.; project administration, E.U.; funding acquisition, E.U. All authors read and agreed to the published version of the manuscript.
Funding
This research was funded by the Japan Society for the Promotion of Science (JSPS) KAK ENHI (Grant No. 19K05356).
Institutional Review Board Statement
Not applicable.
Informed Consent Statement
Not applicable.
Data Availability Statement
Data are contained within the article.
Acknowledgments
The authors are grateful to the three anonymous reviewers for their insightful reviews, valuable comments, and suggestions to improve the quality of the manuscript. We thank Edanz Group for editing a draft of this manuscript.
Conflicts of Interest
The authors declare no conflict of interest.
References
- Goldschmidt, V.M. The principles of distribution of chemical elements in minerals and rocks. J. Chem. Soc. 1937, 140, 655–673. [Google Scholar] [CrossRef]
- Blundy, J.; Wood, B. Partitioning of trace elements between crystals and melts. Earth Planet. Sci. Lett. 2003, 210, 383–397. [Google Scholar] [CrossRef]
- Matsui, Y.; Onuma, N.; Nagasawa, H.; Higuchi, H.; Banno, S. Crystal structure control in trace element partitioning between crystal and magma. Bull. Soc. Franç. Minéral. Cristal. 1977, 100, 315–324. [Google Scholar]
- Blundy, J.; Wood, B. Prediction of crystal-melt partition coefficients from elastic moduli. Nature 1994, 372, 452–454. [Google Scholar] [CrossRef]
- Wood, B.J.; Blundy, J.D. A predictive model for rare earth element partitioning between clinopyroxene and anhydrous silicate melt. Contrib. Mineral. Petrol. 1997, 129, 166–181. [Google Scholar] [CrossRef]
- Brice, J.C. Some thermodynamic aspects of the growth of strained crystals. J. Cryst. Growth 1975, 28, 249–253. [Google Scholar] [CrossRef]
- Katato, S. Physical basis of trace element partitioning: A review. Am. Mineral. 2016, 101, 2577–2593. [Google Scholar]
- Nekrylov, N.; Plechov, P.Y.; Gritsenko, Y.D.; Portnyagin, M.V.; Shcherbakov, V.D.; Aydov, V.A.; Garbe-Schönberg, D. Major and trace element composition of olivine from magnesian skarns and silicate marbles. Am. Mineral. 2021, 106, 206–216. [Google Scholar] [CrossRef]
- Roedder, E. Fluid inclusions. In Reviews in Mineralogy; Mineralogical Society of America: Washington, DC, USA, 1984; Volume 12, pp. 109–148. [Google Scholar]
- Smyth, J.R.; Bish, D.L. Crystal Structures and Cation Sites of the Rock-Forming Minerals; Allen & Unwin: Boston, MA, USA, 1998; 332p. [Google Scholar]
- Brenan, J.M.; Watson, E.B. Partitioning of trace elements between olivine and aqueous fluids at high P-T conditions: Implications for the effect of fluid composition on trace-element transport. Earth Planet. Sci. Lett. 1991, 107, 672–688. [Google Scholar] [CrossRef]
- Uchida, E.; Hata, Y.; Uemura, H. Experiments on the simultaneous partitioning of divalent cations between pyrite or pyrrhotite and 2M aqueous chloride solution under supercritical conditions. Jpn. Mag. Miner. Petrol. Sci. 2017, 46, 124–134. (In Japanese) [Google Scholar]
- Uchida, E.; Izumi, Y.; Watanabe, H. Experiments on the simultaneous partitioning of divalent cations between arsenopyrite or cobaltite and hydrothermal chloride solution under supercritical conditions. Jpn. Mag. Miner. Petrol. Sci. 2019, 48, 103–112. (In Japanese) [Google Scholar] [CrossRef]
- Uchida, E.; Murasugi, M.; Okuda, S. Simultaneous partitioning of divalent metal ions between alabandite and 1 mol/L (Ni, Mg, Co, Zn, Fe)Cl2 aqueous solutions under supercritical conditions. Minerals 2020, 10, 696. [Google Scholar] [CrossRef]
- Uchida, E.; Sugino, Y.; Yokoyama, H. Experimental investigation of the simultaneous partitioning of divalent cations between löllingite or safflorite and 2 mol/L aqueous chloride solutions under supercritical conditions. J. Miner. Petrol. Sci. 2020, 115, 365–374. [Google Scholar] [CrossRef]
- Uchida, E.; Wakamatsu, K.; Takamatsu, N. Simultaneous partition experiment of divalent metal ions between sphalerite and 1 mol/L (Ni, Mg, Co, Fe, Mn)Cl2 aqueous solution under supercritical conditions. Minerals 2021, 11, 435. [Google Scholar] [CrossRef]
- Uchida, E.; Kitamura, Y.; Imai, N. Mixing properties of Fe-Mn-Mg olivine solid solution determined experimentally by ion exchange method. J. Min. Petr. Geol. 1997, 92, 142–153. [Google Scholar] [CrossRef][Green Version]
- Holland, H.D. Granites, solutions, and base metal deposits. Econ. Geol. 1972, 67, 281–301. [Google Scholar] [CrossRef]
- Frank, M.R.; Candela, P.A.; Piccoli, P.M. Alkali exchange equilibria between a silicate melt and coexisting magmatic volatile phase: An experimental study at 800 °C and 100 MPa. Geochim. Cosmochim. Acta 2003, 67, 1415–1427. [Google Scholar] [CrossRef]
- Uchida, E.; Goryozono, Y.; Naito, M.; Yamagami, M. Aqueous speciation of iron and manganese chlorides in supercritical hydrothermal solutions. Geochem. J. 1995, 29, 175–188. [Google Scholar] [CrossRef]
- Frantz, J.D.; Marshall, W.L. Electrical conductances and ionization constants of calcium chloride and magnesium chloride in aqueous solutions at temperatures to 600 °C and pressures to 4000 bars. Am. J. Sci. 1982, 282, 1666–1693. [Google Scholar] [CrossRef]
- Uchida, E.; Goryozono, Y.; Naito, M. Aqueous speciation of magnesium, strontium, nickel and cobalt chlorides in hydrothermal solutions at 600 °C and 1 kbar. Geochem. J. 1996, 30, 99–109. [Google Scholar] [CrossRef]
- Uchida, E.; Tsutsui, K. Cation leaching from the basalt JB-1a by 2M NaCl hydrothermal solutions. Resour. Geol. 2000, 50, 93–102. [Google Scholar] [CrossRef]
- Shannon, R.D.; Prewitt, C.T. Revised values of effective ionic radii. Acta Crystallogr. 1970, 26, 1046–1048. [Google Scholar] [CrossRef]
- Gaines, R.V.; Skinner, H.C.W.; Foord, E.E.; Mason, B.; Rosenzweig, A.R. Dana’s New Mineralogy, 8th ed.; John Willey & Sons: New York, NY, USA, 1997; 1819p. [Google Scholar]
- Emsley, J. The Elements, 3rd ed.; Clarendon Press: Oxford, UK, 1998; 292p. [Google Scholar]


Publisher’s Note: MDPI stays neutral with regard to jurisdictional claims in published maps and institutional affiliations. |
© 2022 by the authors. Licensee MDPI, Basel, Switzerland. This article is an open access article distributed under the terms and conditions of the Creative Commons Attribution (CC BY) license (https://creativecommons.org/licenses/by/4.0/).