Article

Quantitative Evaluation of Faults by Combined Channel Wave Seismic Transmission-Reflection Detection Method

1
School of Geoscience and Surveying Engineering, State Key Laboratory of Coal Resources and Safe Mining, China University of Mining and Technology, Beijing 100083, China
2
The State Key Laboratory of Resources and Environmental Information Systems, Institute of Geographic Sciences and Natural Resources Research, Chinese Academy of Sciences, Beijing 100101, China
3
National Geological Library of China, Beijing 100083, China
4
School of Geophysics and Information Technology, China University of Geosciences, Beijing 100083, China
*
Author to whom correspondence should be addressed.
Minerals 2022, 12(8), 1022; https://doi.org/10.3390/min12081022
Submission received: 28 June 2022 / Revised: 11 August 2022 / Accepted: 12 August 2022 / Published: 14 August 2022
(This article belongs to the Special Issue Theory and Applications of Seismic Inversion)

Abstract

:
The quantitative detection of faults using the channel wave seismic method has been a major but challenging area of interest. In this study, we adopted an effective technical process to evaluate fault attribution. First, we use integrated transmission and reflection channel wave information to improve the accuracy of extraction velocity. Then, the location of the fault is determined by the elliptical tangent offset method, and feature extraction and fault location extension determination are achieved through logistic regression and a neural network. This is combined with the prior geological information, the fractional dimension D to the quantitative analysis of the fault throw. Data regarding the 4203 working face of a mine in Shanxi, China, are considered as an example. Two groups of faults were predicted, with the location error in the f30 fault position as 6.7 m. In addition, the f29 fault throw first increased, and then gradually decreased from the return airway to the haulage gateway. These predicted results have been drill-verified and were used to modify the original design. The proposed method has good stability and promising application prospects for fault evaluation.

1. Introduction

Faults pose a potential threat to safety and increase the cost of underground mining. At present, if a fault is found during the mining with complex hydrogeological conditions, regardless of the fault throw, additional technical measures are needed [1]. Additionally, pressurized mines involve more complex operations than unpressurized mines. Water inrush occurs in many pressurized mines, floor cracks caused by mining connect to aquifers, and small faults in coal seams often serve as outlet points for water channels [2]. For example, fault fracture zones can generally be water-conducting along a long section of a fault strike and cause water inrush disasters, even a minor local fracture surface or point can be water-conducting and induce water inrush disasters [3]. Mining has transformed some fault fracture zones into transmissibility faults, resulting in mine water rush disasters, a common occurrence in China.
Therefore, fault detection before mining is necessary, and the quantitative evaluation of fault properties is critical and necessary to ensure the safety of coal miners as well as mining success. Several different technologies, including three-dimensional (3D) seismic perspective techniques [4], radio-wave tunnel perspective techniques [5], Rayleigh-wave prospecting techniques [6,7], and ground-penetrating radar exploration techniques [8], have been developed for fault detection. However, these technologies are not practical in complex mines due to limitations involving the detection distance, resolution, and signal-to-noise ratio. The channel wave seismic can quantitatively characterize a small fault with the practicality and accuracy that other techniques cannot match [9]. Evison (1955) is credited with the discovery of channel waves and proposed the concept of this phenomenon [10]. Krey (1963) derived the characteristic equations for channel waves under three-layer symmetry conditions and performed successful experiments [11]. Many researchers have used various means to study the characteristics of channel waves, and the numerical simulations are based mainly on finite-difference and analytical methods [12,13,14]. As a result, the channel wave seismic technique has developed into a recognized discipline in science and engineering.
Attenuation imaging and velocity imaging are currently the main transmission methods used to image channel waves. The attenuation imaging method is based primarily on the frequency spectrum relative transmission coefficient, the velocity with spectrum relative transmission coefficient, and the energy attenuation coefficient [15,16,17]. The velocity imaging method with dispersion velocity extraction requires manual interpretation based on technical experience, which often results in a considerable disparity between the extracted and actual results. The reflection imaging methods mainly include common depth point (CDP) stacking, Kirchhoff migration, and diffraction migration [18,19,20]. However, the complexity of the reflected wavefield is manifested by serious attenuation and absorption as well as a weak reflected signal. At present, both transmission and reflection imaging methods only interpret fault location mapping, but limit other fault attributes.
A detection method is used to evaluate the characteristics of the faults proposed in this study. The elliptical tangent offset method uses the transmission velocity to improve location accuracy. On this basis, logistic regression and neural network methods are used to determine the extension range of the fault. When the location of the fault is determined, the throw of the fault is fitted in a step-by-step fashion by calculating the dispersion curve fractional dimension (D) and using the fault rendezvous method. The result is cross-verified with transmission mapping. Therefore, the proposed approach provided reasonable technical mining parameters.

2. Method

Channel wave seismic technology based on transmission and reflection realizes the extraction and fusion of multi-wave information, which effectively interprets the fault properties, and makes reliable detection during the mining process technically feasible. There were three primary technical steps in this study. The first step was the quantification velocity by dispersion analysis under geological constraints, and to locate the fault reflection using the ellipse tangent method. The second step was extracted from the channel wave properties using logistic regression and neural network methods to discriminate and effectively extend the fault range. Finally, the fault throw was determined by calculating D.

2.1. Dispersion Analysis and the Elliptical Tangent Method

In channel wave seismic exploration, an essential characteristic of Love-type channel waves is the frequency dependence of the propagation velocity [21]. The wave characteristics are mainly affected by the coal thickness, the surrounding rock, and the petrophysical properties. Through detection, sensitive geological information can be obtained. Theoretically, channel waves are a mixture of P, SV, and SH waves, which have distinctly different velocities. Among them, the group velocity ranges from a low value of approximately 70% of the shear wave velocity of the coal seam to an upper limit equal to the shear wave velocity of the surrounding rock [22]. The fundamental-mode dispersion is a primary propagation characteristic [23], with the influencing factors acquired from the dispersion equation [24].
ω d c L c L 2 v s 2 2 1 = arctan [ μ 1 μ 2 1 c L 2 v s 1 2 c L 2 v s 2 2 1 ] + n π
In Equation (1), where d = 1/2 is the coal thickness, m; cL is the Love seam wave phase; vs1 represents the S-wave velocities of the surrounding roof and floor; and vs2 represents the S-wave velocities of coal seam, respectively; μ1 represents the shear modulus values of the surrounding roof and floor, and μ2 represents the shear modulus values of the surrounding coal seam; ω represents the circular frequency; and n is the order of the channel wave vibration pattern, n = 0, 1, 2, etc.
Due to the dispersion characteristics of channel waves, the use of the stacking migration method will produce more events. Therefore, using the Hilbert transform to calculate the envelope, accurate velocity information is obtained by dispersion analysis when extracting the energy extremes of the Airy phase envelope [25,26].
The elliptical tangent offset method consists of using a formula to calculate the dispersion velocity of the coal seam [27], this method is sensitive to reflection at the fault surface and can often produce accurate imaging results. Using the source and each receiver as foci, respectively, the results are summed to determine the reflection signal travel distance. Then, multiple ellipses are defined, and the location of the fault surface is determined as the unique common tangent of the multiple ellipses in the detection direction. However, only using the reflected velocity is prone to error, thus we extracted the transmitted wave velocity for reflection imaging.

2.2. Logistic Regression Model

The logistic regression model is a feature classification method. It is a multiple regression relationship established by a dependent variable and multiple independent variables to predict the occurrence probability of an event [28,29]. In logistic regression analysis, the eigenvalue of the dependent variable in the fault plane is a dichotomous variable, with the label values 1 and 0, respectively, which represent the ray path through the fault plane and not through the fault plane, respectively. The logistic regression model can be expressed as follows:
P ( z ) = 1 1 + exp ( z ) ,   z = w 1 x 1 + w 2 x 2 + w n x n + b , z = w T x i + b ,
In Equation (2), where z is the dependent variable parameter; w is the weight; b is the constant term; x is the value of the independent variable; and P ( z ) is the regression predicted value of the ray path passing through the fault plane.
In logistic regression analysis, n independent variables that affect the ray path attributes are selected as x 1 , x 2 , x n , respectively. Under this constraint, the conditional probability of the fault plane is P = P ( y = 1 | x 1 , x 2 , x n ) , and the related attribute values of the dispersion curve of the ray path that passes through the fault plane are used as training samples. In addition, the eigenvalue of the final sample is set to 1. The eigenvalue of the sample whose velocity is consistent with the theoretical dispersion curve value is set to 0. The other dispersion curves are used as test samples to predict whether the fault plane has passed, and thus effectively extend the length of the fault.

2.3. Neural Network Model

The artificial neural network model has a strong nonlinear mapping ability, and the most widely used error back propagation (BP) network is the BP neural network [30,31]. The process by which the artificial neural network detects faults is as follows: (1) The relevant characteristic parameters are extracted. (2) The parameters that describe whether the dispersion curve passes through the fault plane are normalized and used as known samples. (3) Network training is conducted on the known samples to obtain classification results. (4) The trained network is used to predict the test samples and judge their classification. The pre-output of the dispersion curve path samples passing through the fault plane is set to 1, and the pre-output of the undisturbed coal seam is set to 0. The dispersion curve attributes of the other paths are predicted through the network to judge the extension of faults.

2.4. Calculation of the Fractional Dimension

The fault activity is correlated with fractional dimension D. The high D value reflects powerful tectonic activity, and vice versa, which reflects the magnitude of the fault throw in the channel wave transmission process.
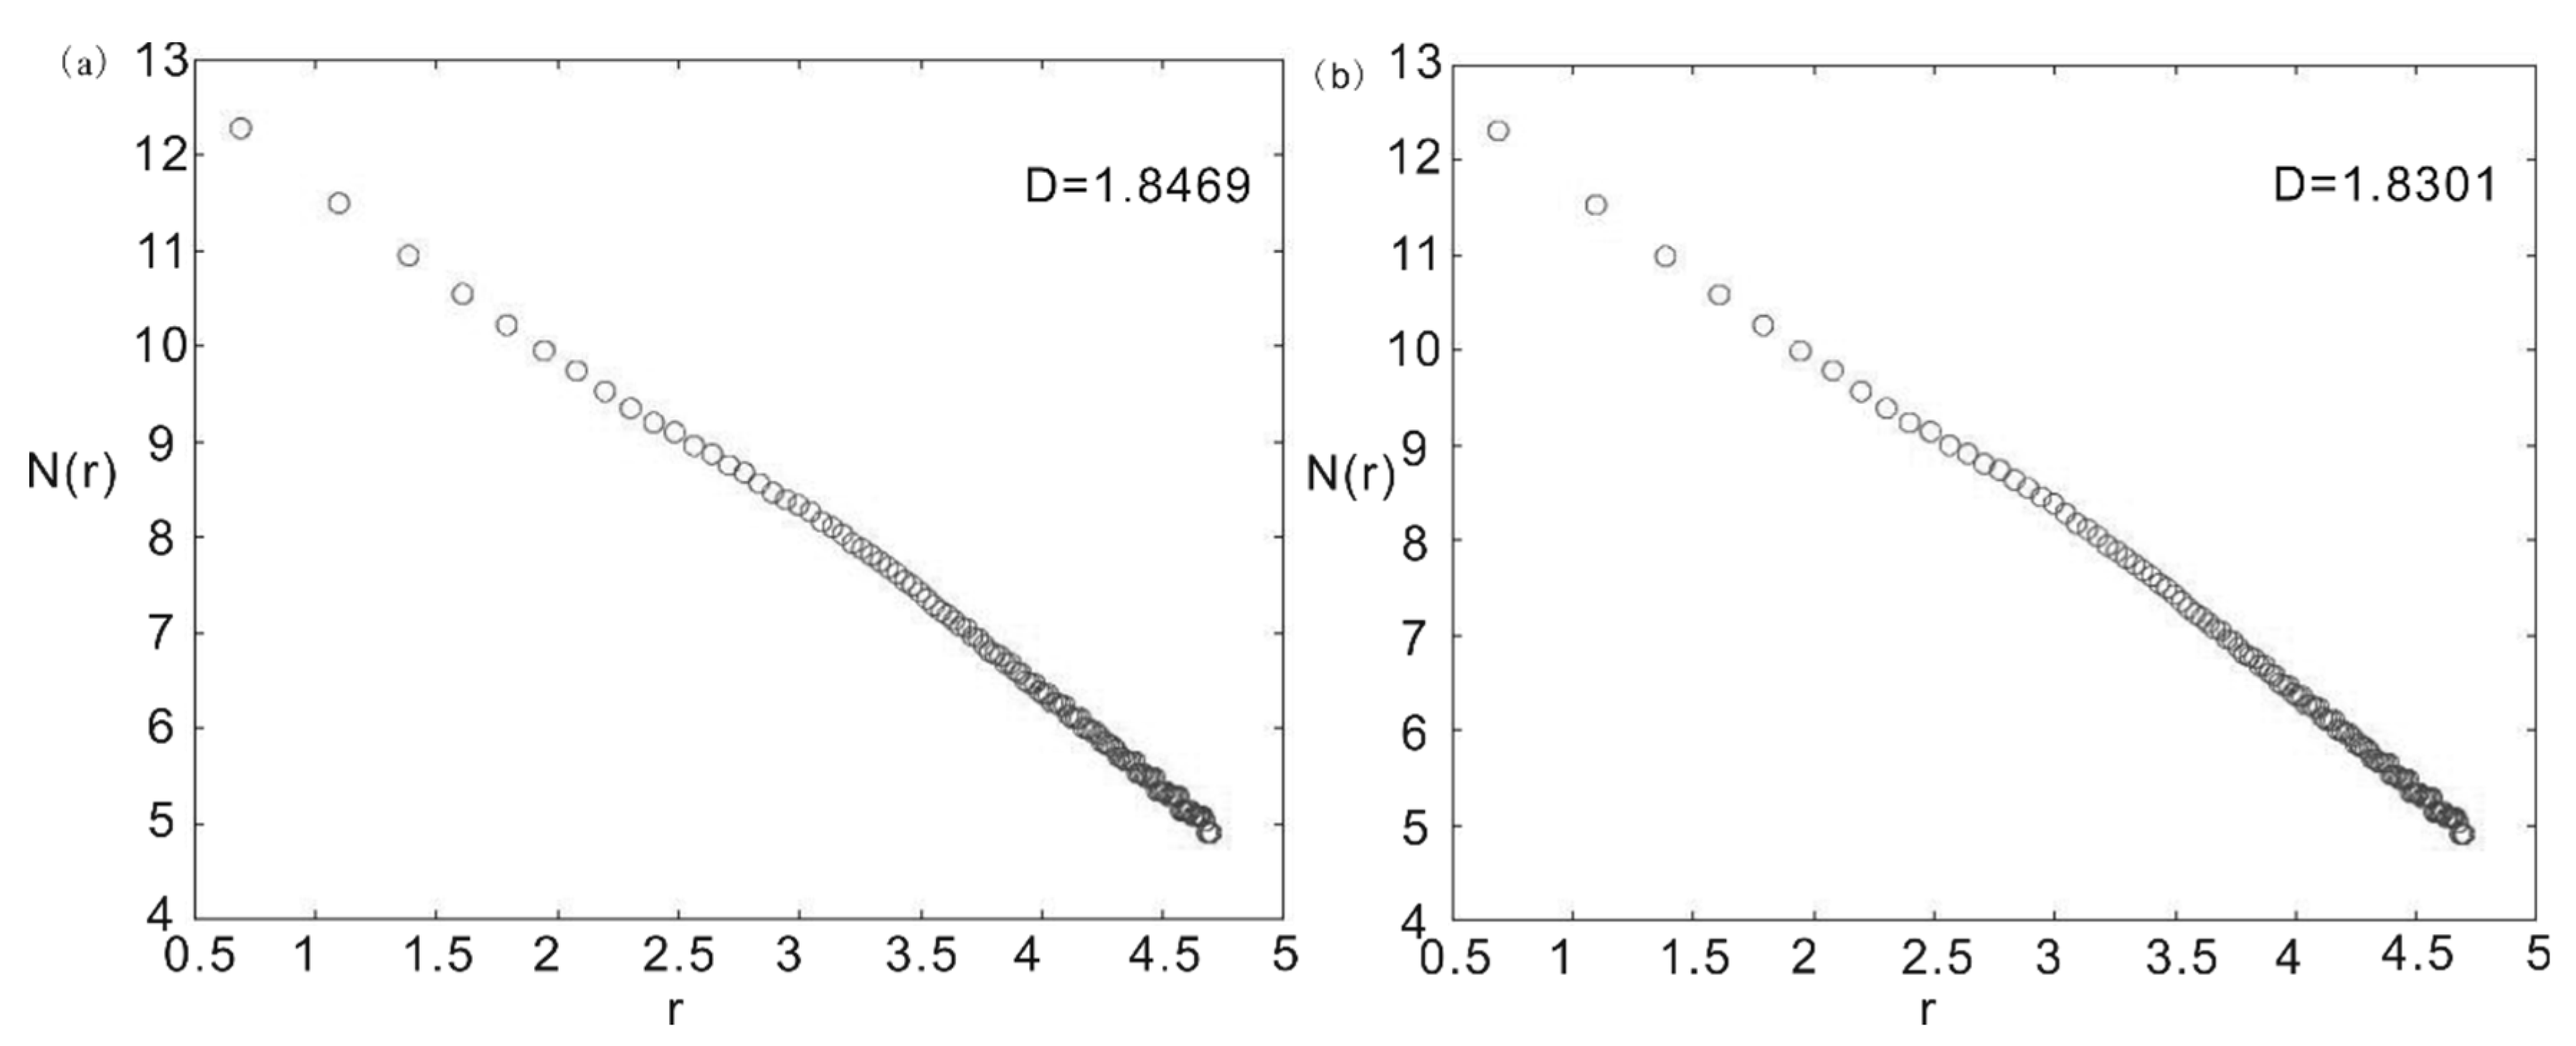
In this study, D is a quantitative measure of the fault throw that was calculated by the box-counting method [32]. According to Equation (3), the dispersion map was divided into numerous grids with a side length r, the number of grids with the geometry N(r) was determined, and the corresponding N(r) changed with the r scale. A double logarithmic plot was generated, in which r is the abscissa and N(r) is the ordinate. The threshold was calculated, and the slope of the linear fit was D:
D = ln N ( r ) ln r .
Since the dip and dipping directions of the faults that developed in coal seams are almost constant, the value of the fractal dimension through the dispersion curve represents the fault throw. When the fault location was determined, the faults inside the working face were fitted in a step-by-step fashion through the ray path intersection method and fractal dimension value, which was combined with the geological disclosure information constraint to obtain the fault throw in the coal seam.

3. Experimental Test

An experimental system was designed with an optimal layout to collect high-quality data for reasonable detection that satisfied the study objectives, and many unknown geological factors need to be considered. The main components of the design, including the observation system layout, the actual measurement system, the geophones, and the seismic sources, are presented below.

3.1. Test Site Layout and the Actual Measurement System

The main mining seam (No. 4) of the 4203 testing working face of the Longquan coal mine in Shanxi, China, is located at the top of the Taiyuan formation. The overall orientation of the coal seam is north-west and tends north-east with a dip angle of less than 15°. The working face floor is mainly affected by the limestone and sandstone solution fissure aquifer of the Taiyuan Group and the limestone solution fissure aquifer of the Ordovician Middle System. The working face elevation is +498.2–630.5 m, the level elevation of Ordovician ash aquifer is about +1124.98–1180.28 m, and the value of pressure is approximately 5.5–6.27 Mpa. Additionally, the hidden structures in the coal seam mining may connect with the aquifer and trigger a sudden water inrush during mining. The direct roof and floor of the coal seam are composed of sandstone, with the resulting large difference between the wave impedance of the coal seam and the surrounding rock facilitating the formation of channel waves.
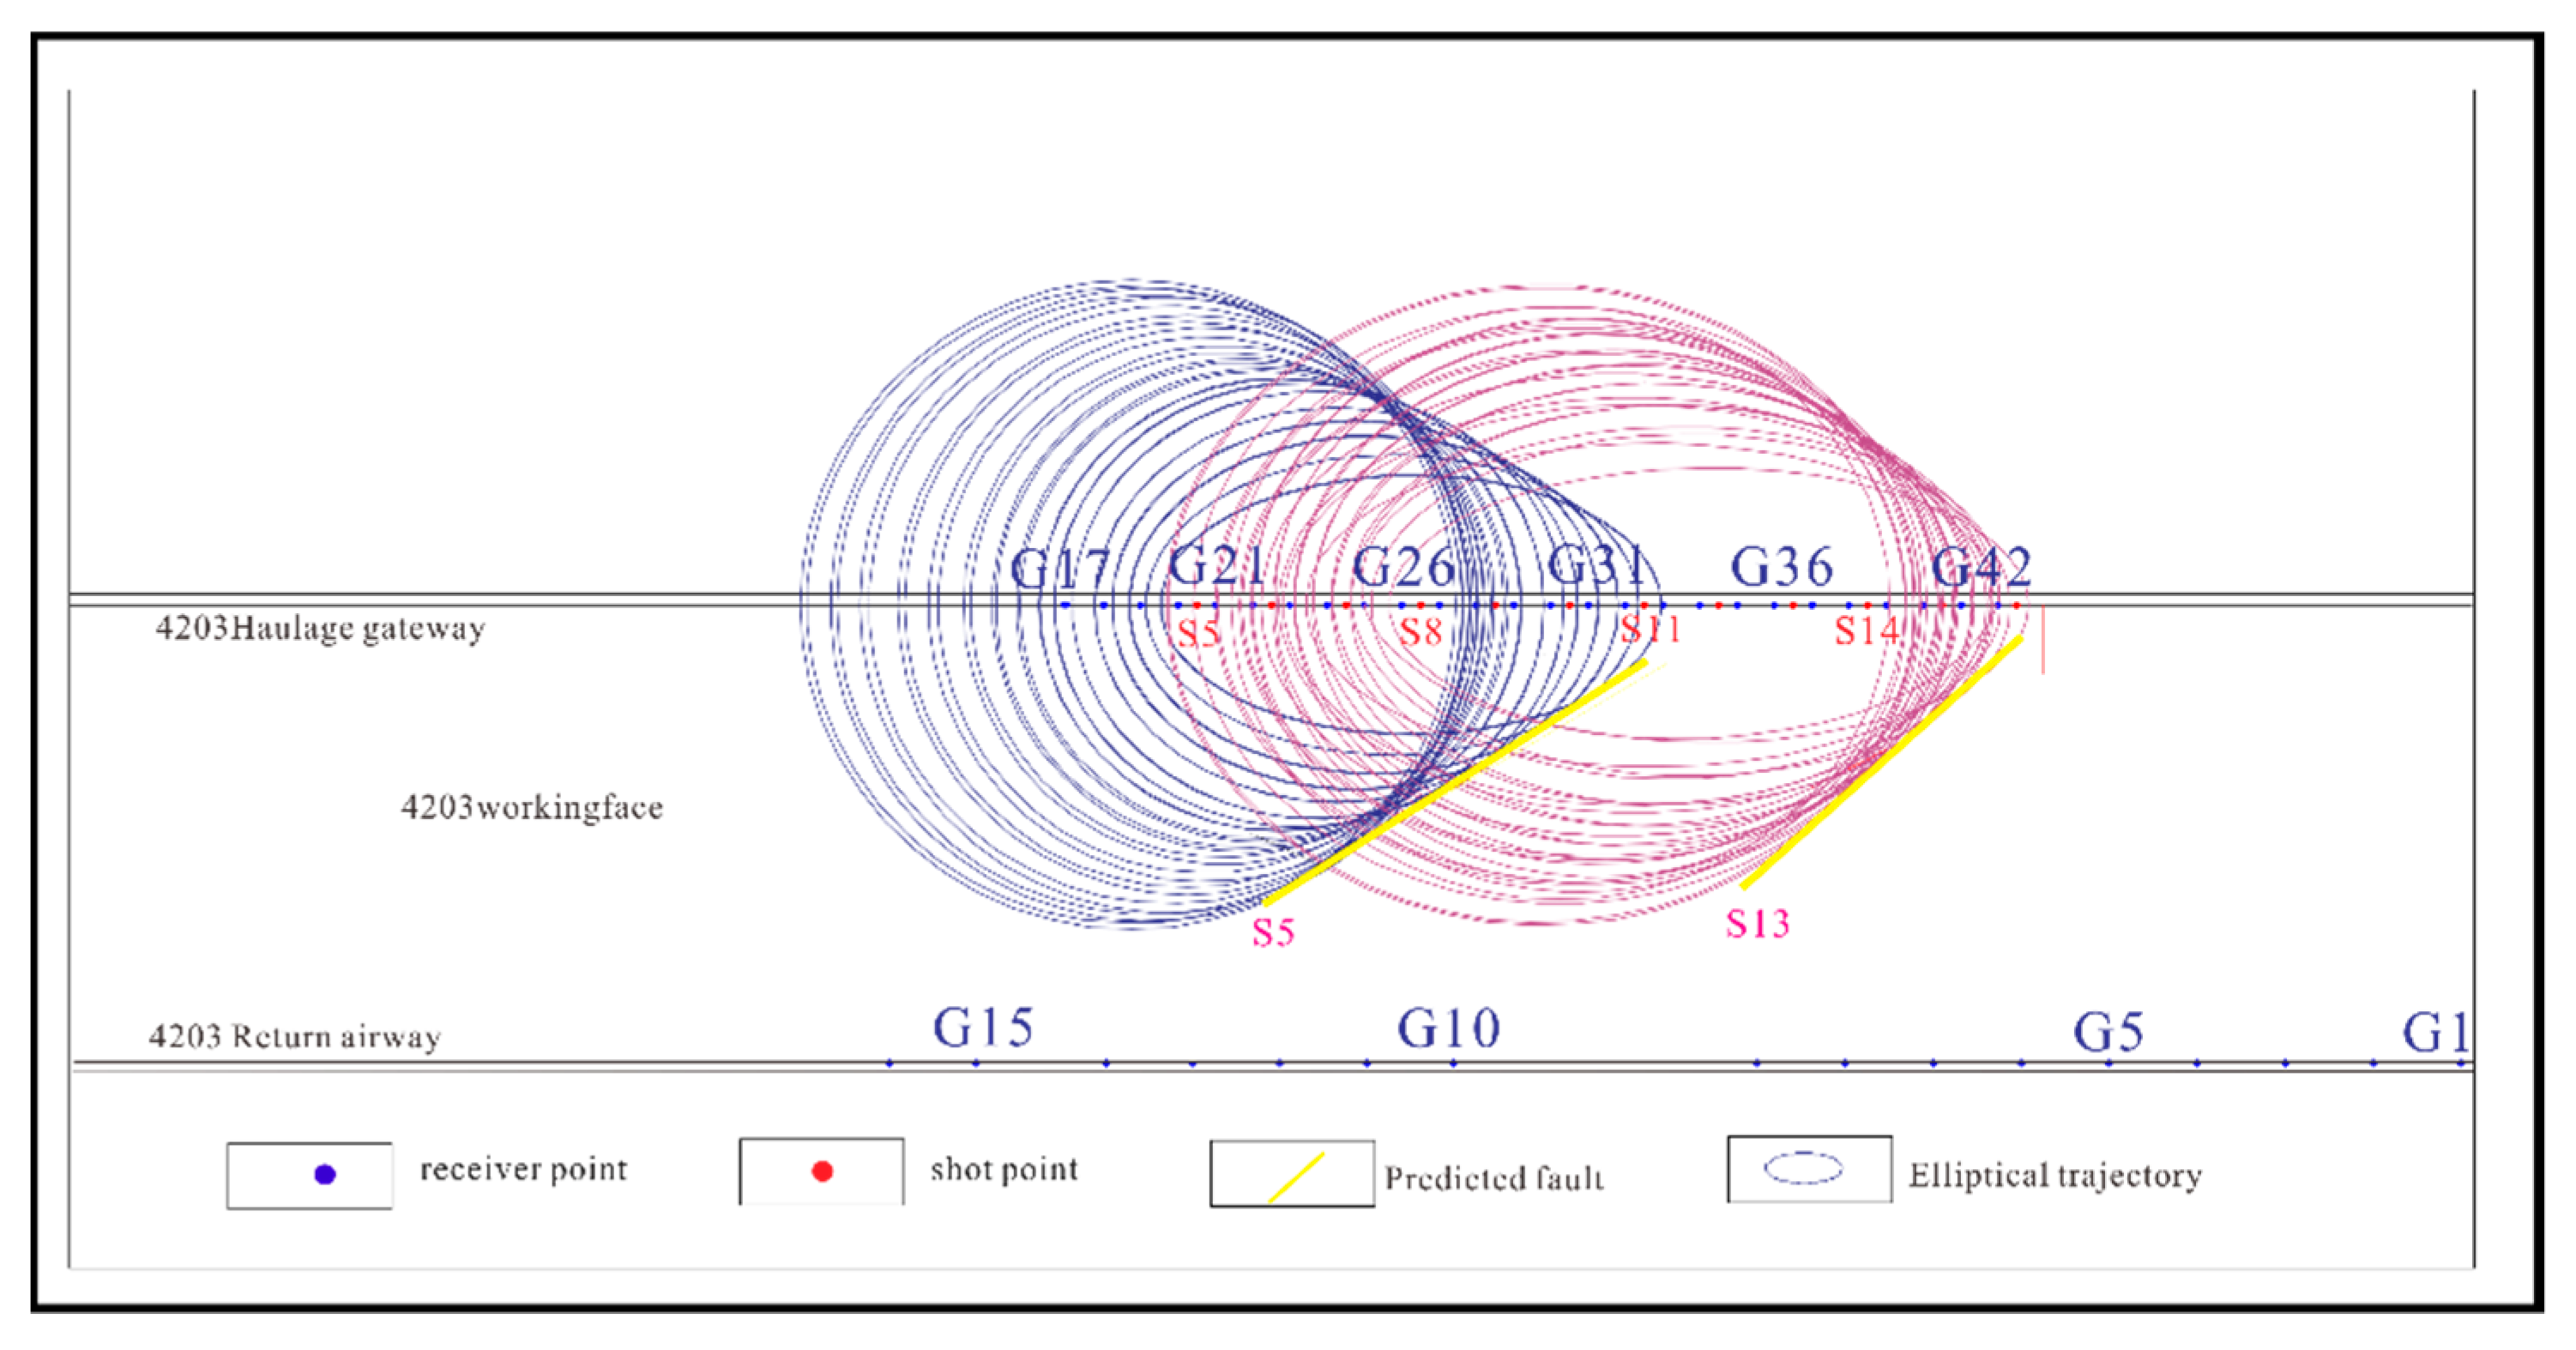
The test area is 250 m wide and 510 m long, and the steady average thickness is 6.47 m. In the return airway, the throws of the f29 and f30 faults are 7 and 13.8 m, respectively. In the haulage gateway, the throws of the f36 and f37 faults are both 4 m. The structural distribution of this working face is also the main geological target body for exploration, and the observation layout is shown in Figure 1. There are two sensor arrays (G1–G16)/(G17–G42) and one source section (S1–S16), in which G1 to G9 are invalid detection points in the actual measurement process. The yellow line segment and the upper and lower roadways form an inverted trapezoid that delineates the transmission range. The rectangle formed by the blue line segments is the reflection measurement range. Therefore, some transmission information is missing, which is inevitable in practice.

3.2. Geophones and Source Installation

The data were acquired using channel wave seismic measurement with the SUMMIT II Ex system, which detects seismic vibrations, normally created by explosions, and saves the data for subsequent evaluation and interpretation in a computer center. The geophone sensor has dual components, X and Y, which are parallel and perpendicular to the coal wall, respectively. The two components are typically processed separately, where the component of the channel wave component with an apparent signal is often the first choice. The geophones were placed in similar directions to facilitate data consistency and polarization prediction, and the sensor has a bandwidth range of 28–2000 Hz, which is necessary to detect small faults. The dominant exploration strategy employed at the site was to improve the coupling degree of the geophones and deploy explosives in the coal seam. First, a deep hole was drilled at a uniform height in the 1.5–1.7 m range above the floor and cleaned. Then, the geophones and explosives were buried in the coal seam 1.5–2 m deep at the design point. The most important consideration was the coupling effect between geophone and coal wall, the geophone used for acquisition has a length of 2.5 m and diameter of 5.5 cm, and the airfilled capsule of the geophone is fully contacted with the coal seam through the borehole in order that a good data quality can be achieved. Additionally, the inflation pressure of the built-in airbag of each geophone was 3–4 bar.
The seismic source required a uniform detonator delay time and explosive charge, and the blast hole was blocked with water-cannon mud with a length no less than 60 cm. This measure effectively excluded coal mine dust to ensure safety and data quality.

3.3. Velocity Analysis and Elliptic Tangent Offset

We selected a quality channel wave for extraction velocity from the dispersion map. Channel G16, which corresponds to S7, is an example (denoted as S7-16; a similar naming convention is employed hereafter). The time and velocity were used as the left and right ordinates, respectively, of the double y-axis of the dispersion map. The calculated envelope velocity was in the range of 1212–1317 m/s, the selected travel time was 253 ms, which corresponds to the maximum amplitude, and the optimal velocity value was 1264 m/s, as shown in Figure 2. The receiver channel of the reflection arrangement is G17 to G42, with two reflected wave groups circled in red in the raw record, as shown in Figure 3. The elliptic tangent offset imaging was performed on the two known reflected wave groups through the extracted optimal velocity value, as shown in Figure 4.

3.4. Classification Feature Extraction and Fault Location Extension

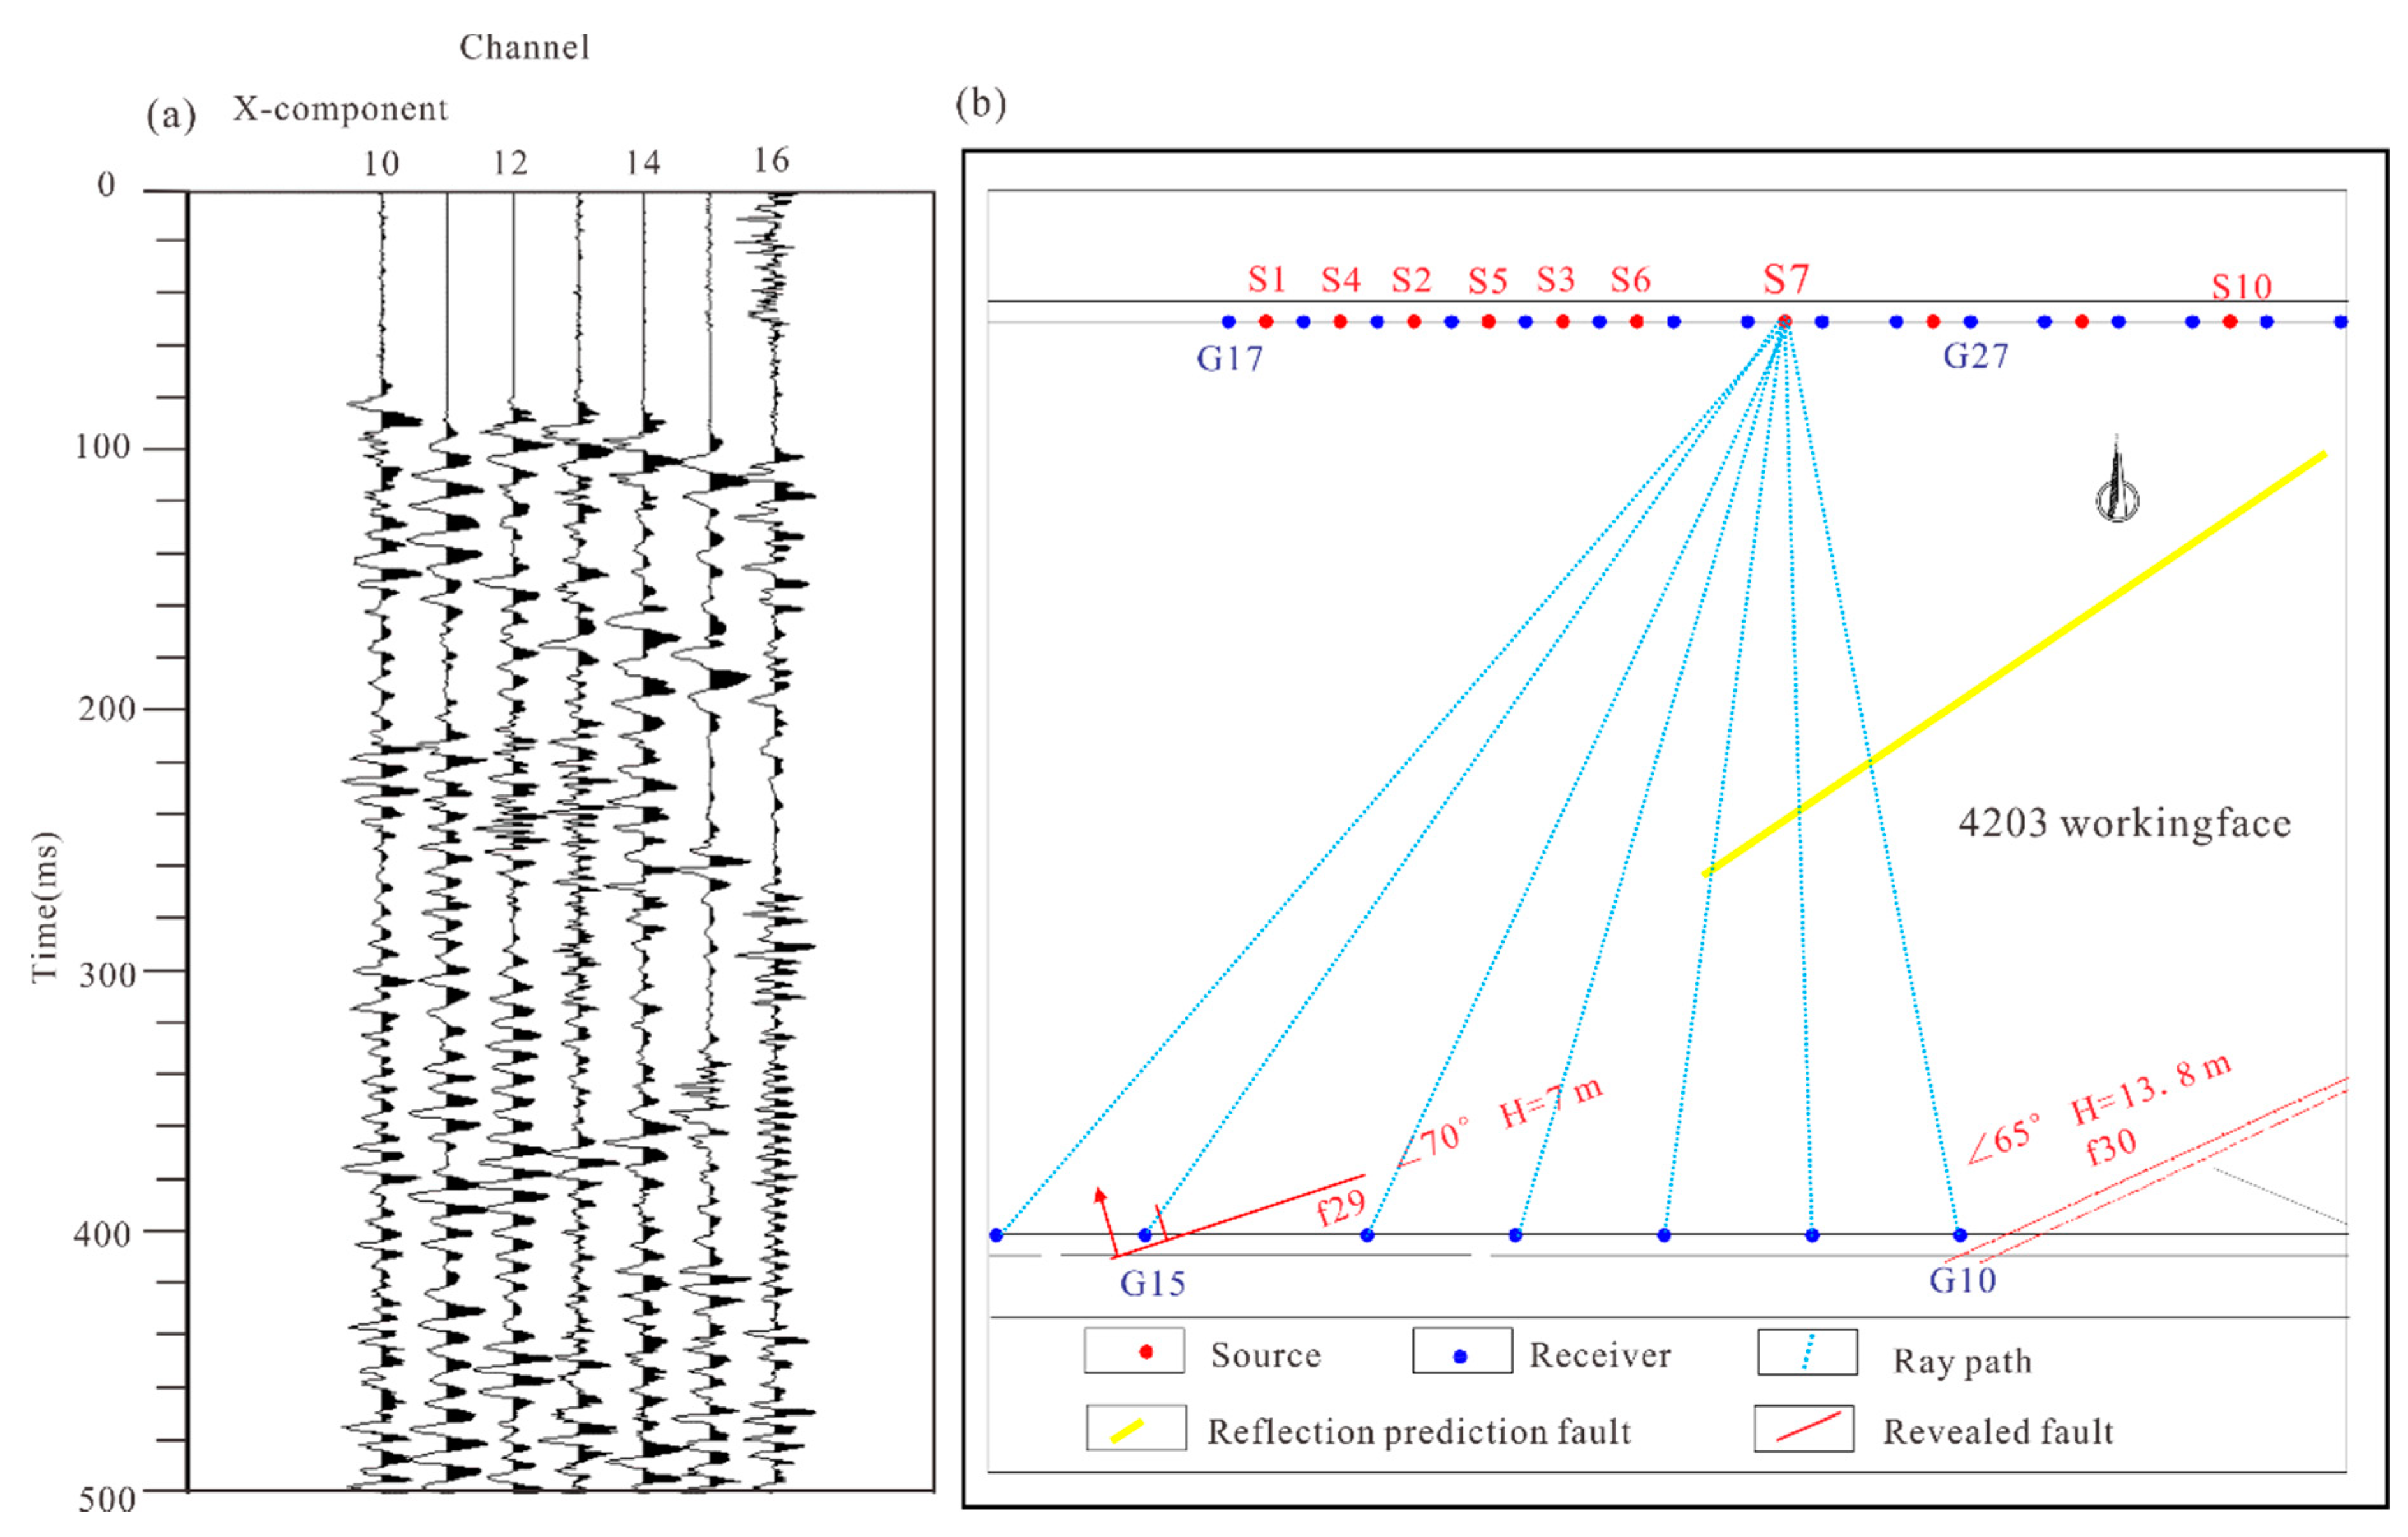
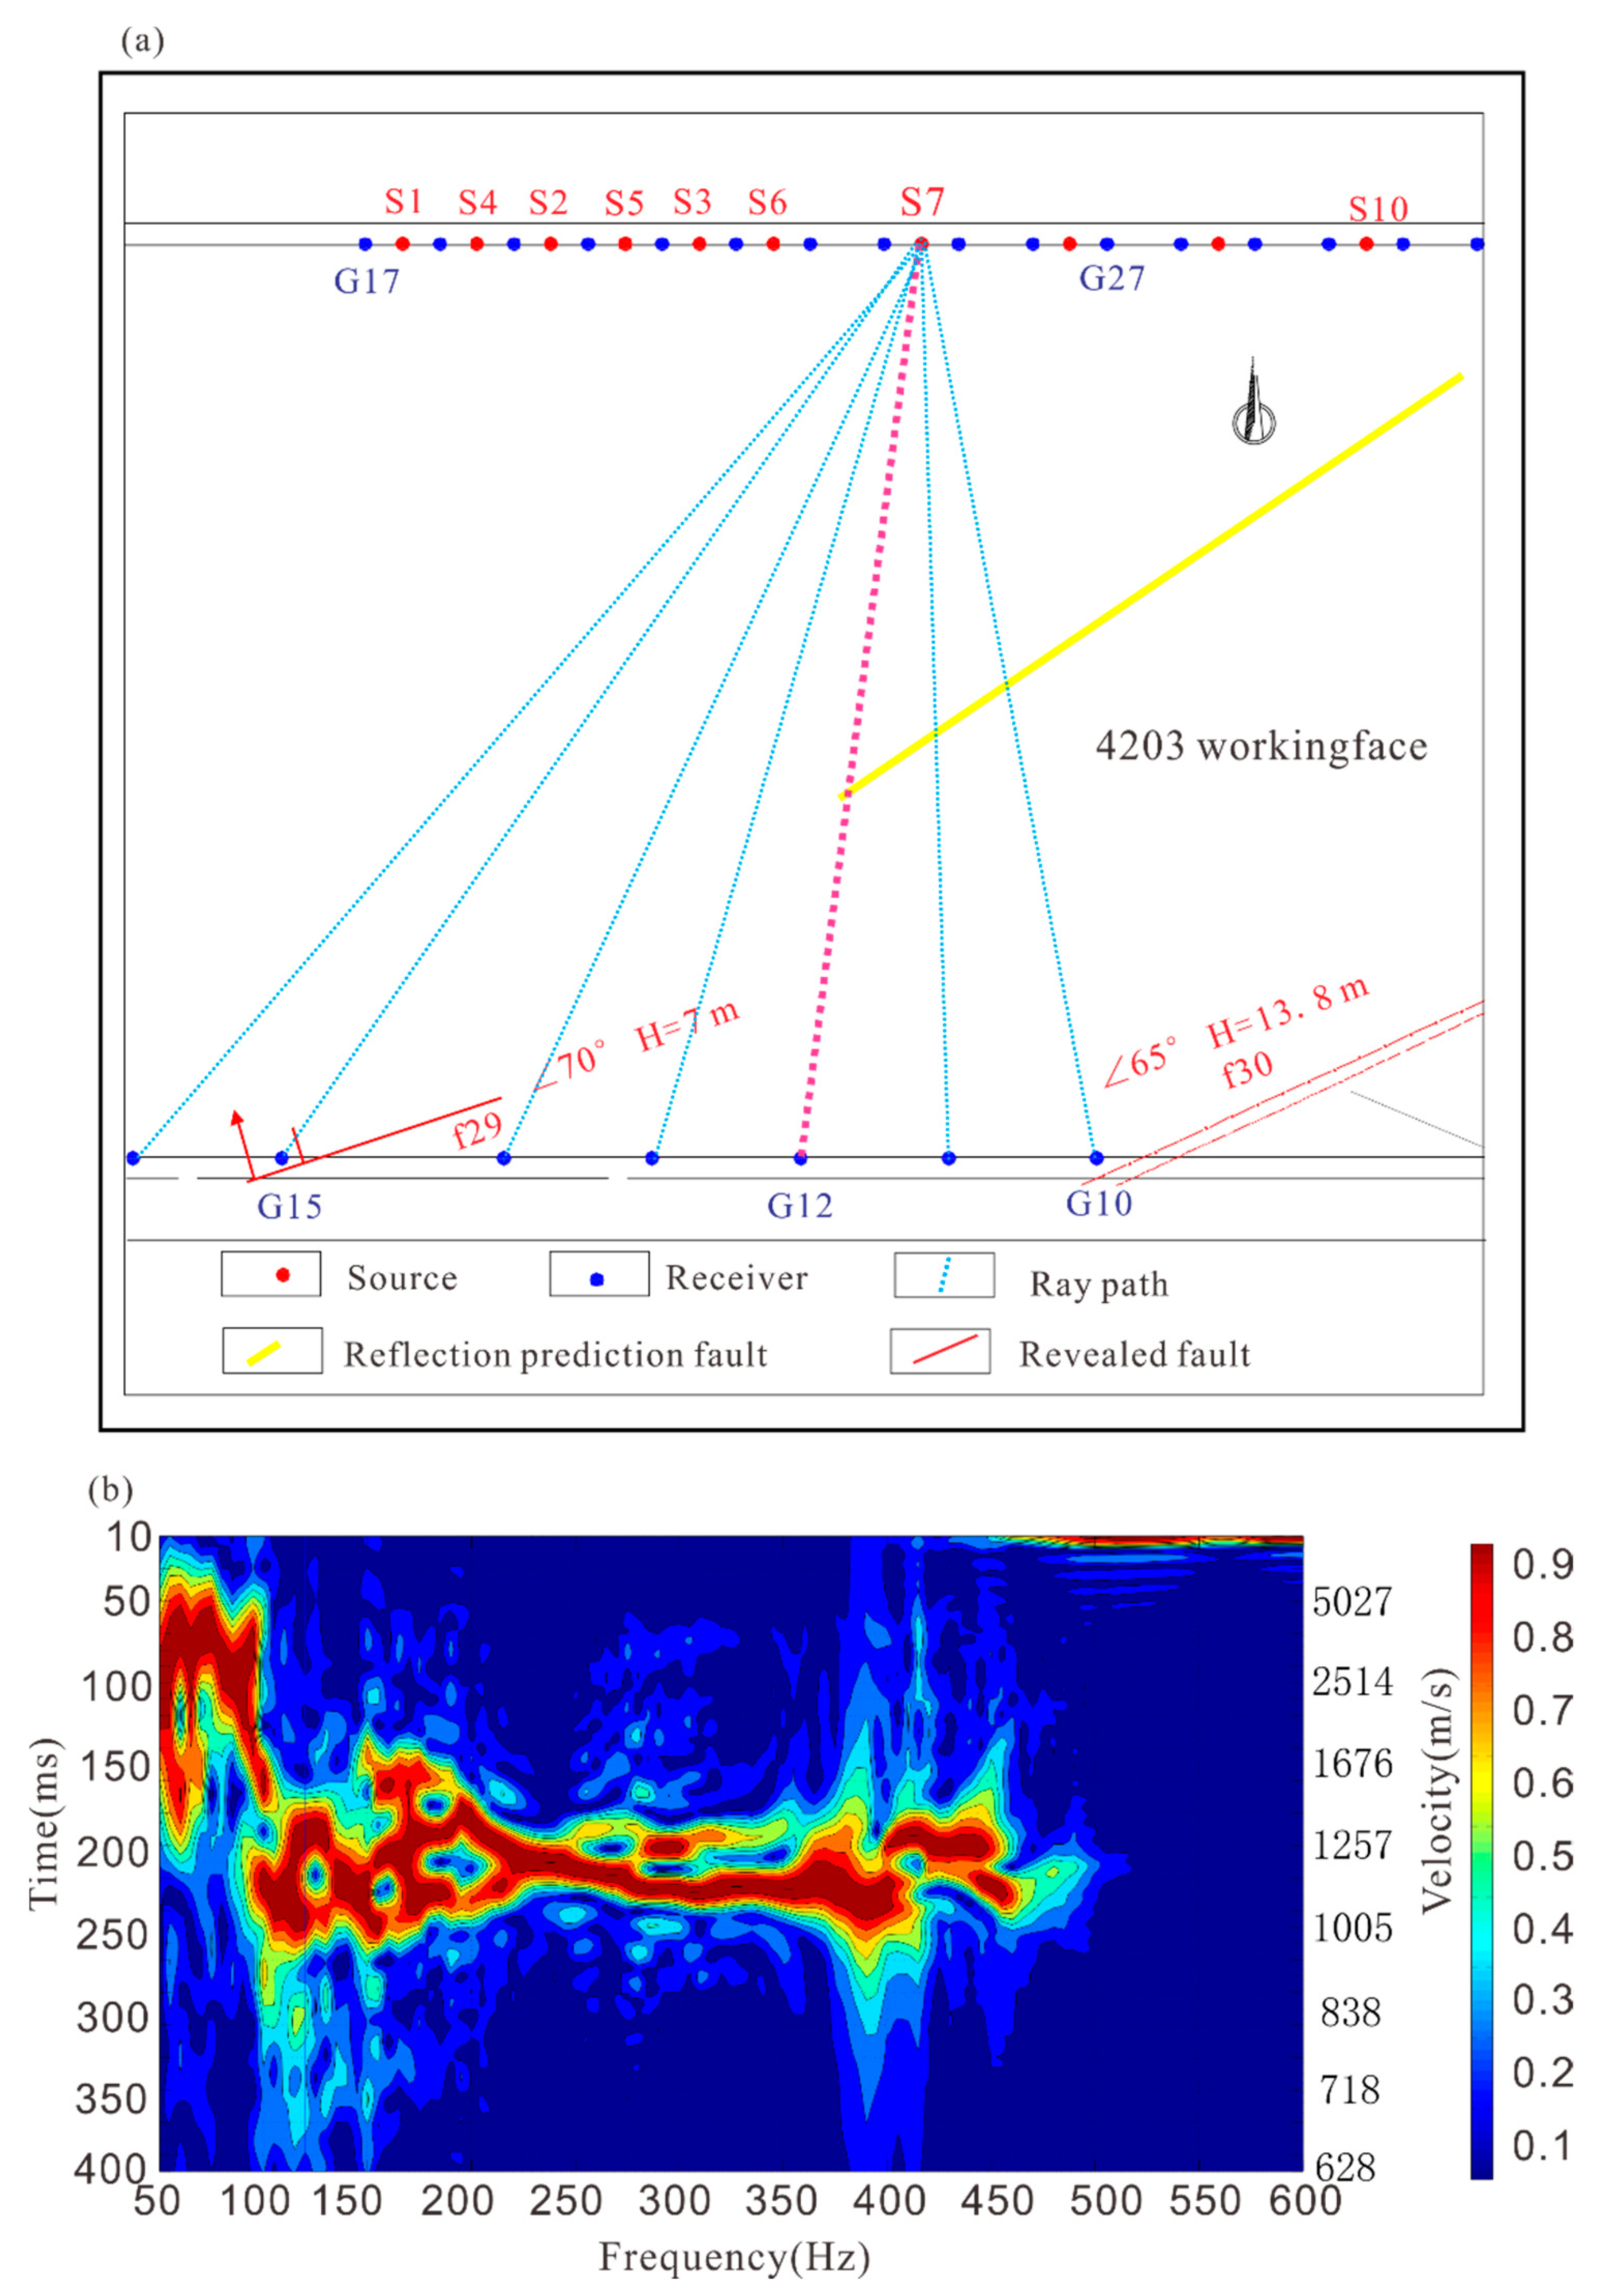
Since the location of the reflection-detected fault does not extend into the return airway, the geological hypothesis is that the exposure fault is consistent with the detection results. Therefore, we used logistic regression and neural network models to prove whether the fault extends into the roadway. The variables were first defined based on the reflection fault location obtained by the elliptical tangent method. Since the dispersion curve (u,f) is mainly affected by the velocity and frequency, we use ( v min , v max , f min , f max ) as variables. Then, the dispersion curve characteristics of the undisturbed coal seam through fault surface were compared, with the former showing a stable velocity value and the amplitude spectrum showing a relative width. Moreover, we used the known conditions as the training set. In Figure 5, the blue line corresponds to the S7 transmission path, and the yellow line corresponds to the position of the fault surface determined by the elliptical tangent offset method. For separate ray paths S7-12, which correspond to the known dispersion maps through the fault surface, the corresponding frequency for the Airy phase was in the range of 100~200 Hz and the corresponding calculated velocity was within the range of 1000–1795 m/s, as shown in Figure 6. The sample training predicted eigenvalue set to 1 indicates that the ray paths passed through the fault surface. The ray paths S7-16 for the known dispersion maps of the undisturbed coal seam, which has stable velocity values and the sample training predicted eigenvalue set to 0, indicate that the ray path passed through an undisturbed coal seam, as shown in Figure 2. For other unknown dispersion map types used as the test set for prediction, Figure 7 shows the corresponding dispersion curve velocity range and ray path. Therefore, S7-13 and S7-14 ray paths, which are predicted by the logistic regression and neural network classification eigenvalue, belong to set 1, while the ray path prediction of S7-15 belongs to set 0.
We established our geological hypotheses based on the size of the fault throw, which was determined by the revealed roadway. Logistic regression predicted that the f29 fault from the return airway runs through the haulage gateway. The number of iterations was set to 1500, and the learning rate was 0.01. Additionally, the final training value was β = (−0.2512, 1.8343, 0.2159, −0.3705, 0.0210). Meanwhile, the neural network model selected the same variables, and the comparison results of its predicted values are shown in Table 1. Only partial results are shown here, but the extent of f29 is identified. The S5-14 is higher in the range of velocity values relative to other ray paths, implying a comparatively large variation in the coal seam during propagation.
To demonstrate the verifiability of the two models, this paper evaluates the logistic regression and neural network models using receiver operating characteristic (ROC) curve analysis, in which the sensitivity and specificity are acquired using the predicted values of the results as possible judgment thresholds. The specificity is the horizontal coordinate, the sensitivity is the vertical coordinate, and the size of the area under the curve (AUC) is a measure of the accuracy of the model prediction. The value ranges from [0,1], with a higher value indicating better judgment by the model. The AUC value is 1, when the ideal model prediction is in perfect match with the actual distribution.
In Figure 8, specificity refers to the proportion of undisturbed coal seam ray path correctly predicted, and sensitivity refers to the proportion of path through fault correctly predicted. The AUC values of the neural network (blue line) and a logistic regression (green line) model are 0.798 and 0.773, respectively, indicating that the prediction results of these two models can be verified by each other.

3.5. Fault Throw Prediction

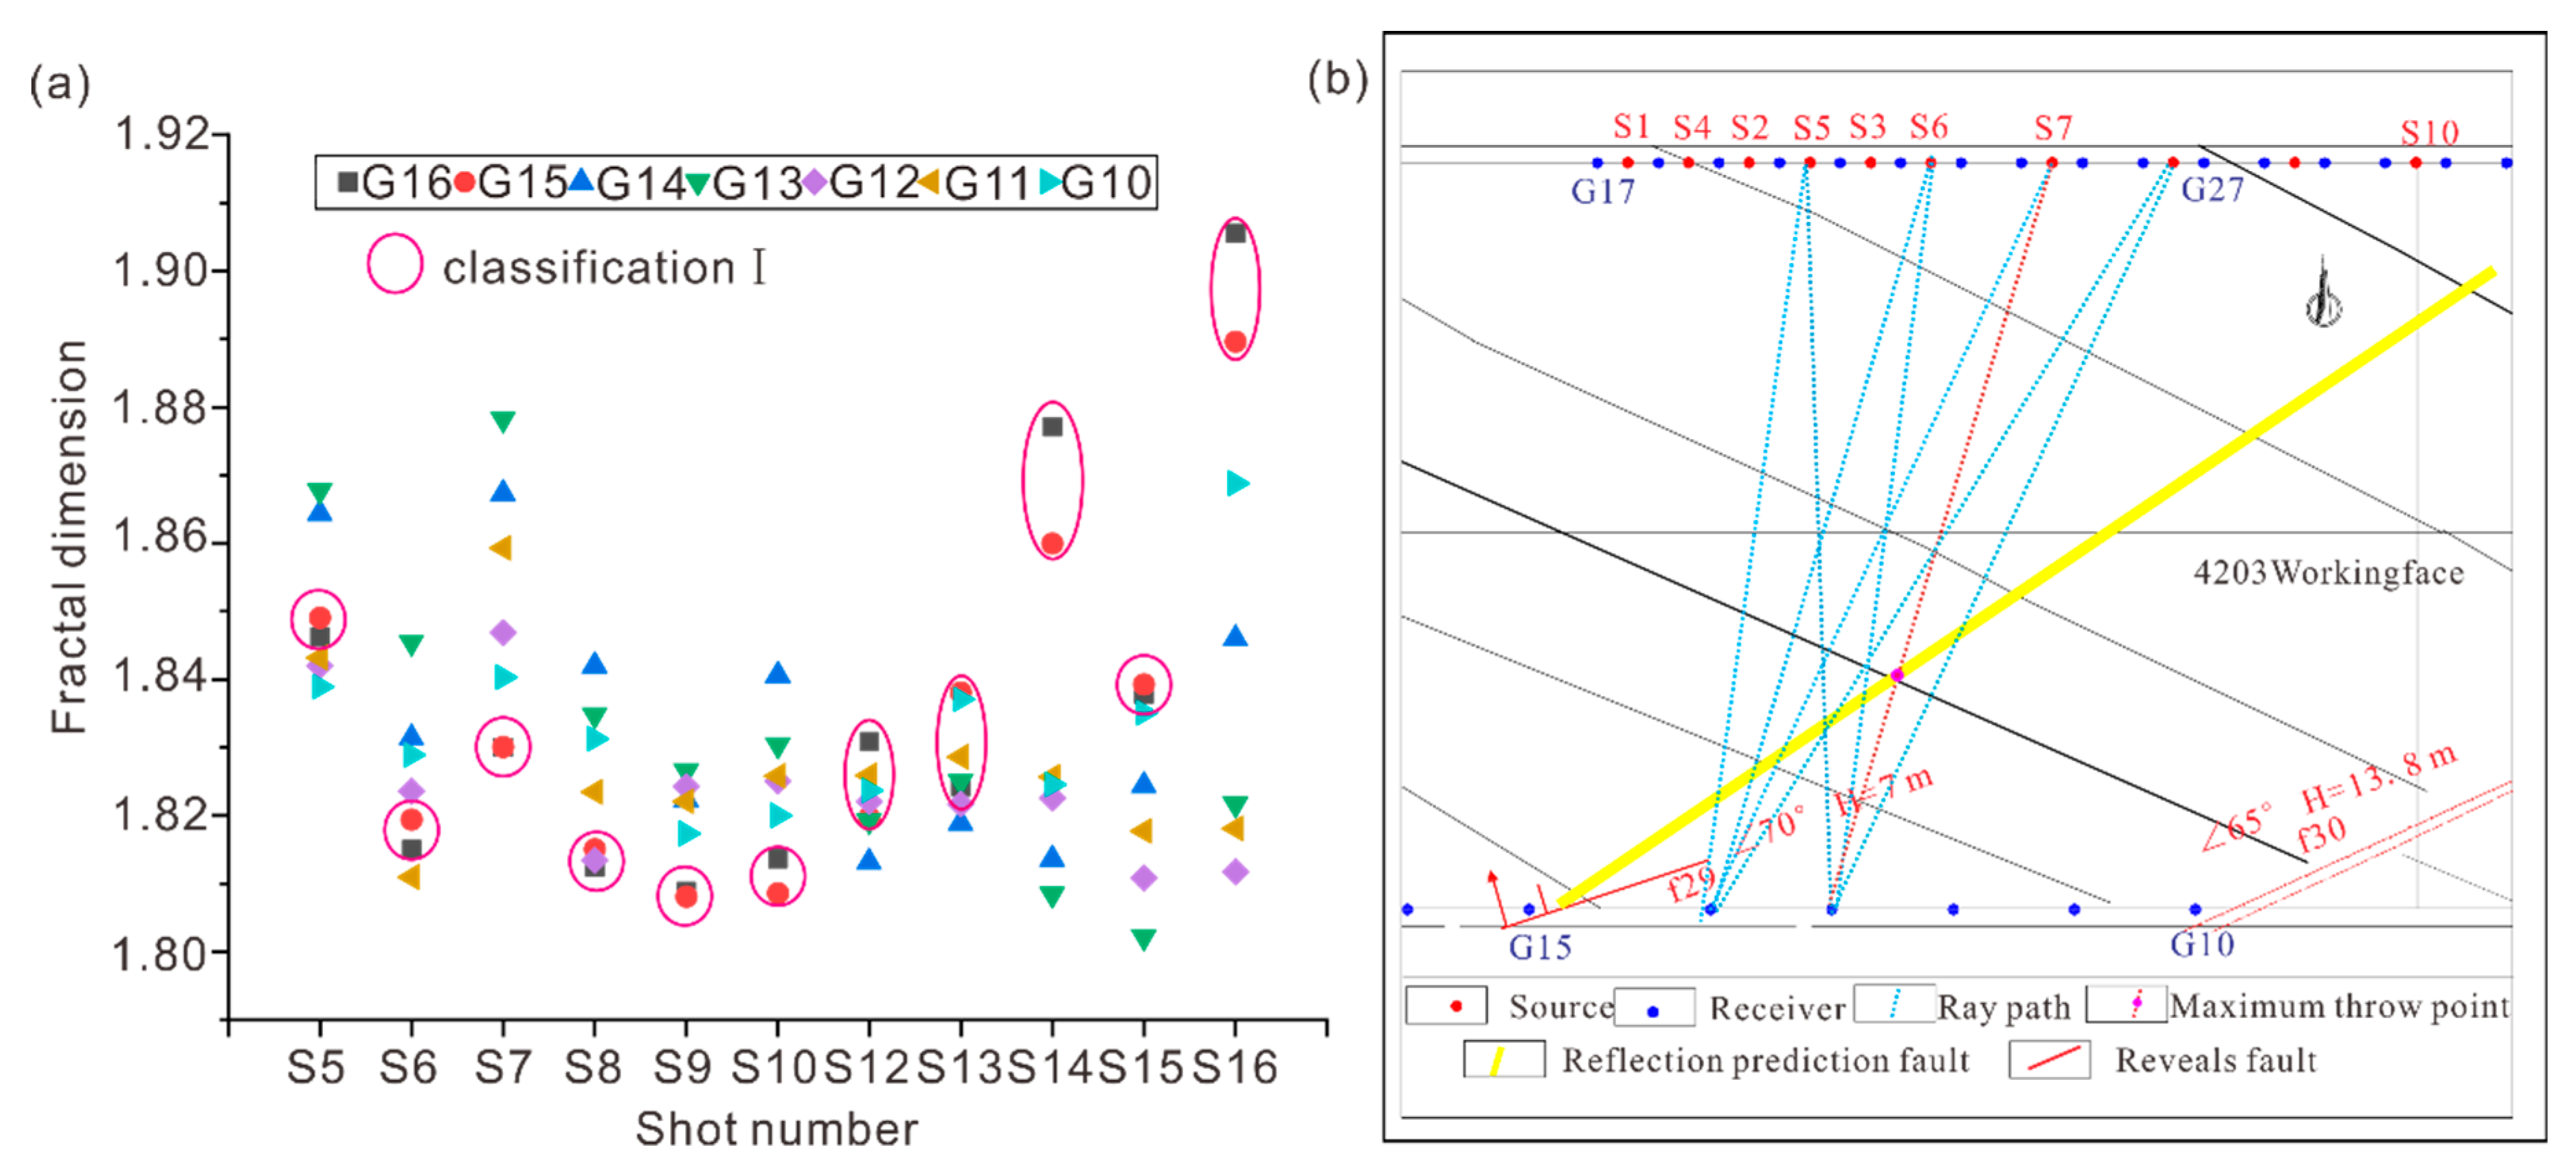
We introduce the D calculation to determine the fault throw, where high D values correspond to a complex velocity range for the dispersion map. The D of S7-12 indicated that the ray path passes through the f29 fault, corresponding to the D of S7-16, which did not pass through the fault, as shown in Figure 9. The D was calculated and constructed as a matrix for effective display, and the common detector points were divided into two groups by K-means clustering [33]. In Figure 10, the abscissa represents the valid shot number, and the ordinate represents the D value. The results show that the G15 and G16 common detector points belong to Classification I (delineated by the pink circle), and G14, G13, G12, G11, and G10 belong to Classification II, the groups I and II detectors were on the left and right sides of the f29 fault. D was relatively high and low when the common detector point ray path passed and did not pass through f29, respectively. This result is consistent with the fault extension obtained by the above result, which when combined with the determined fault throw and D normalization process performs the linear fitting. By comparing the ray path with the fractal dimension of the fault intersection point, we obtain the maximum fault throw value (the intersection of the red dotted line and the yellow solid line). The extended f29 fault length inclined across the entire working face, and the D matrix calculation results refined the geological hypotheses.

4. Result and Discussion

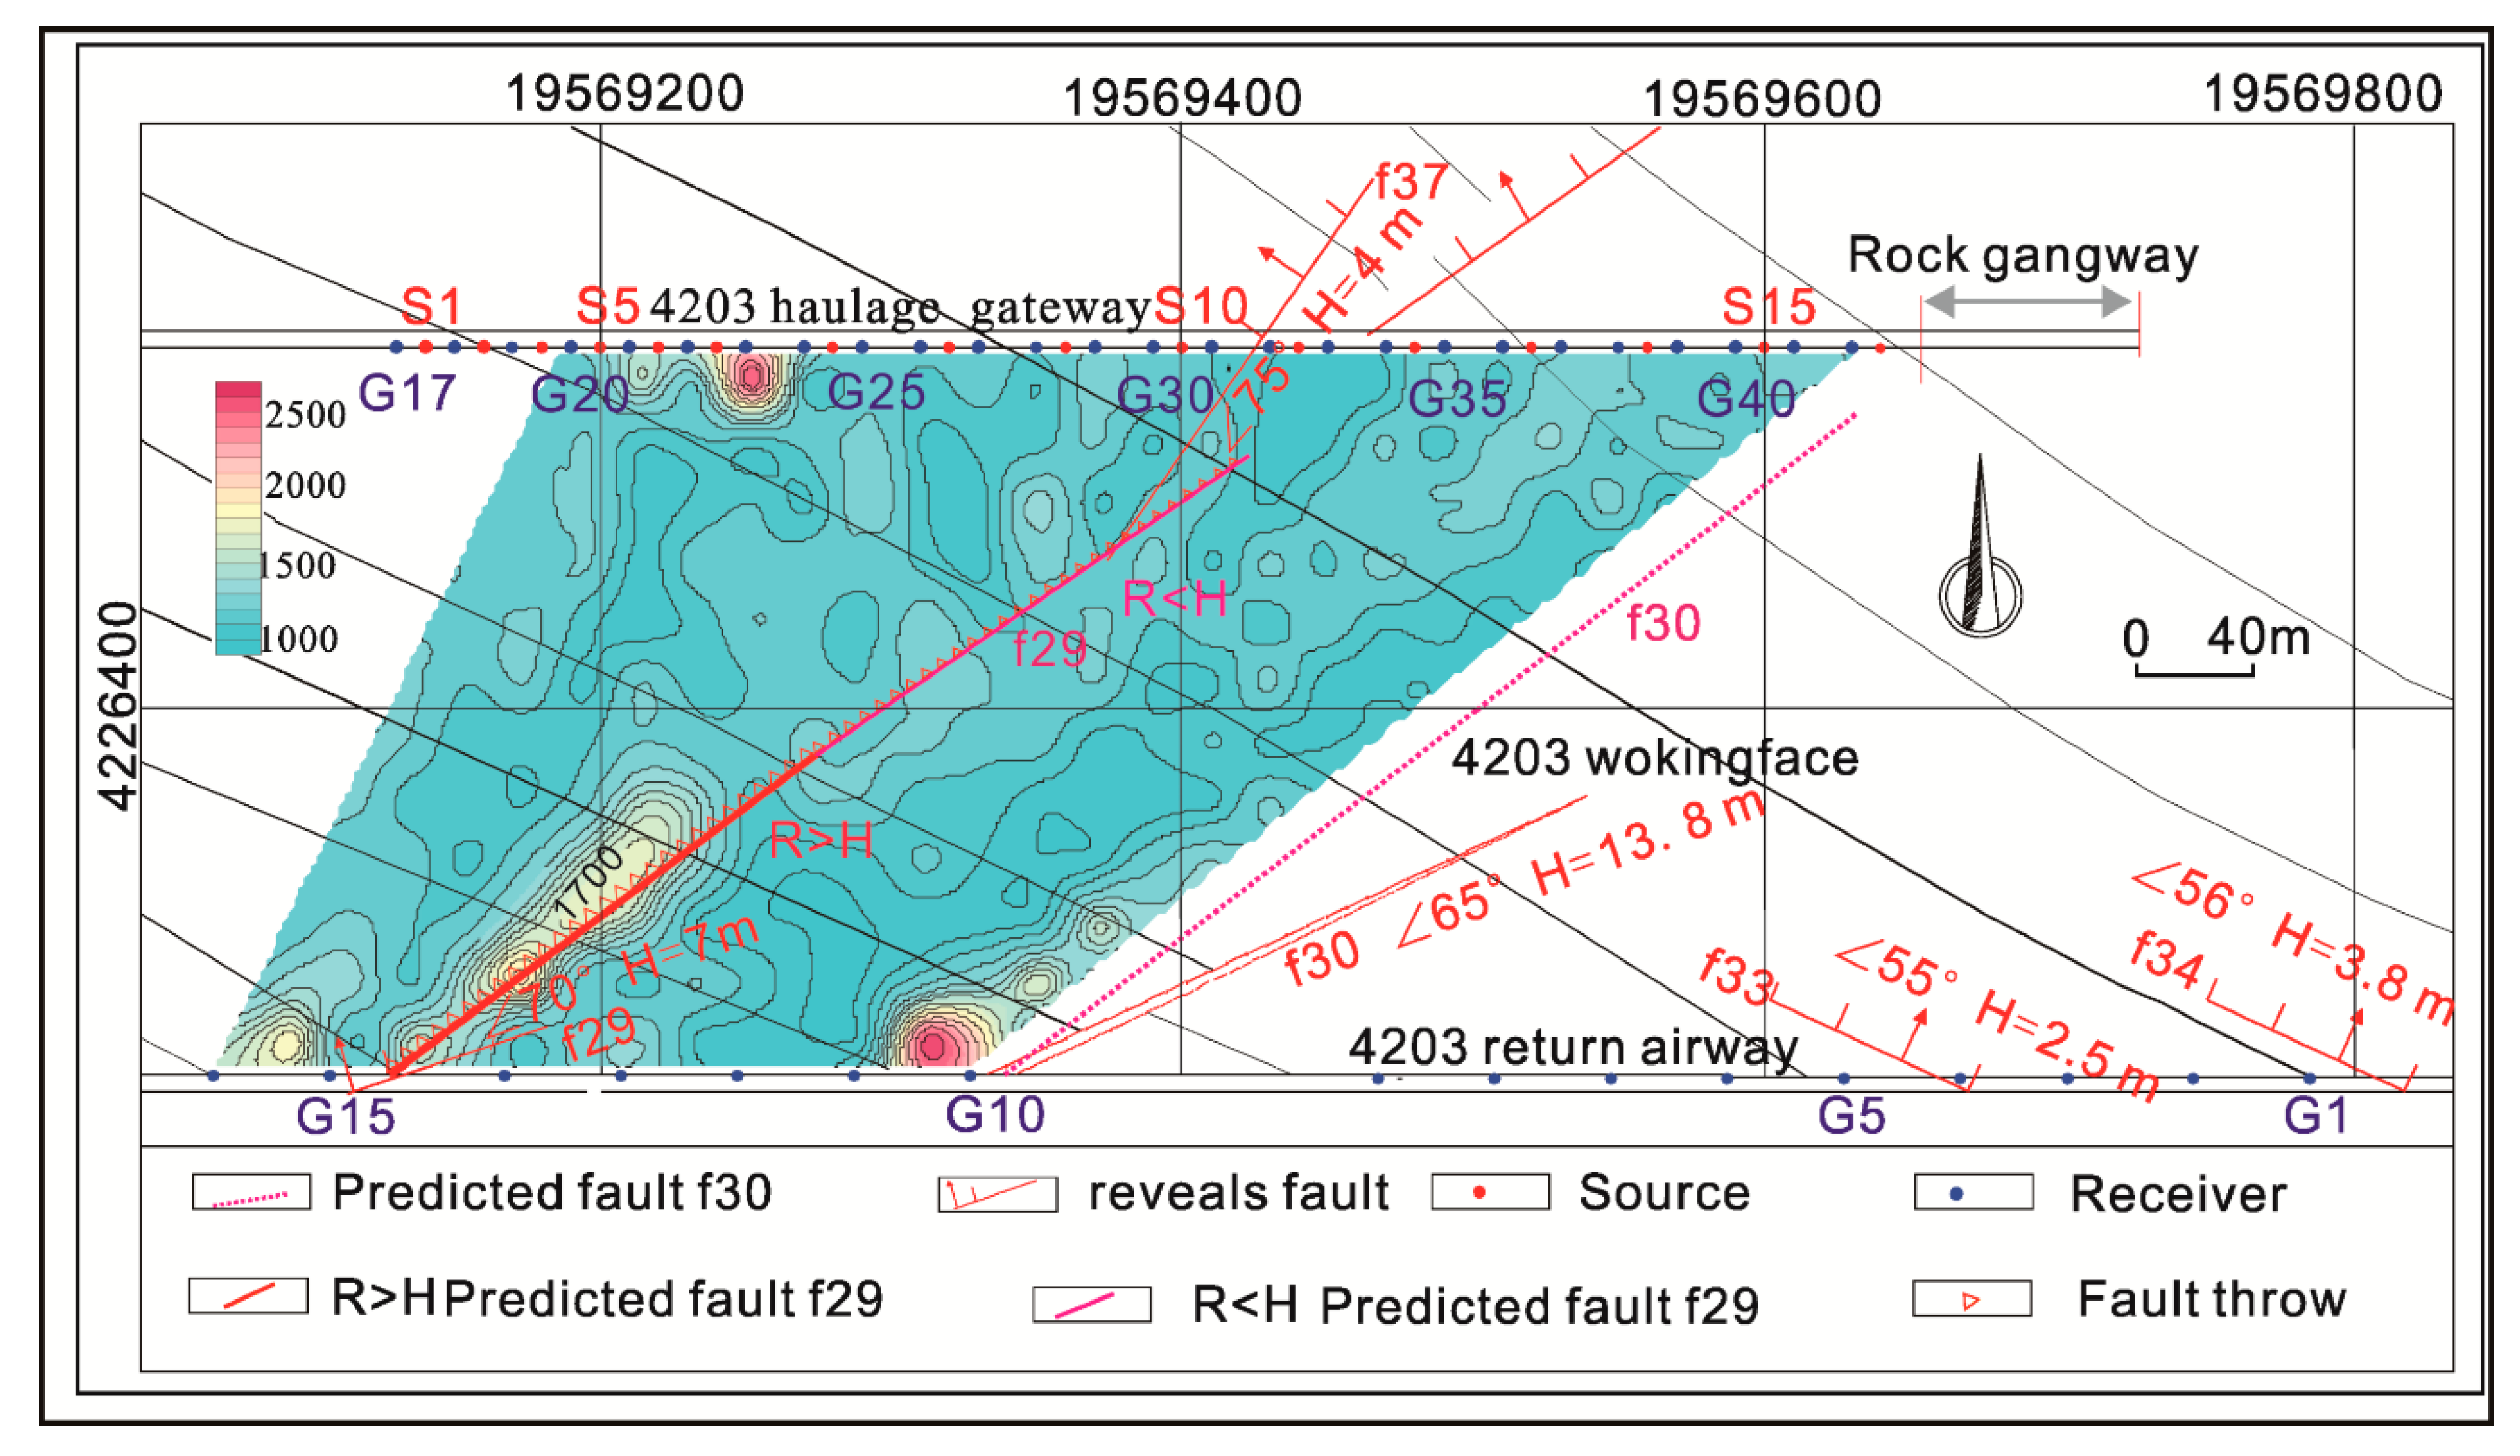
A quantitative study on the properties of faults by the channel wave seismic method was verified in mining areas, and the interpretation results are shown in Figure 10. Two group faults obliquely cross the working face with the roadway angle 35–40°, and the predicted error in the position of the f30 fault is 6.7 m, which verifies the reflection detection method. We use the revealed fault throw as a constraint to normalize the D value and perform the linear fitting of D to explain. The throw is represented by a triangle with a straight line as the base, and the greater the fault throw, the greater the height of the triangle. The f29 throw over the considered range increased to approximately 8 m and then gradually decreased, while the ellipse tangent method predicts that the partial fault throw is approximately 4 m. These results modify the original design of the roadway exploration engineering project near the f29 fault of the haulage gateway.
For a reasonable estimate of the fault throw, the priority is to the location of the fault. High-quality sensor signals were essential for the results, and the reflected waves at different times in the raw records corroborate the existence of two groups of faults. If the reflection geophone array of the design does not extend over a sufficient length, the result is that some reflection offset may be lost, as shown in Figure 4. The velocity pickup method is more robust than the attenuation in most cases, but neither method quantifies the fault throw. The interpretation of the transmission velocity imaging is shown in Figure 11, in which the blue color represents the background velocity value of the coal seam, while the other colors represent the velocity value as higher than the coal seam. Part of the f29 fault is not apparent in the image mainly due to the fact that the fault throw is quite small to lead to sufficient velocity anomalies.
Combining the transmission and reflection information offers many advantages for the quantitative detection of fault properties. First, it can precisely extract the velocity of channel waves, which improves the accuracy of the predicted fault offset location based on the reflection method. In addition, the data processing is robust and comprehensive, due to the fact that using all of the transmission and reflection information for the detection of fault properties compensates for the uncertainty of the observation system. Finally, the logistic regression and neural network model can be valid for the analysis of the extended fault length, and the D calculation quantitatively analyzes the fault throw, thus improving the reliability and accuracy of the determined characteristics of the fault.

5. Conclusions

Channel wave seismic quantitative detection of faults is an effective method for determining the fault attributes of the coal seam, which combines transmission and reflection information. The extraction velocity of the quality dispersion map improves the accuracy of the elliptical tangent offset imaging. Classification by the logistic regression and neural network model can effectively verify the faults detected by the reflection method and reasonably extend in length, which predicts that locations involve a small margin of error and are more consistent with reality. The fractal dimension D can gradually refine geological hypotheses to determine the fault throw. Under the constraints of geological laws, multi-wave and multi-component extraction and fusion have become powerful tools for fault attribute discrimination and extraction.

Author Contributions

Conceptualization, Y.W. and W.W.; investigation, Y.W., M.Z. and Z.G.; writing—original manuscript preparation, Y.W.; writing—review and editing, G.Z. and W.W.; carry out the research jointly, Y.W., G.Z., W.W., M.Z. and Z.G. All authors have read and agreed to the published version of the manuscript.

Funding

This research is supported by the project ‘subject of National Key R&D Program of China (grant no. 2018YFC0807800)’ and NSFC (grant no. 41641040).

Data Availability Statement

Data supporting the reported results can be found in the literature cited in the manuscript.

Conflicts of Interest

The authors declare no conflict of interest.

References

  1. Wu, Q.S.; Wu, Q.L.; Yuan, A.Y.; Wu, Y. Analysis of Mining Effect and Fault Stability Under the Influence of Normal Faults. Geotech. Geol. Eng. 2021, 39, 49–63. [Google Scholar] [CrossRef]
  2. Hu, Y.; Mcmechan, G.A. Imaging mining hazards within coalbeds using prestack wave equation migration of in-seam seismic survey data: A feasibility study with synthetic data. J. Appl. Geophys. 2007, 63, 24–34. [Google Scholar] [CrossRef]
  3. Liu, H.H.; Cao, Y.Q. Technologies of Preventing Coal Mine Water Hazards for Sustainable Developmentin North China. Geotech. Geol. Eng. 2011, 29, 1–5. [Google Scholar]
  4. Pei, X. Signal acquisition method for 3D seismic exploration in high density coal mining area. Arab. J. Geosci. 2020, 13, 712. [Google Scholar] [CrossRef]
  5. Xiao, Y.L.; Wu, R.X.; Yan, J.P.; Zhang, P.S. Field strength propagation law of radio wave penetration and effective perspective width for coal face. J. China Coal Soc. 2017, 42, 712–718. [Google Scholar]
  6. Qi, S.W.; Sun, J.Z.; He, H. Review of Rayleigh Wave Exploration. Prog. Geophys. 2002, 17, 630–635. (In Chinese) [Google Scholar]
  7. Wang, B.; Liu, S.D.; Zhou, F.B.; Zheng, J. Diffraction characteristics of small fault ahead of tunnel face in coal roadway. Earth Sci. Res. J. 2017, 21, 95–99. [Google Scholar] [CrossRef]
  8. Peng, S.P.; Yang, F. Fine geological radar processing and interpretation. Appl. Geophys. 2004, 1, 89–94. [Google Scholar] [CrossRef]
  9. Hu, G.Z.; Teng, J.W.; Pi, J.L.; Wang, W.; Qiao, Y.H. In-seam seismic exploration techniques—A geophsical method predictting coal-Mine disaster. Prog. Geophys. 2013, 28, 439–451. (In Chinese) [Google Scholar]
  10. Evison, F.F. A coal seam as a guide for seismic energy. Nature 1955, 176, 1224–1225. [Google Scholar] [CrossRef]
  11. Krey, T.C. Channel waves as a tool of applied geophysics in coal mining. Geophysics 1963, 28, 701–714. [Google Scholar] [CrossRef]
  12. Edward, S.A.; Asten, M.W.; Drake, L.A. P-SV wave scattering by coal seam inhomogeinities. Geophysics 1985, 50, 214–223. [Google Scholar] [CrossRef]
  13. Buchanan, D.J. The scattering of SH-channel waves by a fault in a coal seam. Geophys. Prospect. 1986, 34, 343–365. [Google Scholar] [CrossRef]
  14. Cheng, J.Y.; Ji, G.Z.; Zhu, P.M. Love channel-waves dispersion characteristic analysis of typical coal models. J. China Coal Soc. 2012, 37, 67–72. (In Chinese) [Google Scholar]
  15. Buchanan, D.J. The propagation of attenuated SH channel waves. Geophys. Prospect. 1978, 26, 16–28. [Google Scholar] [CrossRef]
  16. Mason, I.M.; Buchanan, D.J.; Booer, A.K. Channel wave mapping of coal seams in the United Kingdom. Geophysics 1980, 45, 1131–1143. [Google Scholar] [CrossRef]
  17. Wang, W.; Gao, X.; Li, S.Y.; Yue, Y.; Hu, G.Z.; Li, Y.Y. Channel wave tomography method and its application in coal mine exploration: An example from Henan Yima Mining Area. Chin. J. Geophys. 2012, 55, 1054–1062. (In Chinese) [Google Scholar]
  18. Schneider, W.A. The common depth point stack. Proc. IEEE 1984, 72, 1238–1254. [Google Scholar] [CrossRef]
  19. Hua, B.; Mcmechan, G.A. Parsimonious 3D post-stack Kirchhoff depth migration. Geophys. Prospect. 2005, 53, 507–522. [Google Scholar] [CrossRef]
  20. Teng, J.W.; Li, S.Y.; Jia, M.; Lian, J.; Liu, G.D.; Wang, W.; Volker, S.; Feng, L.; Yao, X.S.; Wang, K.; et al. Research and application of in-seam seismic survey technology for disaster-causing potential geology anomalous body in coal seam. Acta Geol. Sin. 2019, 94, 10–26. (In English) [Google Scholar] [CrossRef]
  21. Buchanan, D.J.; Jackson, P.; Davis, D. Attenuation and anisotropy of channel waves in coal seams. Geophysics 1983, 48, 133–147. [Google Scholar] [CrossRef]
  22. Krey, T.; Arnetzb, H.; Knecht, M. Theoretical and practical aspect of absorption the application of in-seamse is miccoal exploration. Geophysics 1982, 47, 1645–1656. [Google Scholar] [CrossRef]
  23. Rader, D.; Schott, W.; Dresen, L.; Ruter, H. Calculation of dispersion curves and amplitude-depth distributions of Love channel waves in horizontally-layered media. Geophys. Prospect. 2010, 33, 800–816. [Google Scholar] [CrossRef]
  24. Feng, L.; Zhang, Y. Dispersion calculation method based on S-transform and coordinate rotation for Love channel waves with two components. Acta Geophys. 2017, 65, 757–764. [Google Scholar] [CrossRef]
  25. Wang, B.; Liu, S.D.; Zhou, F.B.; Hu, Z.A.; Huang, L.Y.; Jiang, Y.H. Dispersion characteristics of SH transmitted channel waves and comparative study of dispersion analysis methods. J. Comput. Theor. Nanosci. 2016, 13, 1468–1474. [Google Scholar] [CrossRef]
  26. Ji, G.Z.; Li, H.; Wei, J.C.; Yang, S.T. Preliminary study on wave field and dispersion characteristics of channel waves in VTI coal seam media. Acta Geophys. 2019, 67, 1379–1390. [Google Scholar] [CrossRef]
  27. Ge, M.; Wang, H.; Hardy, H.R.; Ramani, R. Void detection at an anthracite mine using an in-seam seismic method. Int. J. Coal Geol. 2008, 73, 201–212. [Google Scholar] [CrossRef]
  28. Arnold, B.; Robertson, C. Autoregressive logistic processes. J. Appl. Probab. 1989, 26, 524–531. [Google Scholar] [CrossRef]
  29. Pradhan, B.; Lee, S.; Mansor, S.; Buchroithner, M.; Jamaluddin, N.; Khujaimah, Z. Utilization of optical remote sensing data and geographic information system tools for regional landslide hazard analysis by using binomial logistic regression model. J. Appl. Remote Sens. 2008, 2, 023542. [Google Scholar]
  30. Wu, Y.H.; Wang, W.; Zhu, G.W.; Wang, P. Application of seismic multiattribute machine learning to determine coal strata thickness. J. Geophys. Eng. 2021, 18, 834–844. [Google Scholar] [CrossRef]
  31. Ke, B.; Pan, R.; Zhang, J.; Wang, W.; Hu, Y.; Lei, G.; Chi, X.; Ren, G.; You, Y. Parameter Optimization and Fragmentation Prediction of Fan-Shaped Deep Hole Blasting in Sanxin Gold and Copper Mine. Minerals 2022, 12, 788. [Google Scholar] [CrossRef]
  32. Wu, J.R. On a linearity between fractal dimension and order of fractional calculus in Hölder space. Appl. Math. Comput. 2020, 385, 1–11. [Google Scholar] [CrossRef]
  33. Wang, P.X.; Shi, H.; Yang, X.B.; Mi, J. Three-way k-means: Integrating k-means and three-way decision. Int. J. Mach. Learn. Cybern. 2019, 10, 2767–2777. [Google Scholar] [CrossRef]
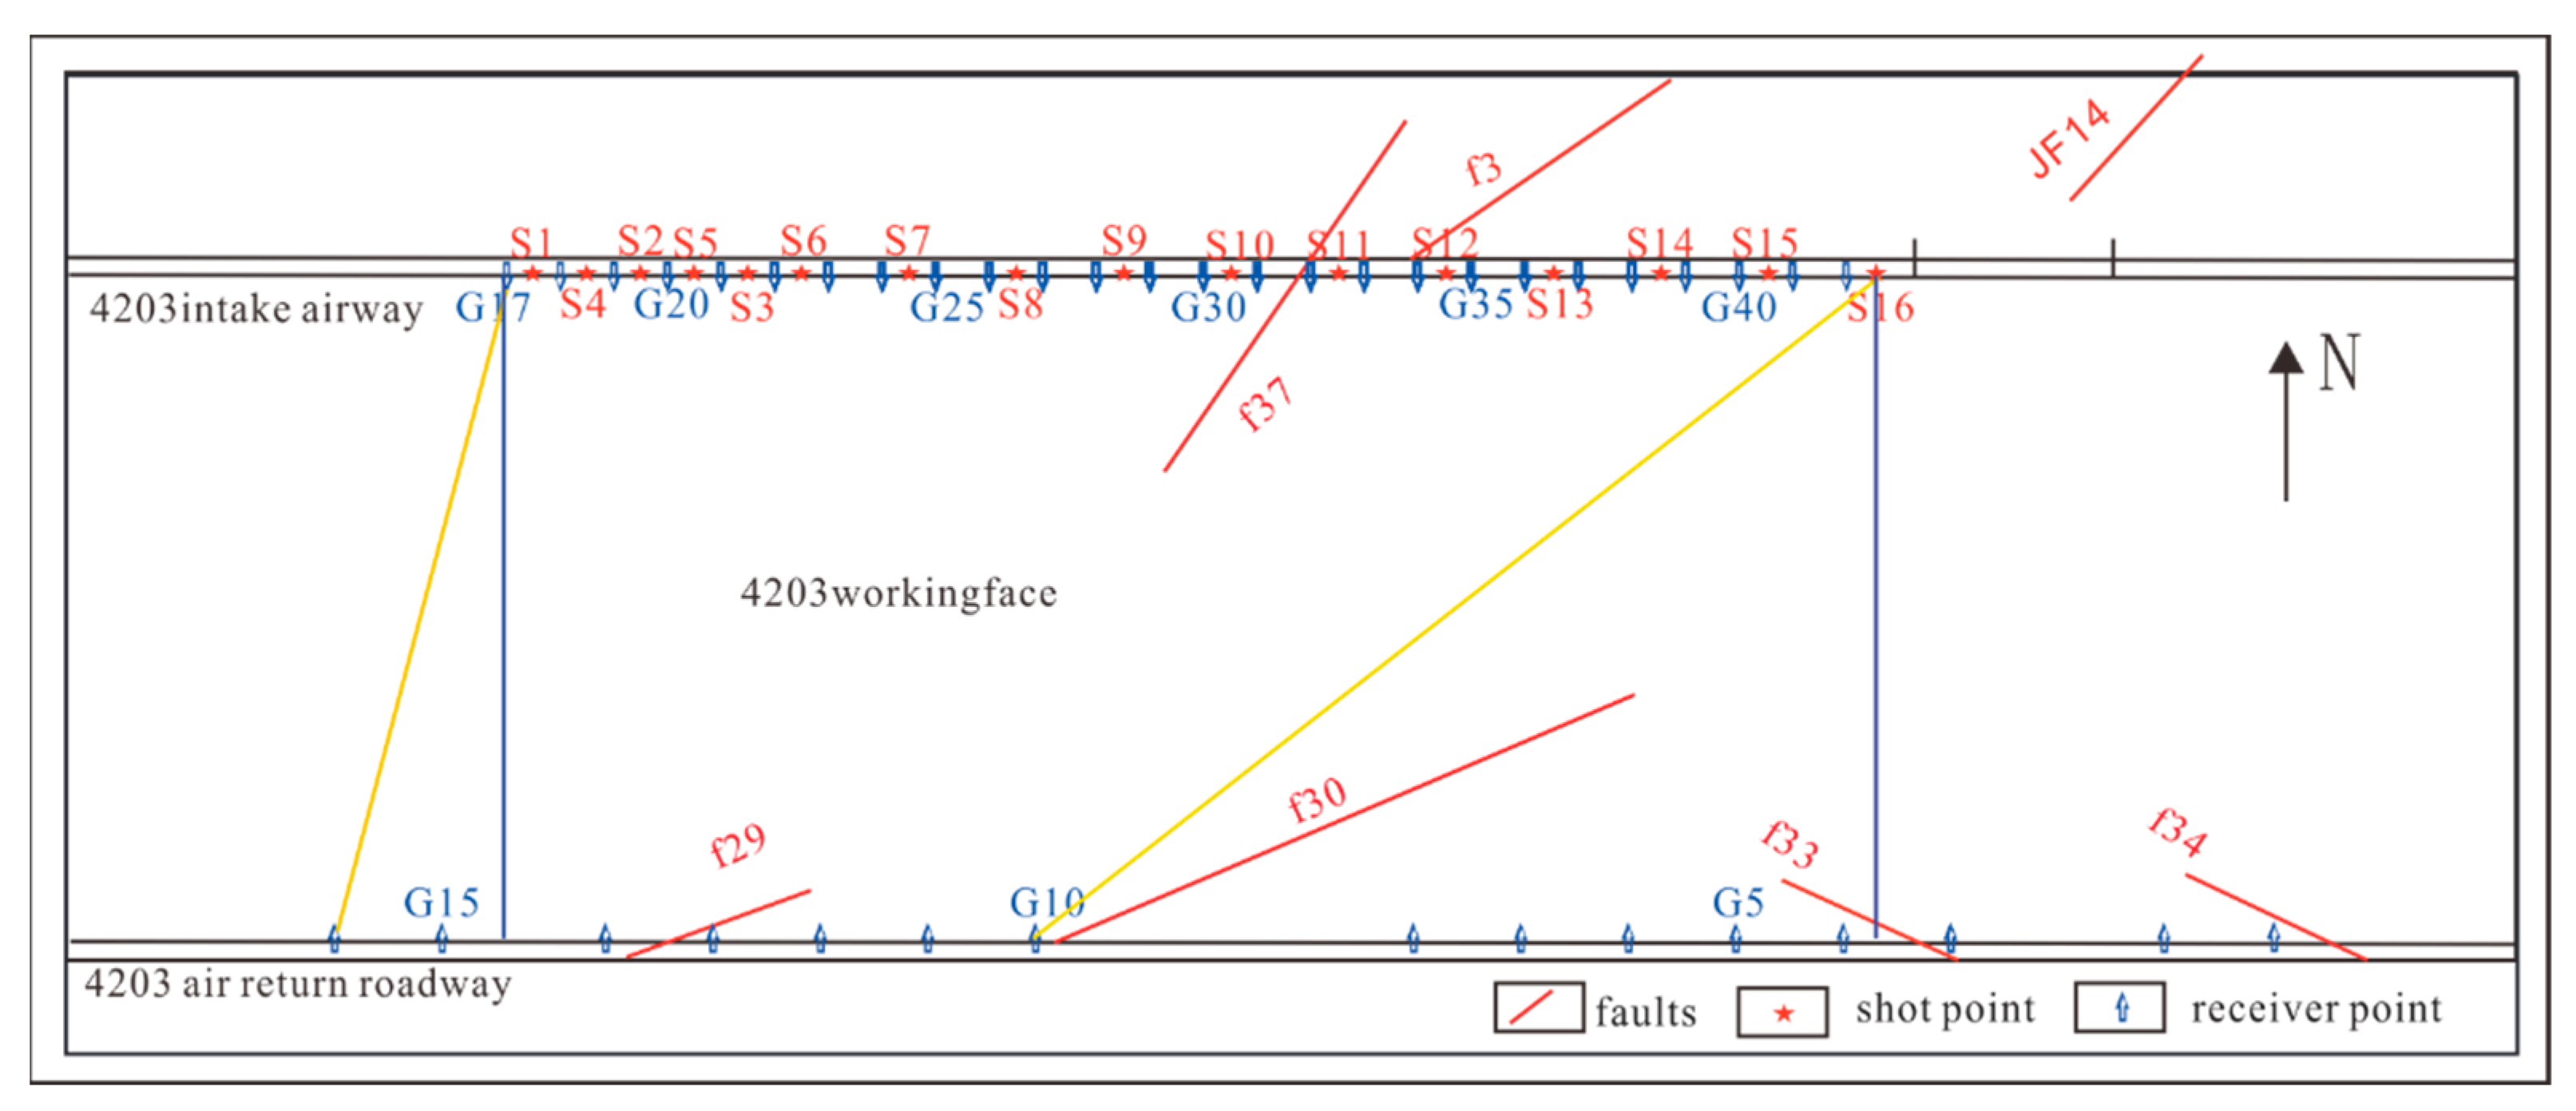
Figure 1. Arrangement diagram for a channel wave test performed on the 4203 working face.
Minerals 12 01022 g001
Figure 2. S7-16 seismic trace and dispersion map.
Minerals 12 01022 g002
Figure 3. Seismic reflection record for S7. The reflected wave groups is circled in red.
Minerals 12 01022 g003
Figure 4. Results of the elliptical tangent offset method.
Minerals 12 01022 g004
Figure 5. (a) S7 transmission record; (b) ray path.
Minerals 12 01022 g005
Figure 6. (a) S7-12 ray path; (b) S7-12 dispersion map for a known reflective fault surface.
Minerals 12 01022 g006
Figure 7. (a) S7-14 ray path; (b) S7-14 dispersion map for an unknown reflective fault surface.
Minerals 12 01022 g007
Figure 8. The ROC curve analysis.
Minerals 12 01022 g008
Figure 9. Calculated fractional dimensions. (a) Fractional dimension of S7-12; (b) fractional dimension of S7-16.
Minerals 12 01022 g009
Figure 10. (a) Fractional dimension matrix; (b) maximum throw point.
Minerals 12 01022 g010
Figure 11. Results for the transmission and reflection of the channel wave for the 4203 working face.
Minerals 12 01022 g011
Table 1. Prediction results of logistic regression and neural network.
Ray PathvminvmaxfminfmaxReal ValueLogistic Regression Predicted ValueNeural Network Predicted Value
S5-11920260072.682.8111
S5-121100260063120111
S5-13160027005969111
S5-14250040005795111
S6-12120025007696111
S6-131000250050112111
S6-141100260055113111
S7-13110026007898111
S7-141100230097104111
S8-131100160053171100
S8-141100250048168111
S9-14110022006883111
Publisher’s Note: MDPI stays neutral with regard to jurisdictional claims in published maps and institutional affiliations.