Article

Authigenic Gypsum Precipitation in the ARAON Mounds, East Siberian Sea

1
Department of Geology and Research Institute of Natural Science, Gyeongsang National University, Jinju 52828, Korea
2
Division of BAXS, Bruker Korea, Seongnam 13493, Korea
3
Marine Environment Research Division, National Institute of Fisheries Science, Busan 46083, Korea
*
Author to whom correspondence should be addressed.
Minerals 2022, 12(8), 983; https://doi.org/10.3390/min12080983
Submission received: 4 July 2022 / Revised: 20 July 2022 / Accepted: 30 July 2022 / Published: 2 August 2022
(This article belongs to the Special Issue Probe into Marine Sediment Provenance)

Abstract

:
Authigenic gypsum has been observed in marine methane hydrate-bearing sediments throughout the last decade. However, changes in mineral composition and gypsum precipitation in methane emission environments have not yet been reported in the Arctic. Expeditions aboard R/V ARAON revealed several mound structures described as active seeps, which were given the name ARAON Mounds (AMs). Core sediments from the AMs provide an excellent opportunity to research authigenic mineral production in the Arctic methane environment. We identified sedimentary units and investigated the mineral composition of gravity cores from the AMs and a background site. The background core ARA09C-St13, obtained between the mound structures, contains five sedimentary units that extend from the Chukchi Rise to Chukchi Basin, and core sediments from the AMs contain three sedimentary units in the same order. The fundamental difference between AMs and the background site is the lack of dolomite and abundance of gypsum in AMs. This gypsum precipitated authigenically in situ based on its morphological features. Precipitation was more closely associated with the absence of dolomite than the location of the sulfate–methane transition according to the vertical distribution of gypsum in the sediment. Chemical weathering and gypsum overgrowth were confirmed on dolomite surfaces recovered from the AMs, suggesting that dolomite dissolution is the primary source of Ca for gypsum precipitation. Dissolution of biological carbonates and ion exclusion may provide Ca for gypsum precipitation, but this mechanism appears to be secondary, as gypsum is present only in sedimentary units containing dolomite. The main sources of sulfate were inferred to be oxidation of H2S and disproportionation of sulfide, as no sulfide other than gypsum was observed. Our findings reveal that gypsum precipitation linked to methane emission in the Arctic Ocean occurs mainly in dolomite-rich sediments, suggesting that gypsum is a suitable proxy for identifying methane hydrate zones in the Arctic Ocean.

1. Introduction

Methane (CH4) seepage is a widely observed phenomenon worldwide and an important issue associated with global warming. Gas hydrates, an ice-like form of methane, are stable under high-pressure and low-temperature conditions, and the volume of carbon contained in methane hydrates worldwide is estimated to be twice the amount contained in all fossil fuels on Earth, including coal [1]. The Arctic Ocean is the smallest of the world’s oceans, but a recent assessment of carbon stored in the Arctic indicated a mass of 1000–2000 Pg (Pg = 1012 kg) [2]. Methane release in the Arctic Ocean occurs principally due to the degradation of submarine permafrost containing perennially frozen methane produced through microbial or thermogenic pathways [3,4,5]. Methane-related phenomena, such as bottom-simulating reflections, gas seepage, high concentrations of methane in sediments, seawater, and at the sea surface; and the presence of gas hydrates or methane-derived authigenic carbonate (MDAC), have been reported in marginal Arctic seas [5,6,7,8]. However, information on the central Arctic Ocean remains fragmentary because harsh sea ice conditions impede data collection.
Gypsum (CaSO4∙2H2O) is commonly found in sedimentary and evaporitic environments as an evaporite mineral and is also an authigenic mineral in marine sediment associated with methane seepage. Although the relationship between methane seepage and mineral composition remains unclear, recent studies have shown that gypsum is present in marine methane hydrate environments, such as the South China Sea, the Bay of Bengal, the southwest African Margin, and the eastern North Pacific Ocean [9,10,11,12,13,14,15,16,17]. Such gypsum deposits have been hypothesized to form authigenically. The most common formation mechanisms for authigenic gypsum include the oxidation of sulfides, action of sulfuric acid solutions on calcium-bearing rocks, and hydration of anhydrite [18]. Some studies have reported the occurrence of pyrite and authigenic gypsum in gas hydrate-bearing sediments and proposed that authigenic gypsum precipitated near the sulfate–methane transition (SMT) where porewater sulfate arises from the mixing of residual seawater sulfate with sulfate derived from pyrite oxidation [11,14,16,17]. However, the mechanism of gypsum precipitation and its relationship with methane emission remain unclear. Moreover, methane emissions, mineral composition, and the formation of authigenic gypsum have not been documented, despite great interest in methane emissions in the Arctic Ocean.
The ARA07C expedition aboard the R/V ARAON in 2016 discovered a mound structure at a depth of approximately 600 m on the inner slope of the Chukchi Rise, as well as gas hydrates at the bottom of the sediment core (Figure 1) [19]. Subsequently, the ARA09C expedition in 2018 observed additional mound structures at water depths between 568 and 704 m in sub-bottom profiler (SBP) images [20]. These mounds were named ARAON Mounds (AMs) 01–08 (AM01–AM08, respectively, from northwest to southeast); they are approximately 10 m higher than the surrounding seafloor and 200–700 m wide and are characterized by an acoustic blanking zone (as evident in the SBP image) that provides indirect evidence of gas hydrate and methane seepage [5,21,22].
In this study, we report the first discovery of authigenic gypsum associated with methane seepage from the AMs. Core sediments acquired from the AMs provided an excellent opportunity to study the formation of authigenic minerals in Arctic Ocean methane seepage systems. We classified the sedimentary units of the AMs through comparison with a background site; the analysis of mineral composition indicated changes related to the methane emission environment. We discuss gypsum precipitation based on observations of mineral particles with consideration of the surrounding environment. The findings clarify the precipitation of authigenic gypsum in association with methane emissions in the Arctic Ocean.
Figure 1. (A) Schematic map showing the location of ARAON mounds (red square) in the present study and sediment core ARA09C-St03 [23] used for comparison. The circulation paths (arrow) are modified from Darby and Bischof [24] and Kobayashi et al. [25]. BG: Beaufort Gyre. ESCC: East Siberian Coastal Current. (B) Sub-bottom profiling image for the ARAON Mounds (AMs) and the pictures for the gas hydrate samples acquired by gravity coring for the sea mound structures modified from Jin and Onboard ship scientific party [20].
Minerals 12 00983 g001

2. Materials and Methods

Two gravity cores were collected from the AMs during the Arctic Expedition (ARA09C, 2018) using R/V ARAON. Core ARA09C-St07 was acquired at site AM01 and core ARA09C-St04 was acquired at AM06 (Figure 1). In addition, one gravity core was collected at site ARA09C-St13 between the AM06 and AM07; this was designated as the background site, wherein no mound structure was observed in SBP images (Figure 1). The length of all gravity cores was less than 6 m (Table 1). The recovered cores were sealed to keep out air and stored at approximately 4℃ in the shipboard and onshore laboratories until subsampling for further analysis. The subsamples were analyzed as soon as possible to prevent sulfate production in an oxidizing environment. The SBP survey on the R/V ARAON used a hull-mounted transmitter/receiver operating as an integrated system (SBP120). The SBP120 used a frequency of 2.5–7 kHz and a beam angle of 12°. The observation results are recorded in a conventional electronic format that can be post-processed for better images. Further details can be found in the work by Kim et al. [21] and Kang et al. [22].
For bulk mineralogy, subsamples were dried and crushed using a ball mill, and a 4-g aliquot was then taken from the homogenized material. An X-ray diffraction (XRD) analysis was performed using the D8 Advanced A25/Bruker instrument at the Department of Geology of Gyeongsang National University, and the analysis conditions were set to 40 kV/40 mA, with a step size of 0.02°2θ in the range of 4–70°2θ and a counting time of 0.4 s per step. Quantitative analysis of bulk minerals was performed using TOPAS software. The weighted profile R-factor (Rwp) was limited to ≤20, and the goodness of fit (GOF) to ≤3, to ensure adequate reliability. Clay mineral compositions were obtained via a semi-quantitative analysis of oriented samples separated into <2-μm particles. Organic matter was removed from the bulk sediment using a 6% hydrogen peroxide (H2O2) solution. After sieving through a 63-μm mesh, the clay particles were extracted using a settling technique based on Stokes’ Law. To optimize the orientation of the specimens for XRD analyses, lumps of clay were smeared onto glass slides to minimize the grain size effect. To identify each clay mineral, oriented samples were taken from both air-dried and ethylene glycol (EG)-treated samples. The relative abundances of four major clay minerals—illite, smectite, kaolinite, and chlorite—were estimated using a semi-quantitative analysis method [23,26,27], which involved weighting of the integrated peak areas of characteristic basal reflections in the glycolated state using Eva 3.0 software with an empirical factor.
The sand proportion of each sample (>64 μm) was calculated as a weight ratio using the weight of particles separated through sieving from 4 g of dried subsamples. Ice-rafted debris (IRD) particles (>250 μm) were counted after separation using a 250-μm mesh sieve. Gypsum and dolomite grains were analyzed in terms of morphology and chemical composition using a field-emission electron probe micro-analyzer (FE-EPMA; JXA-8530F PLUS; JEOL) at the Gyeongsang National University Center of Research Facilities. Energy-dispersive spectroscopy (EDS) patterns and backscatter electron (BSE) images were obtained under the conditions of 15 keV and 10 nA, with a beam diameter of 5–10 μm. Dissolved sulfide (H2S) was determined according to the methylene blue method [28]. Standard curves were calibrated using sulfide standards (0, 5, 10, 15, 20, 25, 30, and 35 μM). The analytical precision was less than ±0.4% and the detection limit was 3 μM.

3. Results

Sedimentary Units at the Background Site and ARAON Mounds

The background core ARA09C-St13 was composed of sandy to fine-grained mud with a cyclic depositional pattern characterized by alternating brown to grayish sediment units (Figure 2). Two dark brown layers (B1 and B2) were identified at the core top and the 360–367 cm interval. Sand (maximum proportion = 16.3%) was abundant in the brownish and dark gray layers (Figure 2). The mineral assemblage was mainly composed of quartz, plagioclase, alkali feldspar, mica, dolomite, and clay minerals, along with minor minerals, such as pyroxene, amphibole, and Fe-oxide minerals (hematite, magnetite, and maghemite) (Table 2 and Table 3). Quartz, the most abundant mineral in the sediment, had an average content of 25.6% (range: 19.2%–46.0%) (Figure 3). Plagioclase and alkali feldspar had average contents of 12.6% (5.7%–17.5%) and 4.2% (2.6%–7.8%), respectively. Dolomite had a content of up to 10.0% and was particularly abundant in the pink–white layer. The four major clay minerals were dominated by illite (65.4%), chlorite (18.2%), kaolinite (13.6%), and smectite (2.9%).
The two mound cores are composed of brown, olive, and gray colored sediments (Figure 2). They are darker overall than the background core, but one conspicuous brown layer (B1) was identified at the top of both cores. The sand content varies between 2.3% and 10.8% in AM01, and 2.5% and 18.6% in AM06 (Figure 2). The mineral assemblages in the mound cores consist mainly of quartz, plagioclase, alkali feldspar, mica, dolomite, gypsum, and clay minerals, along with minor minerals (Table 2 and Table 3). The proportions of the major minerals in AM01 are as follows: quartz, 19.4%–44.1%; plagioclase, 6.0%–16.3%; alkali feldspar, 2.7%–12.3%; dolomite, 0.1%–5.7%; and gypsum, 0.2%–6.3% (Figure 3). The levels of each major mineral in AM06 are as follows: quartz, 20.4%–44.2%; plagioclase, 5.1%–16.9%; alkali feldspar, 2.6%–7.3%; dolomite, 0.1%–10.4%; and gypsum, 0.2%–5.5%. The major difference in the mineral composition between the AMs and background site lies in the contents of dolomite and gypsum.
The morphology of the gypsum crystals was observed using microscopy and field-emission scanning electron microscopy (FE-SEM) and confirmed through EDS analysis (Figure 4 and Table 4). Gypsum is transparent and has a variety of crystal forms, including rhombic, tabular, acicular, fibrous, and cluster (Figure 4). The Gypsum has a clear crystal surface, edges, regular intergrowths, and perfect cleavage, indicating that it formed authigenically without transportation from adjacent continental areas. The two main crystal forms present are rhombic and fiber rosette clusters. The lengths of the two main types of gypsum crystals collected from AM06 were measured using SEM images (Table 4). In the rhombic gypsum, the average length of the major axis is 912 μm (range: 36–2596 μm) and that of the minor axis is 477 μm (20–1428 μm). The ratio of the major axis to the minor axis ranges from 1.5 to 2.5, with an average of 1.9. In the fiber rosette gypsum, the average length of the major axis is 138 um (32–360 μm) and that of the minor axis is 10 μm (1–46 μm). The ratio of the major axis to the minor axis ranges from 3.4 to 202, with an average of 17.2. The morphological properties of the gypsum are generally constant with sediment depth. The chemical compositions of the two main types of gypsum are presented in Table 4. In the rhombic form, the average content of CaO is 39.8% (range: 35.4%–45.8%) and that of SO3 is 59.8% (54.2%–61.6%). The calculated Ca/S ratio ranged from 0.89 to 1.20, with an average of 0.95. In the fiber rosette gypsum, the average CaO content is 40.9% (range: 32.0%–49.7%) and that of SO3 is 59.0% (50.3%–61.9%). The Ca/S ratio ranged from 0.76 to 1.41, with an average of 0.99. While the fiber rosette has a slightly higher Ca/S ratio than the rhombic form, the chemical composition is not correlated with sediment depth. These results confirm that the minerals present are typical gypsums with domain chemical compositions of Ca and S at an atomic ratio near unity.

4. Discussion

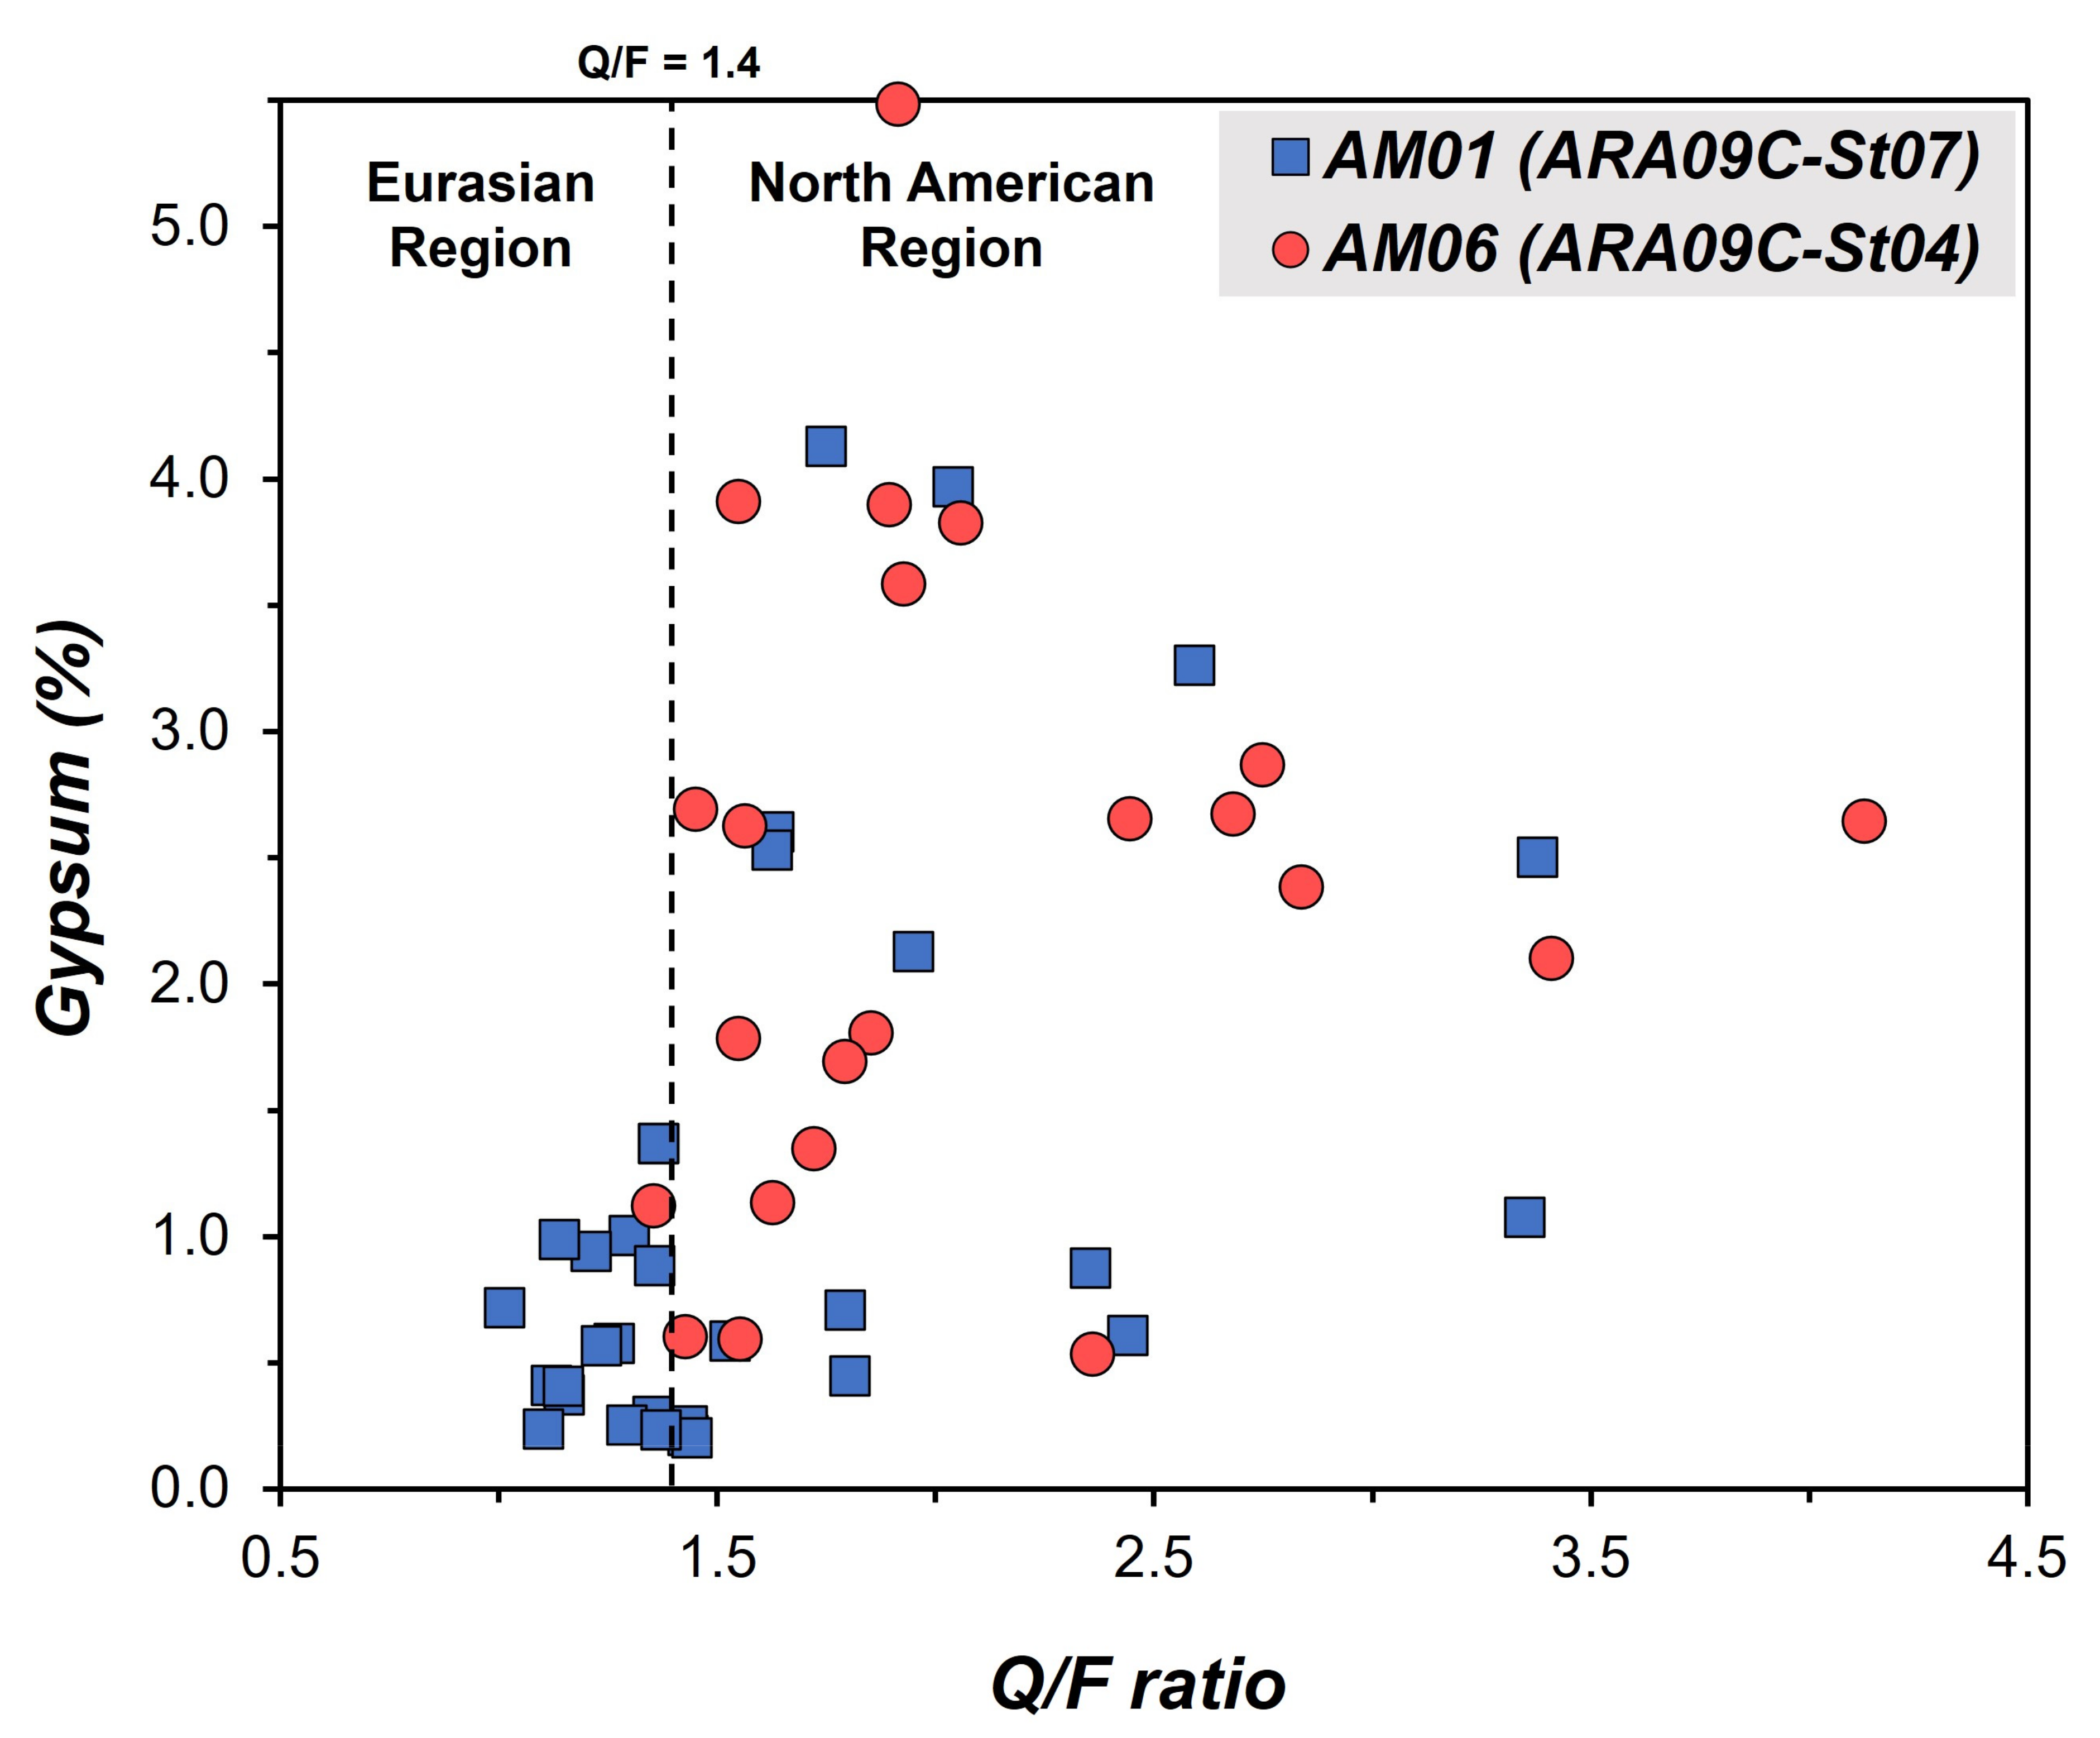
4.1. Sedimentary Units and Sediment Provenances at the Background Site and ARAON Mounds

Marine sediments in the Arctic Ocean have been studied for the reconstruction of sedimentary environments using lithological, geochemical, and mineralogical techniques, which show the correlation between the chronology of core sediments and sediment properties [23,29,30,31,32,33,34,35,36]. Core sediments in the Arctic Ocean exhibit repeated cycles of brown and gray units with interbedded IRD-rich layers [36,37,38,39]. Brown units are generally considered to reflect interglacial/interstadial periods with high primary productivity, while grayish units reflect the substantial reduction of biomass associated with glacial/stadial environments [37,39]. In addition, IRD-rich layers are considered features of the deglacial period, as they are driven by freely circulating sea ice and icebergs [29,36]. The background core ARA09C-St13 was collected on the slope between the Chukchi Rise and Chukchi Basin, and the sedimentary unit is classified through lithological correlation with core ARA09C-St03 [23] (Figure 1 and Figure 2). Based on lithological factors, such as sediment color and IRD (or sand) content, core ARA09C-St13 was divided into five sedimentary units within two brown–gray color cycles (Figure 2). The separated sedimentary units have the same order and characteristics as those of core ARA09C-St03. Unit 1 (top to 43 cm) is brownish sediment, including a surficial dark brown layer (B1) that contains a moderate amount of sand and shows signs of bioturbation. Unit 2 (43–180 cm) is dark gray with significant sand content, and Unit 3 (180–330 cm) is gray to yellowish-gray fine-grained mud. Unit 4 (330–392 cm) contains the B2 and PW layers and is characterized by brownish sediment and relatively high sand content. Unit 5 (392 cm to bottom) is olive to gray fine-grained mud (Figure 2).
As the landmasses surrounding the Arctic Ocean are composed of different geological terrains, their mineralogical signals are distinct [29,37]. The major potential sediment provenances in the study area are the North American (e.g., Canadian Archipelago, Beaufort Sea, and North American continent) and Eurasian regions (e.g., Chukchi Sea, East Siberian Sea, Laptev Sea, and Eurasian continent) [23,29,36,37,40]. Sediments originating from the North American region are characterized based on the combination of dolomite content and Q/F (quartz/feldspar) and K/C (kaolinite/chlorite) ratios, whereas sediments from the Eurasian region are rich in illite (Table 2 and Table 3). The high illite content observed throughout the core sediment indicates that the sediment was mainly sourced from the adjacent Eurasian region (Table 3). In particular, the gray mud layers (units 3 and 5) are rich in illite without dolomite, indicating that these sediments are sourced entirely from the Eurasian region (Figure 3). However, positive signals for dolomite and appropriate Q/F and K/C ratios were identified in unit 2, indicating a significant supply of detrital sediments from the North American region (Figure 3). In addition, some dolomite content of brown layers (units 1 and 4) likely indicates the input of sediments from the North American region. Abundant IRD in these units suggests supply through sea ice or icebergs transported from the North American region (Figure 2) [36,41]. Sediment provenance at the background site is consistent with the results of core ARA09C-St03 and reflects a sediment environment undisturbed by methane seepage [23].
Mound cores were compared with the background core, and the results represent the changes in sedimentary properties caused by methane emission. The mound cores were divided into three units corresponding to the sedimentary units of the background site, despite the acoustic blanking observed in the SBP image (Figure 1 and Figure 2). Unit 1 (top to 60 cm in AM01; top to 53 cm in AM06) contains brown and dark gray layers (Figure 2). This unit exhibits dramatic color changes relative to the background site but can be distinguished based on the sand content and mineral ratios. Unit 2 (60–240 cm in AM01; 53–200 cm in AM06) consists mainly of IRD-rich olive to greenish-gray sediments and represents a massive structure. Unit 3 (240 cm to bottom in AM01; 200 cm to bottom in AM06) is a gray layer distributed below the IRD-rich layer that consists of the finest sediments. Each unit in the AMs is somewhat thicker than at the background site, likely due to vertical expansion [21]. The vertical variations of the Q/F and K/C ratios are the same as those at the background site, indicating a common sediment provenance. However, dolomite is present at very low levels, or is completely absent throughout the AM cores, indicating the dissolution of dolomite (Figure 3).
The formations of these MDACs at cold seeps are common processes; depending on the specific geochemical formation conditions, different authigenic carbonates (calcite, Mg-calcite, aragonite, proto-dolomite, and dolomite) are precipitated [42,43]. The presence of MDAC at the AMs has been reported [5,21]. These MDACs consist of grayish-white fragments smaller than 10 cm, but their detailed compositions have not yet been reported. However, our results suggest the possibility that these carbonates may not be MDACs, but rather residual detrital carbonates sourced from the North American region. Such large fragments are often found as IRD carried by icebergs [29,37,41]. In the methane environment where IRD from the North American Region can be supplied, carbonates require further analysis to determine whether they are authigenic or detrital.

4.2. Methane Hydrate Evolution and Authigenic Gypsum

Mound structures, also known as pingos, are frequently identified in geophysical investigations of gas hydrate regions, and vertical acoustic blanking below mounds is often identified in seismic and SBP data and interpreted as gas chimneys [21,44,45,46]. Acoustic blanking below the AMs indicates gas-filled sediments and gas hydrates at the bottom of the sediment core, thus providing strong evidence for the presence of a methane-rich fluid below [21,22].
The location of the SMT could provide a favorable environment for gypsum precipitation. Previous studies reported that authigenic gypsum precipitates with pyrite near the SMT [11,14,16,17]. Methane collected from the AMs was classified as thermogenic in origin, and the high upward gas fluxes in this area result in a very shallow SMT (AM01, approximately 3.3 m; AM06, approximately 1.2 m) (Figure 3 and Table 1) [5]. However, the SMT in the background area might be much deeper than the depth of the gravity core [5]. Organic matter in marine systems is generally decomposed through particulate organic matter sulfate reduction (POCSR; 2CH2O + SO42− → 2HCO3 + H2S) above the SMT, and through methanogenesis via acetate fermentation or CO2 reduction below the SMT [47]. Near the SMT, organic matter may be degraded through anaerobic oxidation of methane (AOM; CH4 + SO42− → HCO3 + HS + H2O) [47]. These processes lead to high H2S concentrations in the AMs and can be used to verify the location of the SMT (Figure 3 and Table S3).
The major mineralogical differences in the AMs compared to the background site are the presence of gypsum and the absence of dolomite (Figure 3). The morphological characteristics of gypsum crystals in the AMs are consistent with an authigenic origin (Figure 4). In the SEM images, all gypsum crystals in the study core are euhedral with large diameters (i.e., hundreds of microns) and smooth surfaces that show no signs of cleavage or abrasion, suggesting in situ formation in a burial setting [48]. The morphological characteristics and chemical compositions of the gypsum were generally constant with sediment depth, suggesting that all gypsums may have been formed through the same mechanism. Differences in crystal morphology, such as rhombic and fibrous gypsum forms (Figure 4), may be related to differences in the precipitation rate [14,49,50]. Plate-form gypsum is thought to form in an intermediate step between the fibrous and rhombic morphologies during the growth process.
Gypsum is present from the core top to approximately 240 cm in AM0,1 and from approximately 30 to 180 cm in AM06 (Figure 3). These intervals correspond to sedimentary units 1 and 2, and lack dolomite. In contrast, the gypsum content in unit 3 is very low, indicating that the distribution of gypsum is associated with the sedimentary units. This result is unexpected because the production of authigenic gypsum generally occurs near the upper part of the SMT [11,14,16,17]. Figure 5 shows the correlation between the Q/F ratio, indicating inflow intensity from the North American region, and gypsum content. The Q/F ratio on the horizontal axis distinguishes the provenance of detrital sediments. A high Q/F ratio (>1.4) represents the North American origin [29] and could also indicate the extent of dolomite import from the North American region. A positive correlation between the Q/F ratio and gypsum content indicates that dolomite influences the formation of gypsum in sediments originating from the North American region (Figure 5). Therefore, the gypsum distribution in the study area is likely associated with dolomite-rich units rather than the location of the SMT.
The surface texture of mineral particles provides information about the formation and transport thereof. The surface textures of dolomite obtained from the AMs and background site clearly differ (Figure 6). Dolomite at the background site has sharp edges characteristic of detrital grains (Figure 6a). On the other hand, dolomite in the AMs has blunt edges and many small holes, which suggests chemical weathering (Figure 6b). We also identified gypsum overgrowth on the surface of dolomite (Figure 6c), which provides strong evidence that dolomite is associated with gypsum formation in the AM.

4.3. Possible Sources of Sulfate and Calcium for Gypsum Precipitation

Several sources may supply SO42− and Ca2+ ions for gypsum precipitation in modern marine environments. As seawater is undersaturated with gypsum, a mechanism for increasing the saturation of sediment porewater is required [10,14]. Oxidation of sedimentary sulfide minerals (FeS2 + H2O + 3.5O2 → Fe2+ + 2SO42− + 2H+, [51]) and anaerobic re-oxidation of authigenic sulfides (FeS2 + 7.5MnO2 + 11H+ → Fe(OH)3 + 2SO42− + 7.5Mn2+ + 4H2O, [52]) are possible sources of elevated SO42− concentrations in interstitial waters. Many studies have explained the precipitation of gypsum through anaerobic reoxidation of pyrite [14,17]. In the South China Sea, some gypsum grows on pyrite, indicating that gypsum precipitation occurs after pyrite formation [16]. However, pyrite was not detected in cores from the AMs and background site in this study. The oxidation of sedimentary sulfide minerals is difficult to assess, as sulfide minerals have not been found at the background site. Similarly, the absence of sulfide minerals in the AMs complicates the assessment of anaerobic reoxidation.
Another possible source of SO42− is disproportionation reactions of sulfide oxidation intermediates (4S0 + 4H2O → 3H2S + SO42− + 2H+, [53]). This process can contribute significantly to porewater SO42− concentrations in anoxic environments [54,55,56,57]. Some sulfate within authigenic gypsum at active methane seeps of the southwest African Margin, for example, was generated via the oxidation of sulfide, as demonstrated through isotopic investigation [15]. Although we were unable to verify this result due to insufficient samples for isotopic analysis, the disproportionation of sulfide and oxidation of H2S (H2S + 2O2 → SO42− + 2H+) generated through POCSR and AOM is likely the main source of sulfate for gypsum precipitation in the AMs (Figure 7). This process requires verification through additional sample acquisition and isotopic analysis.
Increased porewater Ca concentrations enhance authigenic gypsum crystal precipitation. The dissolution of detrital dolomite is the most obvious Ca source in the study area (Figure 6c). Oxidation of H2S can strongly enhance the production of H+, leading to porewater acidification and the dissolution of carbonate. The dissolution of biological carbonates may also provide Ca through a similar process [58]. Although the accumulation of biological carbonates in the Arctic Ocean is a gradual process, it may serve as a Ca source for gypsum precipitation [10,11,14,56]. Another possible Ca source is ion exclusion. This process, in which ions such as chloride and calcium are excluded from the gas hydrate structure, can affect gypsum precipitation by increasing porewater salinity in sediments containing large amounts of interstitial gas hydrates [59]. This mechanism has been reported in Hydrate Ridge (Oregon Margin) and the northern South China Sea [13,14]. As gas hydrates are present in the AMs, this mechanism could provide a favorable environment for gypsum precipitation. However, these processes may be secondary, as gypsum was found only in sedimentary units containing dolomite in this study (Figure 7).
Authigenic gypsum has been proposed as a proxy for SMT and methane hydrate zones in modern and ancient marine methane hydrate systems [14]. This study represents the first report of gypsum precipitation in the Arctic Ocean and demonstrates the potential of gypsum as a proxy in the Arctic methane hydrate environment. Our results show that this mechanism occurs only in dolomite-rich sediments in the Arctic Ocean. However, as extensive dolomite-rich layers are present in the western Arctic Ocean, our findings suggest that gypsum could be a useful proxy for SMT and methane hydrate zones in this region.

5. Conclusions

In this study, we identified the sedimentary units and analyzed the mineral composition of gravity cores from the AMs and a background site in the East Siberian Sea. Assessing the distribution and morphology of gypsum and dolomite in light of the surrounding fluid environment facilitated the description of the formation mechanism of authigenic gypsum and its relationship with the methane emission system. The main conclusions are as follows:
(1)
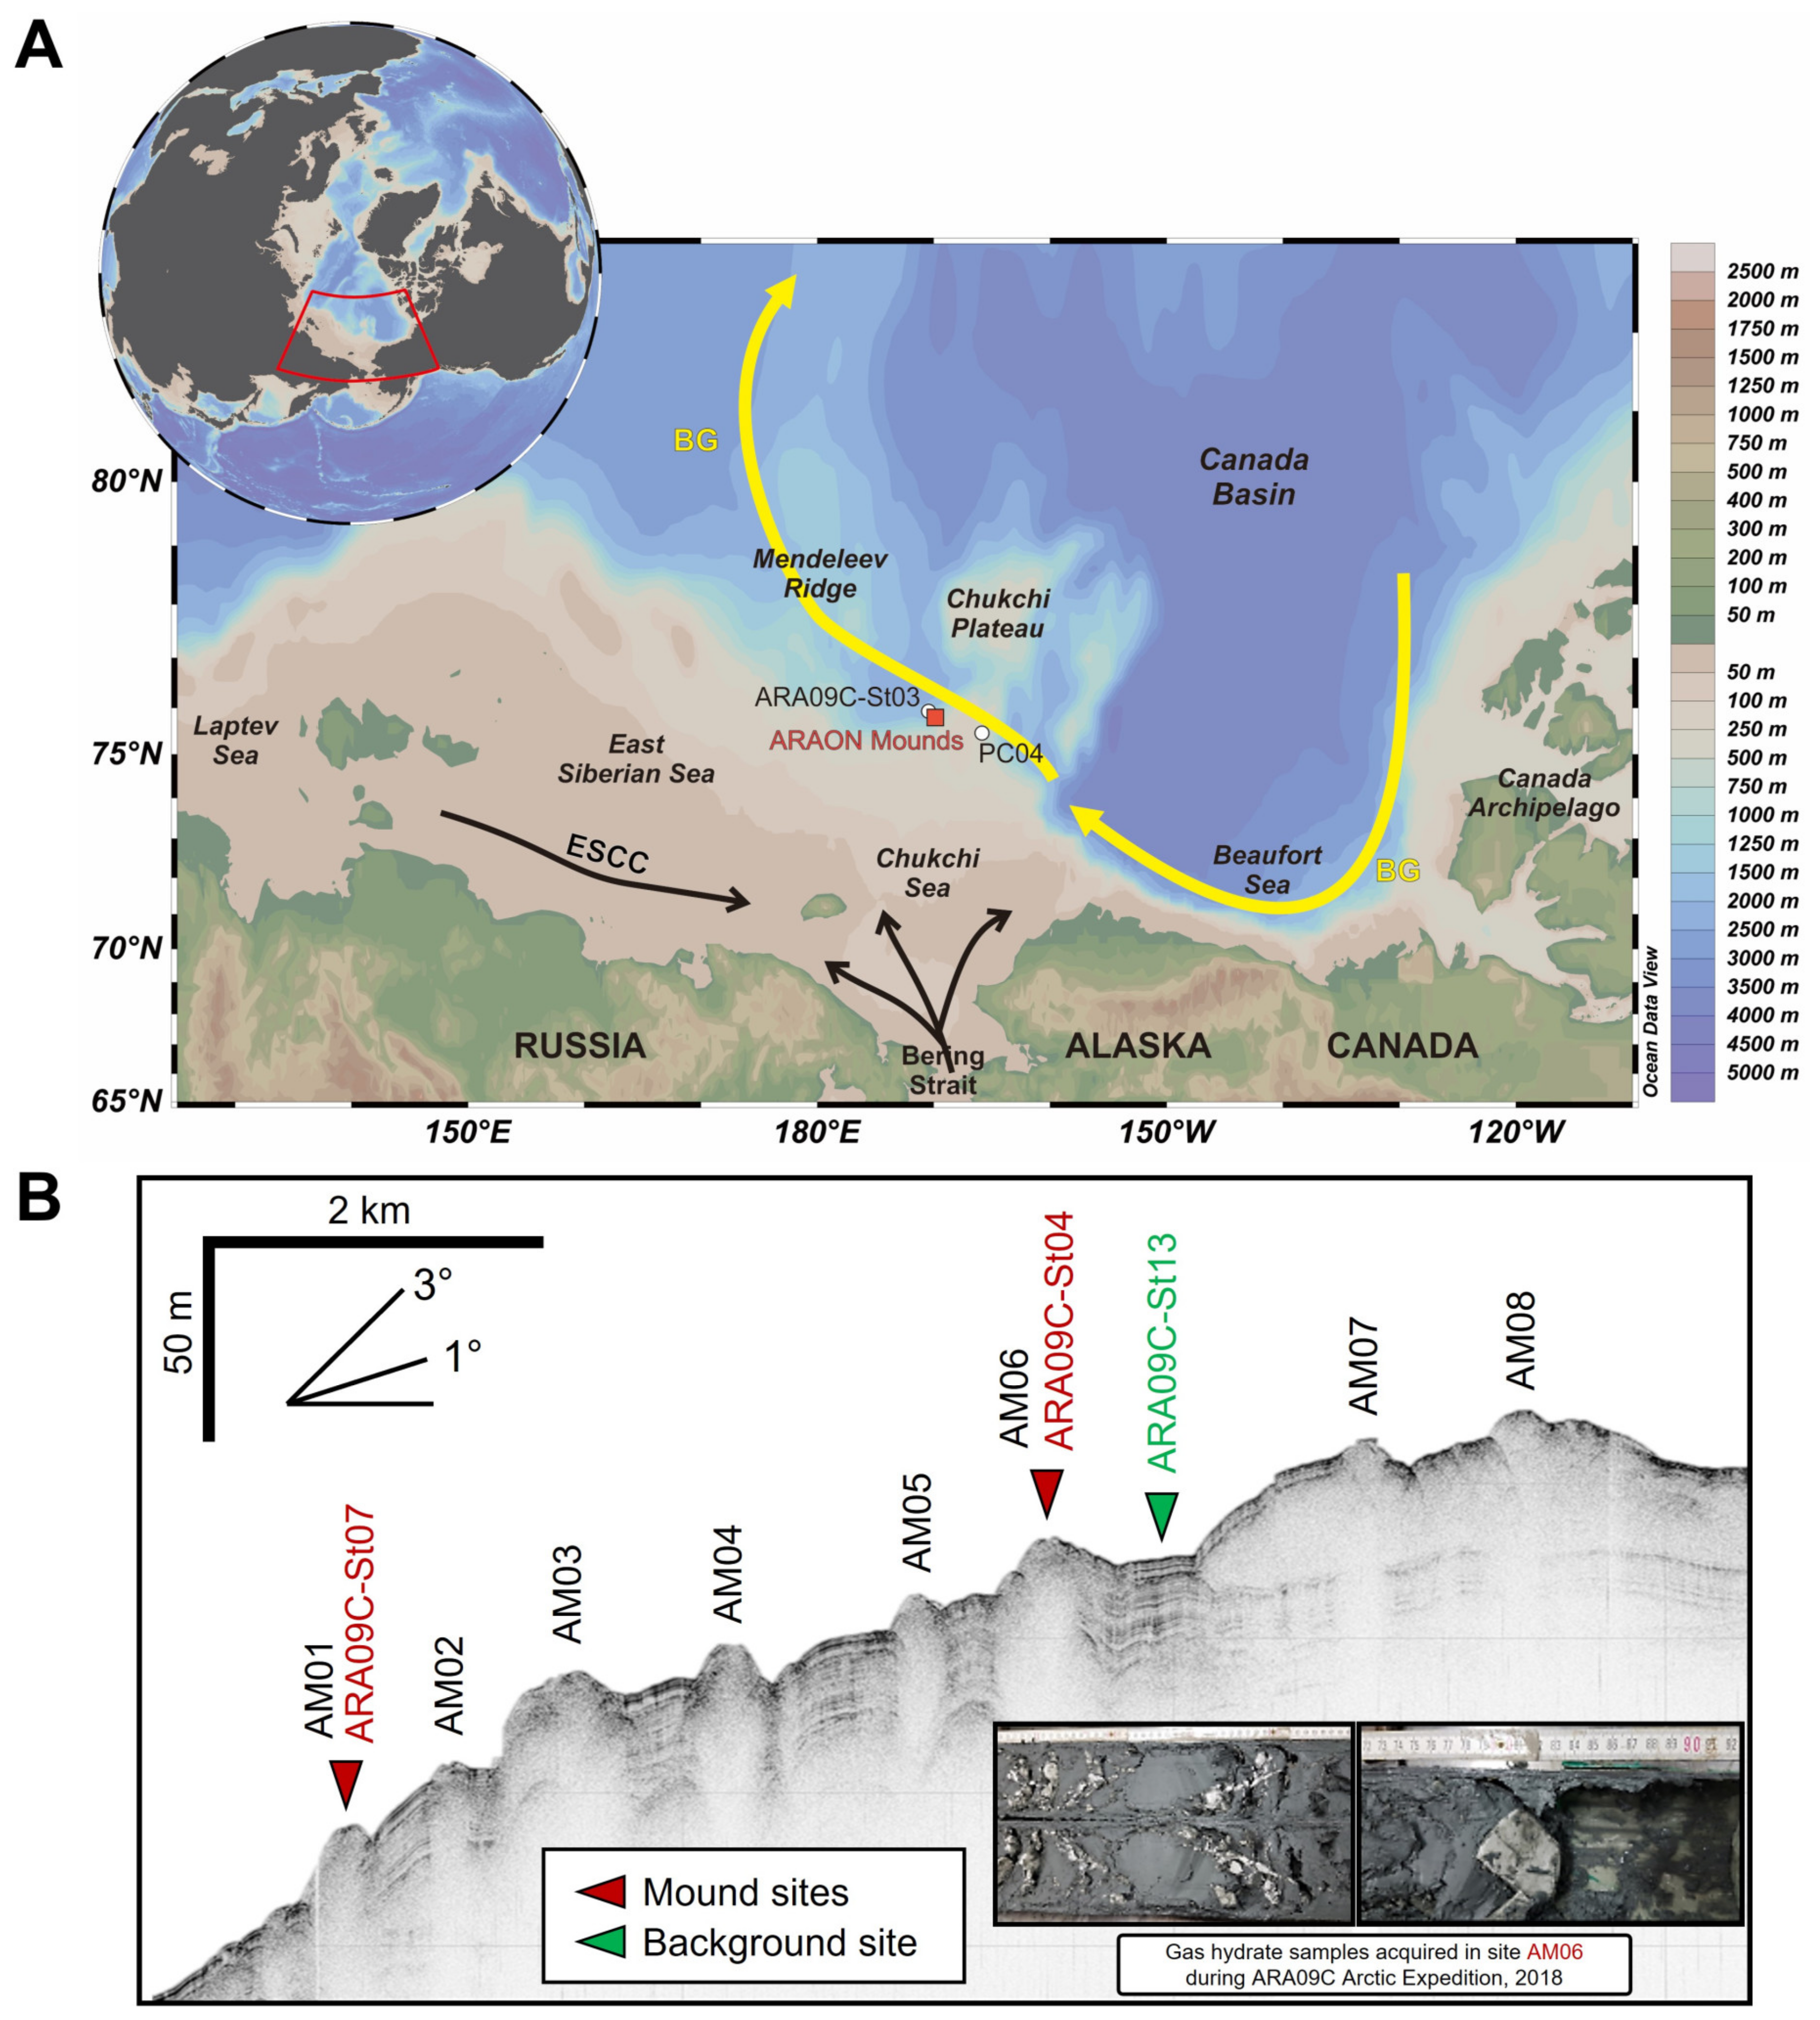
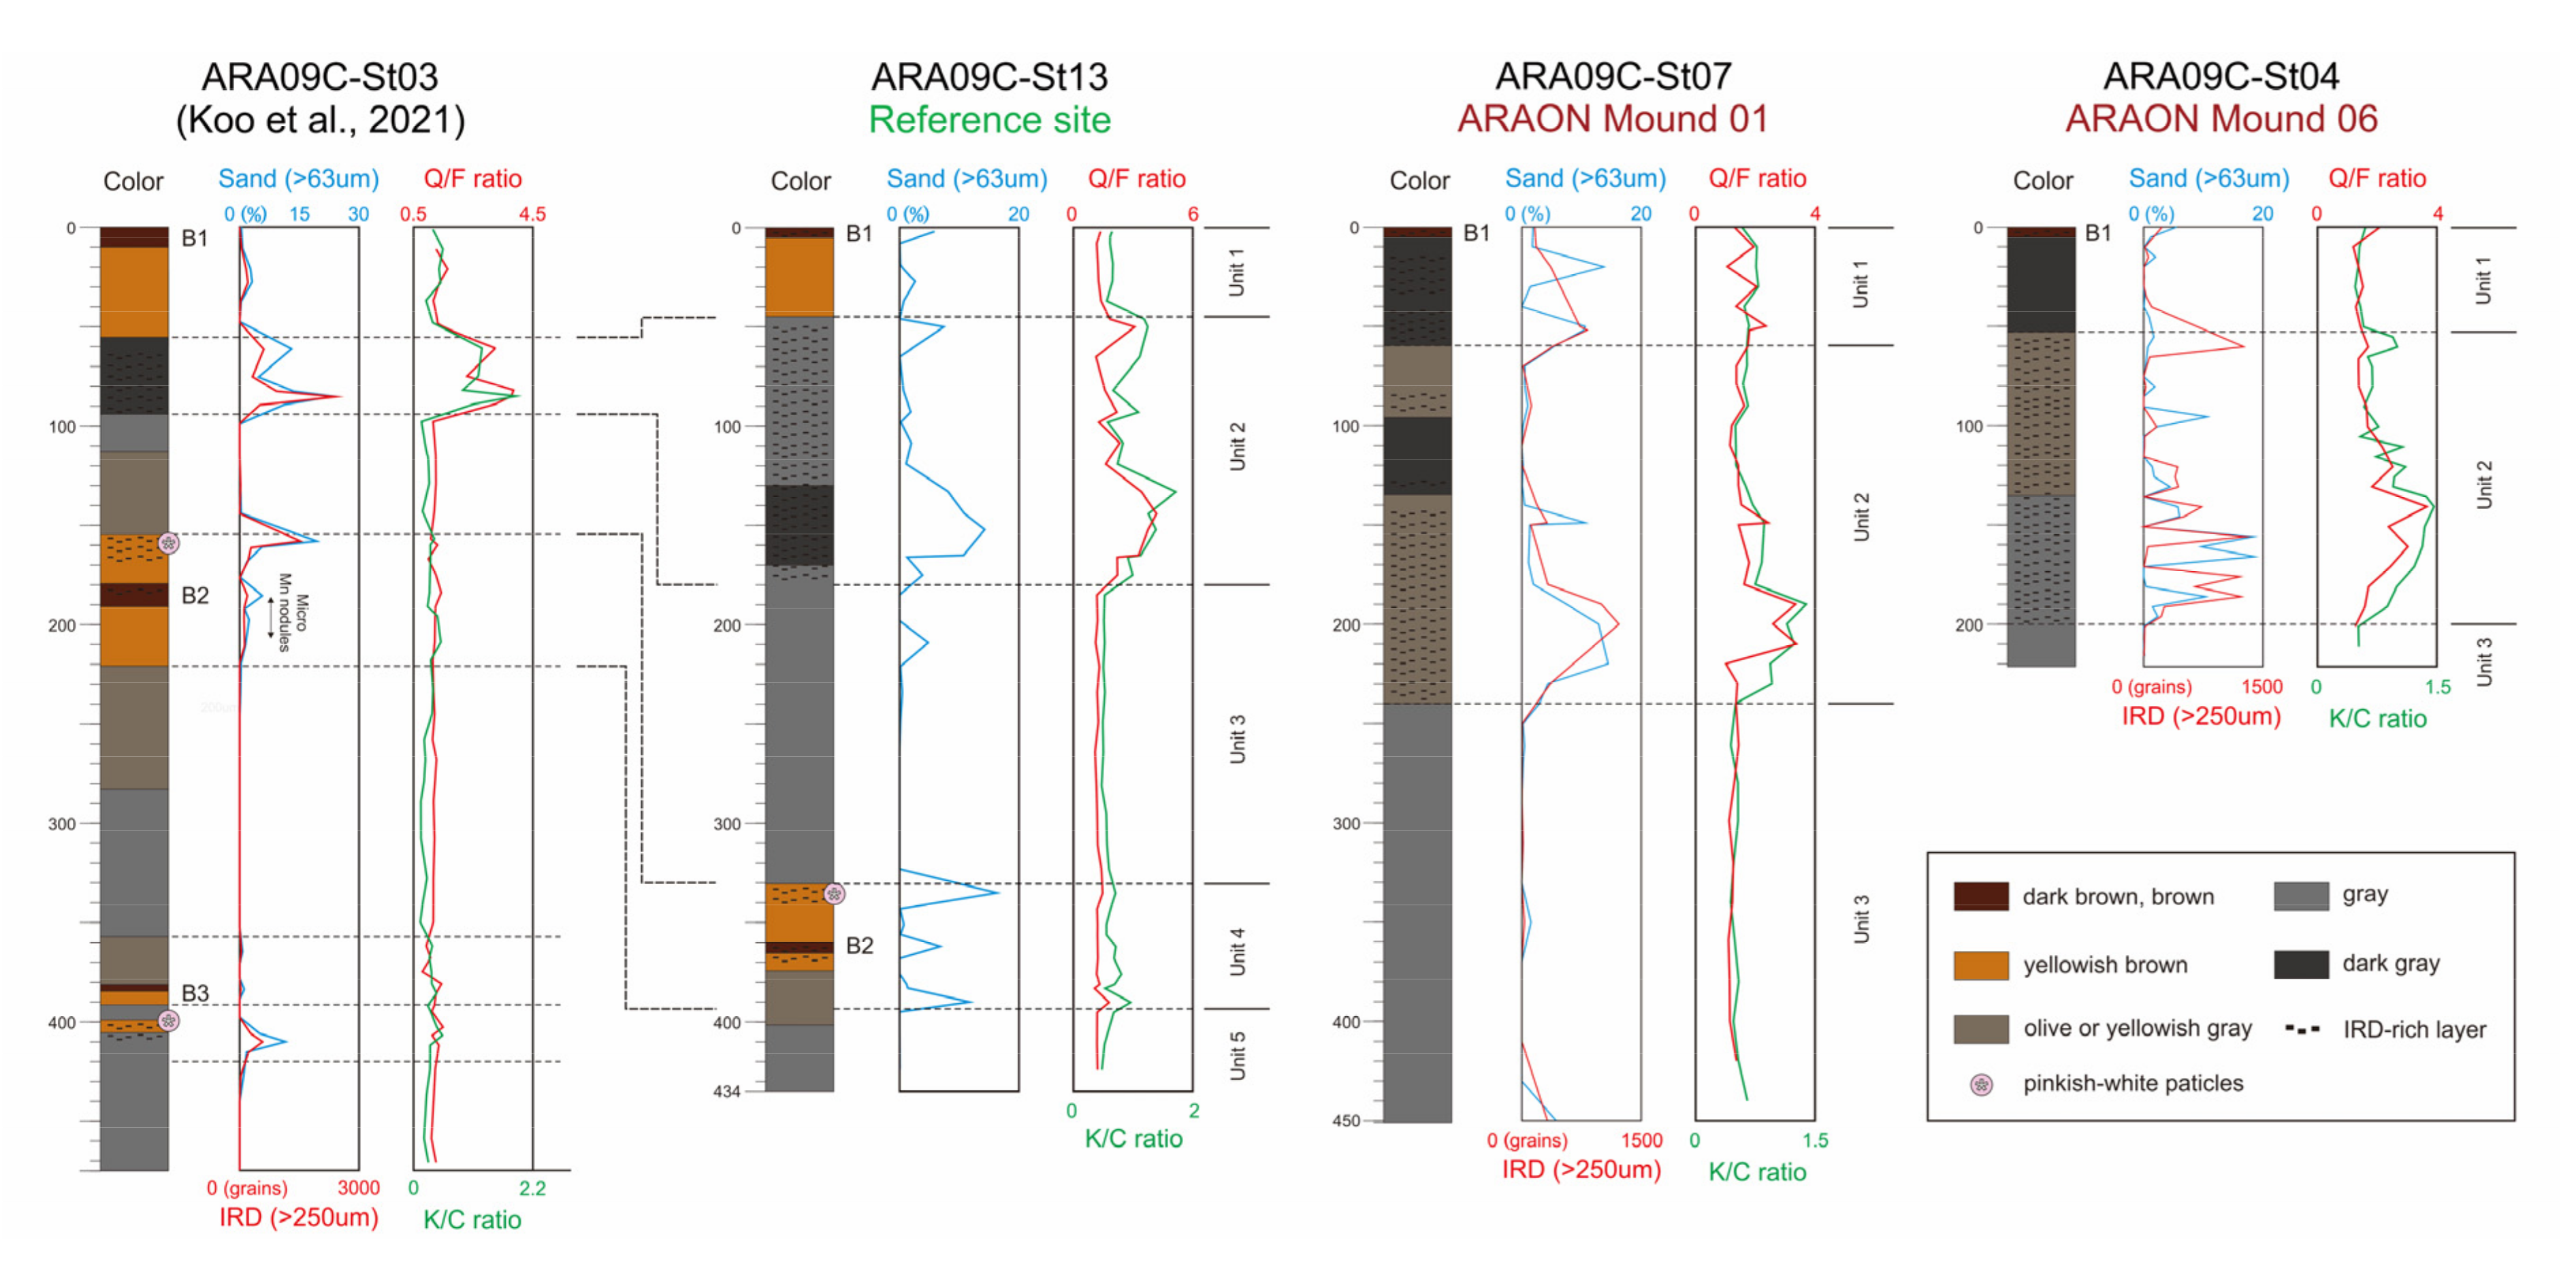
Background core ARA09C-St13, located between the mound structures, consists of five sedimentary units that extend from the Chukchi Rise to the Chukchi Basin. Core sediments in the AMs are darker than the background core, although three sedimentary units in the same order are present. The main differences among sites are the absence of dolomite and the presence of gypsum in the AMs.
(2)
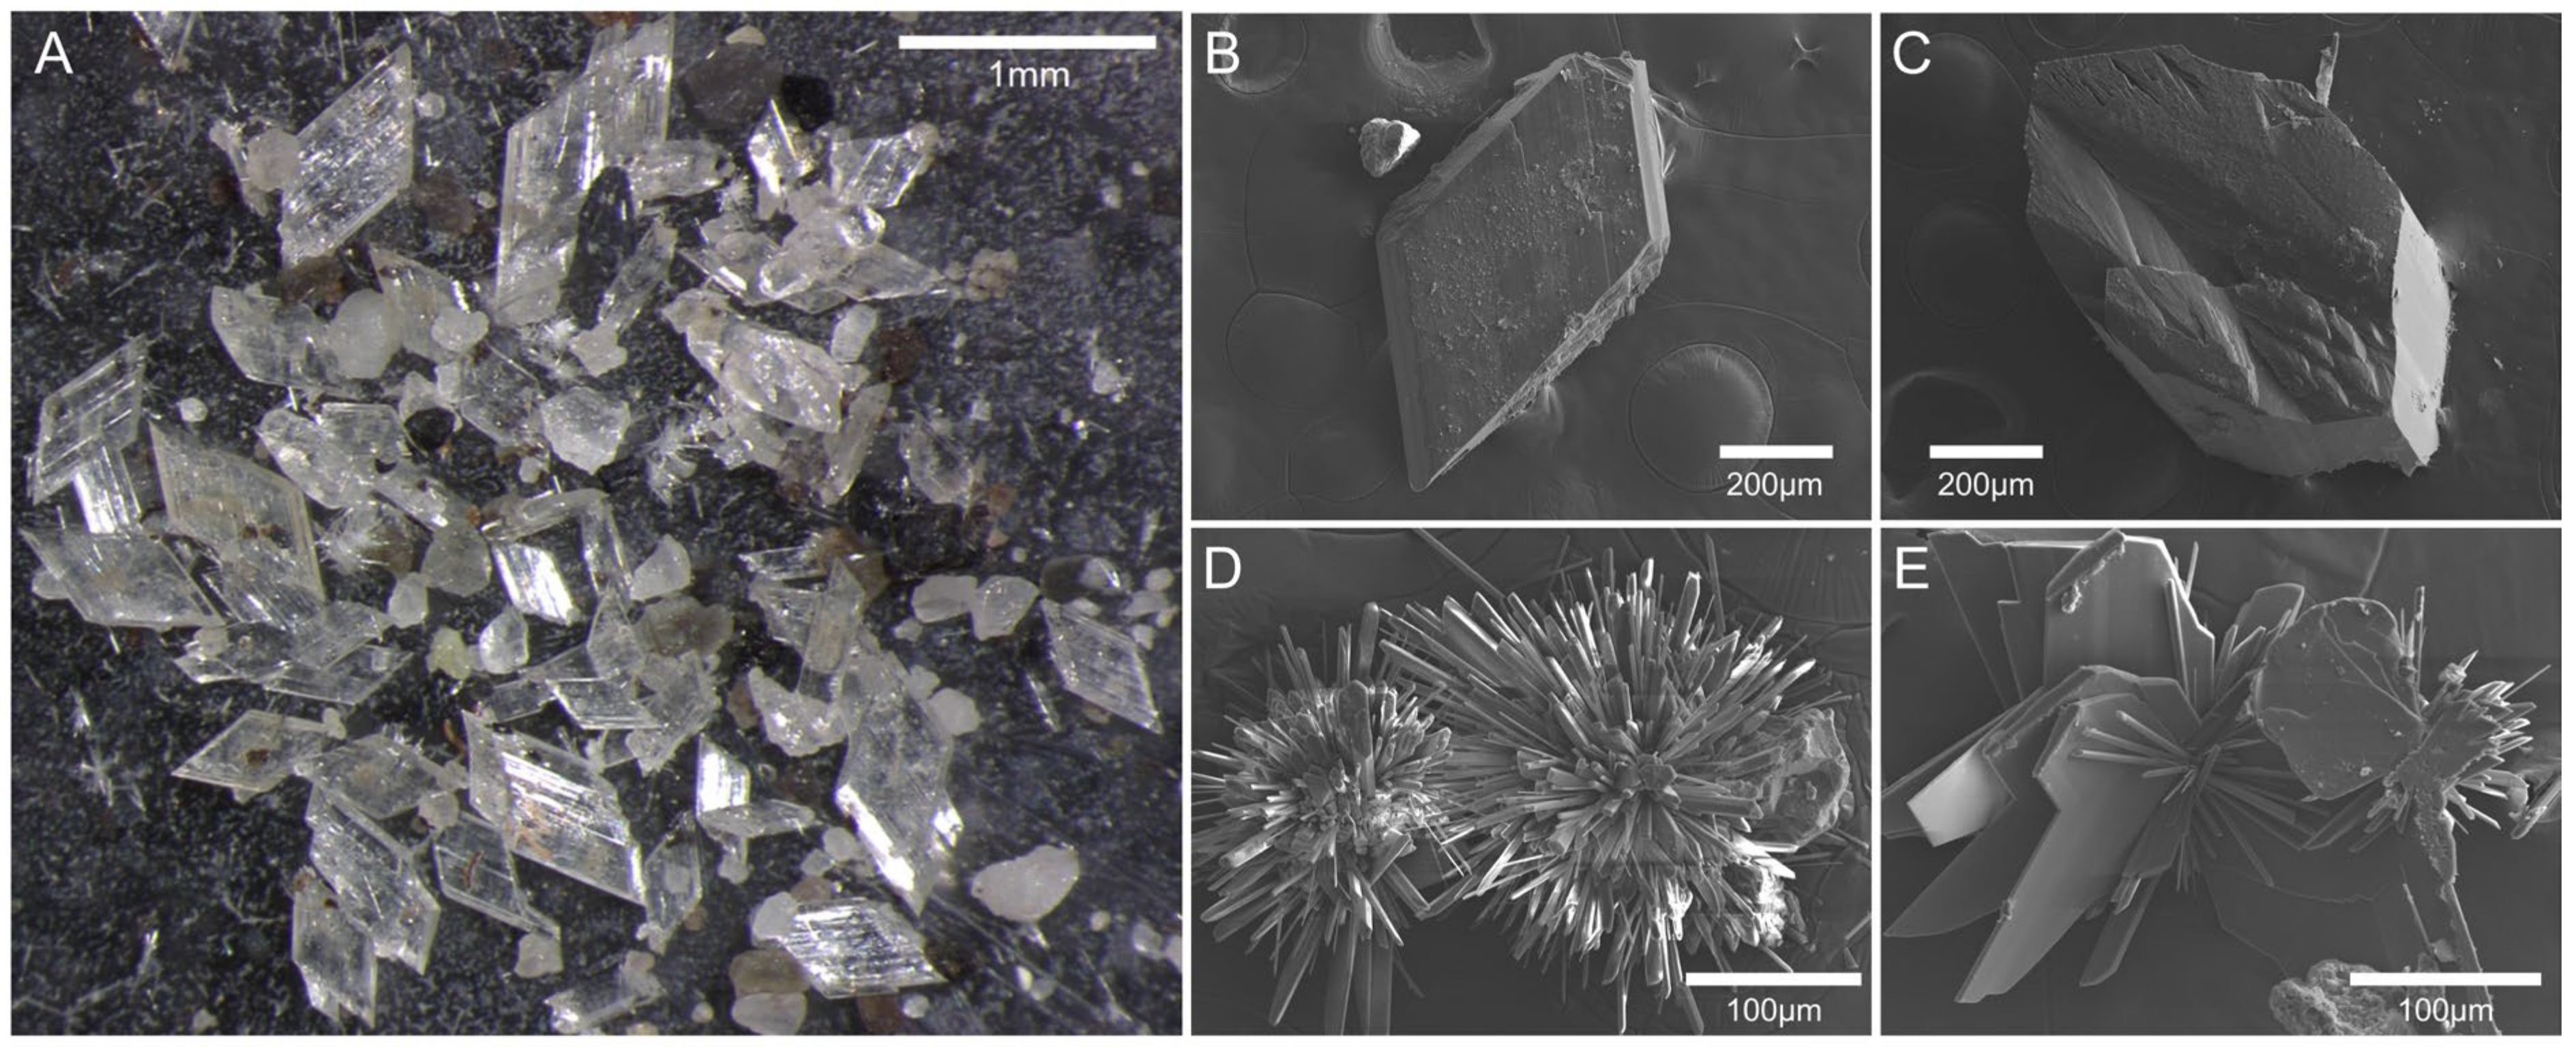
Gypsum was authigenically precipitated in situ based on its morphological characteristics. The vertical distribution of gypsum in sediment cores revealed that precipitation was more closely related to the absence of dolomite than the location of the SMT. Chemical weathering and gypsum overgrowth were observed on the surface of dolomite recovered from the AMs, demonstrating that dolomite dissolution is the primary source of Ca for gypsum precipitation.
(3)
Ion exclusion and dissolution of biological carbonates may also provide Ca for gypsum precipitation, but these processes might be secondary, as gypsum was found only in sedimentary units containing dolomite in this study.
(4)
The main source of sulfate was the disproportionation of sulfide and oxidation of H2S generated through POCSR and AOM, as no sulfides other than gypsum were present in the AM or background cores. For verification of this process, the isotopic analysis will be required.

Supplementary Materials

The following supporting information can be downloaded at: https://www.mdpi.com/article/10.3390/min12080983/s1, Table S1: Bulk mineral composition (%) in the studied cores; Table S2: Clay mineral composition (%) in the studied cores; Table S3: Dissolved sulfide (H2S) concentration of pore water in mound sites.

Author Contributions

Conceptualization, H.J.K. and H.G.C.; methodology, H.J.K.; validation, H.J.K., J.K.J., D.H.L. and H.G.C.; formal analysis, H.J.K.; investigation, H.J.K., J.K.J. and D.H.L.; data curation, H.J.K.; writing–original draft preparation, H.J.K.; writing–review and editing, H.J.K., J.K.J., D.H.L. and H.G.C.; visualization, H.J.K. and J.K.J.; supervision, H.G.C.; project administration, H.G.C.; funding acquisition, H.G.C. All authors have read and agreed to the published version of the manuscript.

Funding

This research was funded by the Korean Ministry of Oceans and Fisheries (Grant numbers 20160247 and 20210632).

Institutional Review Board Statement

Not applicable.

Informed Consent Statement

Not applicable.

Data Availability Statement

Datasets related to this article included in the Supplementary Materials.

Acknowledgments

We would like to thank the captain and crews of the R/V ARAON for their help. We also thank M.J. Kim and K.L. Kim for their analytical assistance in the laboratory at Gyeongsang National University.

Conflicts of Interest

The authors declare that they have no known competing financial interests or personal relationships that could have appeared to influence the work reported in this paper.

References

  1. Collett, T. Natural Gas Hydrates: Vast Resources, Uncertain Future; US Geological Survey: Reston, VA, USA, 2001.
  2. McGuire, A.D.; Anderson, L.G.; Christensen, T.R.; Dallimore, S.; Guo, L.; Hayes, D.J.; Heimann, M.; Lorenson, T.D.; Macdonald, R.W.; Roulet, N. Sensitivity of the carbon cycle in the Arctic to climate change. Ecol. Monogr. 2009, 79, 523–555. [Google Scholar] [CrossRef] [Green Version]
  3. Dlugokencky, E.J.; Bruhwiler, L.; White, J.; Emmons, L.; Novelli, P.C.; Montzka, S.A.; Masarie, K.A.; Lang, P.M.; Crotwell, A.; Miller, J.B. Observational constraints on recent increases in the atmospheric CH4 burden. Geophys. Res. Lett. 2009, 36, L18803. [Google Scholar] [CrossRef] [Green Version]
  4. Kerr, R.A. ‘Arctic Armageddon’ Needs More Science, Less Hype. Science 2010, 329, 620–621. [Google Scholar] [CrossRef] [PubMed]
  5. Kim, J.-H.; Hachikubo, A.; Kida, M.; Minami, H.; Lee, D.-H.; Jin, Y.K.; Ryu, J.-S.; Lee, Y.M.; Hur, J.; Park, M.-H.; et al. Upwarding gas source and postgenetic processes in the shallow sediments from the ARAON Mounds, Chukchi Sea. J. Nat. Gas Sci. Eng. 2020, 76, 103223. [Google Scholar] [CrossRef]
  6. Andreassen, K.; Hart, P.; Grantz, A. Seismic studies of a bottom simulating reflection related to gas hydrate beneath the continental margin of the Beaufort Sea. J. Geophys. Res. Solid Earth 1995, 100, 12659–12673. [Google Scholar] [CrossRef]
  7. Petersen, C.J.; Bünz, S.; Hustoft, S.; Mienert, J.; Klaeschen, D. High-resolution P-Cable 3D seismic imaging of gas chimney structures in gas hydrated sediments of an Arctic sediment drift. Mar. Pet. Geol. 2010, 27, 1981–1994. [Google Scholar] [CrossRef]
  8. Shakhova, N.; Semiletov, I.; Salyuk, A.; Yusupov, V.; Kosmach, D.; Gustafsson, Ö. Extensive methane venting to the atmosphere from sediments of the East Siberian Arctic Shelf. Science 2010, 327, 1246–1250. [Google Scholar] [CrossRef]
  9. Kocherla, M. Authigenic Gypsum in Gas-Hydrate Associated Sediments from the East Coast of India (Bay of Bengal). Acta Geol. Sin.-Engl. Ed. 2013, 87, 749–760. [Google Scholar] [CrossRef]
  10. Pierre, C.; Blanc-Valleron, M.-M.; Demange, J.; Boudouma, O.; Foucher, J.-P.; Pape, T.; Himmler, T.; Fekete, N.; Spiess, V. Authigenic carbonates from active methane seeps offshore southwest Africa. Geo-Mar. Lett. 2012, 32, 501–513. [Google Scholar] [CrossRef]
  11. Pierre, C.; Bayon, G.; Blanc-Valleron, M.-M.; Mascle, J.; Dupré, S. Authigenic carbonates related to active seepage of methane-rich hot brines at the Cheops mud volcano, Menes caldera (Nile deep-sea fan, eastern Mediterranean Sea). Geo-Mar. Lett. 2014, 34, 253–267. [Google Scholar] [CrossRef] [Green Version]
  12. Sassen, R.; Roberts, H.H.; Carney, R.; Milkov, A.V.; DeFreitas, D.A.; Lanoil, B.; Zhang, C. Free hydrocarbon gas, gas hydrate, and authigenic minerals in chemosynthetic communities of the northern Gulf of Mexico continental slope: Relation to microbial processes. Chem. Geol. 2004, 205, 195–217. [Google Scholar] [CrossRef]
  13. Wang, J. Authigenic gypsum found in gas hydrate-associated sediments from Hydrate Ridge, the eastern North Pacific. Sci. China Earth Sci. 2004, 47, 280. [Google Scholar] [CrossRef]
  14. Lin, Q.; Wang, J.; Algeo, T.J.; Su, P.; Hu, G. Formation mechanism of authigenic gypsum in marine methane hydrate settings: Evidence from the northern South China Sea. Deep. Sea Res. Part I Oceanogr. Res. Pap. 2016, 115, 210–220. [Google Scholar] [CrossRef]
  15. Pierre, C. Origin of the authigenic gypsum and pyrite from active methane seeps of the southwest African Margin. Chem. Geol. 2017, 449, 158–164. [Google Scholar] [CrossRef]
  16. Zhang, M.; Lu, H.; Guan, H.; Liu, L.; Wu, D.; Wu, N. Methane seepage intensities traced by sulfur isotopes of pyrite and gypsum in sediment from the Shenhu area, South China Sea. Acta Oceanol. Sin. 2018, 37, 20–27. [Google Scholar] [CrossRef]
  17. Zhao, J.; Wang, J.; Phillips, S.C.; Liang, J.; Su, P.; Lin, Q.; Chen, C.; Liu, J. Non-evaporitic gypsum formed in marine sediments due to sulfate-methane transition zone fluctuations and mass transport deposits in the northern South China Sea. Mar. Chem. 2021, 233, 103988. [Google Scholar] [CrossRef]
  18. Chang, L.; Howe, R.; Zussman, J. Non-Silicates: Sulphates, Carbonates, Phosphates, Halides; Longman Group: London, UK, 1996; p. 383. [Google Scholar]
  19. Jin, Y.K.; Onboard Ship Scientific Party. ARA07C Cruise Report: 2016 Korea-Russia-Germany East Siberian Sea Research Program; Korea Polar Research Institute: Incheon, Korea, 2017; p. 103. [Google Scholar]
  20. Jin, Y.K.; Shipboard Scientific Party. ARA09C Cruise Report: 2018 Korea-Russia-Japan East Siberian/Chukchi Sea Research Program; Korea Polar Research Institute: Incheon, Korea, 2019; p. 205. [Google Scholar]
  21. Kim, Y.-G.; Kim, S.; Lee, D.-H.; Lee, Y.M.; Kim, H.J.; Kang, S.-G.; Jin, Y.K. Occurrence of active gas hydrate mounds in the southwestern slope of the Chukchi Plateau, Arctic Ocean. Episodes 2020, 43, 811–823. [Google Scholar] [CrossRef]
  22. Kang, S.-G.; Jang, U.; Kim, S.; Choi, Y.; Kim, Y.-G.; Hong, J.K.; Jin, Y.K. Exploration of the Gas Hydrates on the Southwestern Continental Slope of the Chukchi Plateau in the Arctic Ocean. J. Korean Soc. Miner. Energy Resour. Eng. 2021, 31, 418–432. [Google Scholar] [CrossRef]
  23. Koo, H.-J.; Jin, Y.-K.; Cho, H.-G. Change in Sediment Provenance on the Inner Slope of the Chukchi Rise and Their Paleoenvironmental Implications. Appl. Sci. 2021, 11, 6491. [Google Scholar] [CrossRef]
  24. Darby, D.A.; Bischof, J.F. A Holocene record of changing Arctic Ocean ice drift analogous to the effects of the Arctic Oscillation. Paleoceanography 2004, 19, 1027. [Google Scholar] [CrossRef] [Green Version]
  25. Kobayashi, D.; Yamamoto, M.; Irino, T.; Nam, S.-I.; Park, Y.-H.; Harada, N.; Nagashima, K.; Chikita, K.; Saitoh, S.-I. Distribution of detrital minerals and sediment color in western Arctic Ocean and northern Bering Sea sediments: Changes in the provenance of western Arctic Ocean sediments since the last glacial period. Polar Sci. 2016, 10, 519–531. [Google Scholar] [CrossRef]
  26. Biscaye, P.E. Mineralogy and sedimentation of recent deep-sea clay in the Atlantic Ocean and adjacent seas and oceans. Geol. Soc. Am. Bull. 1965, 76, 803–832. [Google Scholar] [CrossRef]
  27. Cho, H.G.; Kim, S.-O.; Kwak, K.Y.; Choi, H.; Khim, B.-K. Clay mineral distribution and provenance in the Heuksan mud belt, Yellow Sea. Geo-Mar. Lett. 2015, 35, 411–419. [Google Scholar] [CrossRef]
  28. Cline, J.D. Spectrophotometric determination of hydrogen sulfide in natural waters 1. Limnol. Oceanogr. 1969, 14, 454–458. [Google Scholar] [CrossRef]
  29. Darby, D.A.; Myers, W.B.; Jakobsson, M.; Rigor, I. Modern dirty sea ice characteristics and sources: The role of anchor ice. J. Geophys. Res. Ocean. 2011, 116, C09008. [Google Scholar] [CrossRef] [Green Version]
  30. Naidu, A.; Mowatt, T. Sources and dispersal patterns of clay minerals in surface sediments from the continental-shelf areas off Alaska. Geol. Soc. Am. Bull. 1983, 94, 841–854. [Google Scholar] [CrossRef]
  31. Wahsner, M.; Müller, C.; Stein, R.; Ivanov, G.; Levitan, M.; Shelekhova, E.; Tarasov, G. Clay-mineral distribution in surface sediments of the Eurasian Arctic Ocean and continental margin as indicator for source areas and transport pathways—A synthesis. Boreas 1999, 28, 215–233. [Google Scholar] [CrossRef]
  32. Myers, W.B. Circum-Arctic Mineralogy & Pan-Arctic Chronostratigraphy of Late Pleistocene Sediments: Developing a Comprehensive Age Model for the Western Arctic Ocean Using Unique Ice-Rafted Signals; Old Dominion University: Norfolk, UK, 2019. [Google Scholar]
  33. Viscosi-Shirley, C.; Mammone, K.; Pisias, N.; Dymond, J. Clay mineralogy and multi-element chemistry of surface sediments on the Siberian-Arctic shelf: Implications for sediment provenance and grain size sorting. Cont. Shelf Res. 2003, 23, 1175–1200. [Google Scholar] [CrossRef]
  34. Wang, R.; Xiao, W.; März, C.; Li, Q. Late Quaternary paleoenvironmental changes revealed by multi-proxy records from the Chukchi Abyssal Plain, western Arctic Ocean. Glob. Planet. Change 2013, 108, 100–118. [Google Scholar] [CrossRef]
  35. Fagel, N.; Not, C.; Gueibe, J.; Mattielli, N.; Bazhenova, E. Late Quaternary evolution of sediment provenances in the Central Arctic Ocean: Mineral assemblage, trace element composition and Nd and Pb isotope fingerprints of detrital fraction from the Northern Mendeleev Ridge. Quat. Sci. Rev. 2014, 92, 140–154. [Google Scholar] [CrossRef]
  36. Dong, L.; Liu, Y.; Shi, X.; Polyak, L.; Huang, Y.; Fang, X.; Liu, J.; Zou, J.; Wang, K.; Sun, F.; et al. Sedimentary record from the Canada Basin, Arctic Ocean: Implications for late to middle Pleistocene glacial history. Clim. Past 2017, 13, 511–531. [Google Scholar] [CrossRef] [Green Version]
  37. Stein, R. Arctic Ocean Sediments: Processes, Proxies, and Paleoenvironment; Elsevier: Amsterdam, Netherlands, 2008. [Google Scholar]
  38. März, C.; Stratmann, A.; Matthießen, J.; Meinhardt, A.-K.; Eckert, S.; Schnetger, B.; Vogt, C.; Stein, R.; Brumsack, H.-J. Manganese-rich brown layers in Arctic Ocean sediments: Composition, formation mechanisms, and diagenetic overprint. Geochim. Cosmochim. Acta 2011, 75, 7668–7687. [Google Scholar] [CrossRef]
  39. Schreck, M.; Nam, S.-I.; Polyak, L.; Vogt, C.; Kong, G.S.; Stein, R.; Matthiessen, J.; Niessen, F. Improved Pleistocene sediment stratigraphy and paleoenvironmental implications for the western Arctic Ocean off the East Siberian and Chukchi margins. arktos 2018, 4, 1–20. [Google Scholar] [CrossRef]
  40. Zou, H. An X-ray diffraction approach: Bulk mineral assemblages as provenance indicator of sediments from the Arctic Ocean. Ph.D. Thesis, University of Bremen, Bremen, Germany, 2016. [Google Scholar]
  41. Park, K.; Ohkushi, K.i.; Cho, H.G.; Khim, B.-K. Lithostratigraphy and paleoceanography in the Chukchi Rise of the western Arctic Ocean since the last glacial period. Polar Sci. 2017, 11, 42–53. [Google Scholar] [CrossRef]
  42. Burton, E.A. Controls on marine carbonate cement mineralogy: Review and reassessment. Chem. Geol. 1993, 105, 163–179. [Google Scholar] [CrossRef]
  43. Magalhães, V.H.; Pinheiro, L.M.; Ivanov, M.K.; Kozlova, E.; Blinova, V.; Kolganova, J.; Vasconcelos, C.; McKenzie, J.A.; Bernasconi, S.M.; Kopf, A.J. Formation processes of methane-derived authigenic carbonates from the Gulf of Cadiz. Sediment. Geol. 2012, 243, 155–168. [Google Scholar] [CrossRef]
  44. Serié, C.; Huuse, M.; Schødt, N.H. Gas hydrate pingoes: Deep seafloor evidence of focused fluid flow on continental margins. Geology 2012, 40, 207–210. [Google Scholar] [CrossRef]
  45. Hong, W.-L.; Torres, M.E.; Carroll, J.; Crémière, A.; Panieri, G.; Yao, H.; Serov, P. Seepage from an arctic shallow marine gas hydrate reservoir is insensitive to momentary ocean warming. Nat. Commun. 2017, 8, 15745. [Google Scholar] [CrossRef]
  46. Paull, C.K.; Dallimore, S.; Caress, D.; Gwiazda, R.; Melling, H.; Riedel, M.; Jin, Y.; Hong, J.; Kim, Y.G.; Graves, D. Active mud volcanoes on the continental slope of the Canadian Beaufort Sea. Geochem. Geophys. Geosystems 2015, 16, 3160–3181. [Google Scholar] [CrossRef]
  47. Borowski, W.S.; Paull, C.K.; Ussler, W., III. Marine pore-water sulfate profiles indicate in situ methane flux from underlying gas hydrate. Geology 1996, 24, 655–658. [Google Scholar] [CrossRef]
  48. Briskin, M.; Schreiber, B.C. Authigenic gypsum in marine sediments. Mar. Geol. 1978, 28, 37–49. [Google Scholar] [CrossRef]
  49. Haffert, L.; Haeckel, M.; Liebetrau, V.; Berndt, C.; Hensen, C.; Nuzzo, M.; Reitz, A.; Scholz, F.; Schönfeld, J.; Perez-Garcia, C. Fluid evolution and authigenic mineral paragenesis related to salt diapirism–The Mercator mud volcano in the Gulf of Cadiz. Geochim. Cosmochim. Acta 2013, 106, 261–286. [Google Scholar] [CrossRef]
  50. Harouaka, K.; Eisenhauer, A.; Fantle, M.S. Experimental investigation of Ca isotopic fractionation during abiotic gypsum precipitation. Geochim. Cosmochim. Acta 2014, 129, 157–176. [Google Scholar] [CrossRef]
  51. Balci, N.; Shanks, W.C., III; Mayer, B.; Mandernack, K.W. Oxygen and sulfur isotope systematics of sulfate produced by bacterial and abiotic oxidation of pyrite. Geochim. Cosmochim. Acta 2007, 71, 3796–3811. [Google Scholar] [CrossRef]
  52. Schippers, A.; Jørgensen, B.B. Oxidation of pyrite and iron sulfide by manganese dioxide in marine sediments. Geochim. Cosmochim. Acta 2001, 65, 915–922. [Google Scholar] [CrossRef]
  53. Canfield, D.E.; Thamdrup, B. The production of 34S-depleted sulfide during bacterial disproportionation of elemental sulfur. Science 1994, 266, 1973–1975. [Google Scholar] [CrossRef]
  54. Blanchet, C.L.; Kasten, S.; Vidal, L.; Poulton, S.W.; Ganeshram, R.; Thouveny, N. Influence of diagenesis on the stable isotopic composition of biogenic carbonates from the Gulf of Tehuantepec oxygen minimum zone. Geochem. Geophys. Geosystems 2012, 13, Q04003. [Google Scholar] [CrossRef]
  55. Jørgensen, B.B.; Kasten, S. Sulfur cycling and methane oxidation. In Marine geochemistry; Springer: Berlin/Heidelberg, Germany, 2006; pp. 271–309. [Google Scholar]
  56. Pirlet, H.; Wehrmann, L.M.; Brunner, B.; Frank, N.; Dewanckele, J.A.N.; Van Rooij, D.; Foubert, A.; Swennen, R.; Naudts, L.; Boone, M.; et al. Diagenetic formation of gypsum and dolomite in a cold-water coral mound in the Porcupine Seabight, off Ireland. Sedimentology 2010, 57, 786–805. [Google Scholar] [CrossRef]
  57. Riedinger, N.; Brunner, B.; Formolo, M.J.; Solomon, E.; Kasten, S.; Strasser, M.; Ferdelman, T.G. Oxidative sulfur cycling in the deep biosphere of the Nankai Trough, Japan. Geology 2010, 38, 851–854. [Google Scholar] [CrossRef]
  58. Schnitker, D.; Mayer, L.; Norton, S. Loss of calcareous microfossils from sediments through gypsum formation. Mar. Geol. 1980, 36, M35–M44. [Google Scholar] [CrossRef]
  59. Ussler, W.; Paull, C. Effects of ion exclusion and isotopic fractionation on pore water geochemistry during gas hydrate formation and decomposition. Geo-Mar. Lett. 1995, 15, 37–44. [Google Scholar] [CrossRef]
Figure 2. Vertical lithology profiles of the sediment cores in the background site and ARAON Mounds, marked with color cycles, ice-rafted debris (IRD) and/or sand contents, quartz/feldspar (Q/F), and kaolinite/chlorite (K/C) ratios. The correlation of core ARA09C-St03 in the inner slope of Chukchi Rise [23] is based upon color cycles, sand content, and mineral ratios.
Minerals 12 00983 g002
Figure 3. Down-core variations in major mineral and H2S data in sediment cores. CH4 and SO42− data from Kim et al. [5]. The dotted lines represent the boundaries of the separated units.
Minerals 12 00983 g003
Figure 4. (A) Photograph of separated grains (> 250 μm) from the ARAON Mound. Rhombic and fibrous grains are gypsum, and most of the others are quartz and feldspar. (BD) SEM images of gypsum crystals from ARAON Mound. (B) Rhombic form, (C) tabular form, (D) fiber rosette form, (E) plate by the growth of fibers.
Minerals 12 00983 g004
Figure 5. Correlation plot of the quartz/feldspar (Q/F) ratio with gypsum for the ARAON Mound cores. The boundary of sediment provenance is established based on the mineral data in the work by Darby et al. [29].
Minerals 12 00983 g005
Figure 6. SEM images of dolomite crystals from (A) the background site and (B) ARAON Mound. (C) Enlarged SEM image of the marked C and white square in (B). Note the gypsum overgrowth on the surface of the dolomite. Dol: dolomite, Gp: gypsum.
Minerals 12 00983 g006
Figure 7. Schematic figure of the sulfur cycle and Ca sources for precipitation of authigenic gypsum; modified, Lin et al. [14].
Minerals 12 00983 g007
Table 1. Summaries of location, water depth, total core length, and depth of the SMT [5] in each site from the ARA09C Expedition.
SiteLatitude (°N)Longitude (°W)Water Depth (m)Core Length (cm)Depth of SMT (m) [5]Remark
ARA09C-St0775.7116169.7931699434~3.3Summit of AM01
ARA09C-St0475.6797169.7388605221~1.2Summit of AM06
ARA09C-St1375.6731169.7391615434-Background site (between AM06 and AM07)
Table 2. Average bulk mineral compositions (%) and Q/F ratio in the studied cores and their potential provenances [29]. Raw data provided in Table S1 in Supplementary Materials. Afs: alkali feldspar, Dol: dolomite, Gp: gypsum, Pl: plagioclase, Qz: quartz, Q/F: quartz/feldspar.
SamplesnQzAfsPlDolMicaGpClay MineralsQ/F
ARA09C-St07Unit 1828.55.112.10.613.32.435.71.7
Unit 21827.04.911.30.812.41.839.61.8
Unit 3921.13.413.70.512.90.445.41.2
ARA09C-St04Unit 11123.83.513.00.214.11.142.01.5
Unit 22431.05.09.81.313.42.435.22.2
Unit 3223.54.316.60.211.00.242.81.1
ARA09C-St13Unit 1521.03.812.61.013.0-45.41.3
Unit 21431.93.99.92.512.5-36.82.4
Unit 31123.24.314.90.511.5-43.21.2
Unit 41022.74.513.31.611.7-44.11.3
Unit 5321.84.213.90.313.3-43.21.2
Laptev Sea123.616.321.10.17.3-28.80.6
East Siberian Sea527.19.217.30.114.9-31.11.0
Chukchi Sea428.55.515.11.117.3-31.11.4
Canada Archipelago721.83.76.416.914.2-31.42.2
Beaufort Sea339.33.75.18.010.2-25.44.5
Table 3. Average clay mineral and sand compositions (%) and K/C ratio in the studied cores and their potential provenances [29,30,31,32]. Raw data provided in Table S2 in Supplementary Materials. K/C: kaolinite/chlorite.
SamplesnIlliteChloriteKaoliniteSmectiteK/CSand
ARA09C-St07Unit 1863.120.113.83.10.74.2
Unit 21862.119.915.42.70.82.5
Unit 31067.020.210.22.60.50.6
ARA09C-St04Unit 1764.621.412.51.50.61.1
Unit 22061.118.617.03.30.93.3
Unit 3165.820.110.43.70.50.1
ARA09C-St13Unit 1568.417.310.83.40.61.9
Unit 21459.118.819.82.31.14.4
Unit 31167.619.210.13.20.50.5
Unit 41069.316.611.13.00.73.8
Unit 5368.218.410.13.30.60.0
Laptev Sea24340.422.313.024.30.58-
East Siberian Sea10466.319.98.35.90.42-
Chukchi Sea2558.123.79.48.70.40-
Canada Archipelago1757.810.014.417.71.44-
Beaufort Sea5963.116.712.08.10.72-
Table 4. Morphology and chemistry of gypsum from the ARAON Mounds.
Gypsum FormsRhombicFiber Rosette
Morphologyn30226
Major axis (μm)912 (36–2596)138 (32–360)
Minor axis (μm)477 (20–1428)10 (1–46)
Major axis/minor axis1.9 (1.5–2.5)17.2 (3.4–202.0)
Chemistryn109209
CaO (wt.%)39.8 (35.4–45.8)40.9 (32.0–49.7)
SO3 (wt.%)59.8 (54.2–61.6)59.0 (50.3–61.9)
Ca/S0.95 (0.89–1.20)0.99 (0.76–1.41)
Publisher’s Note: MDPI stays neutral with regard to jurisdictional claims in published maps and institutional affiliations.

