Article

Contrasting Sources and Related Metallogeny of the Triassic and Jurassic Granitoids in the Chifeng–Chaoyang District, Northern Margin of the North China Craton: A Review with New Data

1
Development and Research Center, China Geological Survey, Beijing 100037, China
2
Beijing SHRIMP Center, Institute of Geology, Chinese Academy of Geological Sciences, Beijing 100037, China
3
School of Earth Sciences and Resources, China University of Geosciences, 29# Xue-Yuan Road, Haidian District, Beijing 100083, China
4
China Chemical Geology and Mine Bureau, Beijing 100013, China
*
Author to whom correspondence should be addressed.
Minerals 2022, 12(9), 1117; https://doi.org/10.3390/min12091117
Submission received: 14 July 2022 / Revised: 22 August 2022 / Accepted: 26 August 2022 / Published: 1 September 2022
(This article belongs to the Special Issue Genesis and Metallogeny of Non-ferrous and Precious Metal Deposits)

Abstract

:
Understanding of the mechanism between magma sources and metallogeny is still vague. As an important gold and molybdenum producing area, the Chifeng–Chaoyang district, located at the northern margin of the North China Craton (NCC), is a key place for this issue. New geochemical data relating to Taijiying gold-deposit-related granites are presented. These data, coupled with previous studies, are used to explore the relationship between magma sources and mineralization processes. Two major magmatic periods, the Middle Triassic (220–230 Ma) and Late Jurassic (150–160 Ma), are identified based on the compiled data. The Triassic magmatic rocks are mostly fractionated I-type and A-type granites, including monzogranite, biotite granite, and syenogranite. They have low initial 87Sr/86Sr values (0.7050), moderately enriched εNd(t)–εHf(t) values (−8.5 and −5.6), and relatively young Nd–Hf model ages (TDM2-TDMC) (1.47–1.57 Ga). These features indicate that more Archean–Paleoproterozoic mantle-derived materials were involved in their sources. On the other hand, Jurassic granites are high-K calc-alkaline of the calc-alkaline series and mainly consist of granite, monzogranite, leucogranite, and granodiorite. They have high Na2O/K2O, Sr/Y, and La/Yb ratios and low Y and Yb contents. The adakitic features suggest the existence of a thickened lower crust. Their significant negative εNd(t)–εHf(t) values (−15.0 and −12.8) and older Nd–Hf model ages (TDM2–TDMC) (2.17–2.11 Ga) are consistent with their derivation from thickened ancient lower crust, indicating the initial activation of NCC. It is proposed that the change in the main source resulted from the tectonic transition during the early Mesozoic initial decratonization, that is, from the post-collisional extension to the subduction of the Paleo-Pacific plate beneath the East Asia plate from the Triassic to the Jurassic. Comparative analysis suggests that the medium–large-scale gold deposits with a high grade are closely related to the Triassic granites; however, most molybdenum deposits formed in the Jurassic. The decratonization of the NCC in the early Mesozoic experienced tectonic transition and controlled the gold and molybdenum mineralizations in the different stages by the changing magma sources. This pattern is beneficial to understanding the metallogenesis in the Chifeng–Chaoyang district.

1. Introduction

The distribution patterns of deposits are very important for exploration. Although many methods and parameters have been applied to decipher these rules, the feature of deep sources has been proved to be a good indicator. The transitions in the magma source indicate the changes of tectonic settings and significant mineralization events in most cases. For example, the switch in the magmatic source from enriched lithospheric mantle to depleted asthenospheric mantle was the most marked change during the NCC cratonic destruction, which promoted large-scale gold deposits. [1,2,3]. Therefore, the northern margin of the NCC, especially in the eastern section, is a good place to explore the relationship between the deep magmatic source and metallogenesis. This is because of the widespread Mesozoic felsic intrusive rocks and contemporaneous mineralization in this region.
The Chifeng–Chaoyang district is located in the eastern NCC, which was affected by the Central Asian Orogenic Belt (CAOB) and the Pacific plate in the Mesozoic (Figure 1a). The Paleozoic–Mesozoic magmatic rocks were emplaced, as well as many medium–large gold and molybdenum deposits (Figure 1b). Yang et al. (2017) preliminarily divided this district into four Nd isotope areas according to the model ages (TDM) of the Phanerozoic granitoids [4]. In the southeastern margin of the NCC, Deng et al. (2018) proposed that the porphyry and porphyry-skarn Cu (-Au-Mo) deposits are associated with Paleoproterozoic to Mesoproterozoic reworked crustal components with minor mantle material [5]. The Jiaodong-type Au and porphyry-skarn Mo (-W-Cu) deposits are associated with Archean–Paleoproterozoic reworking crustal components. Thus, the common relationship between the crustal materials and the mineralization in this area remains unclear. The Mo mineralization is closely related to the small granitic bodies with aged continental component sources, and the Mo deposits are mainly located in the oldest terranes [6]. Some researchers proposed that the hydrated mantle wedge is the source of gold deposits through local and rapid devolatization, which suggests a juvenile source. Field works and analysis displayed high grades of Taijiying gold distributed along the granite dikes. Previous research also suggested that magmatism related to granite porphyries provided fluids and sources for the gold mineralization systems [7]. However, the kind of source controlling the Taijiying gold deposits is still unclear. In this paper, we present new petrology, U–Pb zircon ages, geochemistry, whole-rock Sr–Nd isotopes, and zircon O–Hf isotope data for the Taijiying granite porphyries (Figure 1b) and submit published data for the Triassic and Jurassic felsic magmatic rocks in the Chifeng–Chaoyang district [8]. These results can help us to better understand the sources of the granitoids and their effects on Mo and Au mineralization.

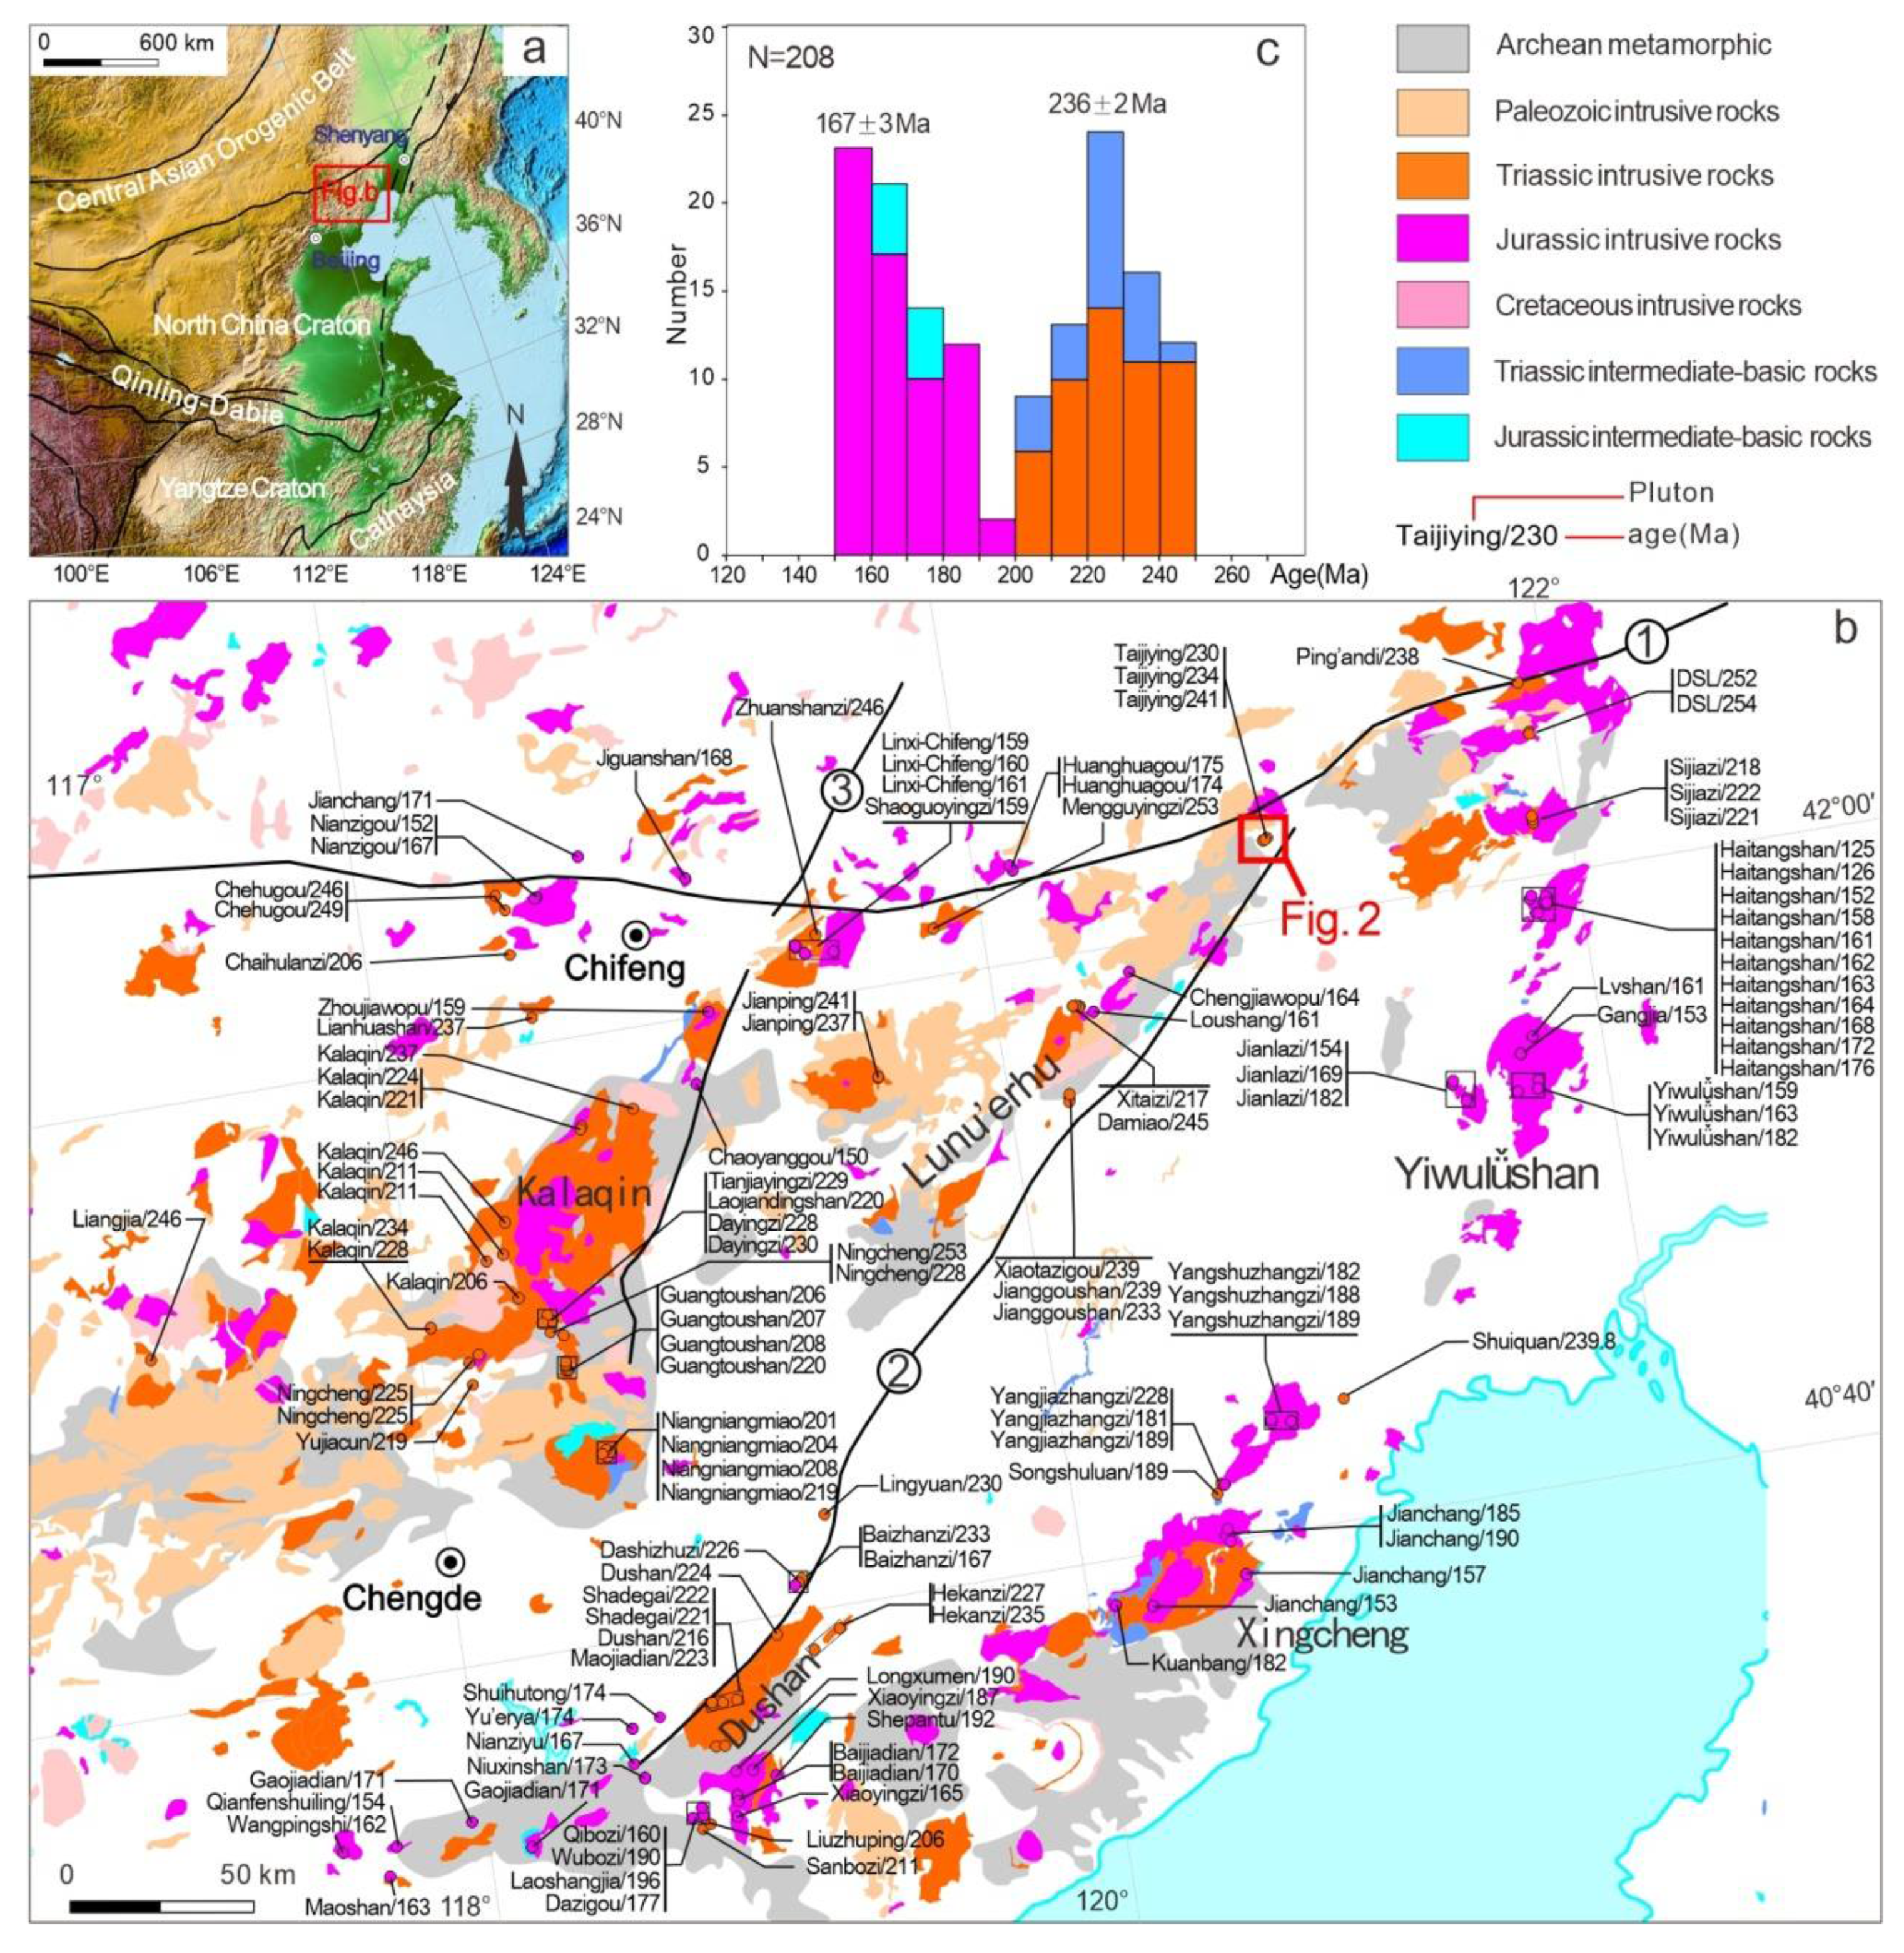
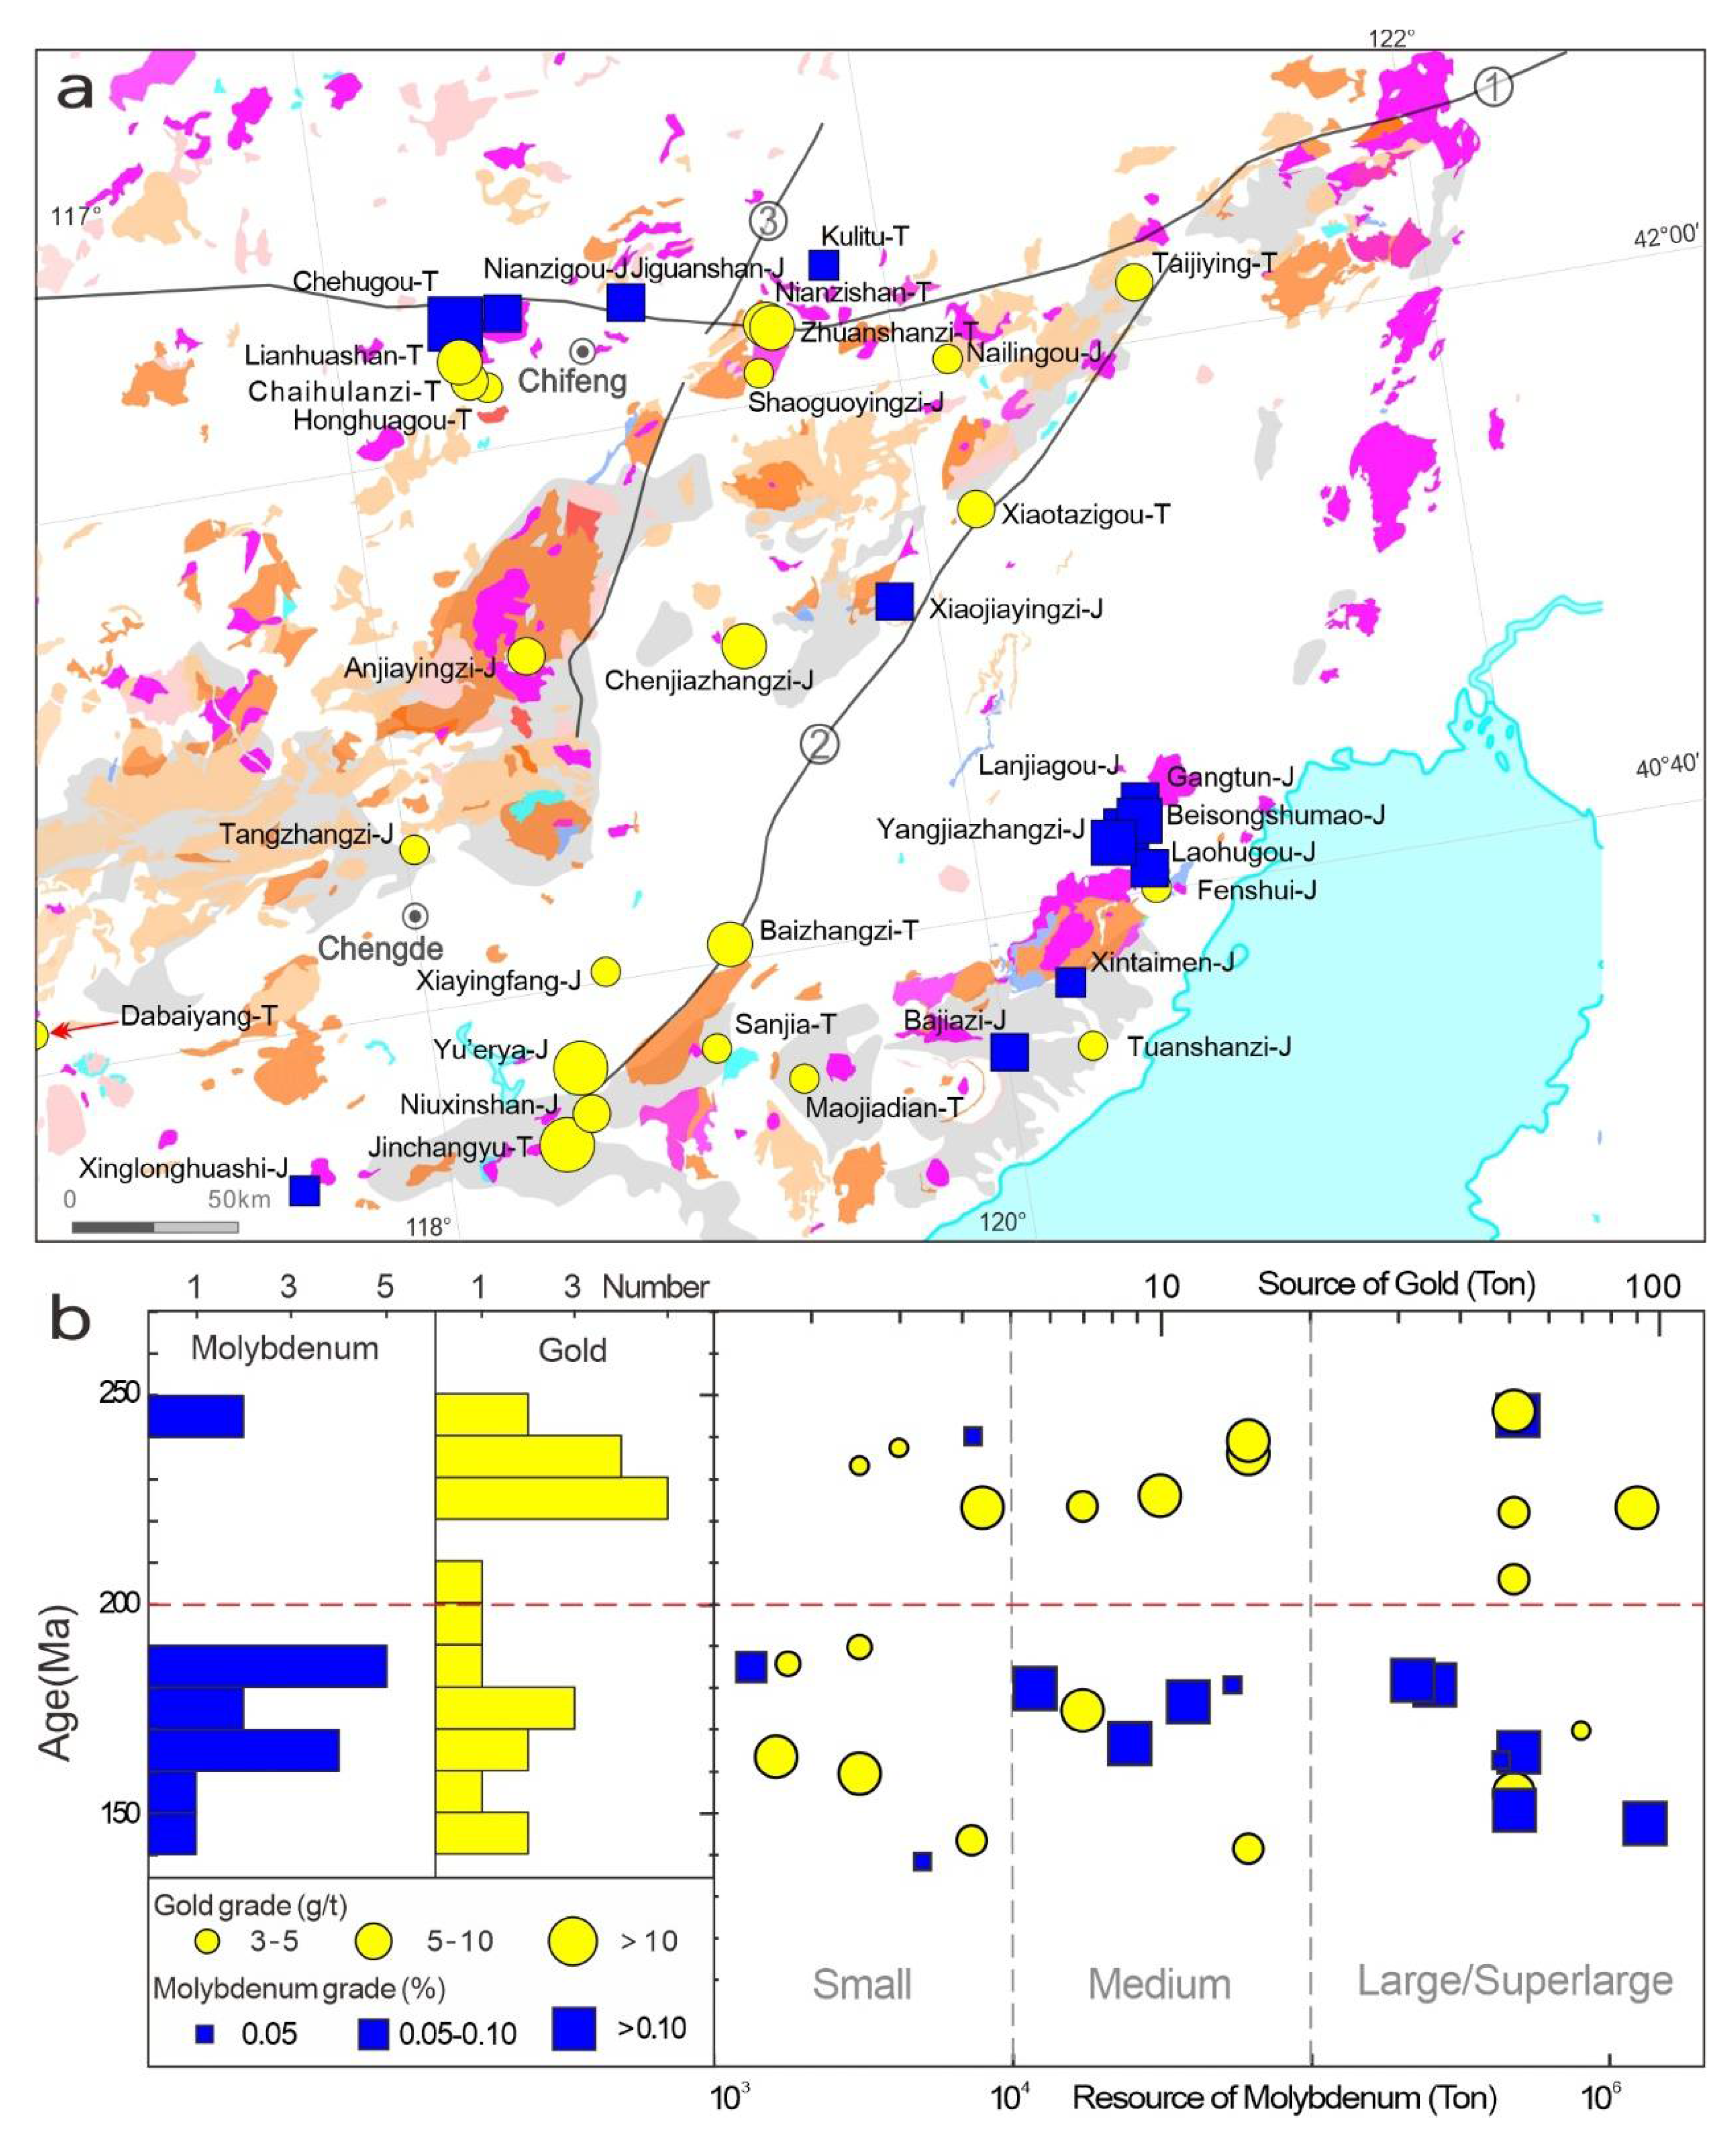
2. Geological Background

The triangular NCC, with an area of ca. 1,500,000 km2, is bounded by the CAOB to the north, Sulu UHP belt to the east, Qilianshan Orogen to the west, and Qinling–Dabie orogenic belt to the south and is one of the oldest cratons in the world ([10,11]; Figure 1a). The craton had a prominent peak of crustal growth activity during the Neoarchean ca. 2.5–2.7 Ga [12]. The amalgamation of the eastern and western blocks along the NS-trending Trans-North China Orogen is generally considered to have occurred during the late Paleoproterozoic ~1.85 Ga [13,14]. In ca. 1.32 Ga, a large number of tholeiitic diabase sills or dyke swarms constituted a mid-Mesoproterozoic large igneous province in the northern NCC [15]. The multiple-stage lithospheric thinning and destruction of the NCC started from the initiation of massive circum-craton Phanerozoic subduction and collisional orogenies. In the early Paleozoic, the Qilian oceanic plate subduction and collision with the Kunlun–Qaidam Block occurred [16]. In the late Paleozoic, closure of the Paleo-Asian Ocean and collision with the Siberia Craton happened along the northern margin of the NCC [17]. The deep subduction and collision of the Yangtze Block further destructed the NCC during the late Permian to Triassic [18]; subsequently, the Paleo-Pacific plate’s westward subduction or Yangzi Craton collision started in the Early Jurassic [19]. The Pacific plate’s ongoing westward subduction during the Cretaceous was the peak stage of decratonization.
The Chifeng–Chaoyang district occupies the eastern segment of the northern NCC, which is dominated by the EW-trending Chifeng–Kaiyuan fault, NE-trending Lingyuan–Beipiao fault and NNE-trending Honghan–Balihan fault (Figure 1b). The Chifeng–Kaiyuan fault divides the Hinggan–Mongolian Orogenic Belt (the middle and east part of the CAOB) from the NCC [20]. The Lingyuan–Beipiao fault, more than 1000 km in length, extends from Chengde to Beipiao city. The Honghan–Balihan fault consists of a ~3 km thick ductile and ductile-brittle shear zone passing upward into a ~100 m thick brittle chloritic breccia and a ~0.5 m thick microbreccia with fault gouges [20,21]. These compressional and shearing faults have existed since the Paleoproterozoic and have undergone multiple reactivations in the Paleozoic, Mesozoic, and especially the Yanshanian period [22]. The EW-striking faults are the earliest faults in the region, which are mostly cut by the later NE-striking faults. They divide the study area into several rhombic blocks where many gold and molybdenum deposits and granitoids have been discovered [22].
This district mainly consists of Precambrian basement rocks and Paleozoic to Mesozoic granitoids. The Precambrian basement rocks belong to the Neoarchean to Paleoproterozoic Jianping, Qianxi, and Zunhua groups, which consist of sedimentary and volcanic sequences and tonalite–trondhjemite–granodiorite (TTG) gneisses with different degrees of migmatization [22,23,24]. These successions were further metamorphosed to granulite phases ca. 2485 Ma and were retrograded to the greenschist phases ca. 2450–2401 Ma [23,25]. The Paleozoic rocks are distributed in the Aohanqi area, mainly belonging to a set of continental volcanic-sedimentary strata [22]. Mesozoic volcanic rocks are continental volcanic rocks which mainly consist of basalt, basaltic andesite, andesitic breccias, and tuff [26]. The Cenozoic strata are mainly residual slope and alluvial sands and loess-like sub-sandy soil.
More Triassic and Jurassic intrusions have been discovered through various dating methods (Supplementary Table S1 and Figure 1b). The intrusions in this area mainly comprise three NE-trending uplift belts, including the Kalaqin, Lunu’erhu, and Yiwulüshan metamorphic core complexes (MCCs) to the north and the Dushan composite batholiths, Xingcheng, to the south (Figure 1b). Triassic granitoids are mainly distributed in Kalaqin, Lunu’erhu, while the majority of Jurassic granites occur in the Xingcheng, Yiwulüshan MCC. The Triassic intrusions and dikes, including granodiorite, alkalic granite, and minor basic and ultrabasic rocks, are mainly distributed in the area of southern Chifeng and eastern Chengde city. The Dushan monzogranite-granodiorite, Dashizhuzi granite, Panshan monzogranite/granite, and Baizhangzi granite are well studied [27,28,29]. The EW-trending contemporaneous alkaline rocks belt consists of Hekanzi nepheline syenite, Guangtoushan alkaline granite, and Sungezhuang alkaline syenite [30,31,32]. The Jurassic plutons mainly consist of granite, granodiorite, and monzogranite exposed along regional faults, which present Qingshankou granite, Yu’erya granite, Niuxinshan granite, Jianchang–Jiumen monzogranite, Xiaojiayingzi batholiths, and Gaojiadian quartz diorite [33] (Supplementary Table S1). Generally, Triassic and Jurassic granitoids exhibit different preferences for emplacement locations [34]. Triassic granites are mostly discovered in the northern margin, close to the suture zone between the CAOB and NCC, while Jurassic granites are located in the southeast, where the area was affected by the westward subduction of the Paleo-Pacific Ocean plate.

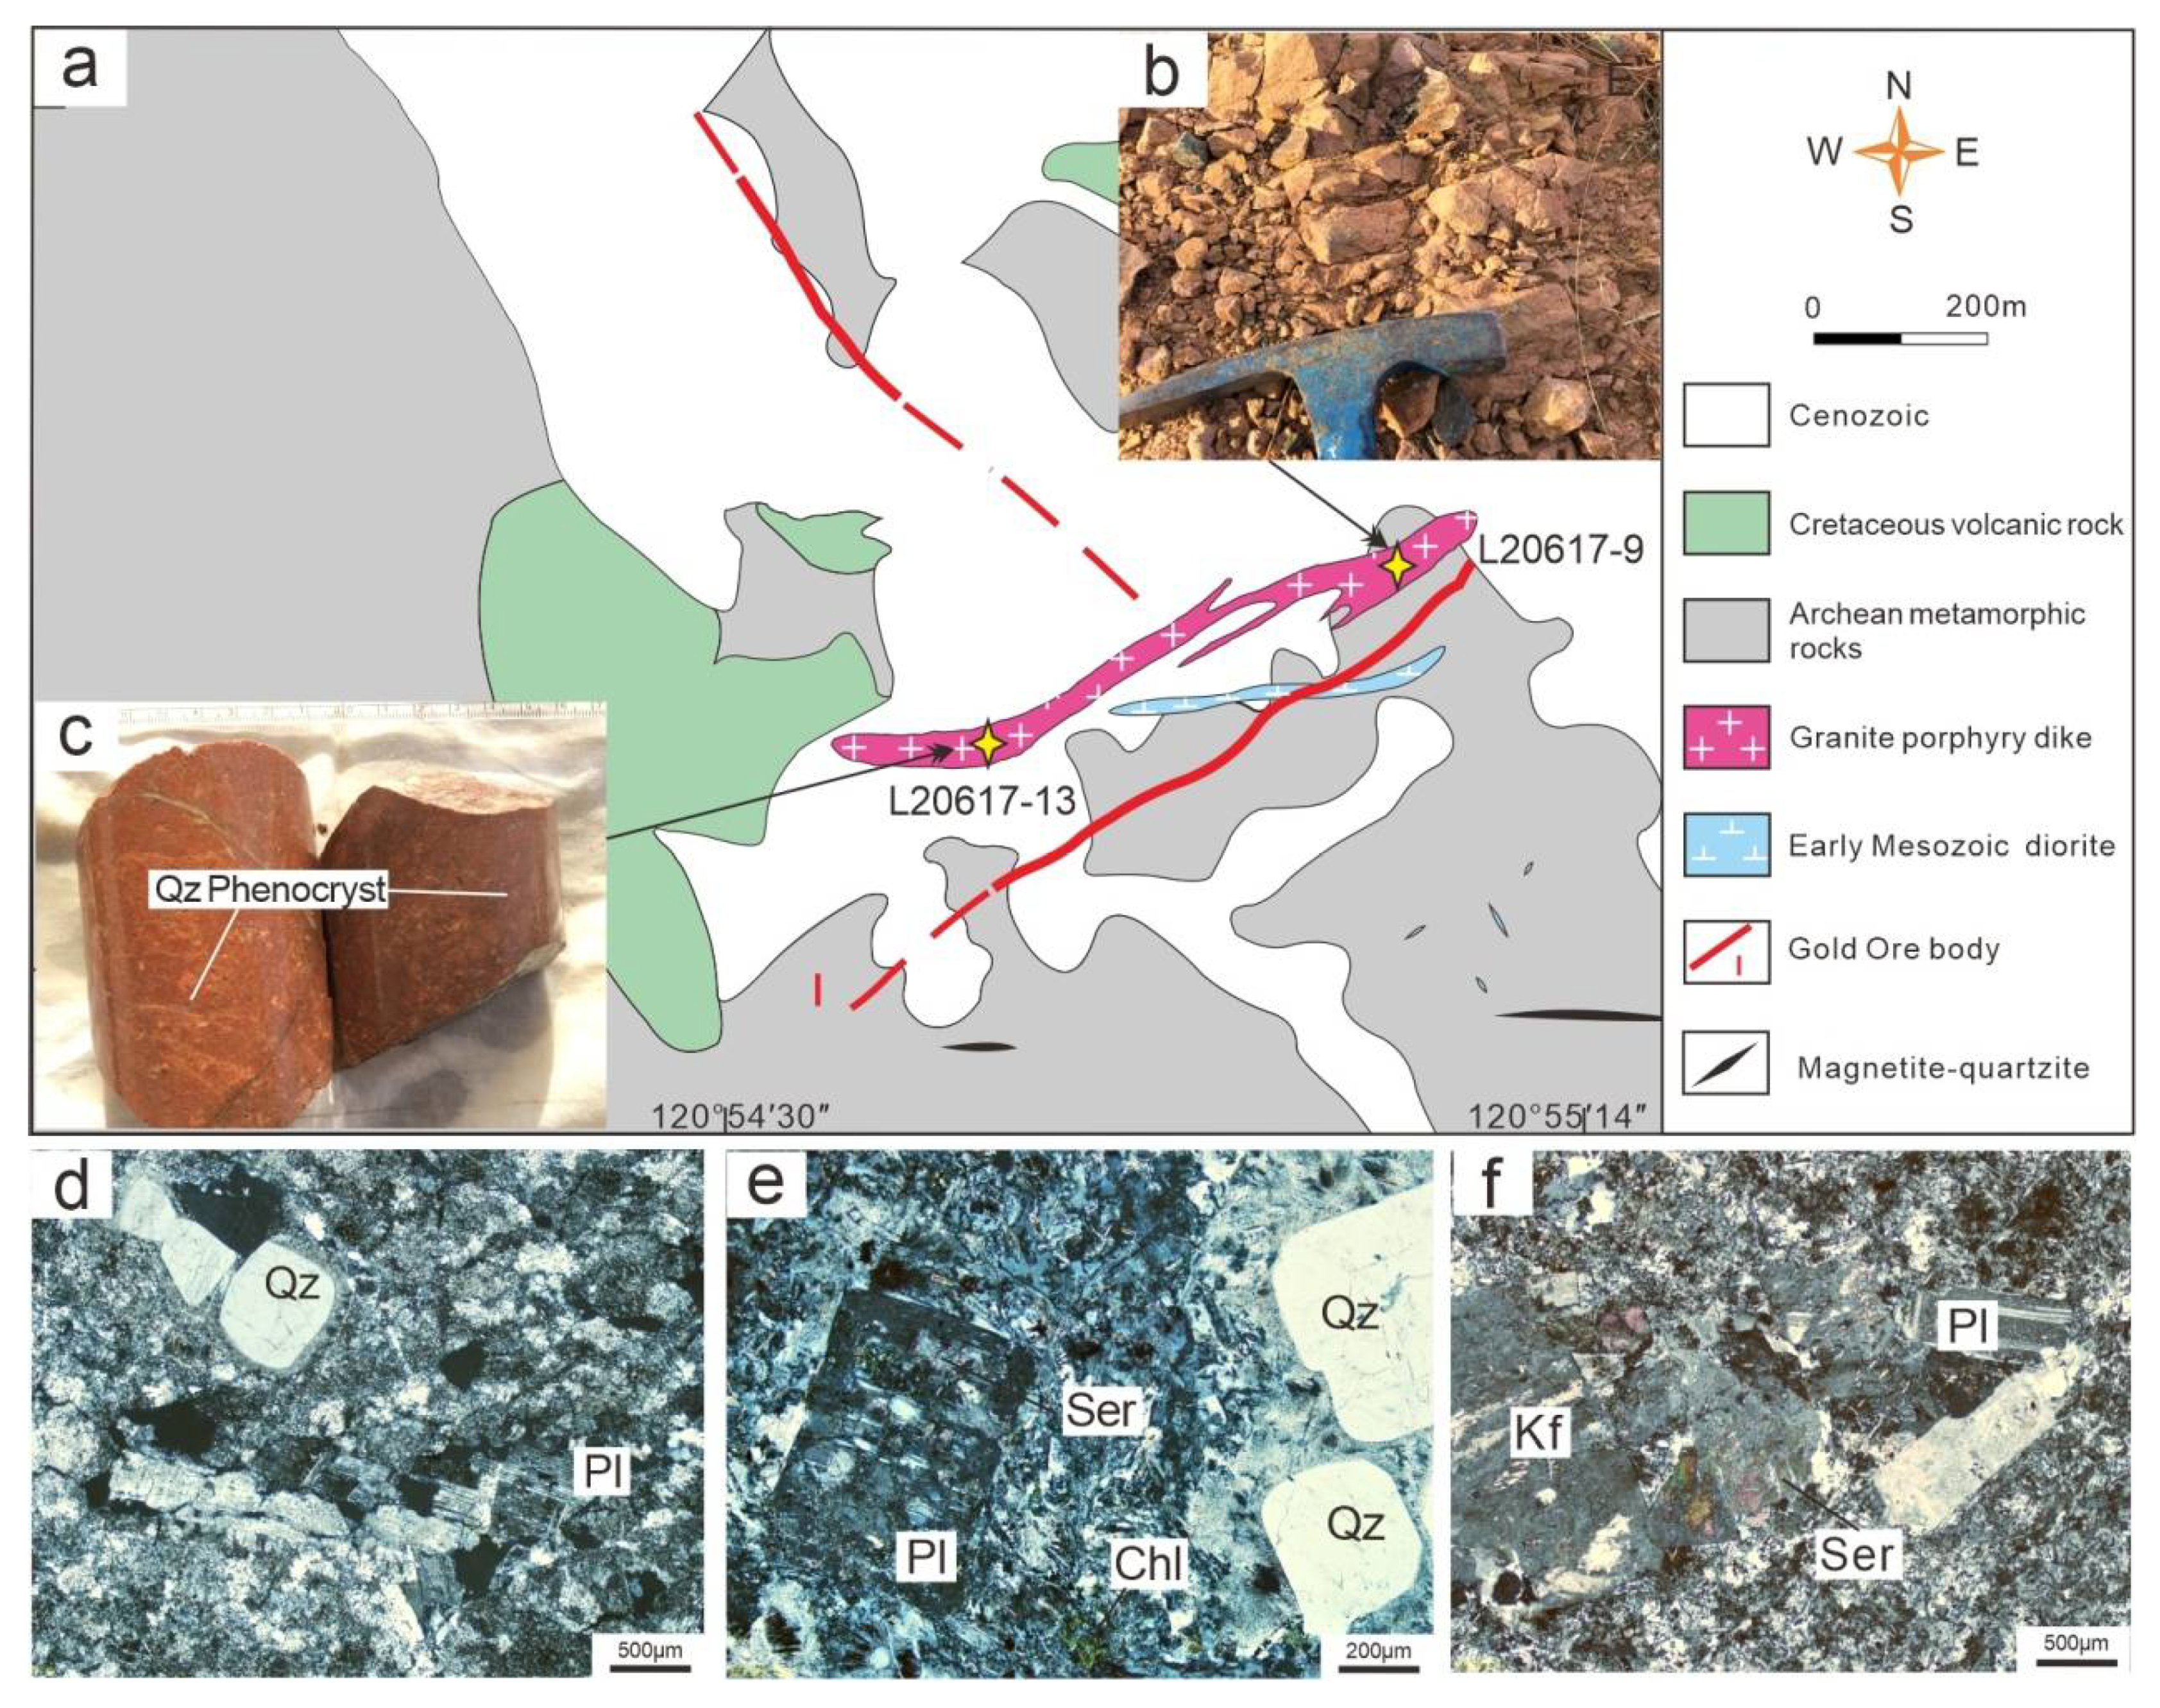
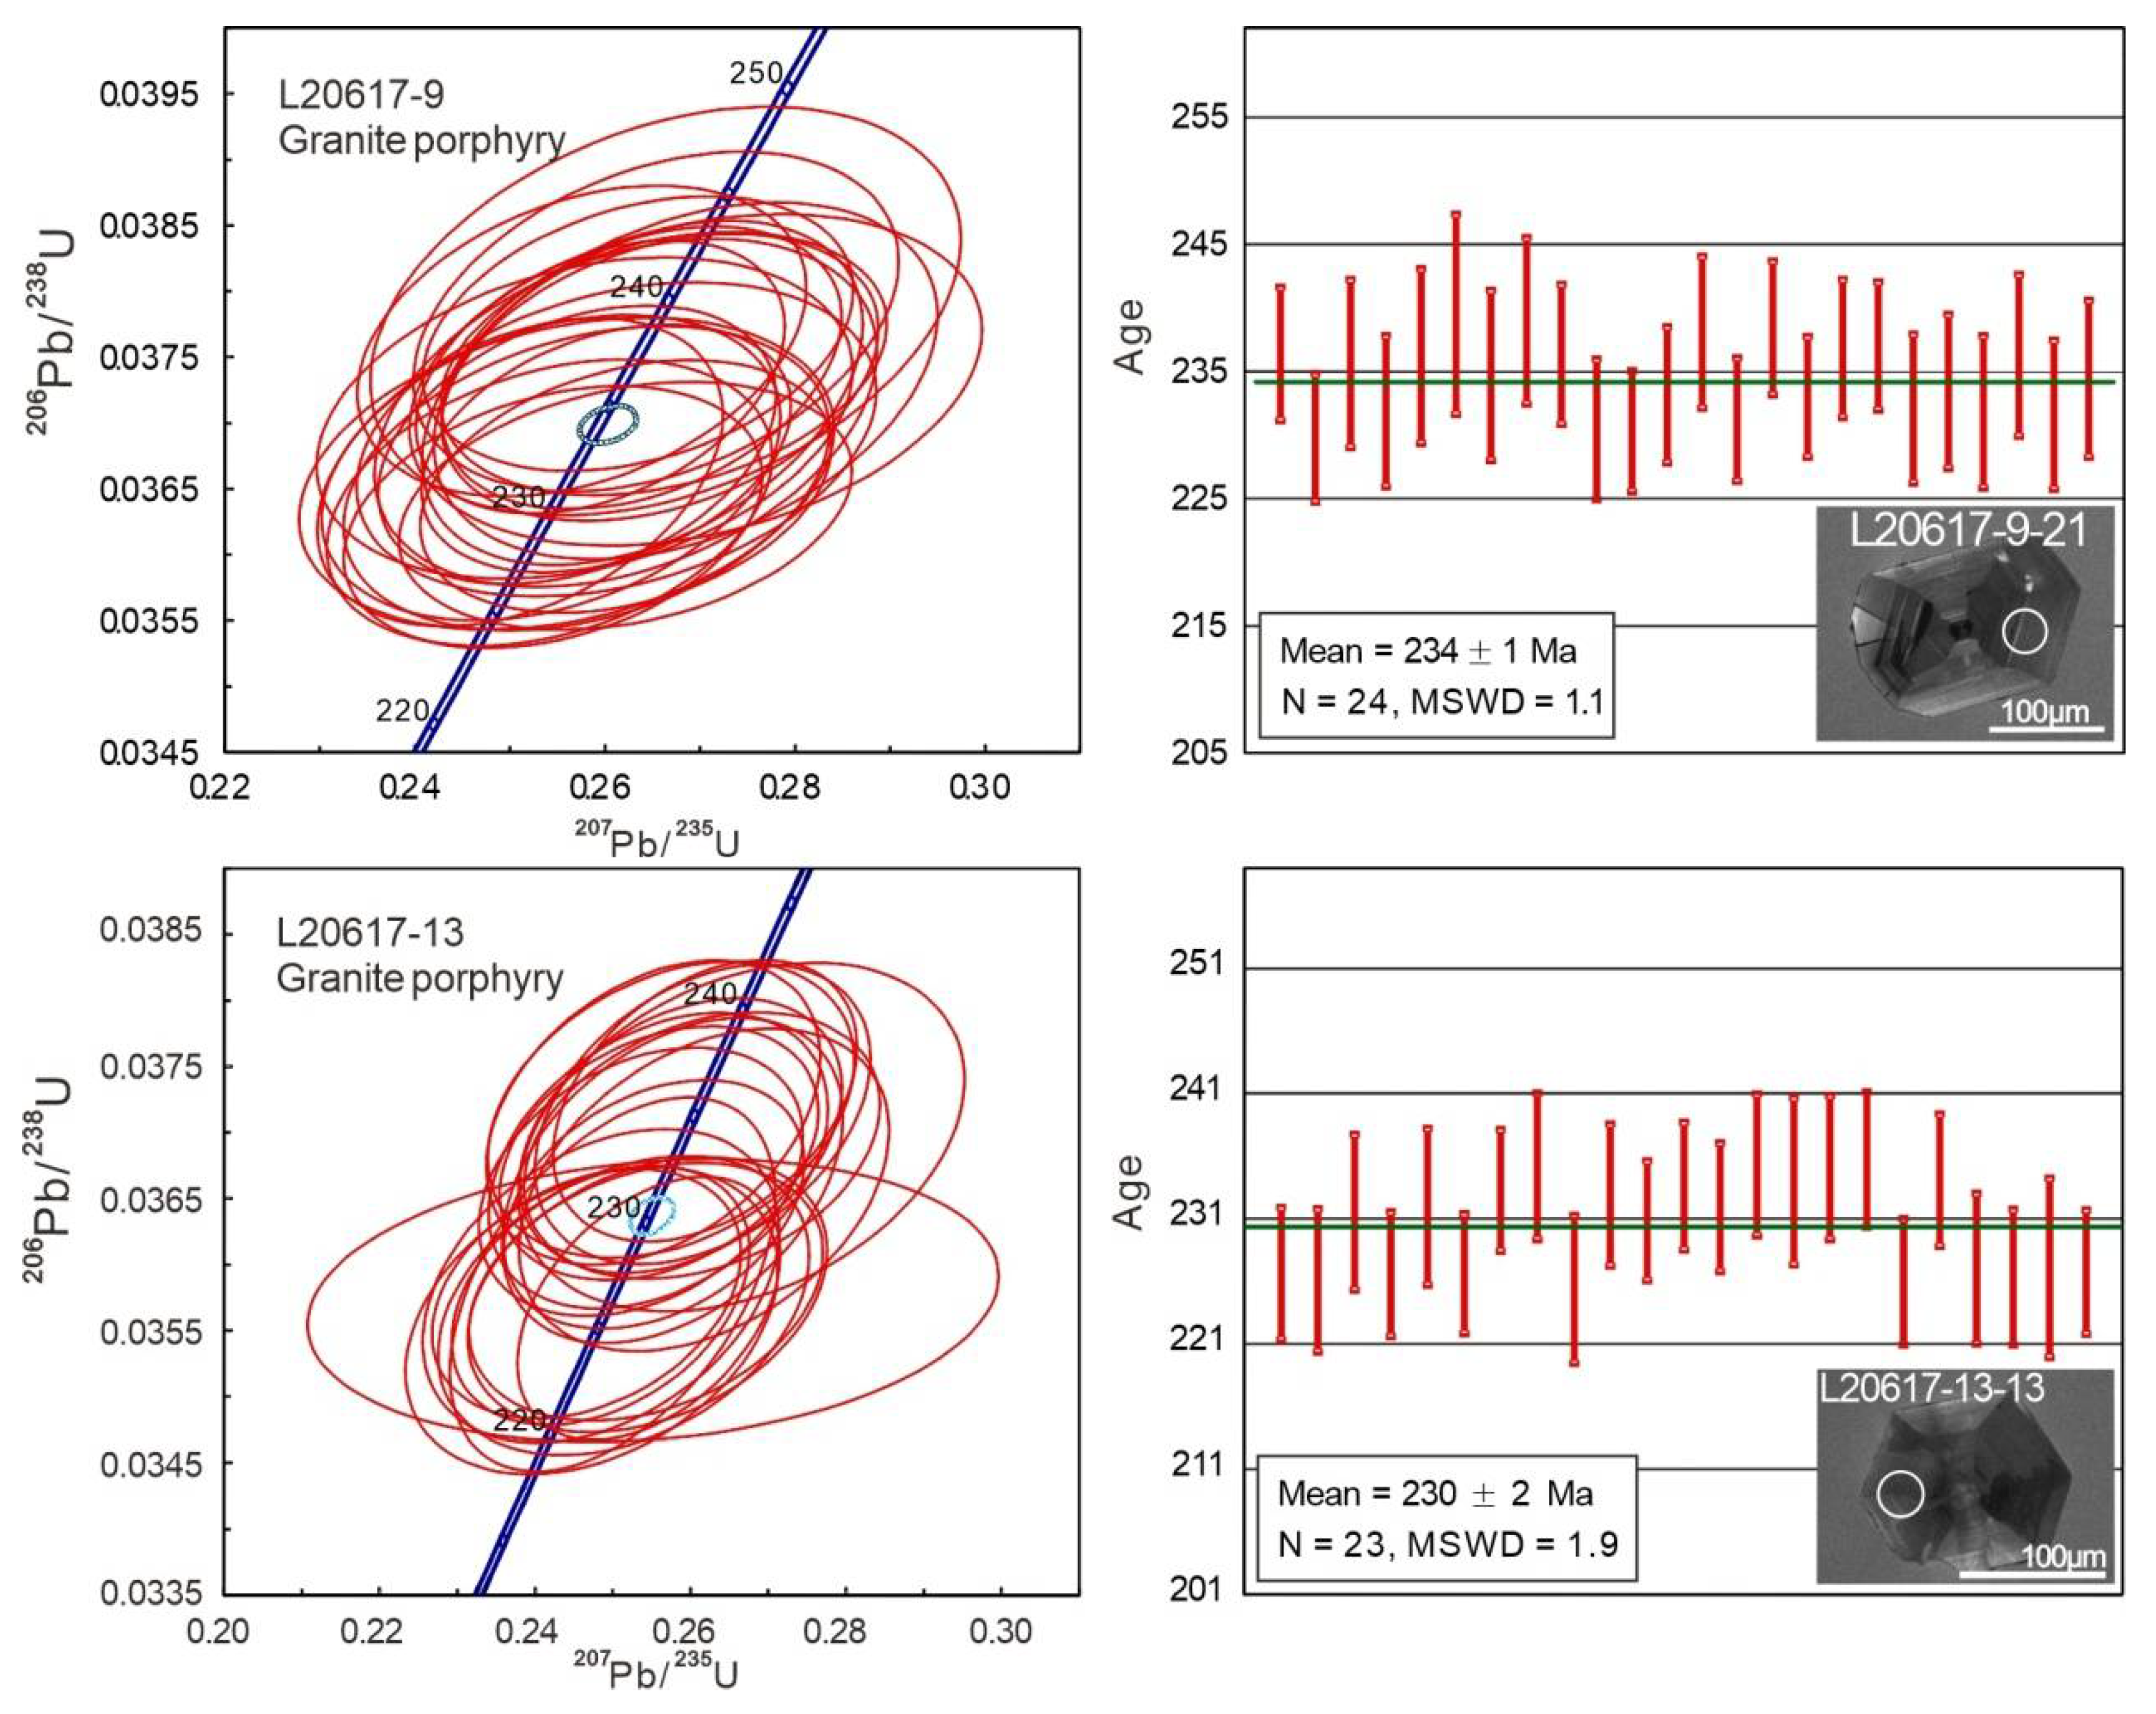
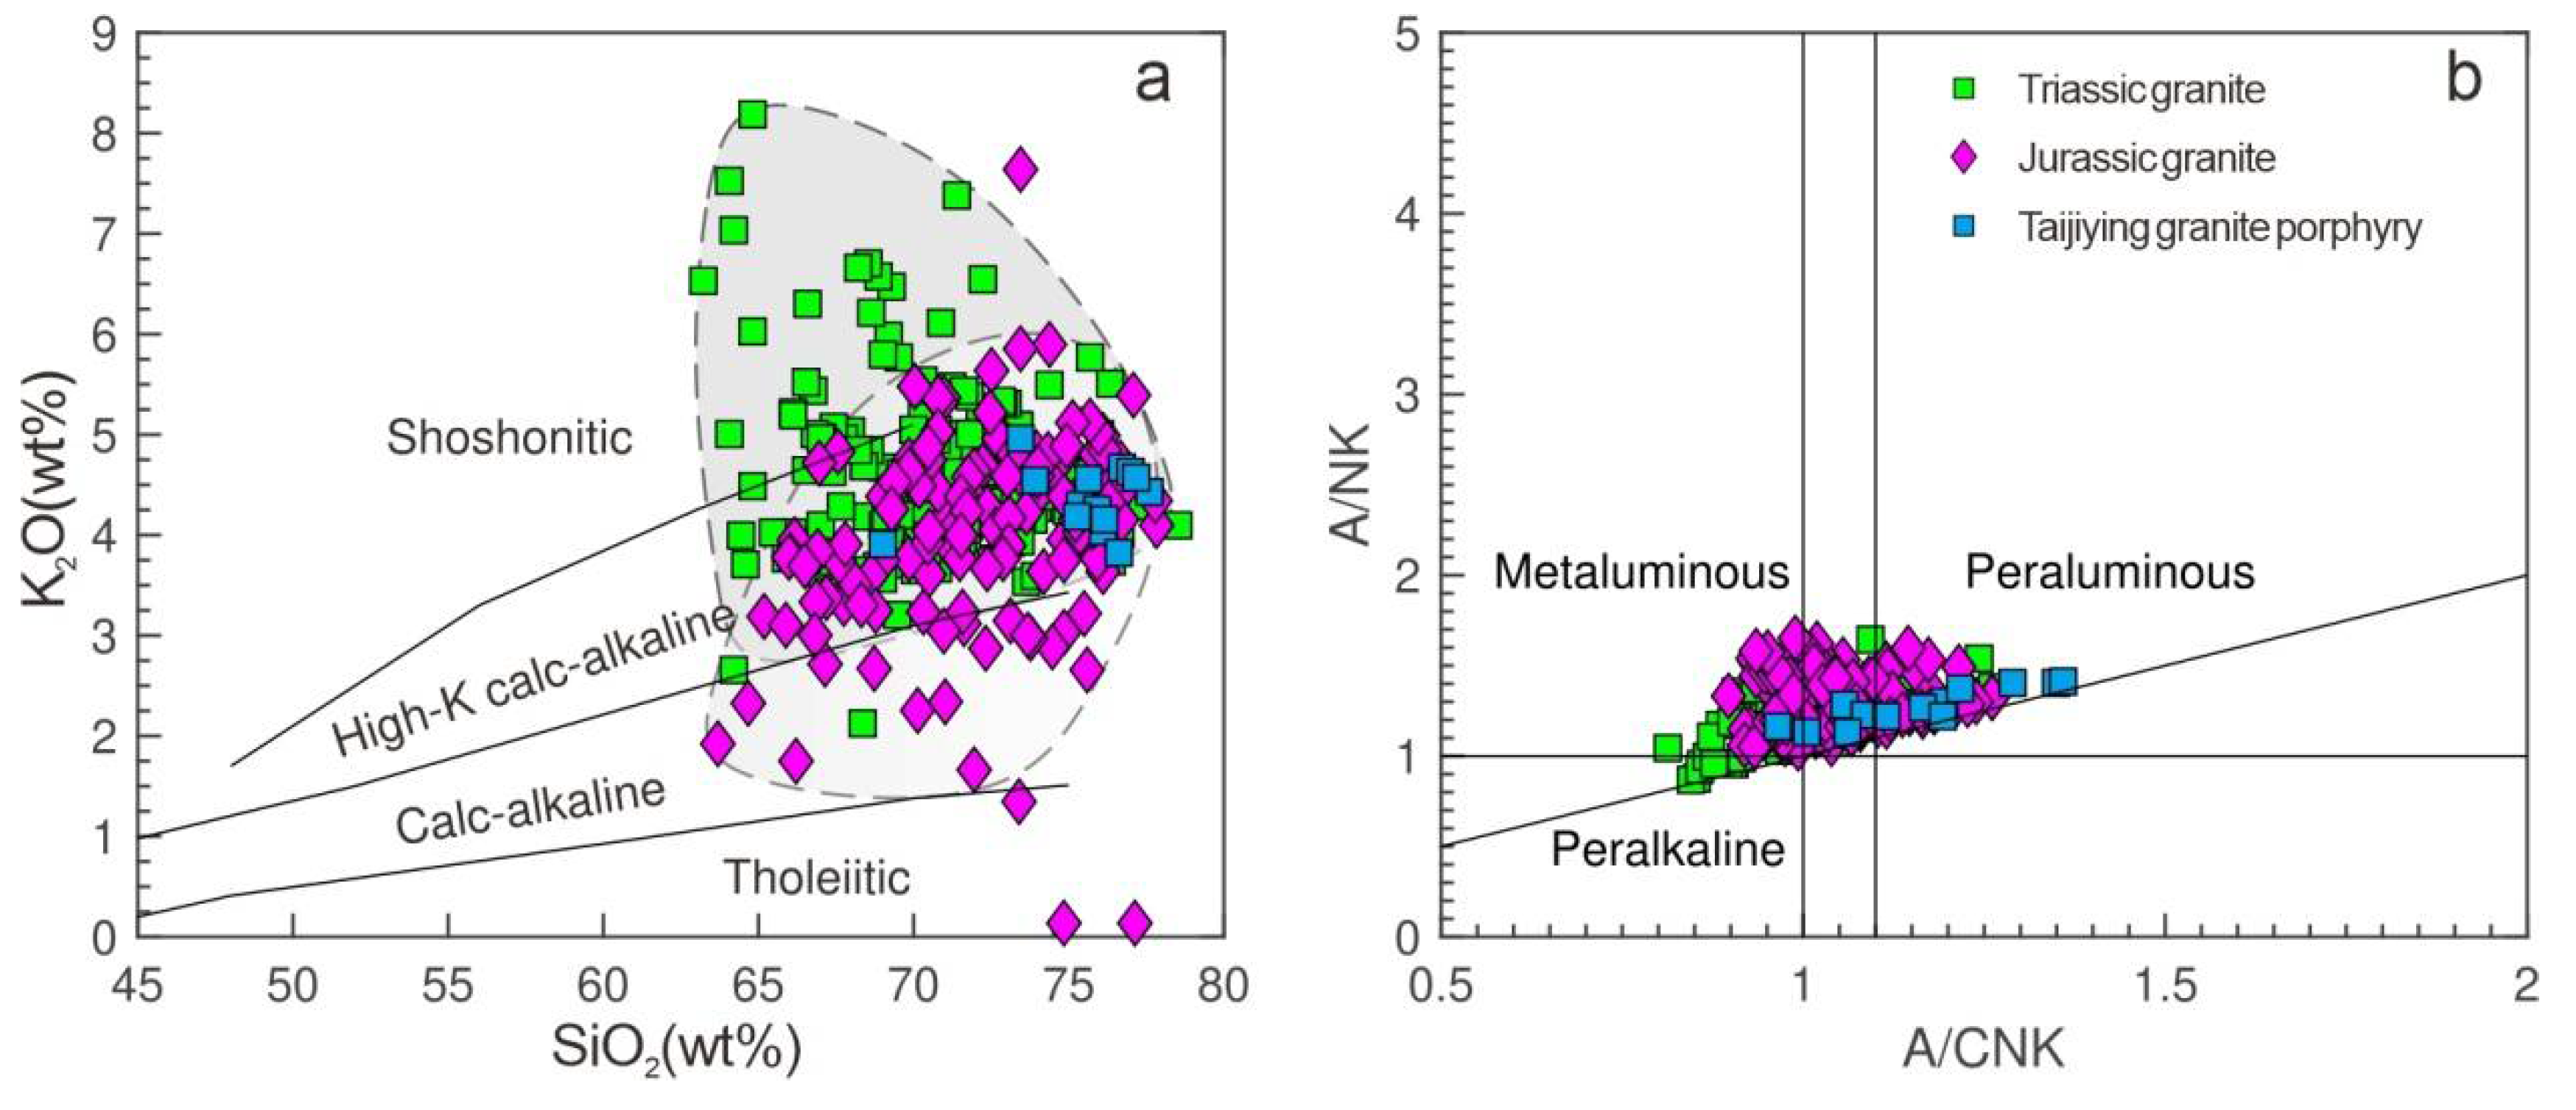
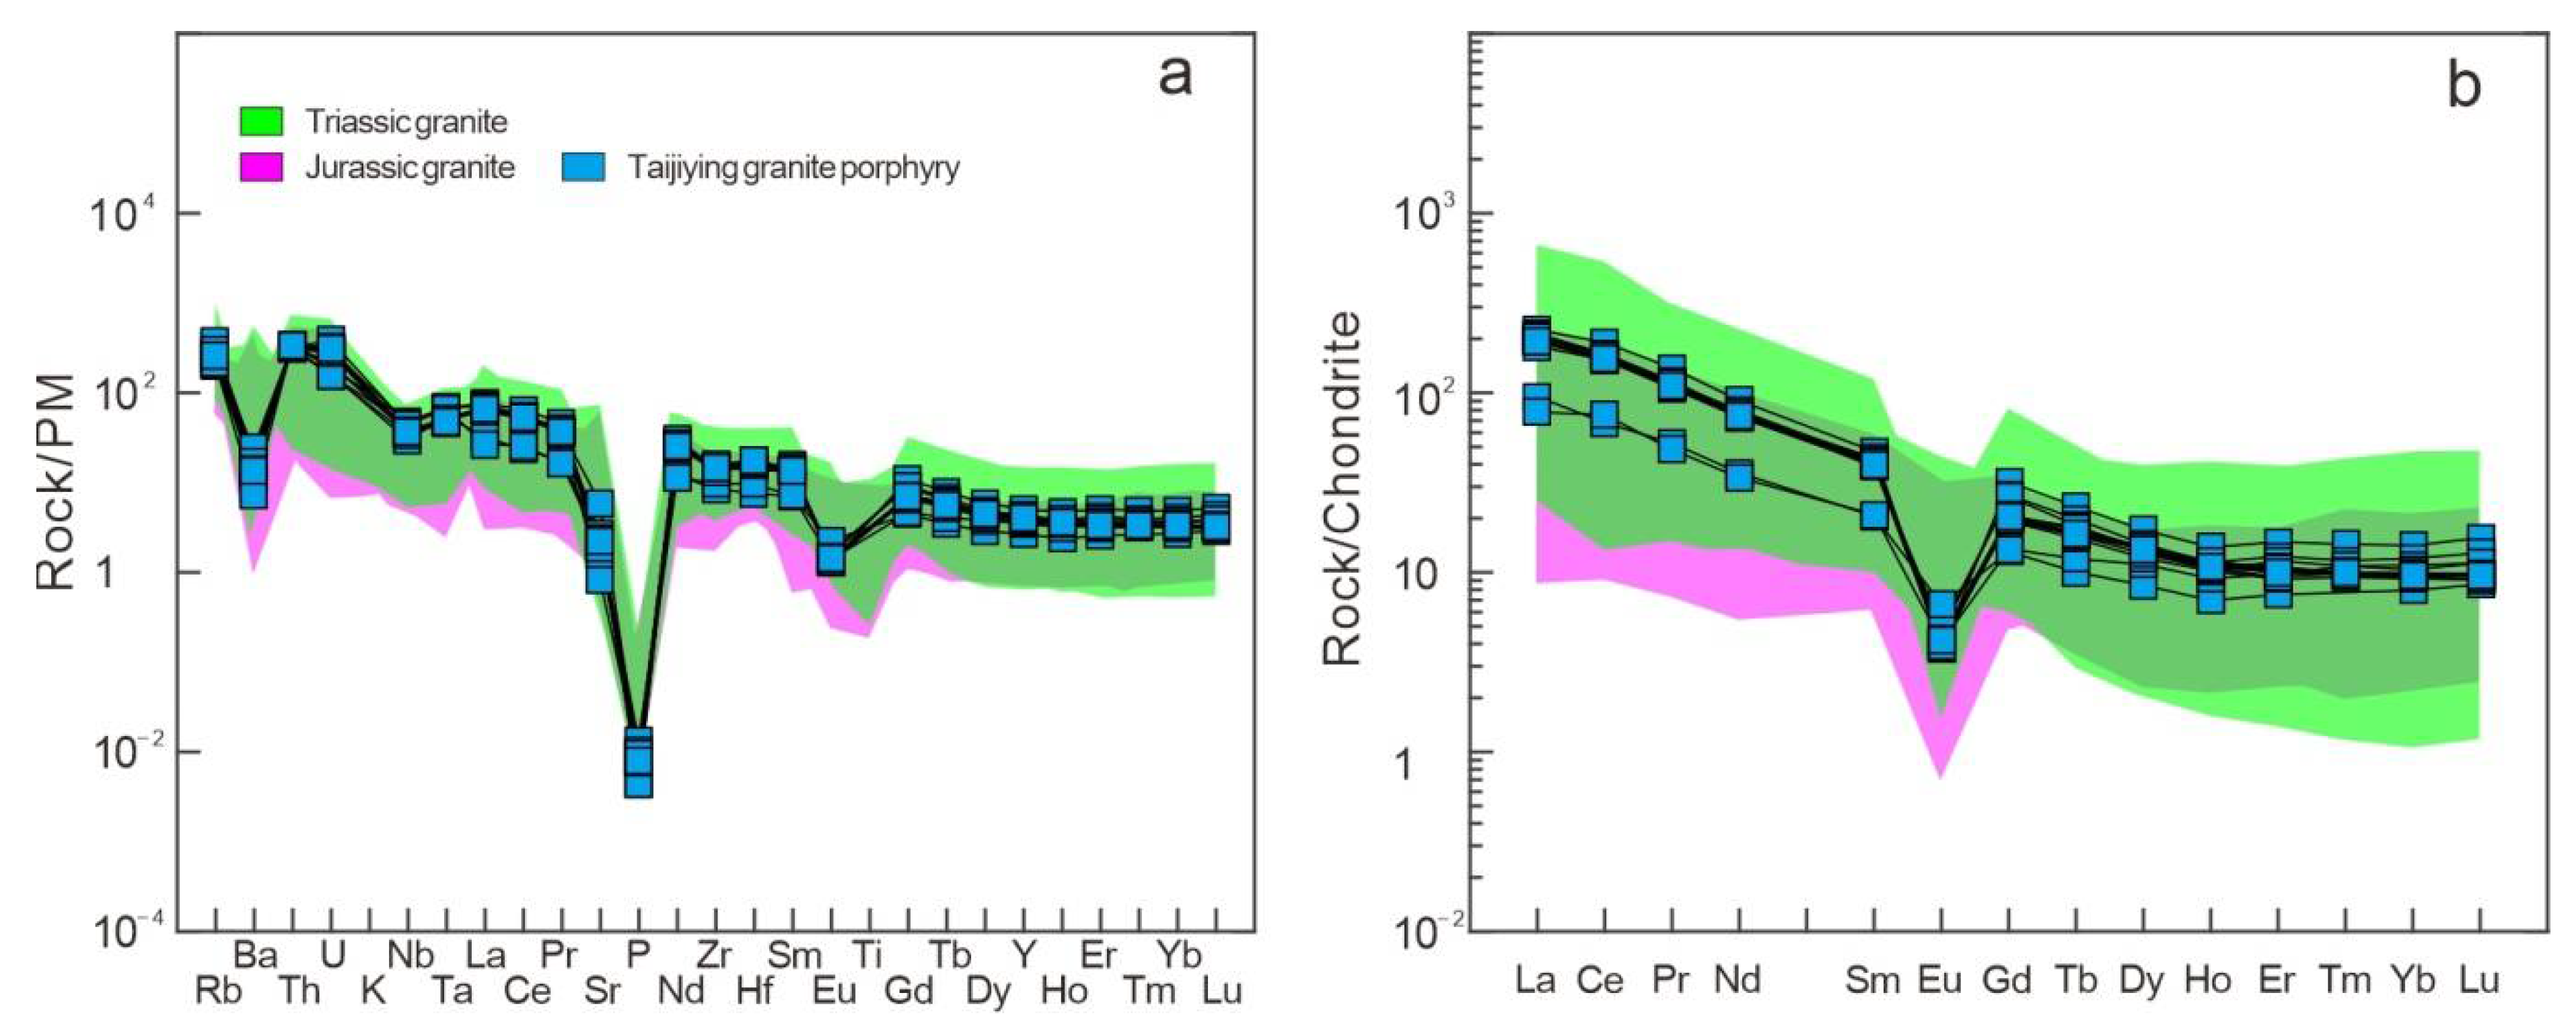
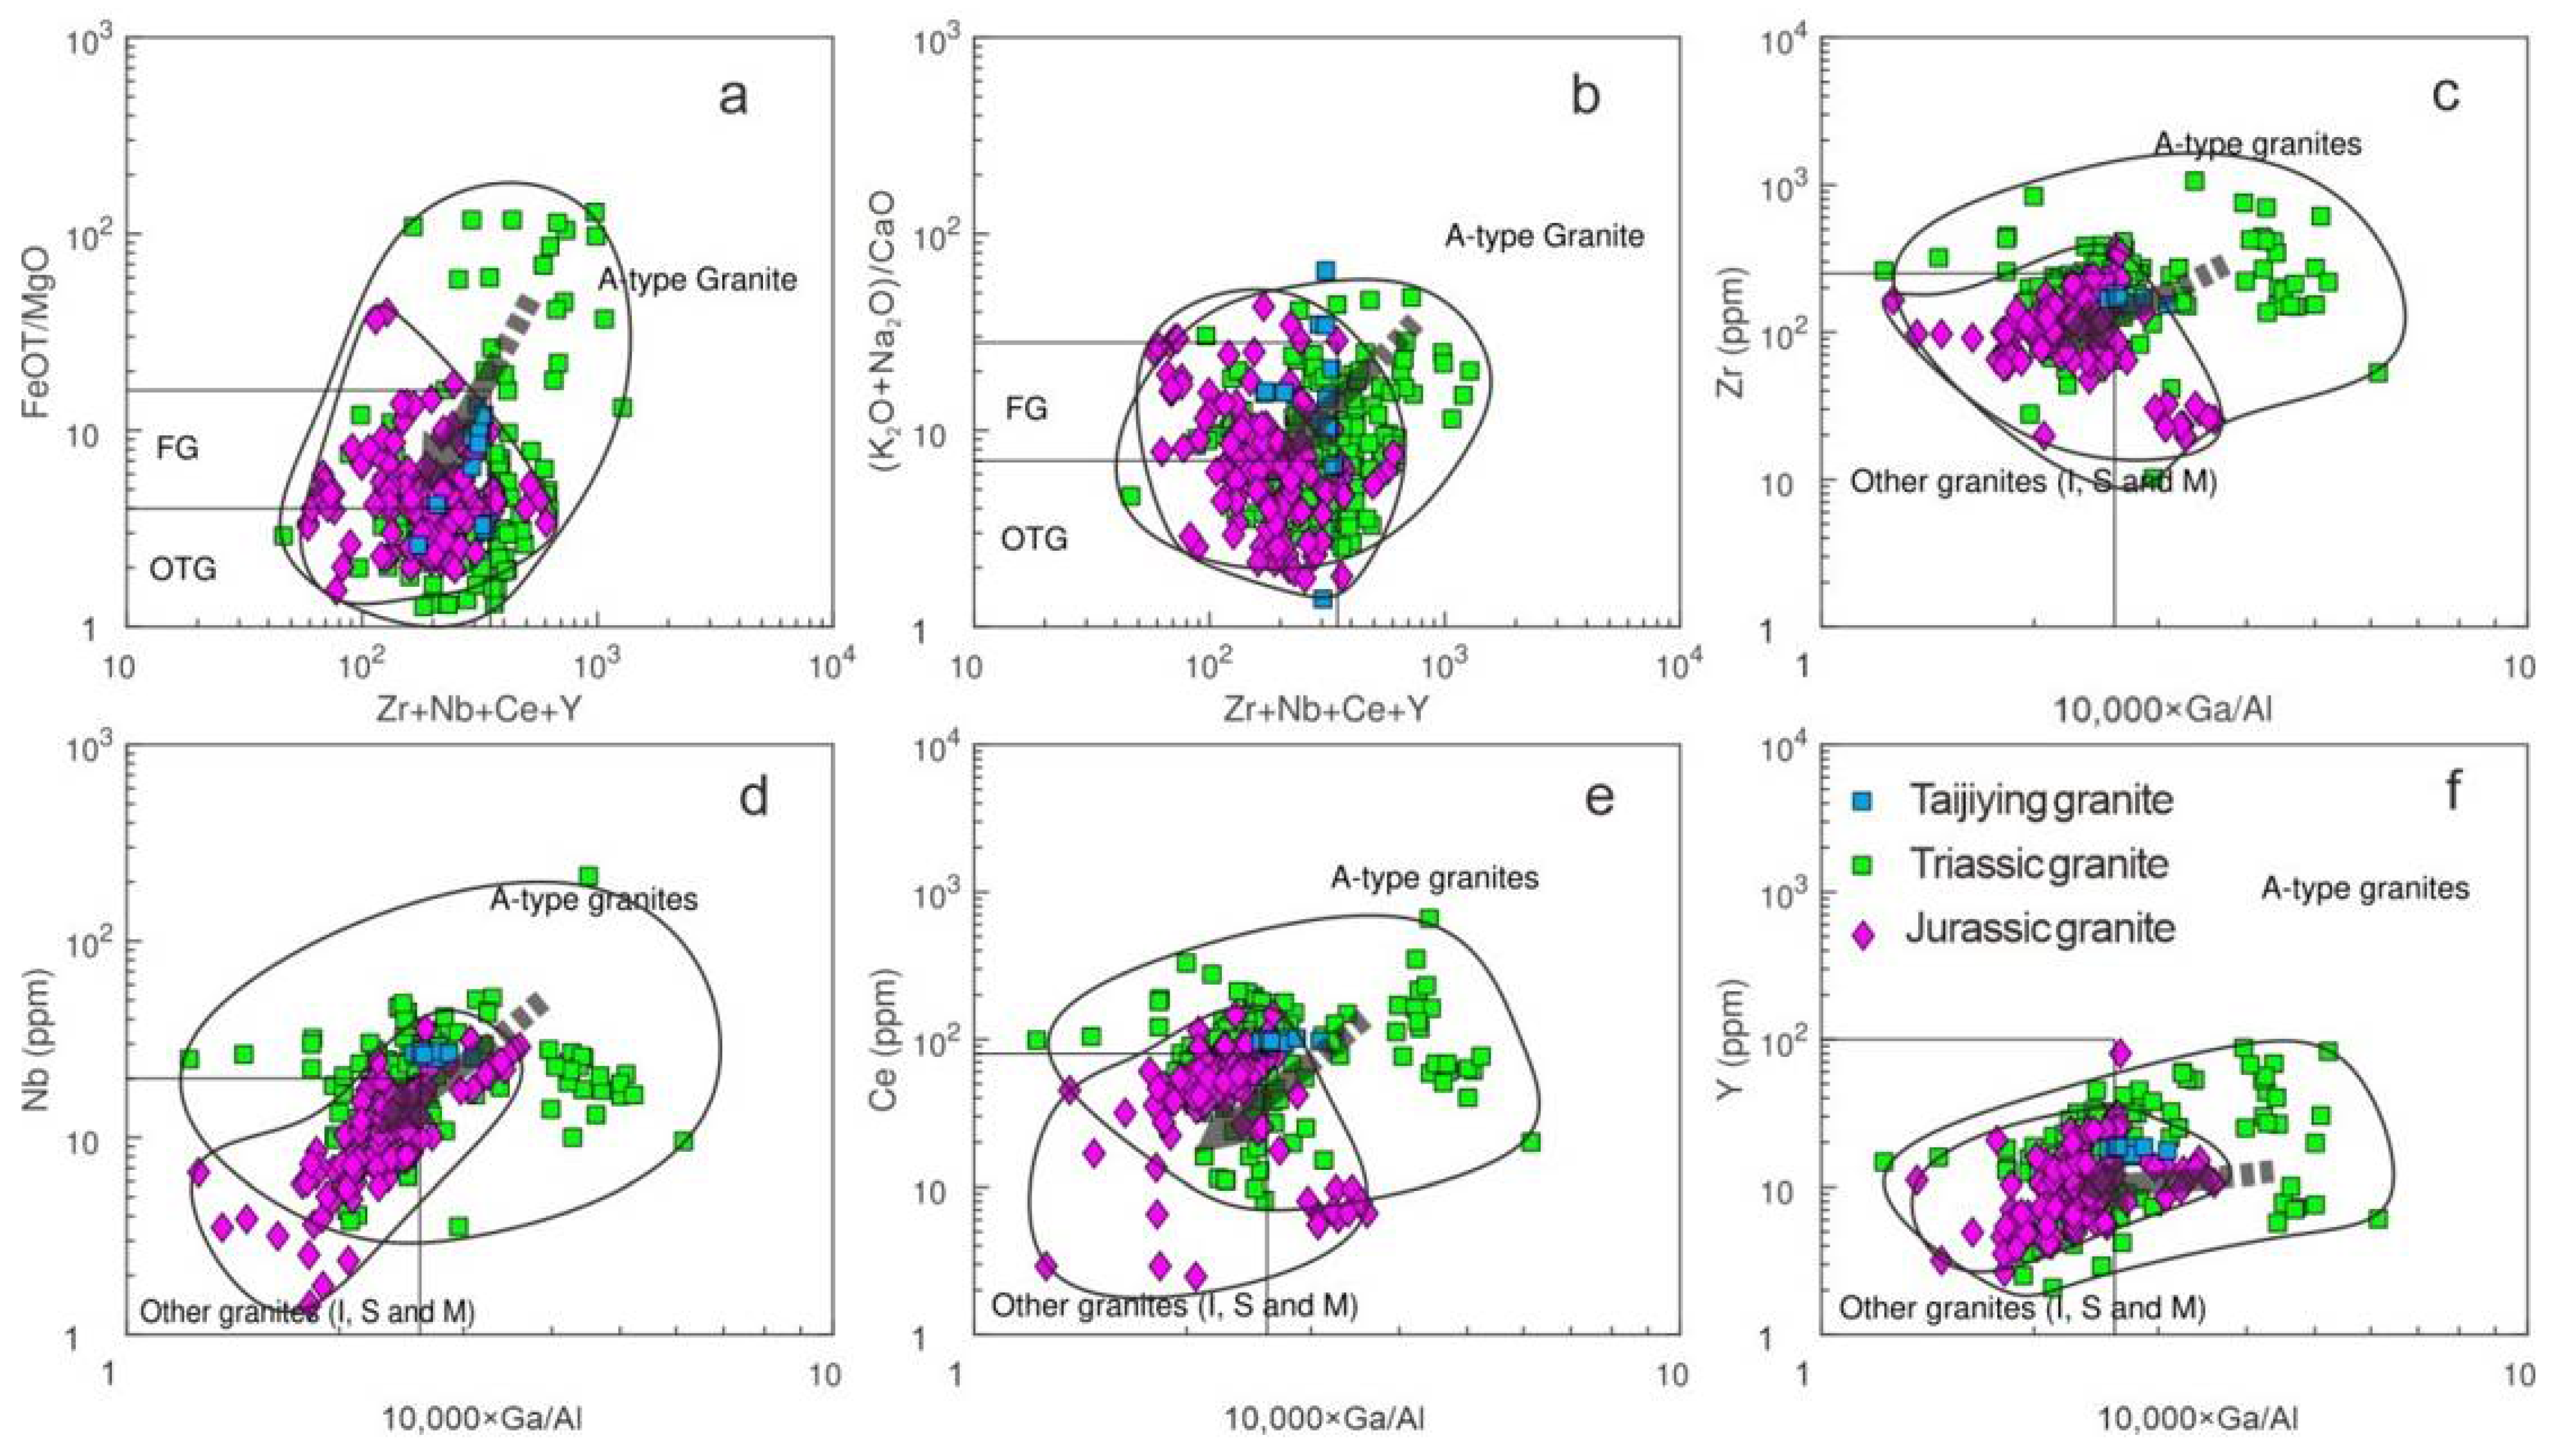
3. Sources and Gold Mineralization of Taijiying Granite Porphyries

The granite porphyries are characterized by high-silicon dike. They mainly consist of brick-red granite porphyry, which is closely related to Taijiying gold mineralization (Figure 2a–c). Field works and analysis displayed high grades of gold distributed along the granite dikes. Previous research also suggested that magmatism related to granite porphyries provided fluids and sources in the process of gold mineralization [7]. However, the kinds of source are still unclear. The outcrop is NE-trending with a length of ca. 800 m and a width of more than 10 m (Figure 2a). This dike intruded into the Archean metamorphic rocks and Cenozoic strata with clear contact lines. The granite porphyries have a medium-to-fine-grained porphyritic texture. Thirteen samples were collected from the drilling cores and outcrops. They mainly consisted of 30%–40% phenocrysts by volume (Figure 2d–f). The phenocrysts consisted of quartz (3%–5%), perthite (5%–8%), and platy plagioclase (ca. 1%). The quartz was generally euhedral or anhedral, 0.5–1.0 mm in size, and was surrounded by recrystallized groundmass. The perthite had clear streaks with argillic alteration. The plagioclase (0.2–0.5 mm) was euhedral with strong argillic alteration and slight sericitization. The minerals in the groundmass were mainly composed of felsic spherulites (70%–75%), plagioclase (8%–10%), sericite (5%–8%), and biotite (less than 1%). The plagioclase crystal was generally the center of spherulite and surrounded by the radially fibrous corpora.
The zircon U–Pb dating results of Taijiying granite porphyries are listed in Table 1. Concordia diagrams are shown in Figure 3. Sample L20617-9 and L20617-13 exhibited zircons similar in size with lengths of 110–240 μm and widths of 80–160 μm and ratios of 1:1 to 2:1. The Th/U ratios were slightly lower, with values of 0.57 and 0.60, respectively, and exhibited a positive correlation, reflecting their magmatic origin [35,36]. For sample L20617-9, 25 spots on 25 zircon grains were analyzed by LA-ICP-MS, and the results are plotted on concordia diagrams in Figure 3. All analyses were concordant except the spot L20617-9-02, which showed extremely low concordance for the influence of inclusion in the zircon grain. The others yielded a weighted mean 206Pb/238U age of 234 ± 1 Ma (95% confidence, MSWD = 1.1). In sample L20617-13, 27 spots on 27 zircon grains were chosen for measurement by LA-ICP-MS. The 23 analyses results were concordant and yielded a weighted mean 206Pb/238U age of 230 ± 2 Ma (95% confidence, MSWD = 1.9) which represented the emplacement age of the granite porphyry. Two granite porphyry samples had a weighted mean 206Pb/238U age ranging from ca. 230 to 234 Ma, suggesting that the emplacement of granitoid dikes occurred during the Middle Triassic period.
The geochemical results for the 14 Taijiying granite porphyry samples are presented in Table 2. The Taijiying granite porphyries had a high and narrow range of SiO2 contents (69.0–77.6 wt%), and their mean (K2O + Na2O) value was 7.47 wt%. They had low Fe2O3 (0.76–1.88 wt%), MgO (0.18–0.61 wt%), CaO (0.12–1.23 wt%), and TiO2 (0.09–0.12 wt%) contents. The samples were plotted in the high-K calc-alkaline field (Figure 4a). Al2O3 contents were concentrated in the range of 11.4 wt% to 12.6 wt% and were plotted in the metaluminous and peraluminous fields, with A/CNK values (molar ratios of Al2O3/CaO + Na2O + K2O) of 0.96 to 1.36, except the extremely low value of 0.58 (Figure 4b). In the Harker diagrams, the granite porphyries were plotted in a straight line (Figure 5). All samples exhibited light rare earth element (LREE) enrichment, with (La/Yb)N ratios of 7.6 to 22.0 (mean = 18.3) (Figure 6b). Several samples had high (La/Yb)N ratios of greater than 20, including L20617-7, L20617-8, and L20617-14. The samples of different ages all exhibited significant negative Eu anomalies, with δEu values of 0.10–0.40 (mean = 0.16). On the primitive, mantle-normalized trace element spider diagram (Figure 6b), all samples exhibited large ion lithophile element (LILE) (such as Rb and Th) enrichments and high field strength element (HFSE) (such as Nb, Ta) depletions with negative Ba, Sr, Eu, Nb, Ta, and P anomalies. These granite porphyries were plotted between the A-type and I-type granite fields in Figure 7. It was difficult to distinguish between fractionated I-type granites and A-type granites due to their similar features. However, based on the lower zircon saturation temperature (mean = 810 °C) and FeOT/MgO ratios (mean = 7.5), it is reasonable to conclude that the Taijiying granite porphyries are fractionated I-type granites.
The granitoids had high silica contents and low MgO, FeOT contents and La/Yb, Sr/Yb ratios (Figure 8), suggesting that they were mainly derived from the partial melting of crustal materials. The isotopic data provided good constraints on the source of the Taijiying granite porphyries (Table 3). They had low initial 87Sr/86Sr ratios (0.7031 to 0.7078), concentrated εNd(t) values (−1.2 to 1.7), positive zircon εHf(t) values (+3.5 to +10.7, mean = +6.7), and relatively low δ18O values (6.29 to 7.84, mean = 6.85) (Figure 9 and Figure 10), which indicate that mantle-derived material played a critical role. The positive εHf(t) values also suggest that the Taijiying granite porphyries have not experienced extensive mixing of an ancient continental crust endmember. However, there was some reworking of ancient crustal material in the source based on the negative εNd(t) values. The Taijiying rocks had similar TDM2 (0.87–1.09 Ga) and TDMC (0.58–1.04 Ga) ages, which indicate that the sources were derived from the depleted mantle and evolved into basaltic low crust during the Neoproterozoic. The basalts were altered by Archean seawater which increased the zircon δ18O values (Figure 10). The granitic magma rapidly ascended into shallow magma chambers by partial melting and finally formed the Taijiying granite porphyries. The plagioclase surrounding quartz phenocrysts indicate rapid emplacement and cooling of the magma (Figure 2d–f).
A previous study proposed that the Taijiying gold deposit is spatially and temporally related to these Triassic granite porphyries [7]. The magmatic hydrothermal fluids evolving from the granitic magmas provided not only metals and fluids but also the external heat to promote the gold-rich fluids upward, leading to the deposition with mixed features of the magmatic and meteoric fluids.

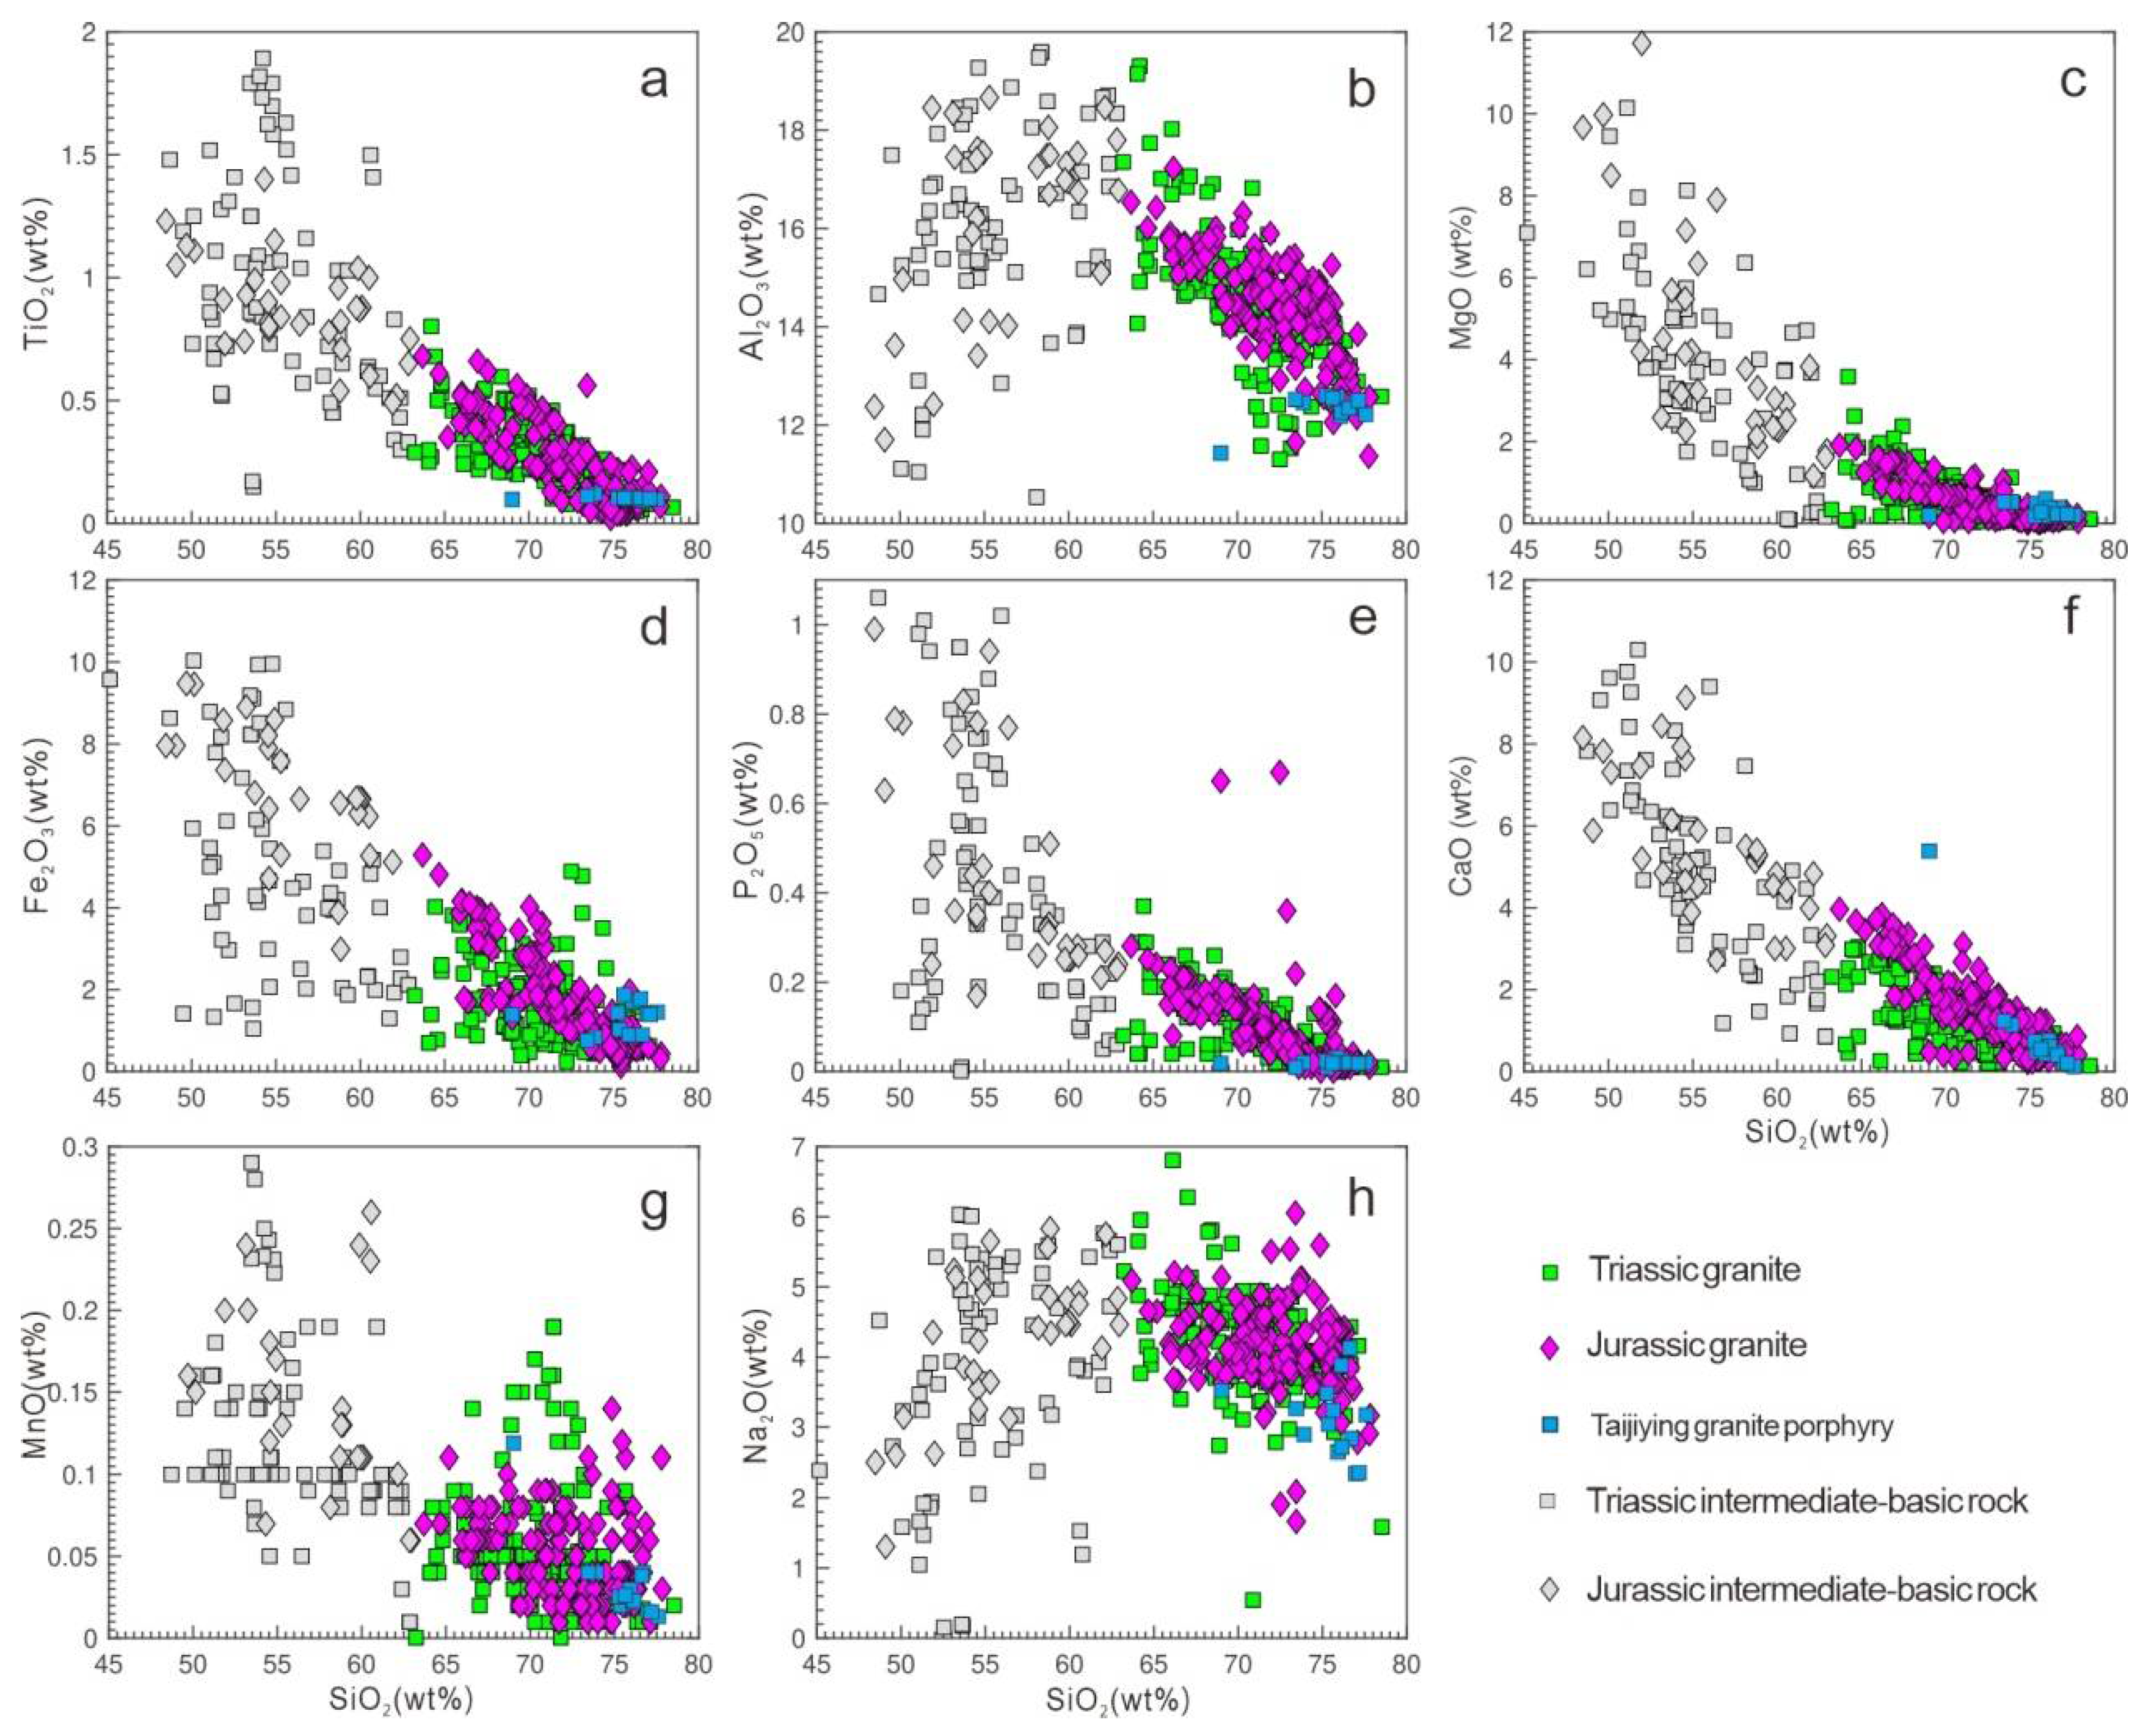
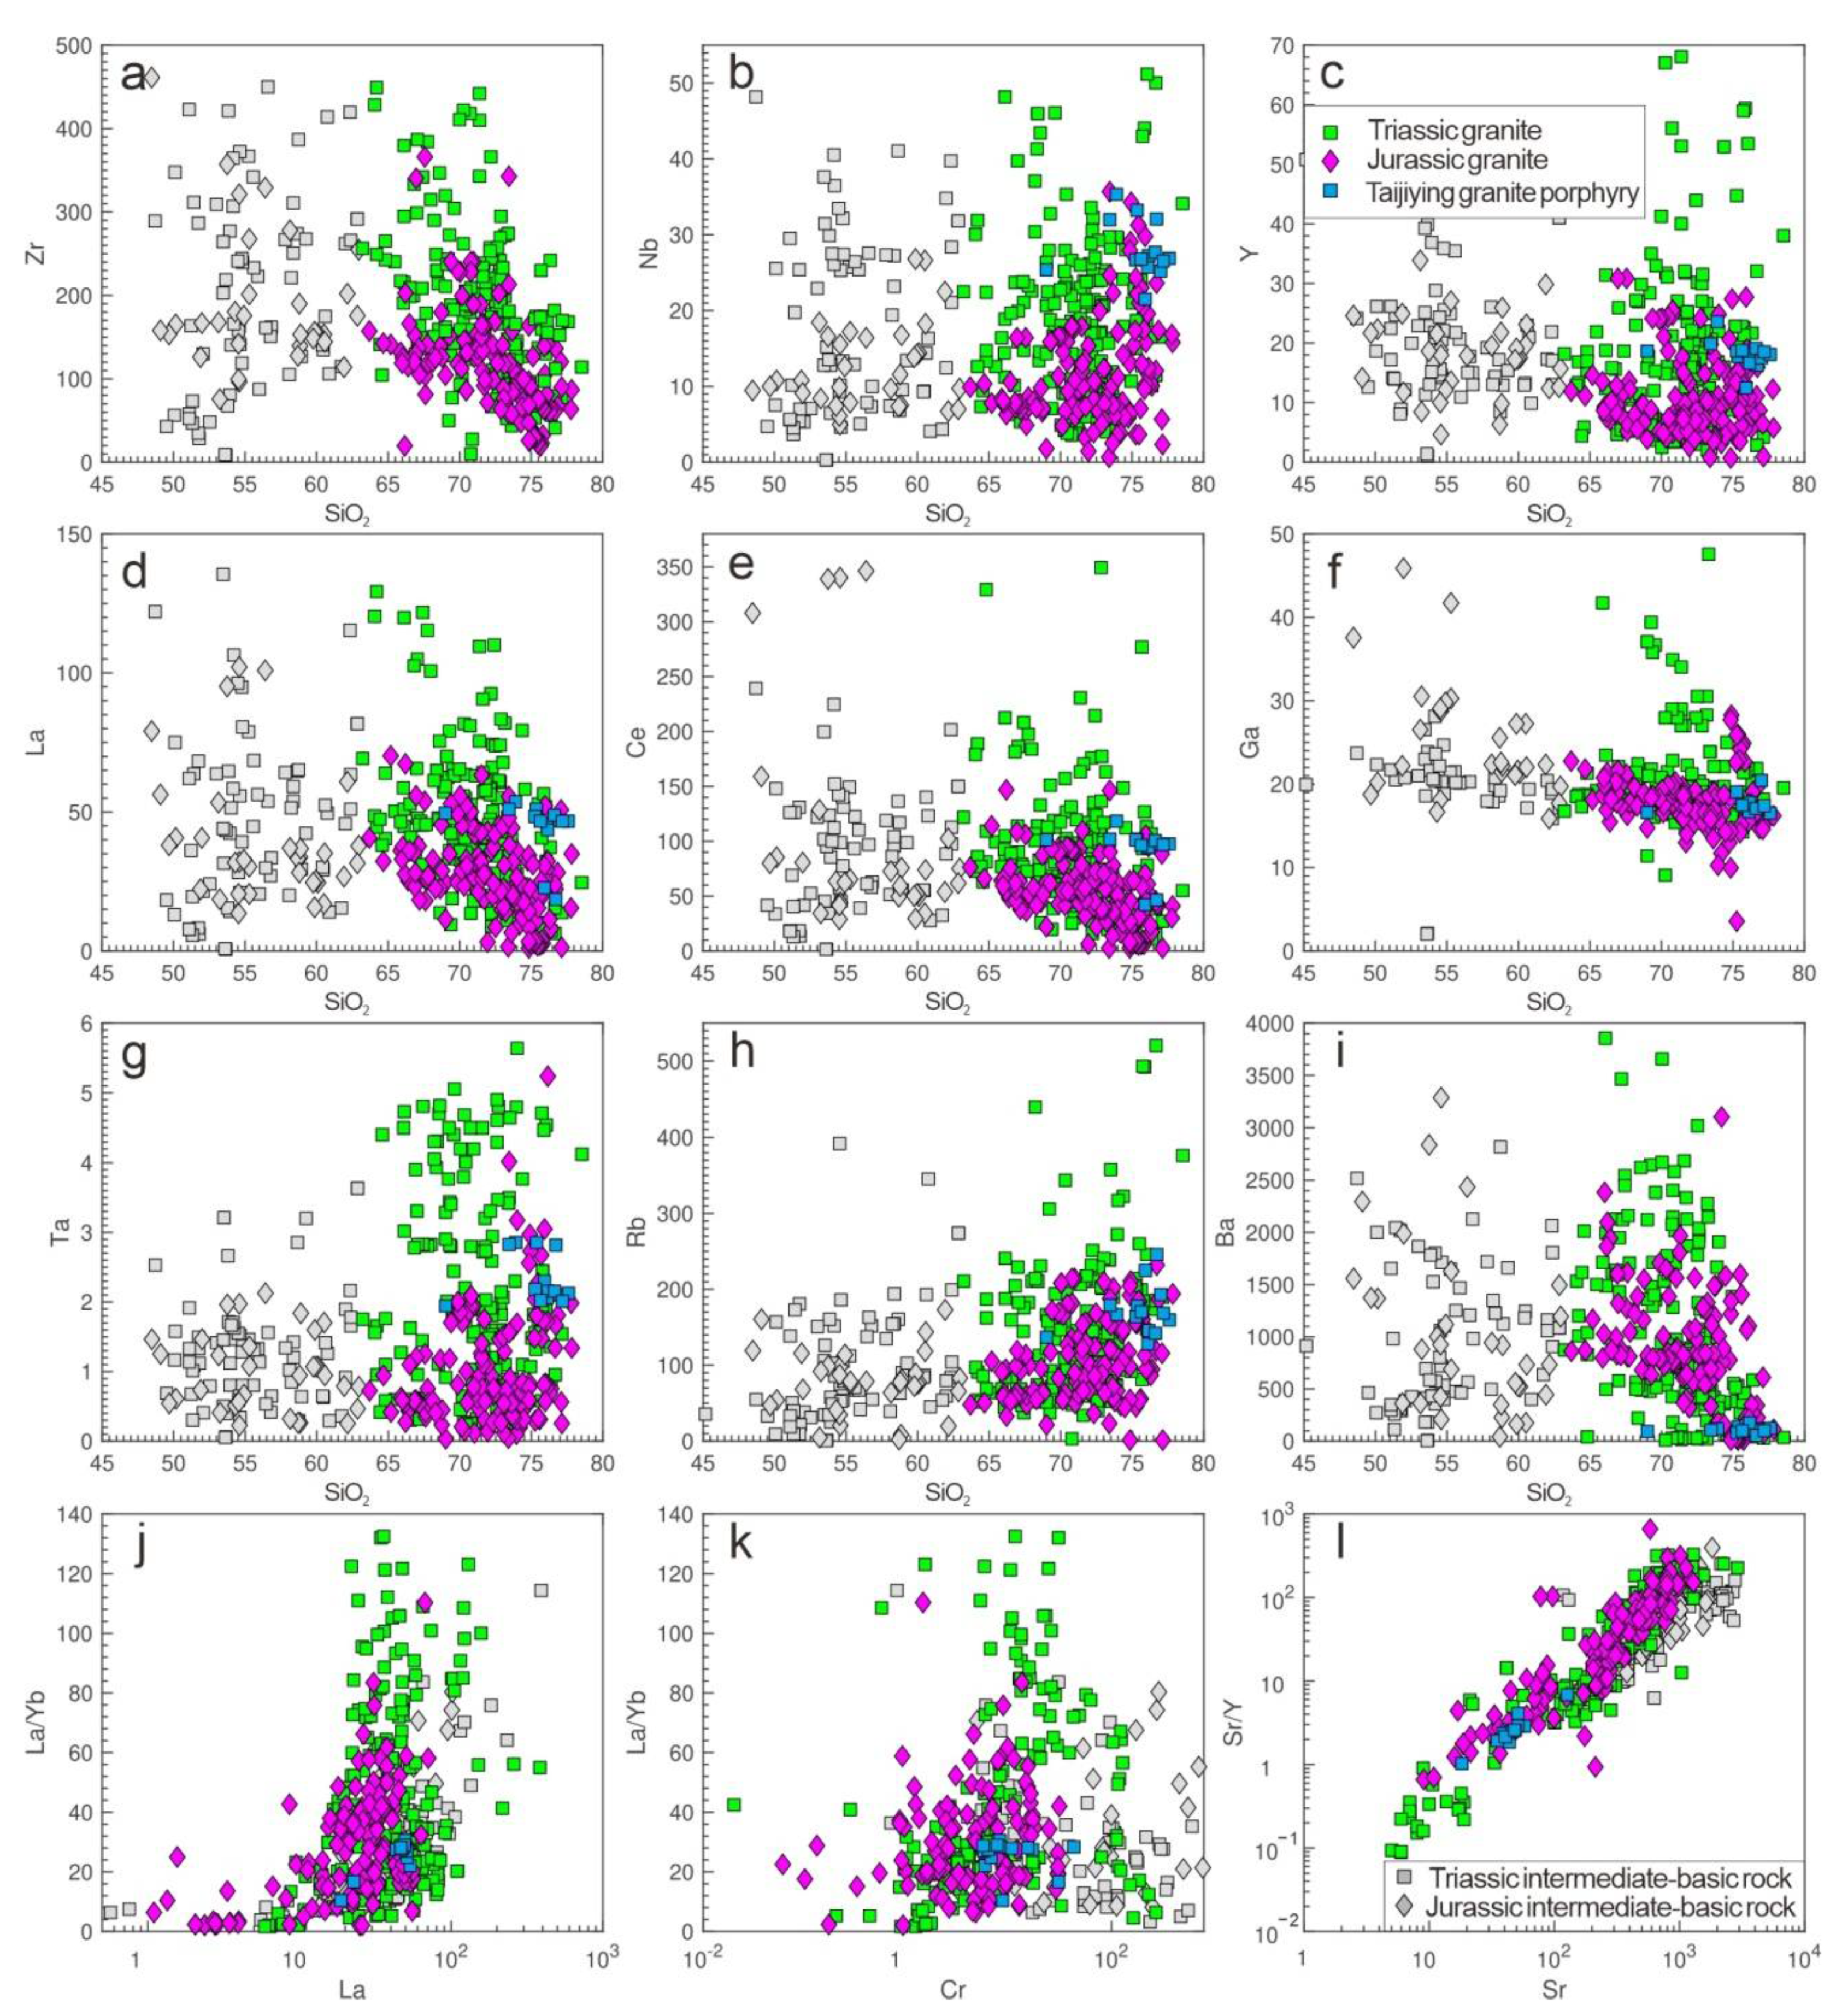
4. Geochemical Characteristics of Triassic and Jurassic Granitoids

The Chifeng–Chaoyang district includes Kalaqin, Lunu’erhu, Haitangshan–Yiwulushan, Xingcheng, and Dushan in the northeastern NCC, which produced large volumes of Triassic and Jurassic intrusions. The metals and fluids of orogenic gold deposits and porphyry molybdenum deposits all came from felsic magma which became granites. There are close relationships between granites and deposits. This paper compiles the data from the published literature for 208 Triassic–Jurassic granitoids related to these deposits (Supplementary Table S1). The data set contains whole-rock major and trace elements for 352 samples, Sr–Nd isotopic data for 113 samples, zircon Hf isotopic data for 36 samples (709 points), and O isotopic data for 10 samples (147 points). These data are presented in Supplementary Tables S2 and S3.

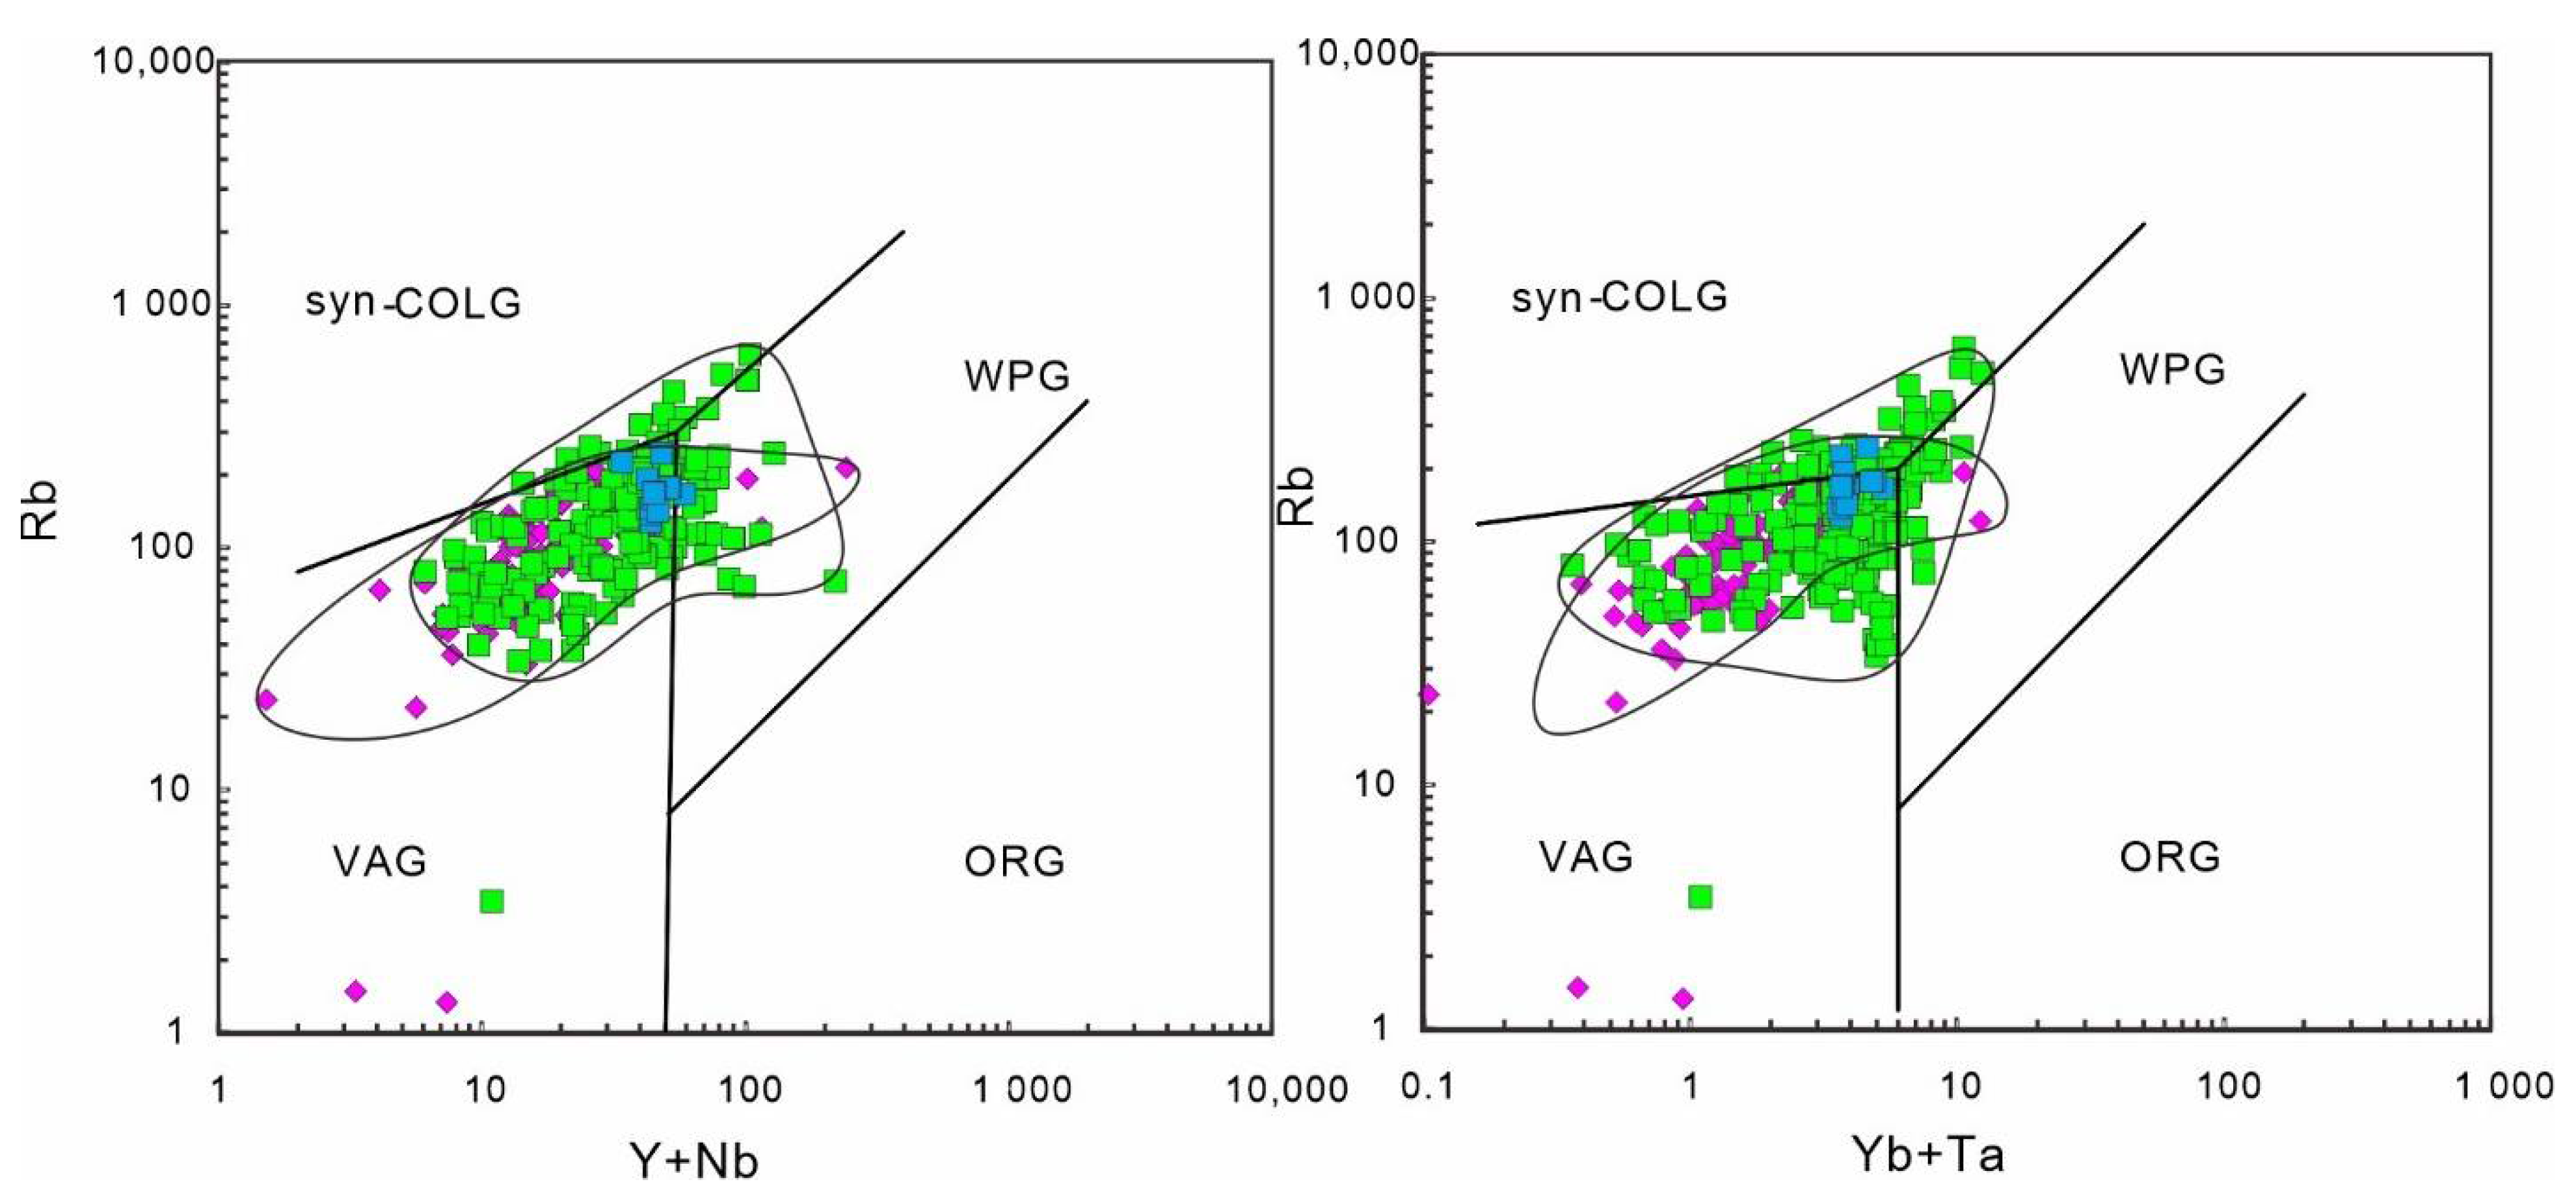
4.1. Triassic Granitoids

The compiled data for the Triassic granitic rocks exhibit a wide range of major element concentrations. They have high SiO2 (63.2–78.6 wt%) and Al2O3 (11.3–19.3 wt%) contents and low MgO (0.03–2.62 wt%), Fe2O3 (0.24–4.88 wt%), CaO (0.14–3.05 wt%), Na2O (0.54–6.80 wt%), K2O (2.13–8.18 wt%), and Na2O/K2O (mean value = 0.9, mostly < 1) contents. They all have low Mg#, with a mean value of 32.26. Most samples are high-K calc-alkaline series with a small portion plotted in the shoshonitic field in the SiO2 vs. K2O classification diagram (Figure 4a) [43]. Most samples are metaluminous or weakly peraluminous in the A/NK vs. A/CNK diagram (Figure 4b). In the Harker diagrams, TiO2, Al2O3, MgO, Fe2O3T, P2O5, and CaO decrease with increasing SiO2, but MnO and Na2O exhibit ambiguous correlations with SiO2 (Figure 5).
The Triassic granites exhibit low Sr/Y ratios (mean = 53.7) and Sr contents (mean= 402 ppm) (Supplementary Table S2). They are characterized by high La/Yb ratios (1.6–132.5) and Nb (3.56–213 ppm), Cr (0.02–271 ppm), Y (2.07–87.0 ppm), Zr (10.17–1060 ppm), and Th (0.90–1233 ppm) contents. In the diagrams (Figure 8), the Sr, Zr, and Ba contents tend to decrease with increasing SiO2, while the Nb and Y contents are not correlated with SiO2.
The Triassic granitoids have variable total rare earth element (REE) contents, ranging from 34.0 to 1048 ppm (mean = 195). The Kalaqin batholiths monzogranite (06JH47R) has the highest REE values [8]. Except for a few samples with positive Eu anomalies (δEu = 3.37–1.00; e.g., Dushan, Nanhouding, and Hekanzi) [32,44], they mainly exhibit slight-to-strong LREE enrichment (LaN/YbN = 1.1–95.1) in chondrite-normalized REE patterns and have significant, negative Eu anomalies with δEu values of 0.04–0.99 (mean = 0.72) (Figure 6b). In the primitive, mantle-normalized diagrams (Figure 6a), most of the samples, including the Taijiying granite porphyry, exhibit Ba, Sr, Nb, Ta, P, and Ti depletions and Th and U enrichments.
According to their relatively high Zr, Nb, Y, La, Ce, and Ga contents (Figure 8a–f), the majority of the Triassic samples are likely A-type granites. In the FeOT/MgO and (K2O + Na2O)/CaO vs. (Zr + Nb + Ce + Y) diagrams (Figure 7a,b), most of the Triassic samples are plotted in the A-type granite field or near the boundary between the A-type and fractionated/unfractionated granite fields. Furthermore, the K2O + Na2O, molecular [K2O + Na2O]/Al2O3, Nb, and Zr vs. 10,000 Ga/Al classification diagrams also show that the samples straddle the transitional fields between A-type and M-, I-, and S-type granites (Figure 7c–f) [45]. Therefore, the Triassic granites consist of both I-type and A-type granites.

4.2. Jurassic Granitoids

Compared to the Triassic granitoids, the Jurassic samples exhibited similar SiO2 contents (63.7–77.8 wt%), a wide Al2O3 range (11.4–17.2 wt%), high CaO contents (0.22–3.97 wt%), and low Fe2O3T (0.12–5.28 wt%), MgO (0.02–1.92 wt%), and Na2O + K2O (0.27–5.70 wt%) contents. The Na2O/K2O ratios ranged from 0.3 to 5.7 (mostly > 1) (Supplementary Table S2). According to Peccerillo and Taylor’s (1976) classification, most of the samples were the high-K calc-alkaline series [44]. A few of the granites were calc-alkaline granites (Figure 4a), which are different from the Triassic granites. In the A/NK vs. A/CNK diagram (Figure 4b), more Jurassic samples exhibit peraluminous characteristics than Triassic samples. In the Harker diagrams (Figure 5), TiO2, Al2O3, MgO, Fe2O3T, CaO, and P2O5 decrease with increasing SiO2. The correlation between P2O5 and SiO2 indicates that the Jurassic granites are not S-type granites. The Jurassic plutons also exhibited low and variable total REE contents, ranging from 6.46 to 375 ppm (mean = 122 ppm). Compared to the others, the samples from Yiwulǚshan and Gaoliduntai had extremely low total REE contents, ranging from 6.46 to 20.4 ppm [40,44,46]. They had similar chondrite-normalized REE patterns and moderate LREE enrichment, with LaN/YbN ratios of 1.5 to 79.1 (mean = 19.7) and variable Eu anomalies (0.04–4.63, mostly = 0.80–1.00) (Figure 6b).
The Jurassic granitoids have relatively high Sr/Y ratios (0.7–665.5) and lower La/Yb ratios (2.1–110.3) (Figure 8j–l). They are characterized by low Nb (0.65–88 ppm), Ta (0.03–10.4 ppm), Zr (19.4–366 ppm), Y (0.75–225 ppm), and Cr (0.06–30.5 ppm) contents (Supplementary Table S2). In the primitive, mantle-normalized diagrams (Figure 6a), most of the samples are depleted in Ba, Nb, Sr, P, Zr, and Ti and enriched in U, Th, and Nd. In Figure 7, most samples are plotted in the I-type granite field, which indicates that they do not have the distinctive features of A-type granites. However, some of the granites emplaced in the Xingcheng, Dushan, and Haitangshan MCCs have high Na2O/K2O ratios (>1), Sr contents (>400 ppm), and Sr/Y (>20.0–40.0) and La/Yb (>7.6–15.0) ratios. These granitoids also have low Y (<18 ppm) and Yb (<1.9 ppm) contents and weak Eu anomalies. These geochemical features indicate that they are adakitic granites [47]. Based on the lithologies and geochemical features, most of the Jurassic granitoids belong to I-type granites with a little portion of adakitic granites [40].

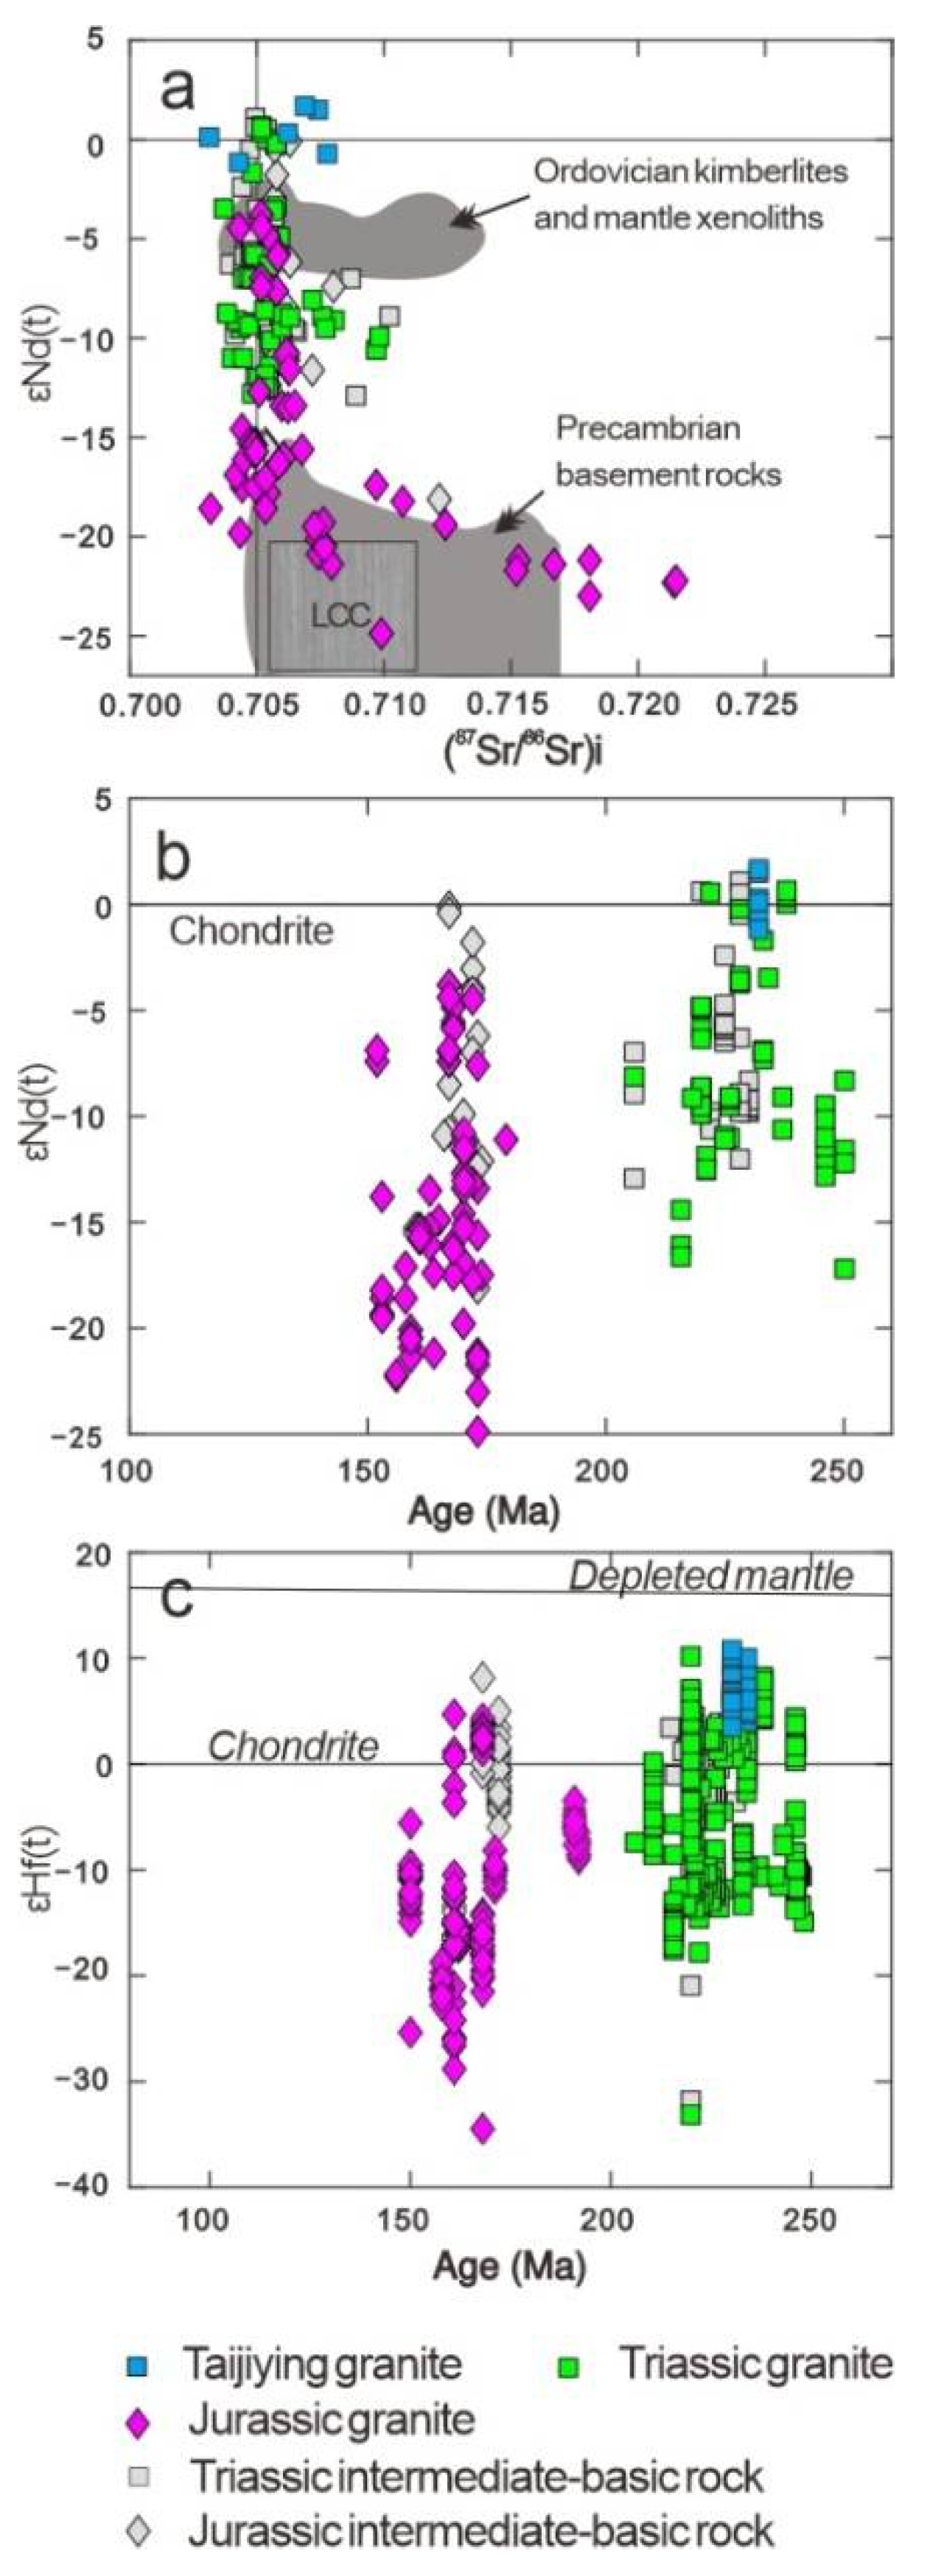
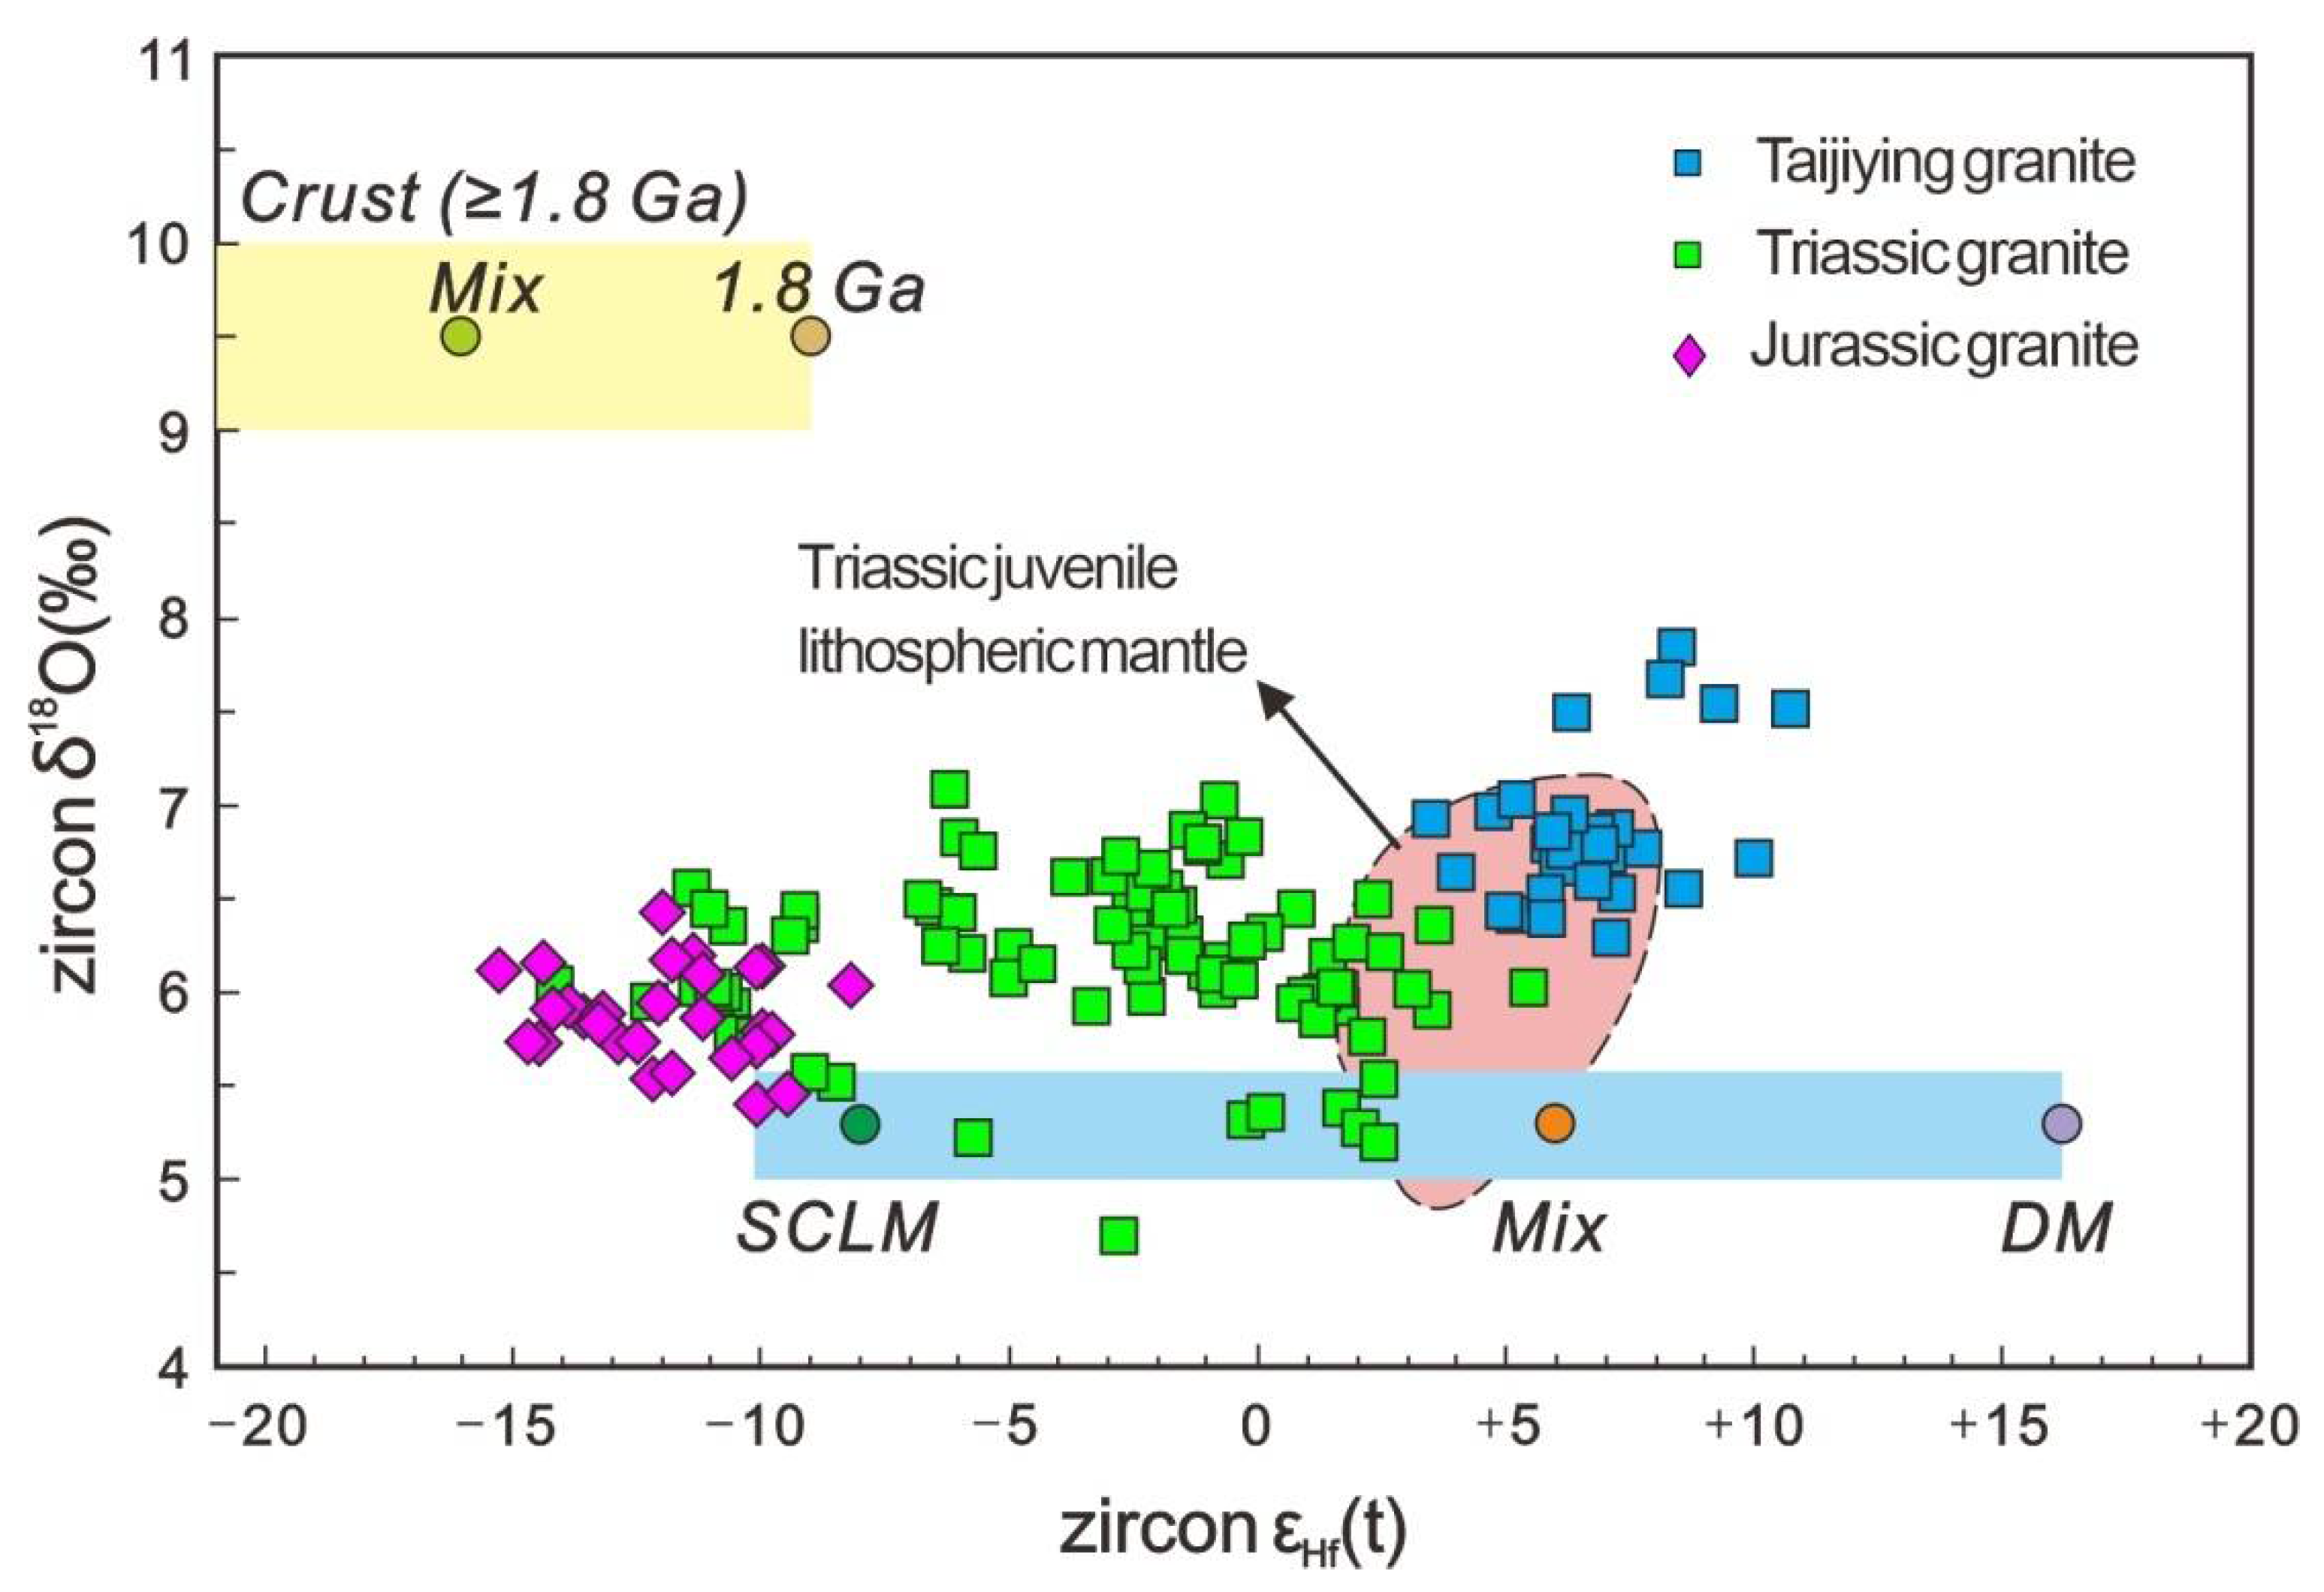
5. Characteristics of Sr–Nd–Hf–O Isotopes

5.1. Sr–Nd Isotope

Whole-rock Sr–Nd isotopes and zircon Hf are important tools for tracing the evolution of the lithosphere and crust [48]. TDM2 and TDMC are used to restrict when the magmatic source is derived from the depleted mantle [49].
The Sr and Nd isotope ratios of Triassic to Jurassic granitoids in the study area are listed in Supplementary Table S2. For all collected samples from the northern NCC, the εNd(t) values exhibited a wide range from −17.2 to 0.65 (mean = −8.5), and the initial 87Sr/86Sr ratios had relatively low values (0.7010–0.7098, mostly = 0.7050), excluding the extremely low values of 0.6840 and 0.6992 of the Kalaqin batholiths [8] and Hekanzi syenite [32]. The Nd model ages (TDM) plutons were 1.02–2.02 Ga with a mean value of 1.47 Ga.
The Jurassic granitoids are characterized by strongly negative εNd(t) values from −24.9 to −3.8 (mostly < −15.0) and a wide range of initial 87Sr/86Sr ratios from 0.7032 to 0.7215 (mean value = 0.7076). Although there were several plutons with a younger age (TDM) in the region, such as Dayingzi (0.87–0.90 Ga) and Nianzigou (0.75–0.90 Ga) [44], contrasting with Triassic ones, these Jurassic intrusions had much older ages (TDM), from 1.31 Ga to 2.96 Ga (mean age = 2.17 Ga) (Supplementary Table S2).

5.2. Zircon Hf–O Isotope

The compiled Triassic granitoids zircon Hf isotopes are characterized by relatively low 176Hf/177Hf ratios (0.281702 to 0.282933), εHf(t) values (−33.1 to 10.2, mean value = −5.6), and older Hf isotopic crustal model ages (TDMC), 0.60–3.32 Ga (mean = 1.57 Ga). The δ18O values varied from 4.69‰ to 7.84‰ (mean = 6.44‰). The zircon Hf isotopes of the Jurassic granitoids exhibited the lowest 176Hf/177Hf ratios, from 0.281193 to 0.282801, εHf(t) values of −34.5 to 4.7 (mostly = −12.8), and TDMC of 0.94 Ga to 3.36 Ga (mean = 2.11 Ga), respectively. The δ18O values varied from 5.40‰ to 6.70‰ (mean = 5.96‰) (Supplementary Table S3). The εHf(t) values gradually decreased with the ages when the TDMC aged from Triassic to Jurassic (Figure 10 and Figure 11c). These features indicate that the Jurassic granitic sources had more Precambrian basement rocks involved in the process. The high δ18O values of Triassic granites may be the result of basalts altered by Archean seawater [50,51].

6. Age and Types of Metallic Metallogeny

The gold and molybdenum mineralization represents the primary metallogeny in this district. More than 100 gold deposits have been discovered, which were produced in Meso-Neoarchean metamorphic rocks or Mesozoic intrusions. The large–medium gold deposits are found in Chaihulanzi, Honghuagou, Anjiayingzi, Zhuanshanzi, and Xiaotazigou, from west to east. The superlarge/large molybdenum deposits are distributed near the Xingcheng area and Chifeng City, which includes Lanjiagou, Yangjiazhangzi, Xintaimen and Chehugou [52,53,54]. The specific information can be seen in Supplementary Table S4.
It seems to be a pattern that gold mineralization mainly took place during the Triassic, and molybdenum deposits concentrated in the Jurassic. There were two peaks of gold mineralization in the Triassic and Jurassic: 250–230 Ma and 160–180 Ma (Figure 9). Triassic gold deposits are characterized by a higher grade and larger scale than those from the Jurassic. Twelve Triassic gold deposits exhibit high grade (ca. 5–30 g/t, mostly > 10 g/t) and large reserve scales (mostly > 5 t). For instance, the Jinchangyu orogenic gold deposit has 90 tonnes of gold reserves with a high grade of 14.6 g/t [55]. In contrast, Jurassic gold deposits are relatively small in reserve scale and lower in grade, which indicates that more intensive gold mineralization occurred in the Triassic. On the other hand, this study area is also called the Yan–Liao Mo belt and is one of the six Mo mineralization provinces in China [56]. Most large Mo deposits at the northern margins of the NCC are related to continental collision orogeny, including syn-collision to post-collision tectonism [56]. Wang et al. (2014) reported large–medium Mo polymetallic deposits in China mostly produced during 180–100 Ma and a few of deposits from the Indosinian [57]. In this area, Triassic Mo mineralization is represented by just one small-scale Kulitu and the superlarge-scale Chehugou deposits with a grade of 0.09% and 0.14%, respectively, along the north side of the Chifeng–Kaiyuan fault [58,59]. In contrast, Jurassic Mo mineralization is characterized by more deposits, larger reserve scale, and higher ore grade (Figure 9 and Supplementary Table S4). For example, the porphyry-type Lanjiagou (182 ± 7 Ma) Mo deposit has been estimated to be a reserve of molybdenum metal measuring more than 404,000 tons with an average grade of 0.13% Mo [52]. The skarn-type Yangjiazhangzi Mo deposit (181 ± 1 Ma) near the Lanjiagou deposit contains 261,800 tons of Mo with an average grade of 0.14% [54]. To the north, the Xiaojiayingzi Mo (Fe) deposit, formed in 166 ± 5 Ma, shows the features of high-grade Mo (0.29%) and is large in scale (105,000 tons) [57]. The Nianzigou Mo deposit is a quartz-vein-type Mo deposit which has 25,000 tons of Mo with an average grade of 0.31%, ranking as a middle-sized deposit [59]. The host rock porphyritic monzogranite and its associated Mo mineralization occurred at 153 ± 5 Ma [60]. The Sr–Nd isotopic compositions and Re contents in molybdenite suggest a crust-dominated source, with a minor contribution from the mantle [61]. The geochemical features of the Chehugou Mo deposit also suggest that the ore-related granitoids were derived from ancient, garnet-bearing crustal rocks related to subduction of the Palaeo-Asian Ocean and subsequent continent–continent collision between the NCC and Siberian plates. It indicates that the mineralization intensities of gold and molybdenum were different in the different periods, i.e., most gold was deposited in the Triassic, while molybdenum deposits mainly took place in the Jurassic.

7. Discussion

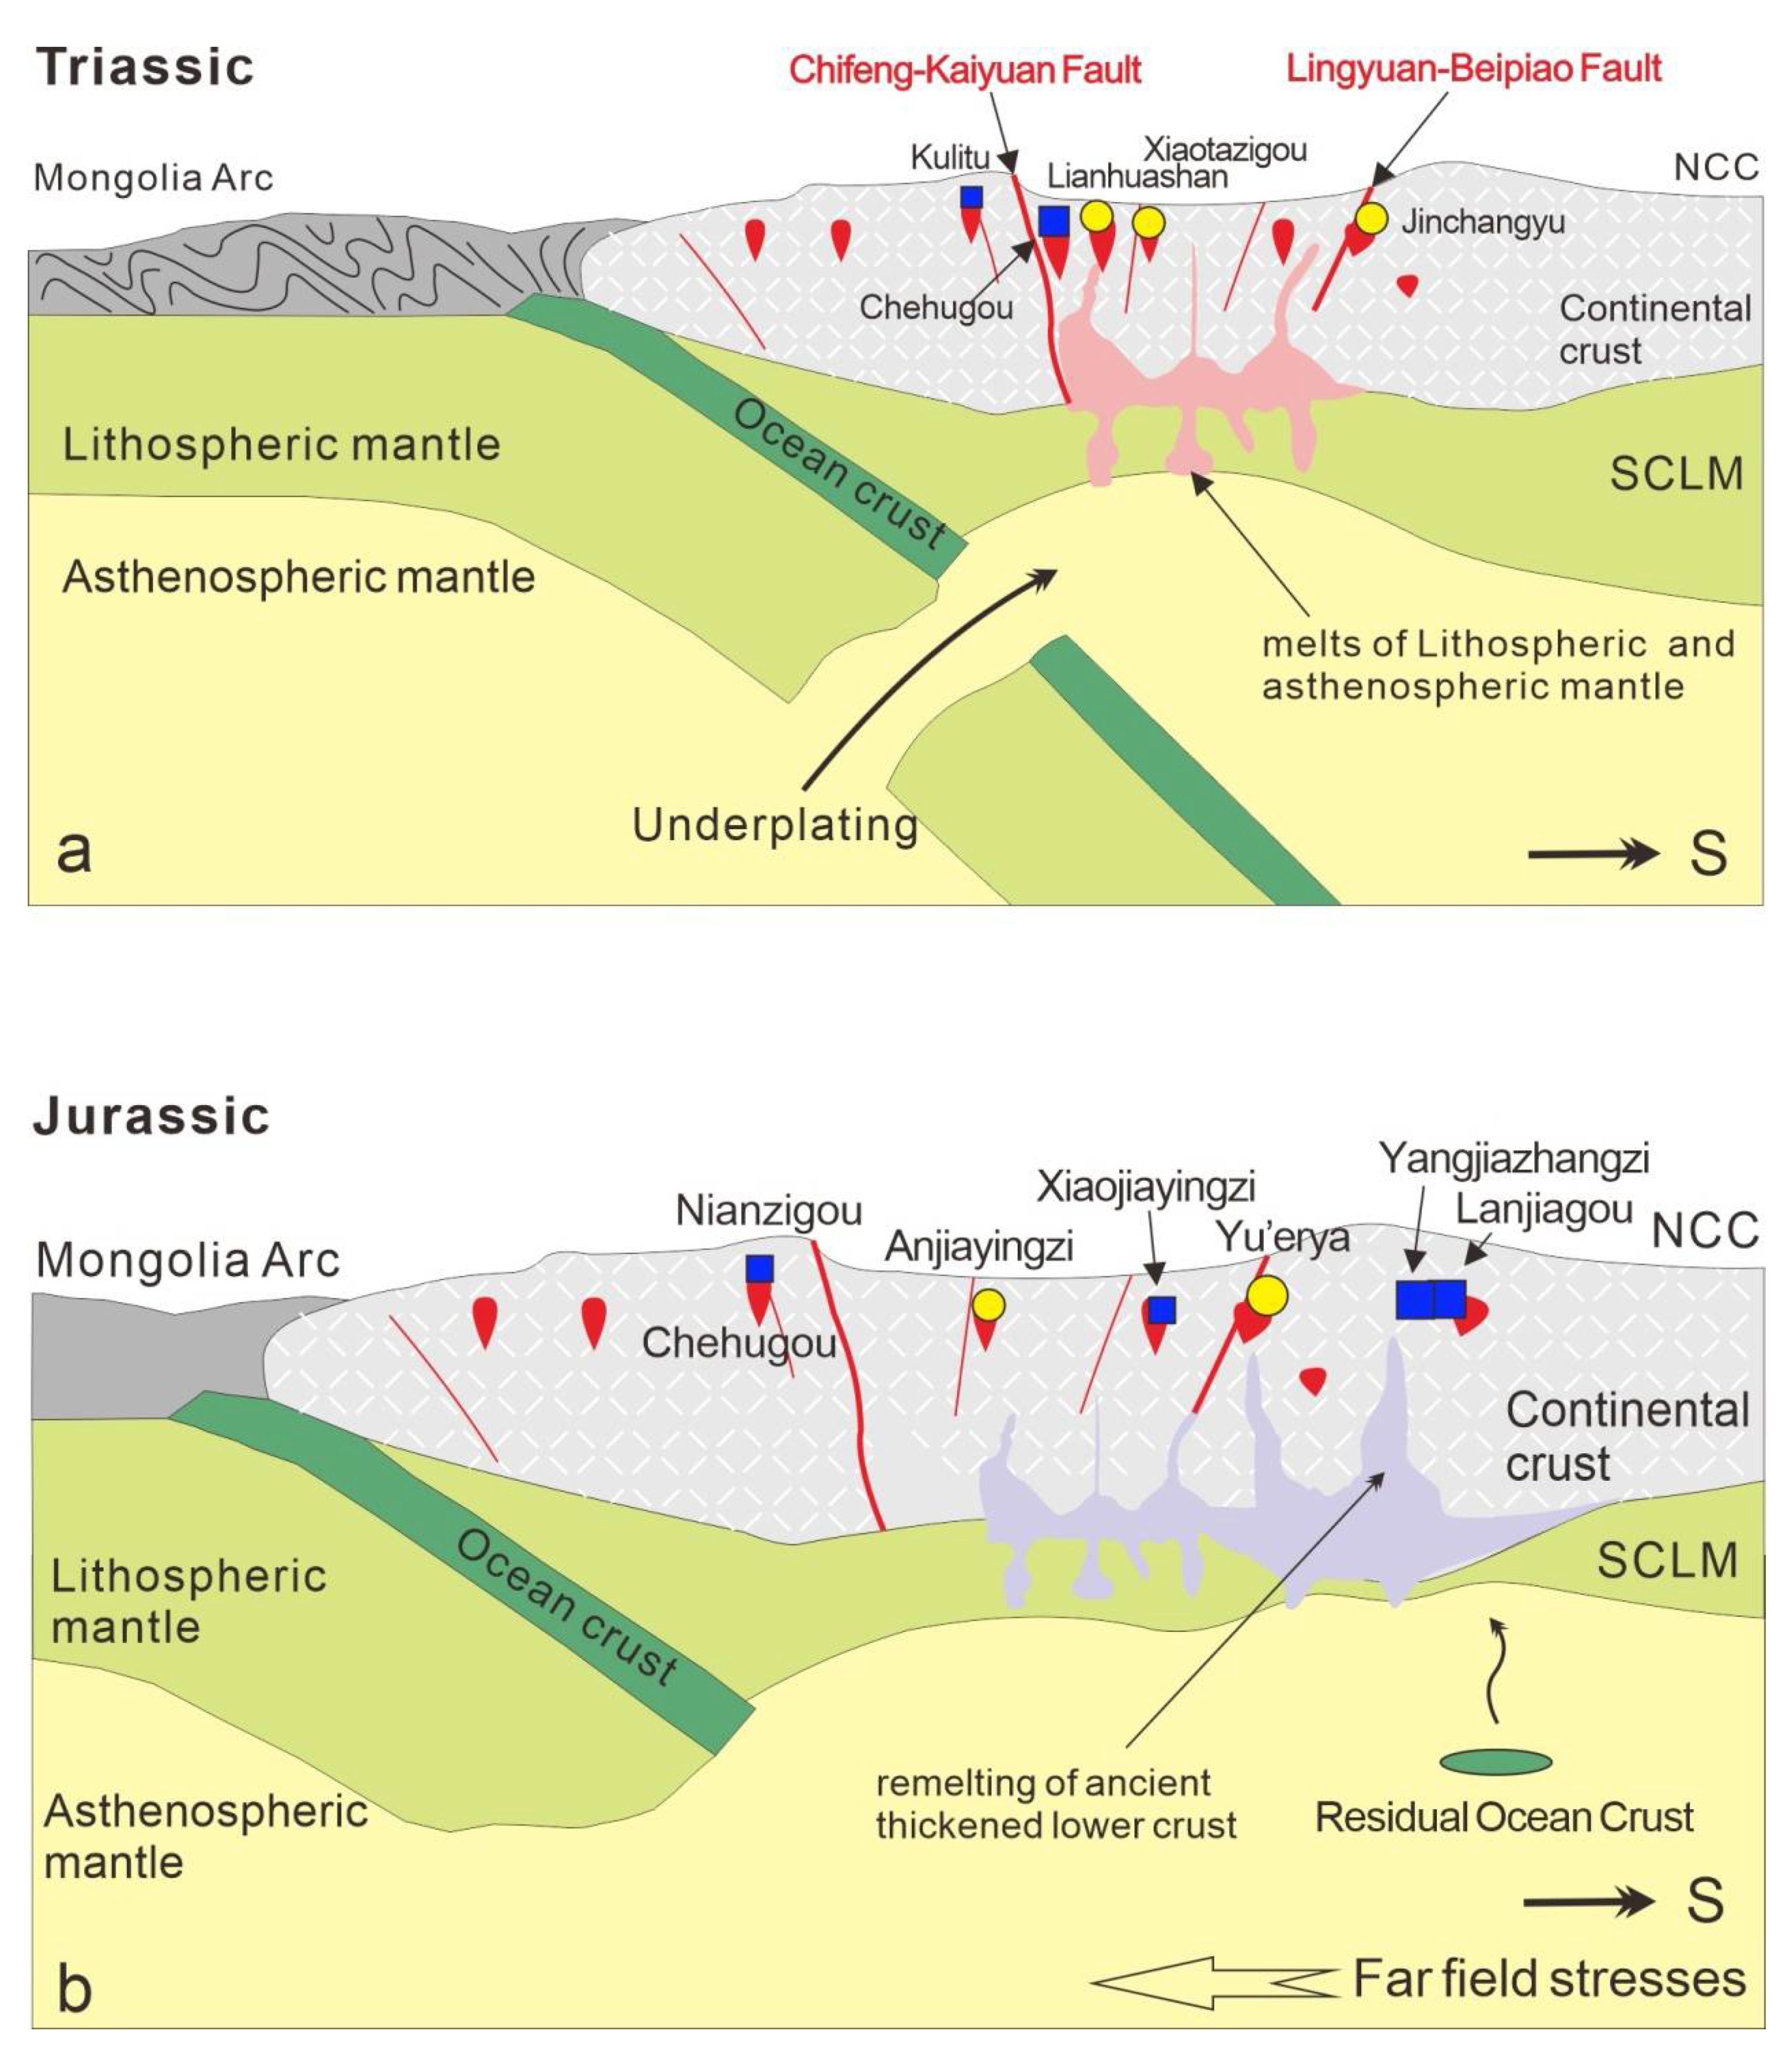
7.1. Transition of the Granitoid Sources from the Triassic to the Jurassic

The Triassic granitoids in the northern part of the NCC mainly consist of leucogranite, monzogranite, biotite granite, and syenogranite [52]. They belong to I-type or A-type granites, which have relatively high SiO2, K2O, and K2O + Na2O, low Sr contents and Mg# values, strong LREE enrichments, negative δEu values, and Ba, Nb, Ta, Sr, P, and Ti depletions. The sources are most likely to be the partial melting of crustal materials. The compiled Triassic granites had much lower negative εNd(t) and εHf(t) values and older Nd and Hf model ages (TDM2 and TDMC). In the εNd(t) vs. (87Sr/86Sr)i diagram (Figure 11a), a portion of the granitoids overlap with or are plotted above the Ordovician kimberlites and mantle xenoliths in the eastern part of the NCC. Most of the samples plotted in the area are between the Ordovician kimberlites, the mantle xenoliths, and the Precambrian basement rocks of the NCC, but they are much closer to the former. This scenario indicates that the initial magma sources are mainly derived from the lithospheric mantle materials, mixed with a portion of ancient crustal components. Furthermore, the granitoids exhibit the same distribution pattern as the Triassic intermediate mafic rocks, which also support this conclusion. The εNd(t) and εHf(t) vs. crystallization age plots also indicate similar source features (Figure 11b,c).
The proposed mantle sources of the Triassic granitoids are also supported by many previous studies, including those on Guangtoushan alkaline granite [30], the Jianping monzogranite and syenogranite [62], the Ping’andi ferroan granitoid [15], and the Jinchanggouliang shoshonitic dikes [63]. The Triassic Jianping granites (237 Ma) exhibit εNd(t) values of −10.6 to −9.1 and higher (87Sr/86Sr)i values, which may indicate more assimilation of crustal materials. The Late Triassic Guangtoushan alkaline–peralkaline granites (220 ± 1 Ma, εNd(t) = −9.9 to −8.6) are considered to have been derived from the enriched sub-continental lithospheric mantle [30]. The integrated geological evidence suggests that the Jinchanggouliang shoshonitic dikes were derived from the mixing of the lower crust, the lithospheric mantle of the NCC, and the ascending asthenospheric melt in a post-orogenic extensional geodynamic setting [64]. To the west, the granitoids of the Kalaqin batholith are the products of the mixing of melts that were mainly derived from three end-member sources, the ≥1.8 Ga ancient crust, the lithospheric mantle beneath the NCC, and a likely juvenile endmember formed by the mixing of melts from the lithospheric mantle and depleted mantle. The possible percentage of the crustal and mantle sources based on zircon Hf–O isotopes is 10%–40% ancient-crust-derived magma [8]. In addition, a more juvenile endmember or lithospheric mantle played a major role [30]. The Baizhangzi adakitic granites (233 Ma) were derived from the lower continental crust that was modified by basaltic underplating during the early Mesozoic, which led to the formation of juvenile crustal materials [27]. The sources of the A-type granites are mainly juvenile, mantle-derived components and a small portion of recycled ancient crust. Generally, regardless of the specific types of Triassic intrusive, the mixing of juvenile crustal melts derived from the lithospheric mantle and the depleted mantle was likely the major source. The few percentages of ancient crust materials led to (87Sr/86Sr)i values increasing in a narrow range compared to the percentages of Precambrian basement rocks (Figure 11a).
Figure 11. (a) Whole-rock εNd(t) vs. (87Sr/86Sr)i; (b) εNd(t) vs. age (Ma) diagram; (c) εHf(t) vs. age (Ma) diagram. Sr–Nd isotopic compositions of the Precambrian basement rocks in northern North China Craton (calculated at 310 Ma) are from [18,65], and those of the Ordovician kimberlites and mantle xenoliths (calculated at 310 Ma) in eastern North China Craton are from [63,66]. The compositions of the lower continental crust (LCC) based on [67] are also plotted.
Minerals 12 01117 g011
Jurassic magmatic rocks mainly consist of granite, monzogranite with minor leucogranite, granodiorite, gabbro, lamprophyre, tonalite, and mafic microgranular enclaves (MMEs). Most of the Jurassic intrusive rocks are high-K calc-alkaline or calc-alkaline (Figure 4a). The intrusive rocks are mostly characterized by LREE enrichment, small negative or positive Eu anomalies, high Al2O3, Na2O, Na2O/K2O, Sr, and Ba contents, and low MgO, Y, Yb, and HFSE (Nb, Ta, Zr, Hf) contents. Their adakitic features suggest that olivine and plagioclase were not residual phases in the source region, but garnet, amphibole, and pyroxene were [68]. The Jurassic plutons mostly exhibited Ba, Nb, Sr, P, Zr, and Ti depletions and U, Th, and Nd enrichments, indicating a source containing residual eclogite. The Nd/Th ratios (mean = 3.3) and Ti/Zr ratios (mean = 12.4) were closer to the values of 3 and <30 for continental crust, respectively, indicating that the genesis of granitoids also involved crustal melting. The partial melting of the thickened lower crust has been reported to be the main source of some Jurassic intrusive rocks [68,69,70]. The Archean–Paleoproterozoic inherited ~2.5 Ga zircons, also indicating the involvement of compositions of more ancient crustal materials, such as the Lüshan batholiths (2451 ± 12 Ma) and Shishan monzogranite (2455 ± 32 Ma) [3,66]. Based on these features, the Jurassic granitoid suit was mainly produced by the remelting of ancient mafic lower crust [24]. The presence of gabbro, lamprophyre, tonalite, and mafic microgranular enclaves (MMEs) might suggest that an enriched mantle endmember was involved.
The significant negative εNd(t) values and various initial 87Sr/86Sr ratios of the Jurassic granitoids are consistent with their derivation from ancient lower crust (Figure 11a). A portion of the samples had high negative εNd(t) values, which were similar to the values of the Ordovician kimberlites and mantle xenoliths and the coeval mantle-derived rocks (e.g., gabbro and lamprophyre). However, most of the samples were similar to the Precambrian basement rocks of the NCC. This scenario reflects that the parental magma may be more complicated, including ancient lower crust and minor juvenile lithospheric mantle components. Most of the samples had an old mean TDM2 age of 2.17 Ga and a mean TDMC age 2.11 Ga, which required an older endmember. The Archean–Paleoproterozoic basement rocks are an optimal component. However, the crustal endmember was probably recently underplated by the Jurassic magmatism, which may, alternatively, indicate mixing with the ancient, enriched lithospheric mantle. The significant negative zircon Hf isotopic compositions also support the proposed Archean lower-crust-extracted felsic magma sources (Figure 10 and Figure 11c). In addition, the slightly higher zircon δ18O of the Jurassic Shuihutong and Baijiadian plutons is also very similar to the values of many other NCC granitoids, which are also believed to have been derived from a lower crustal source [66]. The positive εHf(t) values (Lüshan granite, LB64) may represent the involvement of the Paleo-Pacific oceanic subducted slab or underplating by the depleted mantle [68]. The basaltic melts evolved into felsic magmas with minor ancient crustal contamination and then the felsic magmas formed granites with positive εHf(t) values.

7.2. Relationship between the Sources and the Tectonic Setting

The Triassic granitoids were emplaced after the final amalgamation and suturing of the CAOB with the NCC [62,69]. In the Early Triassic, the high-K calc-alkaline granites (HKCA), including the monzogranite, K-feldspar granite and minor monzonite, were the dominant type of batholith in the Chifeng–Chaoyang district, which is one of the important characteristics of post-collisional magmatic activities [70,71,72]. In the final stages of orogeny, the HKCA often shift to shoshonitic or alkaline–peralkaline compositions (nepheline syenite, aegirine-augite syenite, pyroxene syenite, quartz syenite, syenite, and alkaline granite) [73,74], which is consistent with the regional lithological associations of the Middle–Late Triassic rocks (Figure 4a). The Triassic Fanshan alkaline ultramafic–syenite complex [75], Late Triassic Guangtoushan alkaline–peralkaline granites [28], and other alkaline rocks [76] support the hypothesis that the magmatic rocks were derived from the melting of an enriched mantle and post-collisional lithospheric extension along the northern margin of the NCC (Figure 12a). Late Triassic to Early Jurassic extensional deformation and large-scale gravity sliding have been identified in western Liaoning Province [76], which represent crustal uplift and rapid exhumation of the crustal rocks.
The Jurassic lithological associations consist of adakitic granite (high-Sr granite), strongly peraluminous leucogranite, high-K calc-alkaline granite, and minor A-type granite (e.g., the Nianzigou pluton). The 42 ages of adakitic granite suggest that it was mainly formed during the late Indosinian to late Yanshanian (229–114 Ma), and ca. 65% of the granites were emplaced in the Jurassic. Adakitic granites are characterized by Sr enrichment, strong HREE depletion, and slightly negative δEu values. These characteristics indicate an adakitic magmatic source generated via the partial melting of crustal rocks under high-temperature (>850–900 °C) and high-pressure (≥1.5 GPa) conditions, and the original melts lacked fractional crystallization of feldspar [44]. Furthermore, high pressures indicate that the magma was produced deeper than 50 km, which represents an extreme thickened crust [77]. The existence of strongly peraluminous leucogranites (the Madi and Lüshan plutons) is also robust evidence for a thickened crust in the Chifeng–Chaoyang district. Argillites and sandstones were brought into the deep crust and heated by ocean plate subduction and crustal thickening. The rapid crustal gravity equalization uplift caused partial melting of these heated sedimentary rocks enriched in water-bearing minerals (e.g., muscovite and biotite), producing strongly peraluminous leucogranite. These middle Mesozoic leucogranites (>160 Ma) indicate extreme crustal thickening/uplift. This thickened low crust was reactivated by the northwestward subduction of the Paleo-Pacific oceanic plate (Figure 12b).
The Triassic granitic source contained more juvenile, mantle-derived components. In contrast, the Jurassic granites were derived from the reworking of thickened ancient lower crust. It has been proposed that the most marked change during the Cretaceous cratonic destruction was the change of magmatic source from enriched lithospheric mantle to depleted asthenospheric mantle [2,3]. However, the source transition in the Triassic and Jurassic was from lithospheric mantle and depleted mantle to enriched ancient lower crust in the Chifeng–Chaoyang district. This might indicate that the Jurassic was the key period of tectonic transition from the CAOB to the Paleo-Pacific Ocean regime, and magma sources may be useful indicators to determine the tectonic settings when discrimination diagrams are invalid (Figure 13).

7.3. Possible Relationship between Sources and Metallogeny

Magmatic intrusions are important lithospheric probes as they come from the deep Earth [79,80,81]. As powerful tools, the whole-rock Nd and zircon Hf isotopes of magmatic rocks have been broadly used to investigate crustal growth [9], lithospheric architecture, and regional metallogeny. The possible sources and ages of crustal rocks are indicated by εNd and TDM, respectively. Zircon εHf data can be used to distinguish between juvenile mantle sources (high positive εHf values) and ancient crustal sources (negative εHf values) [82]. Various characteristic values can also be used to estimate the ages and components of mixed magmatic rocks, i.e., between the juvenile mantle and ancient crust endmembers. Furthermore, regional-scale Hf–Nd isotopic mapping can not only precisely identify the deep components and the temporal-spatial distributions, but also explore regional metallogenesis, which provides a new method for investigating the relationship between sources and metallogenesis [48,83].
Several studies linked isotopic architecture to the localization of mineral systems. Mole et al. (2013, 2014) consolidated and extended the Sm–Nd isotope coverage of the Yilgarn Craton and developed a comprehensive understanding of the crustal evolution of the craton and the spatial and temporal occurrence of komatiite-hosted nickel and orogenic gold [84,85]. They showed that the evolving crustal architecture of the Archean Yilgarn Craton played a key role in controlling the location of camp-scale gold, iron, and nickel mineralized systems. Komatiite-hosted nickel deposits cluster into camps localized within young, juvenile crust at the isotopic margin with older lithosphere; orogenic gold systems are typically localized along major structures within juvenile crust; and banded iron formation (BIF)-hosted iron deposits are localized at the edge of, and within, older lithospheric blocks. Based on whole-rock geochemistry and Sr–Nd–Hf isotopic data, Hou et al. (2012) proposed that Cu-bearing magmas were most probably derived from the thickened juvenile mafic lower crust beneath south Tibet. The melting of sulfide-bearing phases in the juvenile mantle components of the Tibetan lower crust probably provided portions of Cu, Au, and S for the fertile magmas. However, the Mo-bearing magmas were likely derived from the partial melting of the ancient Tibetan lower crust, while Mo was also mainly derived from the ancient crust [86]. In China, Nd–Hf isotopic mapping has been conducted in several regions, including the Da Hinggan Mountains [4], the southeastern part of the North China Craton [5], the East Qinling Orogen [6], the Sanjiang Tethyan Orogen [87], the Chinese Altai Orogen [88], and the Himalayan–Tibetan Orogen [89]. Although there is inconsistency regarding some of the specific mineral varieties, the consensus is that the distribution of the copper, gold, and copper-nickel deposits is consistent with the distribution of the juvenile, mantle-derived crust in orogenic belts and cratons, and the large-scale molybdenum deposits occurred in the reworking zone of the Paleoproterozoic ancient crust [48].
In this case, the petrological, geochemical, and Sr–Nd–O–Hf isotopic data provide important constraints on the transition of the magmatic sources from the Triassic to the Jurassic in the Chifeng–Chaoyang district. The Sr–Nd–O–Hf isotopic data indicate that the Triassic magmatism was predominantly produced by the mixing of juvenile lower crust melts derived from the lithospheric mantle and the depleted mantle, which controlled the Au(-Cu) mineralization. However, the Jurassic magmatism, with low εNd(t) and εHf(t) values, variable initial 87Sr/86Sr values, and high model age TDM2–TDMC values, was predominantly derived from Archean to Paleoproterozoic reworked crust and controlled the formation of the porphyry-skarn Mo mineralization.
The pattern diagrams are shown in Figure 12. Many studies on typical gold deposits suggested that asthenosphere upwelling triggered the release of gold and sulfur from an enriched and fertilized mantle lithosphere. This mechanism determined that the magma sources must be dominated by juvenile, mantle-derived components with a portion of lower crust (Figure 12a). On the contrary, ancient lower crust is responsible for providing metal Mo, which leads to more enriched isotopic signatures. The thickened lower crust and the thinning of the SCLM promoted large-scale reworking of ancient lower crust, which created favorable conditions for the release of Mo and mineralization (Figure 12b). This study may offer a new direction for studying regional metallogenic patterns.

8. Conclusions

Based on the distributions of the Triassic and Jurassic granites, as well as geochronologic, whole-rock Sr–Nd, and zircon O–Hf isotopic analyses, the primary magmatic sources changed from relatively juvenile, lithospheric, mantle-derived materials to thickened ancient lower crust. They also indicate that the tectonic setting changed from post-collisional extension to subduction of the Paleo-Pacific plate.
The medium–large-scale, high-grade Au deposits are closely related to the Triassic granitoids; however, most of the Mo deposits were formed in the Jurassic. The different magmatic sources in the deep crust controlled the particular type of mineralization.

Supplementary Materials

The following supporting information can be downloaded at: https://www.mdpi.com/article/10.3390/min12091117/s1, Table S1: The age of stocks on the northern margin of North China Craton (NCC); Table S2: Major, trace element, and Sr–Nd isotopic data for the Triassic–Jurassic intrusive rocks in the Chifeng–Chaoyang district; Table S3: Zircon O–Hf isotopic data for the Triassic–Jurassic intrusive rocks in the Chifeng–Chaoyang district; Table S4: Summary of geologic characteristics of major Au-Mo ore deposits in the Chifeng–Chaoyang district. Analytical methods.docx. [90,91,92,93,94,95,96,97,98,99,100,101,102,103,104].

Author Contributions

Conceptualization, H.-F.Z. and Y.T.; methodology, J.-G.Y.; software, J.-G.Y. and Y.-Y.Q.; validation, R.-W.L. and R.-B.L.; formal analysis, J.-G.Y.; investigation, J.-G.Y., R.-W.L. and R.-B.L.; resources, J.-G.Y.; data curation, J.-G.Y.; writing—original draft preparation, J.-G.Y.; writing—review and editing, J.-G.Y.; visualization, J.-G.Y. and Y.-Y.Q.; supervision, H.-F.Z. and Y.T.; project administration, Y.T.; funding acquisition, H.-F.Z. and Y.T. All authors have read and agreed to the published version of the manuscript.

Funding

The study is financially supported by National Nature Science Foundation of China (Grant No. 92162322, 41372077), the Geological Survey Program of China (Grant no. DD20190685), and the National Key Research and Development Program of China (Grant no. 2018YFC0603702, 2016YFC0600106).

Data Availability Statement

The raw data supporting the conclusions of this article will be made available by the authors without undue reservation.

Acknowledgments

We gratefully acknowledge the constructive comments of reviewers whose suggestions helped to improve the scientific quality of this paper substantially.

Conflicts of Interest

The authors declare that the research was conducted in the absence of any commercial or financial relationships that could be construed as a potential conflict of interest.

Contribution to the Field Statement

This contribution focuses on whether the characteristics of magma source affect the mineralization of gold and molybdenum deposits in the northern margin of North China Craton. This study area has been thought of as an important place for producing numerous large/superlarge deposits, e.g., the Yu’erya gold deposit and the Chehugou molybdenum deposit, as well as episodic felsic intrusions. Based on the comparative analysis of the rock assemblage and geochemical characteristics (majority and trace elements, rare earth elements and Sr–Nd–O–Hf isotopes) of the Triassic and Jurassic intrusions, it is concluded that (1) primary magmatic sources changed from juvenile lithospheric mantle to thickened ancient lower crust between the Triassic and Jurassic; (2) the tectonic setting transited from post-collisional extension to subduction of the Paleozoic-Pacific Plate beneath the East Asia Plate; and (3) different magmatic sources from the deep crust control the particular mineralization during cratonic destruction. Medium–large-scale Au deposits with high grade are closely related to Triassic magmatism; however, most Mo deposits are preferred to the Jurassic magmatic rocks. This pattern is helpful for ore exploration in this region.

References

  1. Xu, Y.; Li, H.; Pang, C.; He, B. On the timing and duration of the destruction of the North China Craton. Chin. Sci. Bull. 2009, 54, 3379. [Google Scholar] [CrossRef]
  2. Zhu, R.X.; Yang, J.H.; Wu, F.Y. Timing of destruction of the North China Craton. Lithos 2012, 149, 51–60. [Google Scholar] [CrossRef]
  3. Wu, F.; Yang, J.; Xu, Y.; Wilde, S.; Walker, R. Destruction of the north china craton in the mesozoic. Annu. Rev. Earth Pl. Sc. 2019, 47, 173–195. [Google Scholar] [CrossRef]
  4. Yang, Q.; Wang, T.; Guo, L.; Tong, Y.; Zhang, L.; Zhang, J.; Hou, Z. Nd isotopic variation of Paleozoic—Mesozoic granitoids from the Da Hinggan Mountains and adjacent areas, NE Asia: Implications for the architecture and growth of continental crust. Lithos 2017, 272–273, 164–184. [Google Scholar] [CrossRef]
  5. Deng, J.; Wang, C.; Bagas, L.; Santosh, M.; Yao, E. Crustal architecture and metallogenesis in the south-eastern North China Craton. Earth-Sci. Rev. 2018, 182, 251–272. [Google Scholar] [CrossRef]
  6. Wang, X.; Wang, T.; Ke, C.; Yang, Y.; Li, J.; Li, Y.; Qi, Q.; Lv, X. Nd—Hf isotopic mapping of Late Mesozoic granitoids in the East Qinling orogen, central China: Constraint on the basements of terranes and distribution of Mo mineralization. J. Asian Earth Sci. 2015, 103, 169–183. [Google Scholar] [CrossRef]
  7. Yuan, J.; Zhang, H.; Tong, Y.; Gao, J.; Xiao, R. Sources of metals and fluids for the Taijiying gold deposit on the northern margin of the North China Craton. Ore Geol. Rev. 2021, 139, 104593. [Google Scholar] [CrossRef]
  8. Li, R.; Yang, J.; Wang, H.; Zhu, Y.; Sun, J.; Xu, L. Triassic lithospheric modification of the northern North China Craton: Evidences from the composite Kalaqin Batholith and ultramafic-mafic Heilihe Intrusive Complex in Inner Mongolia. Lithos 2020, 362–363, 105501. [Google Scholar] [CrossRef]
  9. Wang, T.; Hou, Z. Isotopic mapping and deep material probing (I): Revealing the compositional evolution of the lithosphere and crustal growth processes. Earth Sci. Front. 2018, 25, 1–19. [Google Scholar]
  10. Liu, Y.; Hu, Z.; Gao, S.; Gunther, D.; Xu, J.; Gao, C.; Chen, H. In situ analysis of major and trace elements of anhydrous minerals by LA-ICP-MS without applying an internal standard. Chem. Geol. 2008, 257, 34–43. [Google Scholar] [CrossRef]
  11. Zhai, M.G.; Santosh, M. The early Precambrian odyssey of the North China Craton: A synoptic overview. Gondwana Res. 2011, 20, 6–25. [Google Scholar] [CrossRef]
  12. Zhai, M.; Zhou, Y. General precambrian geology in China. In Precambrian Geology of China; Zhai, M., Ed.; CAS: Beijing, China, 2015; pp. 3–56. [Google Scholar]
  13. Zhao, G.; Cawood, P.A.; Li, S.; Wilde, S.A.; Sun, M.; Zhang, J.; He, Y.; Yin, C. Amalgamation of the North China Craton: Key issues and discussion. Precambrian Res. 2012, 222, 55–76. [Google Scholar] [CrossRef]
  14. Tang, J.; Xu, W.; Wang, F.; Ge, W. Subduction history of the Paleo-Pacific slab beneath Eurasian continent: Mesozoic-Paleogene magmatic records in Northeast Asia. Sci. China 2018, 61, 527–559. [Google Scholar] [CrossRef]
  15. Zhang, S.; Zhao, Y. Magmatic records of the late paleoproterozoic to neoproterozoic extensional and rifting events in the north china craton: A preliminary review. In Main Tectonic Events and Metallogeny of the North China Craton; Zhai, M., Zhao, Y., Zhao, T., Eds.; Springer: Singapore, 2016; pp. 359–391. [Google Scholar]
  16. Song, S.; Niu, Y.; Su, L.; Xia, X. Tectonics of the North Qilian orogen, NW China. Gondwana Res. 2013, 23, 1378–1401. [Google Scholar] [CrossRef]
  17. Windley, B.F.; Alexeiev, D.; Xiao, W.; Kröner, A.; Badarch, G. Tectonic models for accretion of the Central Asian Orogenic Belt. J. Geol. Soc. London. 2007, 164, 31–47. [Google Scholar] [CrossRef]
  18. Wu, F.; Ge, W.; Sun, D.; Lin, Q.; Zhou, Y. The Sm-Nd, Rb-Sr isotopic ages of the Archean granites in southern Jilin Province. Acta Petrol. Sinca. 1997, 13, 499–506. [Google Scholar]
  19. Zhang, K. Destruction of the North China Craton: Lithosphere folding-induced removal of lithospheric mantle? J. Geodyn. 2012, 53, 8–17. [Google Scholar] [CrossRef]
  20. Tang, L.; Santosh, M. Neoarchean-Paleoproterozoic terrane assembly and Wilson cycle in the North China Craton: An overview from the central segment of the Trans-North China Orogen. Earth-Sci. Rev. 2018, 182, 1–27. [Google Scholar] [CrossRef]
  21. Zeng, Q.; Liu, J.; Zhang, Z.; Zhang, W.; Chu, S.; Zhang, S.; Wang, Z.; Duan, X. Geology, fluid inclusion, and sulfur isotope studies of the chehugou porphyry molybdenum–copper deposit, xilamulun metallogenic belt, NE china. Resour. Geol. 2011, 61, 241–258. [Google Scholar] [CrossRef]
  22. Wang, X.S.; Zheng, Y. 40Ar/39Ar age constraints on the ductile deformation of the detachment system of the Louzidian core complex, southern Chifeng, China. Geol. Rev. 2005, 51, 574–582, (In Chinese with English abstract). [Google Scholar]
  23. LBGMR. Regional Geology of Liaoning Province; Geological Publishing House: Beijing, China, 1989; pp. 317–520. [Google Scholar]
  24. Liu, S.; Santosh, M.; Wang, W.; Bai, X.; Yang, P. Zircon U-Pb chronology of the Jianping Complex: Implications for the Precambrian crustal evolution history of the northern margin of North China Craton. Gondwana Res. 2011, 20, 48–63. [Google Scholar] [CrossRef]
  25. Liu, L.; Gu, X.; Zhang, Y.; Ouyang, X.; Wang, L.; Gao, L. Genesis of the Jinchanggouliang gold deposit, Chifeng, China: Constraints from fluid inclusions and isotopic geochemistry. Ore Geol. Rev. 2019, 115, 103180. [Google Scholar] [CrossRef]
  26. Wang, W.; Liu, S.; Bai, X.; Yang, P.; Li, Q.; Zhang, L. Geochemistry and zircon U-Pb-Hf isotopic systematics of the Neoarchean Yixian—Fuxin greenstone belt, northern margin of the North China Craton: Implications for petrogenesis and tectonic setting. Gondwana Res. 2011, 20, 64–81. [Google Scholar] [CrossRef]
  27. Xiong, L.; Shi, W.; Li, H.; Tian, N.; Chen, C.; Zhou, H.Z.; Zhao, S.Q.; Li, P.Y. Geochemistry, Sr-Nd-Hf isotopes and petrogenesis of Mid-Late triassic baizhangzi granitic intrusive rocks in eastern Hebei-Western liaoning province. Earth Sci. 2017, 42, 207–222, (In Chinese with English abstract). [Google Scholar]
  28. Fu, L.; Wei, J.; Kusky, T.; Chen, H.; Tan, J.; Li, Y.; Kong, L.; Jiang, Y. Triassic shoshonitic dykes from the northern North China craton: Petrogenesis and geodynamic significance. Geol. Mag. 2012, 149, 39–55. [Google Scholar] [CrossRef]
  29. Ma, Y.; Zeng, Q.; Song, B.; Du, J.; Yang, F.; Zhao, Y. Shrimp U-Pb dating of zircon from Panshan granitoid pluton in Yanshan orogenic belt and its tectonic implications. Acta Petrol. Sin. 2007, 23, 547–556, (In Chinese with English abstract). [Google Scholar]
  30. Ye, H.; Zhang, S.; Zhao, Y.; Wu, F. Petrogenesis and emplacement deformation of the Late Triassic Dushan composite batholith in the Yanshan fold and thrust belt: Implication for the tectonic settings of the northern margin of the North China Craton during the Early Mesozoic. Earth Sci. Front. 2014, 21, 275–292, (In Chinese with English abstract). [Google Scholar]
  31. Han, B.F.; Kagami, H.; Li, H.M. Age and Nd-Sr isotopic geochemistry of the Guangtoushan alkaline granite, Hebei province, China: Implications for early Mesozoic crust-mantle interaction in North China Block. Acta Petrol. Sin. 2004, 20, 1375–1388. [Google Scholar]
  32. Cai, J.; Yan, G.; Mou, B.; Ren, K.; Li, F.; Yang, B. Geochronology and geochemistry of sungezhuang alkaline complex in jixian county, tianjin. J. Jilin Univ. (Earth Sci. Ed.) 2011, 41, 1901–1913. [Google Scholar]
  33. Yang, J.H.; Sun, J.F.; Zhang, M.; Wu, F.Y.; Wilde, S.A. Petrogenesis of silica-saturated and silica-undersaturated syenites in the northern North China Craton related to post-collisional and intraplate extension. Chem. Geol. 2012, 328, 149–167. [Google Scholar] [CrossRef]
  34. Zhang, S.H.; Zhao, Y.; Davis, G.A.; Ye, H.; Wu, F. Temporal and spatial variations of Mesozoic magmatism and deformation in the North China Craton: Implications for lithospheric thinning and decratonization. Earth-Sci. Rev. 2014, 131, 49–87. [Google Scholar] [CrossRef]
  35. Elhlou, S.; Belousova, E.; Griffin, W.L.; Pearson, N.J.; O′Reilly, S.Y. Trace element and isotopic composition of GJ-red zircon standard by laser ablation. Geochim. Et Cosmochim. Acta Suppl. 2006, 70, A158. [Google Scholar] [CrossRef]
  36. Belousova, E.; Griffin, W.; O′Reilly, S.Y.; Fisher, N. Igneous zircon: Trace element composition as an indicator of source rock type. Contrib. Mineral. Petrol. 2002, 143, 602–622. [Google Scholar] [CrossRef]
  37. Le Maitre, R.W. Igneous Rocks: A Classification and Glossary of Terms, 2nd ed.; Cambridge University Press: Cambridge, UK, 2002. [Google Scholar]
  38. Taylor, S.R. McLennan SM: The Continental Crust: Its Composition and Evolution. 1985. Available online: https://www.osti.gov/biblio/6582885 (accessed on 10 August 2022).
  39. Sun, S.S.; McDonough, W. Chemical and isotopic systematics of oceanic basalts: Implications for mantle composition and processes. Geol. Soc. Lond. Spec. Publ. 1989, 42, 313–345. [Google Scholar] [CrossRef]
  40. Whalen, J.B.; Currie, K.L.; Chappell, B.W. A-type granites: Geochemical characteristics, discrimination and petrogenesis. Contrib. Mineral. Petrol. 1987, 95, 407–419. [Google Scholar] [CrossRef]
  41. Valley, J.W.; Kinny, P.D.; Schulze, D.J.; Spicuzza, M.J. Zircon megacrysts from kimberlite: Oxygen isotope variability among mantle melts. Contrib. Mineral. Petrol. 1998, 1–11. [Google Scholar] [CrossRef]
  42. Fan, W.; Jiang, N.; Xu, X.; Hu, J.; Zong, K. Petrogenesis of the middle Jurassic appinite and coeval granitoids in the Eastern Hebei area of North China Craton. Lithos 2017, 278–281, 331–346. [Google Scholar] [CrossRef]
  43. Cui, F. Petrogenesis of Mesozoic Granitoids and Crustal Evolution in Xingcheng Area, Western Liaoning Province; Jilin University: Changchun, China, 2015; pp. 1–188. [Google Scholar]
  44. Peccerillo, A.; Taylor, S.R. Geochemistry of eocene calc-alkaline volcanic rocks from the Kastamonu area, Northern Turkey. Contrib. Mineral. Petrol. 1976, 58, 63–81. [Google Scholar] [CrossRef]
  45. Liu, H.; Zhai, M.; Liu, J.; Sun, S. The Mesozoic granitoids in the northern marginal region of North China Craton evolution from post-collisional to anorogenic settings. Acta Petrol. Sin. 2002, 18, 433–448. [Google Scholar]
  46. Wu, F.Y.; Yang, J.H.; Wilde, S.A.; Zhang, X.O. Geochronology, petrogenesis and tectonic implications of Jurassic granites in the Liaodong Peninsula, NE China. Chem. Geol. 2005, 221, 127–156. [Google Scholar] [CrossRef]
  47. Defant, M.J.; Drummond, M.S. Derivation of some modern arc magmas by melting of young subducted lithosphere. Nature 1990, 347, 662. [Google Scholar] [CrossRef]
  48. Castillo, P.R.; Janney, P.E.; Solidum, R.U. Petrology and geochemistry of Camiguin Island, southern Philippines: Insights to the source of adakites and other lavas in a complex arc setting. Contrib. Mineral. Petrol. 1999, 134, 33–51. [Google Scholar] [CrossRef]
  49. Hou, Z.; Wang, T. Isotopic mapping and deep material probing (II): Imaging crustal architecture and its control on mineral systems. Earth Sci. Front. 2018, 25, 20–41, (In Chinese with English abstract). [Google Scholar]
  50. Griffin, W.L.; Wang, X.; Jackson, S.E.; Pearson, N.J.; O′Reilly, S.Y.; Xu, X.; Zhou, X. Zircon chemistry and magma mixing, SE China: In-situ analysis of Hf isotopes, Tonglu and Pingtan igneous complexes. Lithos 2002, 61, 237–269. [Google Scholar] [CrossRef]
  51. Chen, Z.G.; Zhang, L.C.; Wu, H.Y.; Wan, B.; Zeng, Q.D. Geochemistry study and tectonic background of a style host granite in Nianzigou molybdenum deposit in Xilamulun molybdenum metallogenic belt, Inner Mongolia. Acta Petrol. Sin. 2008, 24, 879–889. [Google Scholar]
  52. Brown, M. The generation, segregation, ascent and emplacement of granite magma: The migmatite-to-crustally-derived granite connection in thickened orogens. Earth-Sci. Rev. 1994, 36, 83–130. [Google Scholar] [CrossRef]
  53. Gao, S.; Rudnick, R.; Yuan, H.; Liu, X.; Liu, Y.; Xu, W.L.; Ling, W.; Ayers, J.; Wang, X.; Wang, Q. Recycling lower continental crust in the North China Craton. Nature 2004, 432, 892–897. [Google Scholar] [CrossRef]
  54. Jiang, S.; Liang, Q.; Bagas, L. Re-Os ages for molybdenum mineralization in the Fengning region of northern Hebei Province, China: New constraints on the timing of mineralization and geodynamic setting. J. Asian Earth Sci. 2014, 79, 873–883. [Google Scholar] [CrossRef]
  55. Song, Y.; Jiang, S.-H.; Bagas, L.; Li, C.; Hu, J.-Z.; Zhang, Q.; Zhou, W.; Ding, H.-Y. The geology and geochemistry of Jinchangyu gold deposit, North China Craton: Implications for metallogenesis and geodynamic setting. Ore Geol. Rev. 2016, 73, 313–329. [Google Scholar] [CrossRef]
  56. Yang, J.; Wu, F. Triassic magmatism and its relation to decratonization in the eastern North China Craton. Sci. China Ser. D Earth Sci. 2009, 52, 1319–1330. [Google Scholar] [CrossRef]
  57. Zeng, Q.; Liu, J.; Qin, K.; Fan, H.; Chu, S.; Wang, Y.; Zhou, L. Types, characteristics, and time-space distribution of molybdenum deposits in China. Int. Geol. Rev. 2014, 55, 1311–1358. [Google Scholar] [CrossRef]
  58. Wang, J.B.; Zou, T.; Wang, Y.W.; Long, L.L.; Zhang, H.Q.; Liao, Z.; Xie, H.J. Deposit associations, metallogenesis and metallogenic lineage of molydenum-polymetallic deposits in China. Miner. Depos. 2014, 33, 447–470. [Google Scholar]
  59. Dai, J.; Xie, G.; Wang, R.; Ren, T.; Wang, T. Re-Os isotope dating of molybdenite seprates from the Yajishan Mo(Cu) deposit, Inner Mongolia, and its geological significance. Geol. China 2012, 39, 1614–1621, (In Chinese with English abstract). [Google Scholar]
  60. Zeng, Q.; Liu, J.; Zhang, Z.; Chen, W.; Zhang, W. Geology and geochronology of the Xilamulun molybdenum metallogenic belt in eastern Inner Mongolia, China. Int. J. Earth Sci. 2011, 100, 1791–1809. [Google Scholar] [CrossRef]
  61. Dai, J.; Mao, J.; Zhao, C.; Xie, G.; Yang, F.; Wang, Y. New U—Pb and Re—Os age data and the geodynamic setting of the Xiaojiayingzi Mo (Fe) deposit, western Liaoning province, Northeastern China. Ore Geol. Rev. 2009, 35, 235–244. [Google Scholar] [CrossRef]
  62. Sun, Z.J.; Sun, S.G.; Yu, H.N. Chronology and geochemical characteristics of zhuanshanzi granite in chifeng and its diagenetic dynamics background. J. Jilin Univ. (Engl. Sci. Ed.) 2016, 46, 1740–1753. [Google Scholar]
  63. Zhang, S.; Zhao, Y.; Liu, X.; Liu, D.; Chen, F.; Xie, L.; Chen, H.H. Late Paleozoic to Early Mesozoic mafic—Ultramafic complexes from the northern North China Block: Constraints on the composition and evolution of the lithospheric mantle. Lithos 2009, 110, 229–246. [Google Scholar] [CrossRef]
  64. Fu, L.; Wei, J.; Kusky, T.M.; Chen, H.; Tan, J.; Li, Y.; Shi, W.; Chen, C.; Zhao, S. The Cretaceous Duimiangou adakite-like intrusion from the Chifeng region, northern North China Craton: Crustal contamination of basaltic magma in an intracontinental extensional environment. Lithos 2012, 134, 273–288. [Google Scholar] [CrossRef]
  65. Sun, M.; Armstrong, R.L.; St, J.; Lambert, R.; Jiang, C.; Wu, J. Petrochemistry and Sr, Pb and Nd isotopic geochemistry of the paleoproterozoic kuandian complex, the eastern Liaoning province, China. Precambrian Res. 1993, 62, 171–190. [Google Scholar]
  66. Wu, F.; Yang, Y.; Xie, L.; Yang, J.; Xu, P. Hf isotopic compositions of the standard zircons and baddeleyites used in U-Pb geochronology. Chem. Geol. 2006, 234, 105–126. [Google Scholar] [CrossRef]
  67. Jahn, B.M.; Wu, F.Y.; Lo, C.; Tsai, C. Crust-mantle interaction induced by deep subduction of the continental crust: Geochemical and Sr–Nd isotopic evidence from post-collisional mafic–ultramafic intrusions of the northern Dabie complex, central China. Chem. Geol. 1999, 157, 119–146. [Google Scholar] [CrossRef]
  68. Zhang, X.; Yuan, L.; Wilde, S.A. Crust/mantle interaction during the construction of an extensional magmatic dome: Middle to Late Jurassic plutonic complex from western Liaoning, North China Craton. Lithos 2014, 205, 185–207. [Google Scholar] [CrossRef]
  69. Zhang, L.; Wu, H.; Wan, B.; Chen, Z. Ages and geodynamic settings of Xilamulun Mo-Cu metallogenic belt in the northern part of the North China Craton. Gondwana Res. 2009, 16, 243–254. [Google Scholar] [CrossRef]
  70. Zhang, S.H.; Zhao, Y.; Liu, J.M.; Hu, J.M.; Song, B.; Liu, J.; Wu, H. Geochronology, geochemistry and tectonic setting of the Late Paleozoic—Early Mesozoic magmatism in the northern margin of the North China Block: A preliminary review. Acta Petrol. Mineral. 2010, 29, 824–842. [Google Scholar]
  71. Black, R.; Liégeois, J.P. Cratons, mobile belts, alkaline rocks and continental lithospheric mantle: The Pan-African testimony. J. Geol. Soc.-J. Geol. Soc. 1993, 150, 89–98. [Google Scholar] [CrossRef]
  72. Eby, G.N. The A-type granitoids: A review of their occurrence and chemical characteristics and speculations on their petrogenesis. Lithos 1990, 26, 115–134. [Google Scholar] [CrossRef]
  73. Eby, G.N. Chemical subdivision of the A-type granitoids: Petrogenetic and tectonic implications. Geology 1992, 20, 641. [Google Scholar] [CrossRef]
  74. Bonin, B. From orogenic to anorogenic settings: Evolution of granitoid suites after a major orogenesis. Geol. J. 1990, 25, 261–270. [Google Scholar] [CrossRef]
  75. Liégeois, J.; Navez, J.; Hertogen, J.; Black, R. Contrasting origin of post-collisional high-K calc-alkaline and shoshonitic versus alkaline and peralkaline granitoids. The use of sliding normalization. Lithos 1998, 45, 1–28. [Google Scholar] [CrossRef]
  76. Mu, B.; Shao, J.; Chu, Z.; Yan, G.; Qiao, G. Sm-Nd age and Sr-Nd isotopic characteristics of the Fanshan potassic alkaline ultramafic-syenite complex in Hebei province. Acta Petrol. Sin. 2001, 03, 358–365. [Google Scholar]
  77. Peng, P.; Zhai, M.; Guo, J.; Zhang, H.; Zhang, Y. Petrogenesis of Triassic post-collisional syenite plutons in the Sino-Korean craton: An example from North Korea. Geol. Mag.-Geol. Mag. 2008, 145, 637–647. [Google Scholar] [CrossRef]
  78. Pearce, J.A.; Harris, N.B.; Tindle, A.G. Trace element discrimination diagrams for the tectonic interpretation of granitic rocks. J. Petrol. 1984, 25, 956–983. [Google Scholar] [CrossRef]
  79. Xiao, W.; Windley, B.F.; Sun, S.; Li, J.; Huang, B.; Han, C.; Yuan, C.; Sun, M.; Chen, H. A tale of amalgamation of three Permo-Triassic collage systems in Central Asia: Oroclines, sutures, and terminal accretion. Annu. Rev. Earth Pl. Sc. 2015, 43, 477–507. [Google Scholar] [CrossRef]
  80. Milisenda, C.C.; Liew, T.C.; Hofmann, A.W.; Kröner, A. Isotopic mapping of age provinces in precambrian High-Grade terrains: Sri lanka. J. Geol. 1988, 96, 608–615. [Google Scholar] [CrossRef]
  81. DePaolo, D.J.; Linn, A.M.; Schubert, G. The continental crustal age distribution: Methods of determining mantle separation ages from Sm-Nd isotopic data and application to the southwestern United States. J. Geophys. Res. Solid Earth 1991, 96, 2071–2088. [Google Scholar] [CrossRef]
  82. Wang, T.; Jahn, B.; Kovach, V.P.; Tong, Y.; Hong, D.; Han, B. Nd-Sr isotopic mapping of the Chinese Altai and implications for continental growth in the Central Asian Orogenic Belt. Lithos 2009, 110, 359–372. [Google Scholar] [CrossRef]
  83. Griffin, W.L.; Begg, G.C.; O′Reilly, S.Y. Continental-root control on the genesis of magmatic ore deposits. Nat. Geosci. 2013, 6, 905–910. [Google Scholar] [CrossRef]
  84. Kemp, A.; Hawkesworth, C.J.; Paterson, B.A.; Kinny, P.D. Episodic growth of the Gondwana Supercontinent from hafnium and oxygen isotopes in zircon. Nature 2006, 439, 580–583. [Google Scholar] [CrossRef]
  85. Mole, D.R.; Fiorentini, M.L.; Cassidy, K.F.; Kirkland, C.L.; Thebaud, N.; Mccuaig, T.C.; Doublier, M.P.; Duuring, P.; Romano, S.S.; Maas, R. Crustal evolution, intra-cratonic architecture and the metallogeny of an Archaean craton. Geol. Soc. Lond. Spec. Publ. 2013, 393, P393–P398. [Google Scholar] [CrossRef]
  86. Hou, Z.; Zheng, Y.; Yang, Z.; Yang, Z. Metallogenesis of continental collision setting: Part I. Gangdese Cenozoic porphyry Cu-Mo systems in Tibet. Miner. Depos. 2012, 31, 647–670. [Google Scholar]
  87. Mole, D.; Fiorentini, M.; Thébaud, N.; Cassidy, K.; McCuaig, T.; Kirkland, C.; Romano, S.; Doublier, M.; Belousova, E.; Barnes, S.; et al. Archean komatiite volcanism controlled by the evolution of early continents. Proc. Natl. Acad. Sci. USA 2014, 111, 10083–10088. [Google Scholar] [CrossRef] [PubMed]
  88. Kovalenko, V.; Yarmolyuk, V.; Kovach, V.; Kotov, A.; Kozakov, I.; Salnikova, E.; Larin, A. Isotope provinces, mechanisms of generation and sources of the continental crust in the Central Asian mobile belt: Geological and isotopic evidence. J. Asian Earth Sci. 2004, 23, 605–627. [Google Scholar] [CrossRef]
  89. Wang, C.M.; Bagas, L.; Lu, Y.J.; Santosh, M.; Du, B.; McCuaig, T.C. Terrane boundary and spatio-temporal distribution of ore deposits in the Sanjiang Tethyan Orogen: Insights from zircon Hf-isotopic mapping. Earth-Sci. Rev. 2016, 156, 39–65. [Google Scholar] [CrossRef]
  90. Xu, X.; Jiang, N.; Fan, W.; Hu, J.; Zong, K. Petrogenesis and geological implications for the Mesozoic granites in Qinglong area, eastern Hebei Province. Acta Pertrologica Sinica. 2016, 32, 212–232, (in Chinese with English abstract). [Google Scholar]
  91. Zong, K.; Klemd, R.; Yuan, Y.; He, Z.; Guo, J.; Shi, X.; Liu, Y.; Hu, Z.; Zhang, Z. The assembly of Rodinia: The correlation of early Neoproterozoic (ca. 900 Ma) high-grade metamorphism and continental arc formation in the southern Beishan Orogen, southern Central Asian Orogenic Belt (CAOB). Precambrian Res. 2017, 290, 32–48. [Google Scholar] [CrossRef]
  92. Hu, Z.; Zhang, W.; Liu, Y.; Gao, S.; Li, M.; Zong, K.; Chen, H.; Hu, S. “Wave” Signal-Smoothing and Mercury-Removing Device for Laser Ablation Quadrupole and Multiple Collector ICPMS Analysis: Application to Lead Isotope Analysis. Anal. Chem. 2015, 87, 1152–1157. [Google Scholar] [CrossRef]
  93. Liu, D.; Wilde, S.A.; Wan, Y.; Wu, J.; Zhou, H.; Dong, C.; Yin, X. New U-Pb and Hf Isotopic data confirm Anshan as the oldest preserved segment of the North China Craton. Am. J. Sci. 2008, 308, 200–231. [Google Scholar] [CrossRef]
  94. Liu, Y.; Gao, S.; Hu, Z.; Gao, C.; Zong, K.; Wang, D. Continental and Oceanic Crust Recycling-Induced Melt Peridotite Interactions in the Trans-North China Orogen: UPb Dating, Hf Isotopes and Trace Elements in Zircons from Mantle Xenoliths. J. Petrol. 2010, 51, 537–571. [Google Scholar] [CrossRef]
  95. Ludwig, K.R. ISOPLOT 3.0: A Geochronological Toolkit for Microsoft Excel. Berkeley Geochronology Center Special Publication. US Geol. Sur. Open File Rep. 2003, 39, 91–445. [Google Scholar]
  96. Russell, W.A.; Papanastassiou, D.A.; Tombrello, T.A. Ca isotope fractionation on the earth and other solar system materials. Geochim. Cosmochim. Acta 1978, 42, 1075–1090. [Google Scholar] [CrossRef]
  97. Lin, J.; Liu, Y.S.; Yang, Y.H.; Hu, Z.C. Calibration and correction of LA-ICP-MS and LA-MC-ICP-MS analyses for element contents and isotopic ratios. Solid Earth Sci. 2016, 1, 5–27. [Google Scholar] [CrossRef]
  98. Thirlwall, M.F. Long-term reproducibility of multicollector sr and nd isotope ratio analysis. Chem. Geol. 1991, 94, 85–104. [Google Scholar] [CrossRef]
  99. Li, C.F.; Li, X.H.; Li, Q.L.; Guo, J.H.; Yang, Y.H. Rapid and precise determination of Sr and Nd isotopic ratios in geological samples from the same filament loading by thermal ionization mass spectrometry employing a single-step separation scheme. Anal. Chim. Acta 2012, 727, 54–60. [Google Scholar] [CrossRef] [PubMed]
  100. Tanaka, T.; Togashi, S.; Kamioka, H.; Amakawa, H.; Kagami, H.; Hamamoto, T.; Yuhara, M.; Orihashi, Y.; Yoneda, S.; Shimizu, H.; et al. Jndi-1: A neodymium isotopic reference in consistency with lajolla neodymium. Chem. Geol. 2000, 168, 279–281. [Google Scholar] [CrossRef]
  101. Dong, C.Y.; Wan, Y.S.; Long, T.; Zhang, Y.H.; Liu, J.H.; Ma, M.Z.; Xie, H.Q.; Liu, D.Y. Oxygen isotopie compositions of zircons from paleoproterozoic metasedimentary rocks in the Daqingshan-Jining area, North China craton: In situ SHRIMP analysis. Acta Petrol. Sin. 2016, 32, 659–681, (in Chinese with English abstract). [Google Scholar]
  102. Ickert, R.B.; Hiess, J.; Williams, I.S.; Holden, P.; Ireland, T.R.; Lanc, P.; Schram, N.; Foster, J.J.; Clement, S.W. Determining high precision, in situ, oxygen isotope ratios with a SHRIMP II: Analyses of MPI-DING silicate-glass reference materials and zircon from contrasting granites. Chem Geol. 2008, 257, 114–128. [Google Scholar] [CrossRef]
  103. Black, L.P.; Sandra, L.K.; Charlotte, M.A.; Donald, W.D.; Aleinikoff, J.N.; John, N.A.; John, W.V.; Roland, M.; Ian, H.C.; Russell, J.K.; et al. Improved 206Pb/238U microprobe geochronology by the monitoring of a trace-element-related matrix effect; SHRIMP, ID–TIMS, ELA–ICP–MS and oxygen isotope documentation for a series of zircon standards. Chem. Geol. 2004, 205, 115–140. [Google Scholar] [CrossRef]
  104. Hou, K.J.; Li, Y.H.; Zou, T.R.; Qu, X.M.; Xie, G.Q. Laser ablation-MC-ICP-MS technique for Hf isotope microanalysis of zircon and its geological applications. Acta Petrol. Sin. 2007, 23, 2595–2604, (In Chinese with English abstract). [Google Scholar]
Figure 1. (a) Sketchmap of North China Craton (Wu et al., 2019); (b) outline map of Phanerozoic granitoids in Chifeng–Chaoyang and adjacent areas [8,9]. ①—Chifeng–Kaiyuan fault; ②—Lingyuan–Beipiao fault; ③—Honghan–Balihan fault; (c) Histogram of ages of intrusive rocks in two episodes of Chifeng–Chaoyang and adjacent areas (supplementary data are listed in the Supplementary Materials).
Minerals 12 01117 g001
Figure 2. (a) Location of granite porphyry dikes in the Taijiying gold deposit; (b) outcrop of granite porphyry; (c) granite porphyry from drilling core; (df) photomicrographs of granite porphyries. Abbreviations: Qtz = quartz, Pl = plagioclase, Ser = sericite, Chl = chlorite, Kf = K-feldspar.
Minerals 12 01117 g002
Figure 3. U–Pb concordia plots and age data histograms for samples L20617-9 and L20617-13 (granite porphyry dikes) in Taijiying gold deposit.
Minerals 12 01117 g003
Figure 4. (a) Plots of K2O vs. SiO2 diagram; (b) A/NK (molar ratio Al2O3/(Na2O + K2O)) vs. A/CNK (molar ratio Al2O3/(CaO + Na2O + K2O)) diagram for granite porphyries from Chifeng–Chaoyang district ((a) is based on [37]).
Minerals 12 01117 g004
Figure 5. Harker diagrams for Chifeng–Chaoyang granites. (a) TiO2 vs. SiO2; (b) Al2O3 vs. SiO2; (c) MgO vs. SiO2; (d) Fe2O3 vs. SiO2; (e) P2O5 vs. SiO2; (f) CaO vs. SiO2; (g) MnO vs. SiO2; (h) Na2O vs. SiO2.
Minerals 12 01117 g005
Figure 6. (a) Primitive, mantle-normalized trace element diagram for granite; (b) chondrite-normalized REE patterns diagram for granites. The chondrite values are from [38]. The primitive mantle values are from [39].
Minerals 12 01117 g006
Figure 7. Classification diagrams for the Triassic and Jurassic granitic rocks. (a) FeOT/MgO vs. (Zr + Nb + Ce + Y), (b) (K2O + Na2O)/CaO vs. (Zr + Nb + Ce + Y), (c) Zr vs. 10,000 Ga/Al, (d) Nb vs. 10,000 Ga/Al, (e) Ce vs. 10,000 Ga/Al, and (f) Y vs. 10,000 Ga/Al classification diagrams [40], indicating that the Triassic granites are transitional between the I-, S-, M-, and A-types or highly fractionated, and Jurassic granites are mainly the I-, S-, M-, or unfractionated types, with few A-types or highly fractionated granites. A: A-type granite; I, S, and M: I-, S-, and M-type granite; FG: fractionated felsic granite; OGT: unfractionated M-, I-, and S-type granite.
Minerals 12 01117 g007
Figure 8. Elemental variation diagrams for Chifeng–Chaoyang district granites. (a) Zr vs. SiO2; (b) Nb vs. SiO2; (c) Y vs. SiO2; (d) La vs. SiO2; (e) Ce vs. SiO2; (f) Ga vs. SiO2; (g) Ta vs. SiO2; (h) Rb vs. SiO2; (i) Ba vs. SiO2; (j) La/Yb vs. La; (k) La/Yb vs. Cr; (l) Sr/Y vs. Sr.
Minerals 12 01117 g008
Figure 9. (a) Outline map of the Chifeng–Chaoyang district showing distribution of the Mesozoic gold and molybdenum deposits. ①—Chifeng–Kaiyuan fault; ②—Lingyuan–Beipiao fault; ③—Honghan–Balihan fault; (b) The periodical pattern of Triassic and Jurassic gold and molybdenum deposits.
Minerals 12 01117 g009
Figure 10. Zircon δ18O versus εHf(t) of Triassic granite porphyries in Taijiying gold deposit. The εHf(t) values of depleted mantle, the SCLM beneath the NCC, mixed mantle, and ancient crust are +16.2, −8 [33], +6, and −16, respectively. The δ18O of ancient crust and mantle are +9.5 ± 0.5% (average of 2.5 Ga and 1.8 Ga crust) and + 5.3 ± 0.3‰ [41]. Age for calculation depends on the samples. Triassic spots from [8]. Jurassic spots from [42]. Triassic juvenile lithospheric mantles are from [33].
Minerals 12 01117 g010
Figure 12. Outline maps of Triassic and Jurassic magmatic source and mineralization. (a) the metallogenic pattern and tectonic setting of study area in Triassic; (b) the metallogenic pattern and tectonic setting of study area in Jurassic.
Minerals 12 01117 g012
Figure 13. Discrimination diagrams of tectonic setting of granitoids from the Chifeng–Chaoyang district (based on [78]). ORG—ocean-ridge granites; syn-COLG—syn-collisional granites; VAG—volcanic arc granites; WPG—within-plate granites. Data sources and legends are the same as Figure 4.
Minerals 12 01117 g013
Table 1. LA-ICP-MS zircon U–Pb data of the granite porphyry in Taijiying gold deposit.
SpotsContent (ppm)RatiosAge
Total Pb232Th238UTh/ U207Pb/206Pb207Pb/235U206Pb/238U207Pb/206Pb207Pb/235U206Pb/238U
L20617-9, granite porphyry, 24 spots, weighted mean age = 234.2 ± 1.1 Ma, MSWD = 1.07
L20617-9-0186.32121817500.70.04990.00160.25950.00790.03740.000419172.212346.42362.64
L20617-9-0358.0668212360.550.04980.00230.25450.0090.03630.0004183107.392307.282302.53
L20617-9-0461.4864012890.50.05050.0020.26390.00950.03720.000521794.432387.612363.32
L20617-9-0591.15143718360.780.04870.00170.2510.00870.03660.000520081.472277.082322.97
L20617-9-0662.5670212990.540.05130.00210.26840.01080.03730.000625496.282418.672363.44
L20617-9-0750.147710510.450.05010.00260.26630.01270.03790.0006198124.9824010.182403.94
L20617-9-0864.9677113330.580.05050.00220.26220.01080.03710.0005220102.762368.692353.36
L20617-9-0955.8947011860.40.05030.0020.26530.01040.03780.000520987.952398.382393.27
L20617-9-1060.9166512500.530.05090.00180.26580.00940.03730.000423586.12397.532362.77
L20617-9-1146.0251010050.510.05020.00190.25410.00960.03640.000421188.882307.752302.76
L20617-9-1262.6370913210.540.05190.0020.26210.00970.03640.000428087.032367.842302.39
L20617-9-1370.8390614470.630.05040.00170.2570.00850.03680.000421343.512326.912332.69
L20617-9-1459.5177812050.650.04940.00180.25750.00970.03760.000516587.952337.82382.99
L20617-9-1580.2492816730.550.05180.00170.26220.00880.03650.000427669.442367.122312.44
L20617-9-1684.37108816890.640.05050.00180.26350.00930.03770.000422049.072377.442382.65
L20617-9-1797.14144619260.750.05090.00160.26010.00790.03680.000423970.362356.42332.39
L20617-9-1885.92131016870.780.05070.00160.26380.00860.03740.000422874.062386.912372.72
L20617-9-1984.23116116690.70.0510.00180.26610.00960.03750.000423983.322407.692372.54
L20617-9-2055.4560911890.510.04980.00220.25430.00990.03670.0005187103.692307.982322.94
L20617-9-2151.0853710930.490.05080.00220.26120.01120.03690.0005232101.8423692333.03
L20617-9-2292.16145218400.790.04980.00260.25590.01150.03660.0005183120.362319.32323.01
L20617-9-2339.612548820.290.05170.00240.26950.01230.03730.0005333104.622429.852363.19
L20617-9-2449.5531311340.280.05060.00220.2580.01040.03660.000523398.142338.432322.94
L20617-9-2537.274228040.520.04970.00220.25780.01150.0370.0005189103.692339.32343.1
L20617-13, granite porphyry, 23 spots, weighted mean age = 231 ± 2.4 Ma, MSWD = 1.9
L20617-13-0164.4579214010.570.05090.00190.25440.00940.03580.000423988.882307.652272.65
L20617-13-0260.1461313220.460.05020.00250.25140.00980.03570.0005211116.652287.912262.87
L20617-13-0372.1104415390.680.05120.00190.26170.00970.03660.000525089.82367.822323.11
L20617-13-0686.17154517870.870.04990.00160.24840.00780.03580.000419174.062256.372272.5
L20617-13-0774.8289916890.530.05010.00190.25760.0090.03660.000519890.732337.242323.13
L20617-13-0898.93147319740.750.04960.00170.24660.00810.03580.000417679.622246.622272.4
L20617-13-0976.28111915610.720.04990.00160.25590.00840.03680.000419171.292316.782332.44
L20617-13-1078.11108216170.670.04950.00170.25520.00880.03720.000516984.252317.12352.93
L20617-13-1151.4958311450.510.05020.00210.24720.00980.03560.000520698.132247.972252.96
L20617-13-1246.085009950.50.05020.00170.25580.00890.03680.000520679.622317.212332.85
L20617-13-1376.4298916030.620.05040.00150.25530.00790.03650.000421372.212316.372312.4
L20617-13-1435.823217740.410.05090.00180.26140.00940.03690.000423581.472367.532342.57
L20617-13-1553.5652011460.450.04970.0020.25360.00850.03660.000418994.432296.92322.58
L20617-13-1661.163512770.50.04980.00190.25740.00960.03720.0005183119.432337.782352.86
L20617-13-1835.993037820.390.05190.00230.26650.01170.0370.0005280106.472409.392343.35
L20617-13-1977.4393015910.580.05060.00170.26150.00880.03710.000522075.912367.092352.89
L20617-13-20112.76180022000.820.05070.00150.26180.0080.03720.000423370.362366.422362.71
L20617-13-22105.11183421330.860.05140.00140.25460.00690.03570.000426161.12305.62262.54
L20617-13-2353.5356211520.490.05050.00160.25870.00850.0370.000421780.542346.832342.64
L20617-13-2431.083087040.440.050.00180.24840.00940.03580.000519585.172257.622273.02
L20617-13-2571.1390013810.650.05040.00330.25510.01820.03570.0004213149.9823114.692262.72
L20617-13-2696.29177519370.920.05110.00190.24990.00850.03590.000625680.542276.942273.6
L20617-13-2747.7751010560.480.05110.00220.25420.00930.03580.000425698.142307.532272.48
Table 2. Whole-rock geochemical data of granite porphyry in Taijiying.
SamplesL20617-1-1L20617-2-1L20617-3-1L20617-4-1L20617-5-1L20617-7L20617-8L20617-9L20617-10L20617-11L20617-12L20617-13L20617-14L20617-15
Major elements (wt.%)
SiO273.9 73.4 75.3 75.9 76.7 76.1 69.0 76.2 75.3 77.0 77.6 75.7 76.6 77.2
TiO20.12 0.11 0.11 0.11 0.09 0.10 0.10 0.10 0.11 0.10 0.10 0.11 0.10 0.10
Al2O312.5 12.5 12.6 12.6 12.3 12.2 11.4 12.3 12.6 12.5 12.2 12.6 12.3 12.5
Fe2O30.83 0.76 1.02 0.89 0.90 1.67 1.40 1.72 1.42 1.41 1.46 1.88 1.77 1.39
MnO0.04 0.04 0.02 0.03 0.04 0.02 0.12 0.02 0.03 0.02 0.01 0.03 0.04 0.02
MgO0.53 0.53 0.49 0.61 0.40 0.18 0.20 0.38 0.19 0.21 0.20 0.28 0.21 0.22
CaO1.15 1.23 0.48 0.44 0.48 0.75 5.40 0.61 0.74 0.20 0.12 0.54 0.39 0.20
Na2O2.90 3.27 3.04 2.65 2.84 3.89 3.52 2.72 3.48 2.35 3.18 3.24 4.12 2.36
K2O4.55 4.96 4.30 4.25 4.67 4.04 3.92 4.15 4.19 4.63 4.44 4.56 3.82 4.58
P2O50.02 0.01 0.01 0.03 0.02 0.02 0.02 0.02 0.02 0.02 0.02 0.02 0.02 0.02
LOI2.09 1.80 1.50 0.96 1.07 1.12 4.93 1.58 1.32 1.19 0.83 1.28 0.91 1.28
Total99.60 99.63 99.59 99.26 100.41 100.10 100.06 99.72 99.36 99.55 100.16 100.13 100.35 99.86
FeO1.03 0.96 0.69 0.79 0.86 0.90 0.72 0.92 0.60 0.65 0.64 1.12 0.97 0.64
FeOT1.78 1.64 1.61 1.59 1.67 2.41 1.98 2.46 1.88 1.92 1.95 2.81 2.56 1.89
Mg#38.48 40.34 38.99 44.57 33.44 13.62 17.57 24.29 17.32 18.48 17.83 17.50 14.91 19.85
K2O/Na2O1.57 1.52 1.41 1.60 1.64 1.04 1.11 1.53 1.20 1.97 1.40 1.41 0.93 1.94
A/CNK1.06 0.96 1.20 1.29 1.16 1.01 0.58 1.22 1.09 1.35 1.19 1.12 1.06 1.36
Tzr787774809804801786702800784809805903906924
Trace elements (ppm)
Li 3.16 3.94 12.2 4.97 8.61 4.08 3.67 1.97 3.63
Be 1.79 2.20 2.43 2.31 2.89 2.02 1.68 1.83 1.79
Sc 1.52 1.42 1.28 1.64 1.34 1.29 1.39 1.52 1.28
V8.31 8.14 8.29 12.3 6.50 1.98 1.87 2.56 1.72 2.72 2.47 5.72 1.46 6.25
Cr5.81 6.61 5.63 30.1 8.56 42.9 8.06 6.28 8.24 10.5 5.53 16.9 7.56 15.1
Co0.86 0.67 0.61 2.16 0.89 0.62 0.64 0.66 0.35 0.31 0.32 0.41 0.38 0.40
Ni4.13 4.33 4.00 14.75.55 2.76 1.94 12.0 1.56 1.54 1.73 2.19 1.90 2.36
Cu 4.93 3.03 4.42 2.77 3.32 2.80 3.58 3.94 3.72
Zn 29.6 22.3 25.3 26.3 38.6 28.2 36.0 32.2 36.7
Ga 16.7 16.6 17.8 19.1 20.4 16.5 17.5 17.1 17.4
Rb167 179 178 225 246 128 137 145 164 193 160 171 142 168
Sr43.7 57.9 51.3 50.9 41.9 44.0 127 39.0 46.3 18.2 34.9 48.5 40.5 48.4
Y23.6 19.9 17.8 12.5 16.3 18.2 18.6 16.7 18.6 17.5 18.1 18.8 19.0 18.6
Zr166 181 175 97.0 112 170 157 155 171 152 168 174 182 170
Nb35.3 32.0 33.2 21.5 32.1 25.7 25.4 27.2 26.7 25.3 26.9 26.8 27.7 26.5
Sn3.36 3.36 3.13 1.97 2.96 2.60 2.44 2.56 2.90 3.29 2.60 2.89 2.84 2.98
Cs 1.37 1.51 1.74 3.04 3.92 1.60 1.75 2.02 1.75
Ba117.0 105.0 138.0 150.0 117.0 120 94.5 175 82.7 107 122 100.0 52.5 98.1
La53.7 50.9 51.0 22.8 18.7 46.0 49.6 43.5 48.4 47.0 46.7 46.8 48.8 46.8
Ce118 102 102 42.2 46.7 94.8 101 94.4 101 97.5 97.5 96.3 100 96.9
Pr13.2 11.1 11.2 5.04 4.64 10.2 10.9 10.3 10.8 10.5 10.6 10.5 10.9 10.4
Nd42.7 36.6 36.3 16.9 15.9 34.5 37.7 35.5 36.7 35.9 36.3 34.7 36.5 34.9
Sm7.29 6.21 5.98 3.18 3.25 6.13 6.49 6.26 6.24 6.36 6.70 6.45 6.39 6.16
Eu0.22 0.27 0.29 0.39 0.24 0.23 0.25 0.24 0.23 0.25 0.24 0.23 0.23 0.25
Gd6.62 5.60 5.50 2.71 2.81 4.04 4.31 4.00 4.24 4.21 4.26 4.13 4.32 4.22
Tb0.88 0.75 0.69 0.38 0.45 0.61 0.65 0.59 0.63 0.61 0.68 0.61 0.67 0.63
Dy4.43 3.69 3.39 2.18 2.85 3.49 3.44 3.09 3.44 3.26 3.44 3.50 3.54 3.44
Ho0.79 0.65 0.59 0.40 0.53 0.60 0.61 0.58 0.65 0.60 0.61 0.63 0.66 0.61
Er2.48 2.06 1.94 1.26 1.64 1.75 1.77 1.54 1.80 1.59 1.69 1.78 1.75 1.67
Tm0.37 0.30 0.28 0. 20 0.28 0.25 0.25 0.24 0.26 0.25 0.25 0.25 0.26 0.26
Yb2.43 2.06 1.89 1.37 1.78 1.63 1.62 1.59 1.70 1.68 1.63 1.70 1.69 1.67
Lu0.40 0.33 0.29 0.22 0.29 0.24 0.23 0.23 0.25 0.24 0.25 0.25 0.25 0.25
Hf4.42 4.56 4.44 2.40 3.06 5.49 4.92 5.12 5.49 5.21 5.33 5.62 5.57 5.59
Ta2.86 2.83 2.86 2.30 2.82 2.06 1.95 2.16 2.19 2.10 2.13 2.02 2.15 2.01
Tl 0.79 0.88 0.95 1.07 1.14 1.09 1.06 0.91 1.08
Pb 10.9 7.79 6.77 9.03 7.18 10.3 11.8 10.5 11.5
Th28.0 27.7 26.8 26.8 27.2 28.2 27.4 28.8 28.9 28.4 29.7 29.6 29.2 29.2
U4.25 8.32 6.52 3.57 3.37 6.55 5.94 4.55 4.50 3.38 6.09 6.95 6.28 6.79
Th/U6.58 3.32 4.10 7.51 8.06 4.30 4.62 6.33 6.42 8.39 4.87 4.26 4.66 4.30
Rb/Sr3.82 3.10 3.46 4.42 5.88 2.92 1.08 3.73 3.55 10.63 4.57 3.52 3.50 3.48
Zr/Y7.03 9.11 9.86 7.70 6.89 9.38 8.43 9.32 9.21 8.70 9.27 9.24 9.55 9.15
Sr/Y1.85 2.91 2.88 4.07 2.57 2.42 6.82 2.34 2.49 1.04 1.93 2.58 2.13 2.61
ΣREE253.62 222.28 221.31 99.28 100.09 204.44 218.76 202.06 216.38 209.95 210.89 207.89 216.40 208.11
LREE/HREE12.79 13.40 14.21 10.38 8.43 15.22 15.97 16.04 15.68 15.88 15.48 15.19 15.47 15.34
LaN/YbN15.8 17.7 19.4 11.9 7.6 20.3 22.0 19.6 20.4 20.0 20.6 19.8 20.8 20.1
δEu0.10 0.14 0.15 0.40 0.24 0.14 0.14 0.14 0.14 0.15 0.14 0.14 0.13 0.15
δCe1.06 1.00 1.00 0.92 1.19 1.07 1.07 1.09 1.08 1.08 1.07 1.06 1.07 1.08
86Rb/86Sr 8.672 4.815 12.647 12.437 11.543 12.801
87Sr/86Sr 0.735249 0.720037 0.747575 0.748085 0.740880 0.749636
8 6 9 9 10 10
(87Sr/86Sr)i 0.706880.704290.70620.7074 0.703120.70776
147Sm/144Nd 0.1022 0.1976 0.1530 0.1079 0.1564 0.1840
143Nd/144Nd 0.5125820.512580.5125880.512581 0.5125830.512582
5 5 5 7 5 5
εNd(t) 1.7−1.20.371.5 0.12−0.72
TDM2 8701089980886 9961060
fSm/Nd −0.48−0.5−0.48−0.45 −0.51−0.51
Note: Mg# = (MgO/40.31)/(MgO/40.31 + FeOT/71.85 × 0.85) × 100; FeOT = FeO + 0.8998 × Fe2O3.
Table 3. Hf–O isotopic compositions of zircons from the granite porphry samples of the Taijiying gold deposit, western Liaoning.
No.Age (Ma)176Yb/177Hf176Lu/177Hf176Hf/177HfεHf(0)εHf(t)TDMTDMcfLu/Hfδ18O (‰)±2σ
L20617-9-012340.0555400.0012310.282824 0.000035 1.82 6.78 610 831 −0.96 6.690.15
L20617-9-022340.0884770.0019830.282748 0.000035 −0.86 3.98 733 1011 −0.94 6.640.18
L20617-9-032340.0865360.0018670.282834 0.000037 2.18 7.02 606 815 −0.94 6.730.13
L20617-9-042340.1019750.0021900.282839 0.000034 2.38 7.20 603 805 −0.93 6.530.17
L20617-9-052340.0933980.0019970.282854 0.000032 2.89 7.73 579 771 −0.94 6.770.26
L20617-9-062340.0684550.0015320.282799 0.000034 0.94 5.86 651 891 −0.95 6.790.17
L20617-9-072340.0647020.0015630.282820 0.000033 1.68 6.60 621 843 −0.95 6.760.19
L20617-9-082340.0473340.0011830.282765 0.000029 −0.24 4.72 693 964 −0.96 6.960.07
L20617-9-092340.0567100.0014610.282778 0.000034 0.21 5.15 679 936 −0.96 6.410.12
L20617-9-102340.0913390.0020860.282878 0.000030 3.73 8.55 546 718 −0.94 6.550.23
L20617-9-112340.0744050.0017910.282834 0.000035 2.20 7.09 604 813 −0.95 6.290.17
L20617-9-122340.0752160.0017170.282837 0.000032 2.28 7.17 600 808 −0.95 6.870.14
L20617-9-132340.0567670.0013380.282772 0.000035 −0.01 4.94 686 950 −0.96 6.440.20
L20617-9-142340.0504990.0011850.282802 0.000029 1.07 6.03 640 880 −0.96 6.670.14
L20617-9-152340.0747640.0017100.282915 0.000035 5.06 9.96 486 629 −0.95 6.710.21
L20617-13-012300.0740410.0015550.282828 0.000030 1.97 6.79 610 828 −0.95 6.850.14
L20617-13-022300.1090950.0022300.282816 0.000034 1.56 6.30 638 861 −0.93 7.490.12
L20617-13-032300.0934360.0019650.282899 0.000032 4.49 9.27 513 671 −0.94 7.540.16
L20617-13-042300.0612860.0013490.282798 0.000032 0.92 5.77 649 893 −0.96 6.530.17
L20617-13-052300.1121680.0023890.282877 0.000030 3.71 8.42 551 724 −0.93 7.840.18
L20617-13-062300.1068230.0023120.282941 0.000036 5.97 10.69 457 580 −0.93 7.510.20
L20617-13-072300.0987130.0022240.282785 0.000035 0.47 5.20 683 930 −0.93 7.030.25
L20617-13-082300.0688050.0016890.282810 0.000031 1.34 6.16 637 869 −0.95 6.760.12
L20617-13-092300.0599430.0014730.282866 0.000032 3.32 8.17 554 741 −0.96 7.670.20
L20617-13-102300.0620860.0015440.282734 0.000044 −1.35 3.47 744 1040 −0.95 6.930.21
L20617-13-112300.0784220.0017520.282831 0.000034 2.07 6.86 609 824 −0.95 6.790.26
L20617-13-122300.0714360.0015510.282826 0.000033 1.91 6.72 612 832 −0.95 6.590.16
L20617-13-132300.0505490.0012400.282811 0.000034 1.39 6.26 628 862 −0.96 6.950.11
L20617-13-142300.0719130.0016600.282803 0.000035 1.10 5.91 647 885 −0.95 6.860.31
L20617-13-152300.0588680.0013050.282798 0.000033 0.93 5.80 648 893 −0.96 6.390.13
Note: εHf(t) = 10,000 × {[(176Hf/177Hf)S − (176Lu/177Hf)S × (eλt − 1)]/[(176Hf/177Hf)CHUR,0 − (176Lu/177Hf)CHUR × (eλt − 1)] − 1}; TDM = 1/λ × ln{1 + [(176Hf/177Hf)S − (176Hf/177Hf)DM]/[(176Lu/177Hf)S − (176Lu/177Hf)DM]}; TCDM = TDM1 − (TDM1 − t) × [(fcc − fs)/(fcc − fDM)], fLu/Hf = (176Lu/177Hf)S/(176Lu/177Hf)CHUR − 1, where λ = 1.867 × 10⁻¹¹year−1 (Soderlund et al., 2004); (176Lu/177Hf)S and (176Hf/177Hf)S are the measured values of the samples; (176Lu/177Hf)CHUR = 0.0332 and (176Hf/177Hf)CHUR,0 = 0.282772 (Blichert-Toft and Albarede, 1997); (176Lu/177Hf)DM = 0.0384 and (176Hf/177Hf)DM = 0.28325 (Griffin et al., 2000); (176Lu/177Hf)mean crust = 0.015; fcc = [(176Lu/177Hf)mean crust/(176Lu/177Hf)CHUR] − 1; fs = fLu/Hf; fDM = [(176Lu/177Hf)DM/(176Lu/177Hf)CHUR] − 1; t = crystallization time of zircon.
Publisher’s Note: MDPI stays neutral with regard to jurisdictional claims in published maps and institutional affiliations.

