Article

Early Mylonitization in the Nevado-Filábride Complex (Betic Cordillera) during the High-Pressure Episode: Petrological, Geochemical and Thermobarometric Data

by
Ángel Santamaría-López
1,*,
Isabel Abad
2,
Fernando Nieto
3 and
Carlos Sanz de Galdeano
4
1
Departamento de Geología, Universidad de Salamanca, Plaza de la Merced s/n, 37008 Salamanca, Spain
2
Departamento de Geología and CEACTEMA, Unidad Asociada IACT (CSIC-UGR), Campus Las Lagunillas, Universidad de Jaén, 23071 Jaén, Spain
3
Departamento de Mineralogía y Petrología and IACT (CSIC-UGR), Universidad de Granada, Avda, Fuentenueva s/n, 18002 Granada, Spain
4
Instituto Andaluz de Ciencias de la Tierra (CSIC-UGR), 18100 Granada, Spain
*
Author to whom correspondence should be addressed.
Minerals 2023, 13(1), 24; https://doi.org/10.3390/min13010024
Submission received: 25 October 2022 / Revised: 15 December 2022 / Accepted: 19 December 2022 / Published: 23 December 2022
(This article belongs to the Section Mineral Geochemistry and Geochronology)

Abstract

:
In the western part of the Sierra de los Filabres area, there are fine-grained metamorphic rock bands, showing a field aspect simitar to slates, as previously described in the geological literature of the studied region. They are variable in thickness, from millimeters to tens of meters and appear intercalated in the schist succession. The geochemical resemblance between both types of rocks (major, minor and trace elements), determined by a statistical approach and the comparison of depositional condition indices, points to a similar sedimentary origin of the protolith but different clay content. Mineral facies and illite “crystallinity” indices in the so-called slates indicate that they followed the same metamorphic path and reached the same metamorphic grade than schists. According to compositional zoning detected in micas and garnets present in both lithologies and the P-T conditions deduced from garnets, the mineral nucleation and growth episode of the main mineral paragenesis in these fine-grained schists was more remarkable during the high-pressure event, with a no significant effect of the latter low-pressure–high-temperature episode. In contrast, the coarse-grained schists developed higher size minerals during the low-pressure–high-temperature episode. A differential mylonitization process during the metamorphism is proposed to justify the discrepant field appearance and the contrasting response of both types of metapelitic rocks to the latter metamorphic event.

Graphical Abstract

1. Introduction

In the western part of Sierra de los Filabres (Betic Cordillera, Spain) the Nevado-Filábride Complex, in addition to other types of rocks, shows an alternation of schists and fine-grained metamorphic rocks (Figure 1a,b). Traditionally, the fine-grained rocks have been described in the geological literature of the region as slates or lutites [1,2,3] based on their macroscopic aspect. The schists and slates layers are highly variable in thickness and frequency; both alternate over hundreds of meters of thickness. Although the field aspects of the fine-grained rocks inevitably led to classifying them as slates, the interlayering with schists, with notable differences in their apparent metamorphic grade, would entail a problem from the metamorphic point of view. These slate rocks can be classified, alternatively, as mylonites. Indeed, some authors have reported the presence of mylonites in other areas of the Nevado-Filábride Complex, e.g., [4,5]. Mylonites are metamorphic foliated rocks in which the parent rock has undergone a significant grain decrease and dynamic recrystallization after strong ductile shearing under intense stress. Grains in these rocks accordingly appear grinded and crushed, forming a fine-grained matrix. Besides, ocular-shaped to rounded porphyroblasts of similar composition to minerals in the matrix and C-S fabrics commonly occur, e.g., [6,7,8,9]. Nevertheless, the mylonites–slates differentiation is not straightforward at the field observation scale.
The possible coexistence and alternation of schists and mylonitic rocks raises the question regarding how these rocks behaved under stress. Was there any kind of lithological predisposition of some masses of rock to preferentially deform over others? And in this sense, are both the protolith and the deposition features distinct? A detailed study of these rocks, based on mineralogical and geochemical methods (X-ray diffraction, optical and scanning electron microscopy, electron microprobing and whole rock geochemistry), was carried out to discover possible reasons for the origin of these differences. Additionally, it is essential to know the predominant metamorphic paragenesis of both rocks and to carry out thermobarometric estimations of the P-T conditions, in order to discern their respective behavior during the metamorphic evolution of the chain. Ultimately, this study would allow a significant advance in the knowledge of part of the metamorphic history of the Nevado-Filábride Complex and would be of potential interest for similar cases in other metamorphic chains.

2. Geological Setting

The Betic Cordillera is divided in two main domains, the Internal and External Zones, beyond the Flysch Units and the Neogene to Quaternary basins (Figure 2a). The External Zone corresponds to the sedimentary Mesozoic and Cenozoic cover of the S and SE prolongation of the Iberian Paleozoic Massif. The Internal Zone (where it is located in the study area), situated S to SW of the External Zone, is divided, from bottom to top, among the Nevado-Filábride, the Alpujárride and the Maláguide superposed tectonic complexes (Figure 2). These complexes were affected by different-grade metamorphism during the Alpine Orogeny, e.g., [11,12,13,14,15].
Probably the first important antecedent about the Nevado-Filábride Complex corresponds to Brouwer [16], who differentiated between two main units based on lithological criteria: (1) the lower one, named Crystalline of Sierra Nevada, formed by a thick and monotonous Paleozoic succession of graphite-bearing dark schists, together with quartzites; and (2) the upper one, the Mixed Zone (Mischungszone is the original name) formed by dark and light schists, mica schists, quartzites, marbles and meta-igneous rocks (Figure 3a). Thermobarometric data obtained long afterwards, e.g., [17], indicate that the Nevado-Filábride Complex displays a higher metamorphic grade in its upper part, reaching, during the HP event, pressures up to 2.2 Gpa and temperatures up to 520 °C. This feature induced the differentiation of several tectonic units within this complex, e.g., [17,18,19]. Puga and Díaz de Federico [20] argued the existence of two tectonic nappes named Veleta and the overlaying Mulhacén (approximately equivalent to the Crystalline of Sierra Nevada and the Mischungszone, respectively). On the other hand, Martínez-Martínez et al. [19] subdivided the complex into three superposed units named from bottom to top Ragua (approximately equivalent to the Crystalline of Sierra Nevada), Calar-Alto and Bédar-Macael (these last are included in the Mischungszone).
The present study focuses on the schists and quartzites sequence existing in the lower levels of the Mischungszone (Figure 2 and Figure 3) outcropping in the western part of Sierra de los Filabres.

2.1. The General Lithological Succession of the Nevado-Filábride Complex

The bottom of the lithologic sequence of the complex is the Crystalline of Sierra Nevada, a monotonous succession of dark schists (more than 4000 m thick), interlayered with quartzites, locally abundant (Figure 3a). In many outcrops, the dark schists present garnet, generally with increasing size towards the top.
Upwards, layers of light-color quartzites begin to appear and are progressively more abundant, reaching locally a thickness of 400 m, although it laterally greatly decreases, also showing intercalations of schists; this association marks the passage to the upper part of the lithologic sequence, the so-called Mischungszone. Above these quartzites–schists association, the lithological sequence is dominated by schists and thin layers of marbles, progressively more abundant upwards and beginning to appear interlayered with schists. In the upper part of the Nevado-Filábride Complex, the schists generally are light gray in color, although some are also dark; micaschists also appear. Generally, garnets are abundant in these schists, with sizes from milimeters to several centimeters. This sequence of schists and marbles exceeds 1 km of thickness in the area of Cóbdar-Macael, but it is generally inferior in other places of the cordillera. Furthermore, from the first levels of light-color quartzites, and upward, there appear interlayered metabasites and orthogneisses, e.g., [5,17] (Figure 3a).
Concerning the age of these successions, several studies based on the dating of detrital zircons provided a Carboniferous maximum deposition age for the sedimentary protolith of the dark schists of the Crystalline of Sierra Nevada [21] and upper Carboniferous to Triassic for the uppermost schists in the Mischungszone [21,22,23]. On the other hand, radiometric dating studies based on the meta-igneous rocks from the upper part of the sequence outcropping in several areas of the cordillera yielded ages ranging from the late Carboniferous to Permian and Triassic ages [5,24,25,26]. Furthermore, in limestones not completely transformed to marbles pertaining the upper part of the sequence, Rodríguez-Cañero et al. [27] found fossils dating to the Bashkirian.

2.2. Antecedents about the Fine-Grained Studied Rocks

The fine-grained rocks studied in this work have been previously interpreted as lutites or slates by several authors, based on the foliated texture and the grain size that characterize these rocks. The first reference to the existence of lutites in the lithologic sequence of the Nevado-Filábride Complex was in Fallot et al. [28], despite these authors not advancing in the study of this feature. From that time, only Jabaloy and González-Lodeiro [29] and Jabaloy [1] studied this topic, proposing the existence of the Bodurria Unit, situated in a lower tectonic position within the Nevado-Filábride Complex. For these authors, the existence of lutites indicated a lower metamorphic grade. Later, these rocks were cited by Sanz de Galdeano and López-Garrido [2] and Sanz de Galdeano and Santamaría-López [3] who situated them in the upper unit of the lithologic sequence of the Nevado-Filábride (this is in the lower part of the Mischungszone), excluding in their cartographic data the existence of the Bodurria Unit. Sanz de Galdeano and López-Garrido [2] and Sanz de Galdeano and Santamaría-López [3] also indicated the existence in some places of sand- and limestone-like rocks interlayered with schists, quartzites and marbles. These authors [2,3] pointed out the existence of lateral and vertical transitions between sand-like rocks and quartzites and between limestones and marbles. However, they did not propose an interpretation for this contrasting metamorphic grade, the interlayering of these levels or the possible existence of any gradual transition between the anchizone and the medium-grade metamorphism in the area.
Recently, the presence of mylonites in the Nevado-Filábride Complex has been reported in several studies, e.g., [4,5,19,30]. According to these authors, the mylonites are associated with ductile shear zones several meters thick. In the study area, Martínez-Martínez [4] indicates the existence of a shear band 100–200 m thick, in the upper part of the Nevado-Filábride Complex, immediately below the contact with the overlying Alpujárride complex. This last author also indicated the presence of a shear zone in the contact between the Crystalline of Sierra Nevada and the Mischungszone, which, in the eastern-most part of the complex, reaches up to 600 m thick [4].

2.3. Situation of the Studied Rocks

The distribution of the slate-like rocks does not correspond to a single zone but to multiple and discrete local bands, sometimes few-meters (or even much less) thick, which alternate with the predominant schists. The position of the slate-like rock–schist alternation in the stratigraphic succession is located above the monotonous succession of lower dark schists, in the schists and quartzites sequence, which mostly correspond to the lower part of Brouwer’s Mischungszone (Figure 3a). In many points of the western part of Sierra de los Filabres (Figure 3b) coexist both garnet-bearing schists with slate-like rocks, but the alternation of these two types of rocks is also present in equivalent positions of the sequence in the area of Sierra Nevada (see the position of samples RA-8 and SN-1p in Figure 2b).
In the study area, the samples have been taken just above the transition from the dark schists to the schists and quartzites sequence (Figure 3), combining pairs of schists and slate-like rocks (Figure 1a,b). A set of 19 samples taken at a distance of even less of one meter (Figure 1), in several cases, in close levels of the lithologic sequences were analyzed (location is indicated in Figure 2 and Figure 3b).

3. Methods

3.1. Optical and Scanning Electron Microscopy

Thin sections of slate-like rocks and schists were prepared and analyzed in a stereographic petrographic microscope, Leica M205 C (Leica Microsystems, Barcelona, Spain).
Following the X-ray diffraction (XRD) analyses (see below) and the optical study of the samples, carbon-coated polished thin sections were examined by scanning electron microscopy (SEM) with energy-dispersive X-ray spectroscopy (EDX). Observations using backscattered electron (BSE) imaging were carried out with a Merlin Carl Zeiss SEM in the Centro de Instrumentación Científico-Técnica (CICT, Universidad de Jaén, Jaén, Spain). This technique was used to obtain (1) textural data by BSE imaging in the atomic number contrast mode and (2) chemical data by EDX analysis.

3.2. X-ray Diffraction

Samples of slate-like rocks were washed and, after coarse crushing, homogeneous chips of the rocks were selected for the XRD analyses. Whole fractions were prepared, after milling in an agate mortar, as disoriented powders and oriented aggregates. The <2 µm fraction was extracted by the repeated centrifugation and extraction of supernatant liquid, according to Stokes’s law. Oriented aggregates were prepared by sedimentation on round glass slides. A PANalytical X’Pert Pro diffractometer (MalvernPanalytical, Malvern, UK) was employed to study whole and clay fractions, using CuKα radiation, 45 kV and 40 mA. The diffractometer is equipped with an X’Celerator solid-state linear detector, which produced an overall counting time of 10 s/step with step increments of 0.008° 2 θ.
Slate-like rocks were prepared and their Kübler index (KI) measured for illite ‘‘crystallinity’’ determination, according to Kisch [31]. Given that the experimental 10 Å peaks were composed of the superposition of those from biotite and white mica (see below), it was necessary to perform their decomposition to allow the measure of the pure profile corresponding to the white mica. Our measures of the width of the profile at half intensity (x) were transformed into “crystallinity” index standard (CIS) values (y) using the equation y = 0.972 x + 0.1096 (r = 0.970), which was obtained in our laboratory using the international standards of Warr and Rice [32]. As the KI and CIS scales are not equivalent [33], the anchizone limits for the latter are 0.32–0.52 °∆2 θ.
In order to reach an approximate indication of the composition of micas and their possible differences between slate-like rocks and schists, the b cell-parameter and basal spacing (d001) of mica of these two types of rocks were measured. The b was calculated from the (060) peak, which was measured on slices of rock cut normal to the main sample foliation [34]. Basal spacing was measured on the (00,10) basal peak. For all the spacing measurements, quartz from the sample itself was used as an internal standard.

3.3. Chemical Analysis of Whole Samples (X-ray Fluorescence and Inductively Coupled Plasma-Mass Spectrometry)

In order to analyze the possible original sedimentary differences between slate-like rocks and schists, their major, minor and trace elements content were determined.
X-ray fluorescence (XRF) analyses of major elements of whole rocks in samples were carried out in the Instituto Andaluz de Ciencias de la Tierra (IACT, Granada, Spain), with a Bruker wavelength dispersive X-ray fluorescence spectrometer S4 Pioneer with a maximum power of 4 kW and an X-ray tube with a Rh anode (60 kV, 150 mA). The residual matrix effects after the used dilution in the bead (1:10) were adjusted by variable influence coefficients (alpha). Samples were prepared as beads with a Fluxana-HD Elektronik, model Vulcan 4M.
Minor and trace elements were analyzed in the same samples using a NexION 300D inductively coupled plasma-mass spectrometer (ICP-MS) (Centro de Instrumentación Científica, CIC, Universidad de Granada, Granada, Spain) after the HNO3 + HF digestion of 100 mg of sample powder in a Teflon-lined vessel at 180 °C and 200 p.s.i. for 30 min, evaporation to dryness and subsequent dissolution in 100 mL of 4 vol% HNO3.
In order to highlight possible differences in major element content between schists and slate-like rocks, an independent two-sample t-test for unequal sample sizes and similar variances was carried out. This statistical test is used to determine if there is a significant difference between the means of two groups of values, in this case the schists and slate-like rocks samples. The resulting t value is compared with a threshold value, which is determined according to the selected confidence level and the degrees of freedom. If it is higher than the threshold, the null hypothesis (i.e., the compared means are equal) is rejected, so there is a statistical difference between both means.

3.4. Electron Microprobe Analyses and Derived X-ray Compositional Maps

Carbon-coated polished thin sections of selected samples were used to obtain compositional maps of major element and accurate spot analyses of micas and garnets in the electron microprobe (EPMA). Data were performed by wavelength-dispersive spectroscopy (WDX) on a Cameca SX100 at the CIC (Universidad de Granada, Granada, Spain). The selection of samples was based on the mineralogy (presence of micas and garnets) and the b cell-parameter of micas. For each sample, the criteria for the selection of the map location and size were based on the BSE images and point analyses on the two phases. In particular, for garnet, the criteria followed for the selection were porphyroblast preservation and size and low inclusion content. For mica, the areas for mapping were chosen for their dominance and preservation. Three garnet porphyroblasts were selected from the slate-like rocks Fi-5p and Fi-9p and the schist Fi-2e. Four areas with dominant mica flakes were selected in the same slate-like rocks and schist, in addition to schist Fi-4e. For obtaining the spot analyses, the instrument was set at an accelerating voltage of 15 keV, with a beam current of 15 nA and an electron beam diameter of <5 μm. Data were reduced using the procedure of Pouchou and Pichoir [35], and the standards used were albite, sanidine, periclase, diopside, quartz, vanadinite, rutile, fluorite and synthetic oxides (Al2O3, Fe2O3, NiO and MnTiO3). The chemical compositions of micas were calculated on the basis of 22 negative charges, O10(OH)2, and the chemical compositions of garnets were calculated on the basis of 24 negative charges, O12.
The analytical conditions for compositional maps for major elements were 20 keV, 105 nA specimen current and variable dwell times and step sizes. Dwell times for both mica and garnet maps were 150 ms, except for the garnet map in sample Fi-2e (100 ms). The size of garnet maps is: 1164 μm × 1512 μm for sample Fi-2e; 410 μm × 490 μm for sample Fi-9p. The size of mica maps is: 474 μm × 374 μm for sample Fi-2e; 1992 μm × 894 μm for sample Fi-4e; 340 μm × 368 μm for sample Fi-9p. A single map containing both mica and garnet were made in sample Fi-5p (size 410 μm × 240 μm). For each map, nine elemental maps were acquired in two passes (Ca, K, Fe, Na, Al and Ti, Mn, Mg, Si). Data processing and calibration were carried out using XMAPTOOLS 3.4.1 (Pierre Lanari, University of Bern, Bern, Switzerland) [36,37]. Analytical standardization was performed using the composition of spot analyses acquired at the same area [38] and with the advanced procedure described in Lanari et al. [37].

3.5. Phase Equilibria Modelling

The compositional mapping of garnet was combined with iterative thermodynamic models to obtain the P-T conditions of successive growth zones following the strategy described in Lanari et al. [39]. Three garnet porphyroblasts were selected (samples Fi-2e, Fi-9p and Fi-5p). For each growth zone, a representative composition was obtained from the map by averaging pixels from manually selected spatial domains (size ~350 μm2) with XMAPTOOLS 3.4.1. Possible local diffusion around the limit of contiguous growth zones was considered. It is assumed that the central part of each growth zone was not significantly modified, and the original composition is mostly well-preserved (other examples at similar conditions are given in Chapman et al. [40]). These domains were carefully selected, avoiding mixing pixels and mineral inclusions. Supplementary Material Table S1 provides the exported compositions from each growth zone. The composition of each successive growth zone was used to model the P-T-X conditions of garnet growth by using the program GRTMOD 2.0 (Pierre Lanari, University of Bern, Bern, Switzerland) [39]. This program provides a numerical simulation of garnet evolution based on the composition of these successive growth zones by carrying out an iterative modelling strategy. For that, the model relies on predictions based on Gibbs free energy minimization and the program THERIAK-DOMINO (version 09.03.2019, Christian de Capitani, University of Basel, Basel, Switzerland). The database used for calculations was that of Holland and Powell [41] and its subsequent updates (provided in Supplementary Material S2). For each growth zone, three variables are optimized: P, T and, for stages n + 1, the volume fraction of all the previous growth zones fractionated from the bulk-rock composition [39]. With this procedure, the previously formed garnet can thus be isolated from the reactive part of the rock (fractionation) or dissolve (resorption), i.e., partly react to form the new garnet generation. The predicted garnet composition for any P-T-X condition is compared with the representative composition manually selected from the compositional map. Then, the differences between the modelled and measured compositions are minimized by the program, which finally constrains the optimal P-T-X condition for each growth stage.

4. Results

4.1. Petrographic and SEM Results

Slate-like rocks are dark- to gray-colored fine-grained rocks (Figure 1a) including, as the main phases, quartz, white mica (Figure 1c–f and Figure 4), chlorite, garnet, albite (Figure 1c and Figure 4a,b) and occasionally biotite (Figure 1d and Figure 4a); epidote, tourmaline, titanite (Figure 4b), ilmenite, rutile, zircon and apatite are the secondary phases. Garnet porphyroblast size is up to 600 μm and is surrounded by a fine-grained matrix mainly formed by quartz and white mica (Figure 4b). In several slate-like rock samples, there is a well-developed foliation due to the presence of mica bands but also to the elongated shapes of quartz and albite grains (Figure 1c,e,f and Figure 4a). Foliated domains are also observed (Figure 1e,f) revealed by the preferred grain shape alignment (red lines) oblique (~35–40°) to the macroscopic main foliation (yellow lines), emphasizing a C-S shape. Quartz is found in two different textural bands, often contiguous, with variable mica content: (1) displaying elongated shape-crystals with irregular or lobed boundaries (Figure 1c and top of 1f) or (2) as polycrystalline aggregates, with polygonal or serrated grain boundaries (central quartz band in Figure 1f). Several samples include elongated or ocular-shaped albites flattened with respect to the main foliation (Figure 4a,b).
The studied schists are dark-colored schists (Figure 1b) containing quartz, mica (di- and trioctahedral), chlorite, garnet and occasionally feldspar as main phases and ilmenite, rutile, zircon, epidote and allanite as accessory phases (Figure 1g,h and Figure 5a,b). In relation to the EDX spectra of dioctahedral micas, it is observed that there is variability among the heights of some element peaks. The dioctahedral micas with the highest Al peaks are also the micas with more Na (Figure 5c), but micas with the lower Al peaks show higher Si and Mg peaks (Figure 5d). The size of the garnet porphyroblasts is up to 1.2 mm (Figure 1g,h and Figure 5a), and they usually show inclusions of quartz, ilmenite and zircon. Schists (but also the slate-like rocks) in the Crystalline of Sierra Nevada and the lower part of Mischungszone are commonly dark in color due to the high graphite content, which usually appear intercalated with the mica flakes in the matrix (black flakes in Figure 1g,h) or as inclusions in garnet.
Similarly, to other areas of the complex, the metasedimentary rocks in Sierra de los Filabres display two planar fabrics, S1 and S2, the first one parallel to the compositional layering and subsequently deformed by S2, e.g., [15]. In the two lithologies, a crenulation cleavage has been identified in some samples (Figure 1d and Figure 5b).

4.2. X-ray Diffraction and Illite “Crystallinity”

In coherence with the SEM results, the XRD patterns show that all of the samples contain quartz, biotite, plagioclase and dioctahedral (white) mica, which, according to their b parameter, we have named phengite. Moreover, various samples contain K feldspar, and, in Fi-5p, paragonite, amphibole and garnet were also identified in the XRD diagram (Table 1). In addition to these typically metamorphic minerals, most of the slate-like samples contain variable quantities of kaolinite and/or smectite, clearly identifiable in the <2 µm fraction and as traces in the whole fraction, which can be related with the retrograde-diagenetic processes previously described in the Betic Cordillera [42,43,44].
Initial illite “crystallinity” measures, carried out on the whole 10 Å peak (not shown), showed variable results, in contrast with their equivalent measures on the 5 Å peak (in the range of epizone). The careful inspection of the geometry of the 10 Å peaks indicated that the peaks of all the samples were asymmetric with tails toward the lower angle region. This fact was attributed to the presence of biotite, identified both optically and in SEM (Figure 1d,g). Therefore, decomposition procedures using both HighScore and MacDiff [45] routines allowed the identification of two superposed peaks in the region of 10 Å, one corresponding to the trioctahedral micas (biotite) and the other to dioctahedral micas (muscovite/phengite), which was the major one in all cases. Hence, a new measure of the illite “crystallinity” was performed on the decomposed dioctahedral mica peaks.
The obtained results (Table 1) are in all the cases in the range of the epizone, that is, fully metamorphic micas, which have reached crystalline domain sizes over the thousands of Å [46,47]. Moreover, there are no significant differences between the obtained values in the <2 µm and whole fractions. Furthermore, the comparison between air-dried and ethylene-glycol treated samples (not shown) showed no differences over the error of the method.
Basal spacing (d001) and b parameters of the dioctahedral micas of slate-like rocks indicate a relatively high phengitic content and moderate Na proportion [48]. Nevertheless, in the schists, these parameters suggest the presence of more than one type of dioctahedral mica. Figure 6 shows the d001 and b parameters of slate-like rocks and schists plotted in the Guidotti et al. [48] diagram, which relates these two parameters with the chemical composition of micas. Most of the schists and one slate-like rock (Fi-9p) presents two clearly differentiated (060) peaks for white micas (in addition to that characteristic of biotite), corresponding to higher (more phengitic) and lower (less phengitic) values. They are connected by dashed lines in Figure 6 and grouped by two different-color circles.

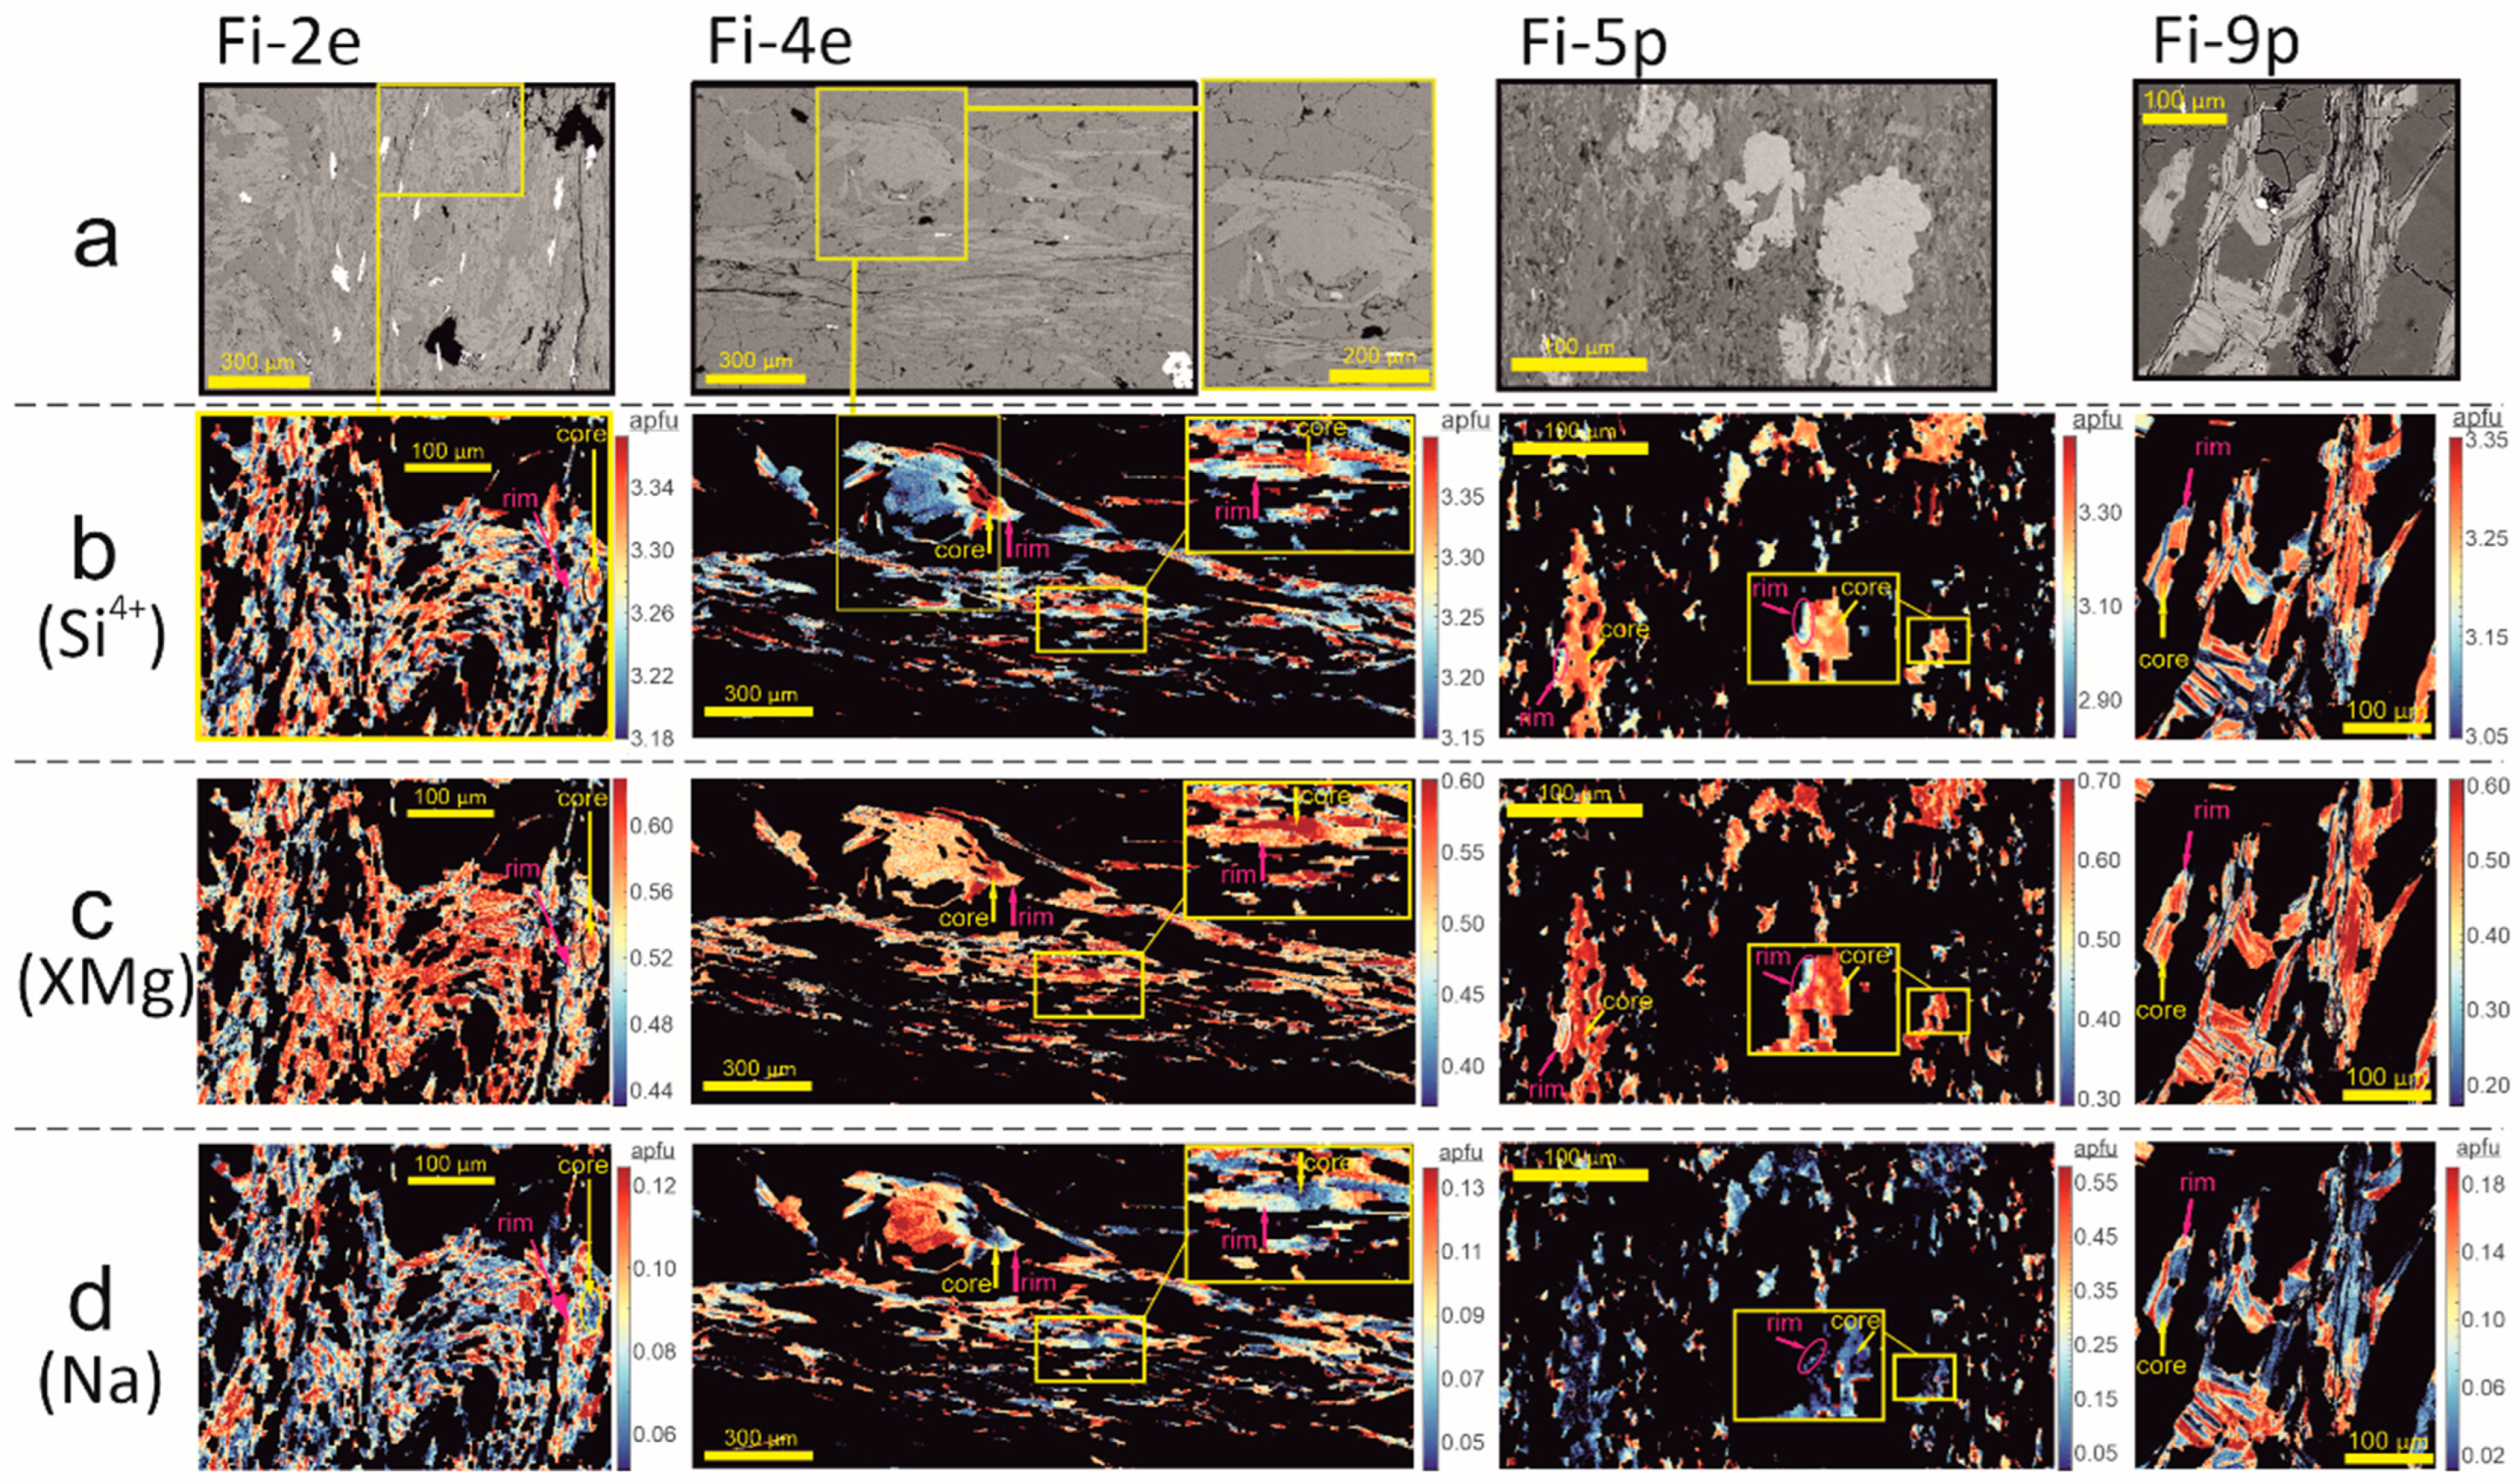
4.3. Chemical Composition of Micas

The chemical composition of white micas in selected slate-like rocks and schists (Supplementary Material S3) show a significant negative correlation (R2 = 0.8) between Fe + Mg (phengitization parameter) and Na/Na + K (paragonitization parameter) ratios (Figure 7). In addition, except for slate-like rock Fi-5p, where only phengitic micas are dominant, the other three samples show a complete range from phengite to muscovite, with a higher prevalence of muscovite in the schists than in the slate-like rocks (Figure 7). These findings nicely agree with the XRD results (b and d001 parameters, Figure 6), which showed the existence of two populations of b-parameter data, including the range of obtained values in EPMA, indicated in Figure 6 by color rectangles, and also with the variability of dioctahedral micas observed in the EDX spectra obtained in the SEM (Figure 5c,d).
In general, the compositional maps corresponding to the dioctahedral micas show phengite rich cores and paragonite-rich rims (Figure 8). In detail, these samples show that the core of the mica flakes displays higher Si4+ and XMg (Mg/(Mg+ +Fe2+ ) (yellow arrows in Figure 8b,c) than the rims (pink arrows in Figure 8b,c). In contrast, the cores are depleted in Na compared with the rims (Figure 8d). The values of these parameters obtained in both cores and rims, for each of the studied samples, are indicated in Table 2, to highlight the difference between the extreme values. However, it is important to note that, generally, in all samples, the entire range of values is observable. A difference observed between both lithologies is that, in the schists, the total area of preserved cores in the 2D-section is apparently similar to the rims (sample Fi-2e) or lower (sample Fi-4e), whereas in the slate-like rocks, it is similar (Fi-9p) or higher (Fi-5p). This aspect can be observed in the Si4+ maps (Figure 8b) by comparing the area occupied by cores showing red to yellowish colors, with the bluish areas corresponding to rims. This visual difference in predominance between the two extreme types of micas is confirmed by the b parameter XRD results (Figure 6), which offer statistical information that simultaneously includes the data of millions of crystals.

4.4. Compositional Zoning of Garnet

The quantitative compositional mapping allowed the characterization of the compositional variability in garnet. Attending the relative content of the end members (Xalm, Xgrs, Xsps and Xprp), the garnets are classified as almandines since they show a high Xalm content (ranging from ~0.55 to ~0.73 apfu). Several growth zones were defined for each sample based on the compositional zonation observed (Figure 9). For that, the grossular map was chosen to select the limit of each growth zone (Figure 9b). Despite garnet porphyroblasts in all samples showing abundant mineral inclusions, making the zoning pattern more difficult to read and interpret, one or more zones were identified in each one. Garnet in sample Fi-2e exhibits a well-defined zonation, with a core surrounded by a mantle (~300 μm thick) and a thinner rim (<120 μm thick). Xgrs, Xalm and Xprp increase slightly from core to mantle (from 0.22 to 0.24, 0.62 to 0.67 and 0.02 to 0.03, respectively), and Xsps decreases (from 0.14 to 0.06) (Figure 9). The rim increases in Xalm (0.75) and Xprp (0.04) and decreases in Xgrs (0.20) and Xsps (0.01). In order to model the P-T conditions (Section 4.6), three garnet domains were selected in this grain:Grt1, Grt2 and Grt3, corresponding to core, mantle and rim, respectively (Figure 9).
Garnet in sample Fi-9p displays three growth zones: a core (~60 μm thick) surrounded by a mantle and a rim (<80–90 μm thick). Xgrs, Xalm and Xprp contents slightly increase from core to mantle (from 0.25 to 0.26, 0.62 to 0.64, 0.03 to 0.04, respectively) and Xsps decreases (from 0.09 to 0.06). The rim shows an increase in Xalm (0.68) and Xprp (0.05) and a decrease in Xgrs (0.23) and Xsps (0.03). Three garnet domains were selected here: Grt1 (core), Grt2 (mantle) and Grt3 (rim) (Figure 9).
Sample Fi-5p contains smaller garnets with a growth zoning pattern highly modified or mostly obliterated. The selected garnet (Figure 9) displays a patchy pattern characterized by lobate features. Due to the absence of an obvious growth zonation, a careful and more conservative selection of the domain to be analyzed was carried out. Only one domain (Grt1) was selected in the central part of the garnet (bluish zone in Xgrs map, Figure 9b). This growth zone presents the following end-member fraction values: Xalm = 0.67, Xgrs = 0.22, Xprp = 0.08 and Xsps = 0.03.
As shown in Figure 9, samples Fi-9p and Fi-2e yielded similar compositional zoning characterized by increasing in Xgrs, Xalm and Xprp and depletion in Xsps from core to mantle. In both samples, the Xalm and Xprp content grows in the rim and by the contrary Xgrs and Xsps decrease.

4.5. Whole-Rock Analyses

4.5.1. Major Elements

In general, all slate-like rocks and schists show high SiO2 contents, always higher than 55 wt.%, reaching values higher than 80 wt.% only in two schists (more correctly named quartz schists) (Table 3, Figure 10). The Al2O3 content decreases linearly with increasing silica content (Figure 10a) and tends to be higher in slate-like rocks with values up to 22 wt.%. The total Fe expressed as Fe2O3 ranges between 0.71 and 6.82% and has a similar range for both types of rocks (Figure 10b). K2O content in the schists (1.00 to 3.88 wt.%) are lower than in slate-like rocks (2.87 to 7.23%) (Figure 10c). Both types of rocks are generally low in MgO (≤1.68 wt.%), Na2O (≤1.64 wt.%) and CaO (≤0.54 wt.%), with the exception of slate-like rock Fi-5p (CaO content of 5.02 wt.%), P2O5 (≤0.17 wt.%) and MnO (≤0.08 wt.%) (Table 3). Fe2O3, K2O and MgO wt.% decreases with increasing silica content (Figure 10b–d).
A separate t-test was carried out for each major element (taking wt.% oxide values obtained for the schists and slate-like rock samples; Table 3). In this case, for a total of 16 samples (14 degrees of freedom) and 95% confidence level, the threshold for the t value corresponds to 2.145. For most of the elements, the test results indicate that there are no statistically significant differences between schists and slate-like rock (resulting t-values are below threshold), except for Al2O3 and K2O (Table 4).

4.5.2. Minor and Trace Elements

As in the case of major elements, an independent two-sample t-test was carried for comparing the minor, trace and rare earth element contents (data included in Supplementary Material Table S4) between schists and slate-like rocks (for 95% confidence, 14 degrees of freedom and threshold t value = 2.145). The t values are provided in Table 5. Only Ba, Rb and Tl contents statistically differ between both rock types.
The minor and trace elements patterns for the studied samples are displayed in Figure 11a (schists) and b (slate-like rocks). In general, patterns show a very similar behavior for all samples. In particular, Rb and especially Ba are the elements that reach the highest values (>100 ppm) in both types of rocks (Supplementary Material Table S4). As expected from the results of the t-tests, both elements differ between both rock types, and in general, Ba content is higher in the slate-like rocks than in the schists. The Sr content is particularly higher in sample Fi-5p (1249 ppm) (Figure 11b) compared with other samples. Despite this notable difference, the t value for Sr is 1.025, and, therefore, there is no statistically significant difference in the content of this element between both rock sets.
Total rare earth elements (REE) contents vary from 91 to 224 ppm (Supplementary Material Table S4). The post-Archean average shale-normalized REE patterns of the selected schist and slate-like rock samples (PAAS data from Taylor and McLennan [54]) display trends with contents very similar to those of the PAAS. There is a very slight increase of the light REE from La to Eu, in particular for some samples (e.g., Fi-4p), and a smooth decrease of the heavy REE from Gd to Lu with almost no systematic differences between rock types (Figure 11c,d). Some samples display negative anomalies of Ce, but their occurrence is not systematic for any of the two kinds of rocks, schists or slate-like rocks. Despite the mentioned differences observed in the normalized REE patterns, according to the t-tests, there are no significant differences between schists and slate-like rocks regarding these elements.
For constraining the probable protolith, samples are displayed in a diagram of log (Fe2O3/K2O) vs. log (SiO2/Al2O3) based on the geochemical classification of terrigenous sands and shales of Herron [55] (Figure 12a). In order to infer redox conditions in the depositional environment, several commonly used indices have been calculated. These are displayed as V/Cr vs. U/Th, Ni/Co vs. U/Th and V/(V + Ni) vs. U/Th graphs in Figure 12. The plotted ranges constraining oxic, dysoxic and anoxic conditions are from Jones and Manning [56]) (for V/Cr, U/Th and Ni/Co) and from Hatch and Leventhal [57] (for V/V + Ni). The ranges obtained for each redox index are the following: 0.08 to 0.19 for U/Th, 0.53 to 1.39 for V/Cr, 0.23 to 4.90 for Ni/Co and 0.69 to 0.97 for V/(V + Ni).

4.6. P-T Conditions Modelled from Garnet

The compositional zoning detected in garnets has allowed determining the probable optimal P-T conditions under which garnets formed and grew using iterative forward models and the program GRTMOD [39]. During calculations in all optimization stages, solutions were considered only if the Co (cost function value) was lower than STOL (=0.03) (tolerance to select the result as a valid solution). Provided that the uncertainty envelopes are rarely symmetrical in both P and T, in the following, only the optimal solution for each stage is discussed.
Figure 13 shows that garnet nucleation (labelled Grt1 on each corresponding sample) is predicted at 513 °C and 0.49 Gpa in sample Fi-2e, 479 °C and 1.66 Gpa in sample Fi-9p and 511 °C and 1.93 Gpa in sample Fi-5p. In sample Fi-2e, the crystallization of the mantle (Grt2) is modelled at 523 °C and 0.79 Gpa, after 0.097 vol% of Grt1 was fractionated from the reactive part of the rock. In this sample, the rim (Grt3) was not satisfactory modelled, as the lower residual value of 0.07 (Co) was found at 532 °C and 2.31 Gpa. In sample Fi-9p, two additional domains were selected: the mantle (Grt2), which is predicted to have formed at 518 °C and 0.61 Gpa (fractionation of 0.011 vol% of Grt1) and the rim (Grt3) modelled at 527 °C and 0.59 Gpa (fractionation of 0.011 vol% and 0.905 %vol of Grt11 and Grt2, respectively).

5. Discussion

In order to explain the coexistence of slate-like rocks and schists, alternating in the lower part of the Mischungszone, pertaining to the Nevado-Filábride Complex, the research carried out has focused, on the one hand, on determining possible differences in the protolith of both rocks; and, on the other hand, on the behavior of both lithologies during the metamorphism that affected the complex.

5.1. Slate-Like Rocks and Schists Protolith

The different distribution of mineral grains, organic matter and other constituents of the sedimentary protolith depends, not exclusively on the source area, but also on the physical and chemical features of the sedimentation area (e.g., climate, energy of the system, biological activity, pH, redox, etc.), e.g., [59,60], ultimately repercussing in the geochemical features of the sedimentary and metasedimentary rocks. In this sense, the identification of different elemental distribution and proportion observed in diverse rock types could reflect variations in the aforementioned conditions. In order to identify such possible existing differences in the slate-like rocks and schist protoliths, the whole rock geochemistry of major, minor and trace elements of both rock samples were determined. Regarding the most probable protolith, the studied samples are plotted mainly in the wacke and arkose fields of the Herron [55] diagram. Although it is important to note that, for some slate-like rocks, the most probable protolith corresponds to shales (Figure 12a). This last is in line with the t-test results for major elements, which indicate that both types of rock present similar means for most of the major elements except for the Al2O3 and K2O contents (Table 4), implying a probably higher clay content in the sediment of the slate-like rock protolith than in the schists.
Several minor and trace elements have been proven to be sensitive to paleoenvironmental changes, e.g., [61,62], as the physicochemical behavior of these elements varies according to the environmental prevailing features during deposition. In this way, the study of trace elements or combinations of these elements have led to infer paleosalt, paleooxygen and paleoclimate conditions, e.g., [61,62,63,64,65,66]. In particular, multiple indices, including U/Th, V/Cr, Ni/Co and V/(V + Ni), have been proposed to infer paleooxygen conditions [67,68]. In general, as environmental conditions become progressively more reducing, the U/Th ratio increases [56]. Values of V/Cr > 2 are considered to be indicative of anoxic conditions [69]. Ni and Co content in sediment are also used to infer reduction events as these elements are usually found in diagenetic pyrite where Ni/Co > 1. In general, higher Ni/Co values occur as the system is more reducing, e.g., [56]. Finally, the abundance of Ni and V in oils and bitumens and the leading factors controlling the fixation of these elements in sediments have been previously studied, e.g., [70]. The Ni/V value in oils and bitumens included in sediments decreases as the environment progressively reaches more reducing conditions. The samples are displayed in the oxic field of the crossplots (Figure 12b,c), except in the V/(V + Ni) vs. U/Th plot, which indicates anoxic prevailing conditions (Figure 12d). There is no clear difference between both types of rocks in terms of the indices shown. In this sense, the only notable difference is the Ni/Co ratio, displaying a larger range of values in schists (0.23 to 4.90) than in slate-like rocks (0.51 to 3.12). Accordingly, the schists samples have proved to be more sensitive for determining redox variations based on this index. In conclusion, the most probable redox conditions during deposition for both protoliths were oxic. Discrepancies between different indices with the V/(V + Ni) parameter has been previously observed [67]. However, as was discussed by Jones and Manning [56] and Rimmer [71], these various ratios should not be taken into account individually but rather collectively. Finally, Ce-negative anomalies in metasediments have been generally interpreted as characteristic of anoxic sediments, e.g., [72], but also contrarily, as under oxic conditions, this element is incorporated in Mn oxides [73]. Therefore, the interpretation of the redox conditions from this element should be taken with caution. In addition, although several studied samples exhibit a negative anomaly of Ce, there are some notable exceptions (e.g., sample Fi-10p; Figure 11d).
Changes in the energy of the system during sedimentation is one of the main reasons invoked for explaining differences in grain size in different metasedimentary rock’s protolith, e.g., [59,60]. Except for the case of Rb (t = 2.603), Ba (t = 2.773) and Tl (t = 2.397) (Table 5), no statistically significant differences have been detected between schists and slate-like rocks. On the other hand, to our knowledge, the content of these three elements is not particularly related to the aforementioned deposition conditions. Accordingly, in this study, no clear discriminant regarding the content of minor and trace elements has been found (Figure 11); these parameters should have played a minor role in protolith differentiation.
An indicator of the presence of organic matter in the sediment is the content of U, e.g., [74,75,76], and Ba, e.g., [65,77,78]. In the studied samples, there is no systematic preference of U for either type of rock (t = 0.889; Table 5), whereas Ba content is higher in slate-like rocks (t = 2.773; Table 5). Although the Ba could indicate a higher content of organic matter in the protolith of the slate-like rocks, it is not the case for U, so the results regarding these two elements are altogether not enlightening and do not permit assigning the organic matter content as the explanation for the differences between the two lithologies.
In summary, the origin of these rocks was a protolith rich in quartz and feldspar, deposited under prevailing oxic conditions. However, the most significant differences, according to the t-test, affecting Al, K, Ba, Rb and Tl, could indicate some differences in the grain size of the protoliths, implying a higher clay content in the sedimentary precursor of the slate-like rocks, which, in turn, after metamorphism, produced a higher mica proportion in comparison to the schists.

5.2. Slate-Like Rock and Schist Metamorphic Grade

The CIS illite “crystallinity” values clearly reach the epizone grade in all slate-like rocks (Table 1). The determination was carried out due to their field aspect and previous classification as “lutites” or “slates” in the literature about the area. Illite “crystallinity” is the usual and more accepted method for the determination of the grade in shales and slates [79]. The epizone is the maximum grade determined by the method; it indicates the crystalline domain sizes of the micas over thousands of Å, that is, fully crystalline metamorphic micas [46,47]. At such values, the index becomes asymptotic and is unable to distinguish more differences in crystalline size or grade. Such a determination fully agrees with the presence in the slate-like rocks of this study of typical metamorphic minerals as biotite, epidote and garnet, and the metamorphic paragenesis also found in schists with quartz, biotite, plagioclase and white mica contents, in addition to K feldspar and garnet, present in several samples. Therefore, in spite of their different field appearance, the so-called slate-like rocks could really be considered fine-grained schists as they have reached the same metamorphic grade as those named schists from the beginning (hereinafter, coarse-grained schists).
A continuous decompression (phengitic vector) with thermal increase (paragonitic vector) can be inferred from the chemistry of micas (Figure 7), corroborated by their chemical maps (Figure 8). This process is represented in the two types of schists, but, according to the b parameter of micas (Figure 6) and their chemical composition (Figure 7), the effect of the lower pressure, higher temperature part of the path has been minimum on the fine-grained schists, with the LP–HT stage well represented only in sample Fi-9p. In opposition, this latter part of the metamorphic path has been responsible for the main visible paragenesis of the coarse-grained schists (Figure 13).
White mica compositional maps allowed a comparison of chemical composition between the core and rim in mica flakes pertaining to both types of schists. Variation in the Si4+ content and XMg are symptomatic of changes in pressure and temperature conditions during metamorphism, e.g., [52]. Accordingly, by comparing the differences in these parameters between core and rim, changes in P-T conditions during mica growth can be inferred. The highest values of Si4+ and XMg (indicative of higher phengitization grade and pressure) are systematically observed in the cores of the mica flakes. Conversely lower values of these parameters (i.e., lower pressure) are in the rims (Figure 8b,c). Therefore, the core in the mica flakes was probably formed under higher P conditions than the rim. This pattern is generally observed in both types of schists. However, there is a relative difference in relation to the development of the cores and rims in the mica crystals in both types of rocks. In the coarse-grained schists, the total area of the preserved cores is apparently similar or lower than the rims; but, in the fine-grained schists, it is similar or higher. These results are coherent with the b parameters of the dioctahedral micas of fine-grained schists determined by XRD (Figure 6), whose highly statistical character offer a valid criterion to know the predominance in volumetric terms of one or another population of micas. Coarse-grained schists and fine-grained schist sample Fi-9p, with two differentiated (060) peaks for white micas, point to higher (more phengitic) and lower (less phengitic) values, whereas the rest of the fine-grained schists, including Fi-5p, show only one (060) peak pointing to a net predominance of phengitic micas. The highly complete range of closely correlated phengitic and paragonitic values presented in Figure 7 also has a temporal meaning, presumably linked to the progressive decompression of the metamorphic chain.
P-T values estimated by garnet seem to be in line with the results from white micas. The two fine-grained schist samples (Fi-5p and Fi-9p) contain garnets cores modelled at high pressure (Figure 13), whereas the mantles and rims of garnet (and white-mica rims) from Fi-9p would form in the LP–HT episode. In the case of the coarse-grained schists (Fi-2e), the most remarkable paragenesis is that formed in the LP–HT stage according to the garnet cores and mantles modelled at low pressure (Figure 13).
In summary, the paragenesis of both types of rocks is similar, and it can be inferred that both have described a metamorphic path characterized by a HP–LT event, followed by another LP–HT event. However, it is important to note that the fine-grained schists preferentially recorded the HP event; whereas the main paragenesis in the final coarse-grained schists developed under LP–HT conditions.

5.3. Framing of Results with the Geological Setting

According to the P-T results modelled from garnet (Figure 13), we can conclude that: (1) There is a significant decrease of P, which is concomitant with a moderate increase of T. (2) The typical fine-grained schist, Fi-5p, has only preserved in the analyzed garnet the high-pressure episode, and the typical coarse-grained schist, Fi-2e, has only preserved the low-pressure one. (3) Fine-grained schist Fi-9p has registered two stages. These results are compared with different P-T paths from the literature (Figure 13) and constructed from the analysis of rocks pertaining to the schists and quartzites sequence (lower part of the Mischungszone, Figure 3). The garnet values corresponding to the HP event (Grt1 in Fi-5p and Fi-9p) are in line with the results of Li and Massone [58] and approximately fall within the P-T path proposed by Santamaría-López et al. [15]. Lower-pressure-modelled values are in line of the P-T path previously proposed by Santamaría-López et al. [15] (Grt1 in Fi-2e; and Grt2 and Grt3 in Fi-9p) and partially with that of Augier et al. [11]. All of these studies indicated that the rocks reached higher temperature values during decompression (ranging from ~550 to ~630 °C).
The relative difference in relation to the development of the cores and rims in the mica and garnet crystals of both types of schists with a very moderate effect of the LP–HT episode on the fine-grained schists, and to the contrary, the presence in the coarse-grained schists of a more LP–HT remarkable paragenesis could be explained by a differential response to tectonic stress during metamorphism, which conditioned the subsequent evolution of these rocks during the LP–HT episode. It is possible that the contact surfaces between different deposited beds of protolith could have displayed zones in which later ductile deformation was preferentially accumulated. In this sense, deformation mainly affected the fine-grained schists. Several textural features observed in thin sections (petrographic and BSE images) from these rocks can be interpreted as having been produced by shearing and mylonitization. These include the banded domains displaying grain alignment oblique to the macroscopic foliation (Figure 1e,f). These C-S fabrics are mostly marked by mica flakes but also by quartz grains (Figure 1f) and allow the identification of the shear sense (yellow arrows in Figure 1e,f) [80]. The elongated quartz and albite grains (Figure 1c,f and Figure 4a) and probably the ocular-shaped albite (Figure 4b) are evidence of plastic flow [80,81], whereas the bands formed by polygonal quartz showing straight boundaries and occasional triple 120° junctions (central quartz band in Figure 1f) indicate recrystallization [80]. With these textural differences, the behavior of both types of schists (sheared and unsheared) during the LP–HT episode would be different. This distribution in the lower part of the Mischungszone, of deformed rocks alternating with non-deformed rocks, would lead to a general scheme based on the existence of several discrete shear zones constrained between unsheared bands.
One of the main features of the sedimentary sequence of the region are the abrupt changes in the grain-size of the original sediments, as the presence of psammitic material, currently quartzites, together with the pelitic levels, currently represented by the schists, is ubiquitous. Considering a sedimentary environment with an intricate alternation of layers of clays, silts and sands, when this sequence was incorporated into the subduction slab, fluids inherited from the sedimentation, in addition to possible fluids incorporated from deeper areas during the progressive sinking, migrated across these layers. In this sense, it has been proposed that the increasing in deformation drives fluid circulation and ultimately leads the redistribution of the components in mineral phases and to possible re-equilibration processes [82]. This fluid migration through different beds would have been strongly affected by differential permeability between the studied rock types. The fine-grained schists are in general more mica-rich than coarse-grained schists (in accordance with the partially discrepant protoliths t-test for Al2O3 and K2O, Table 4; and oxides content, Table 3; Figure 10a,c), whereas the coarse-grained schist protolith was probably more clastic (Figure 12a). According to this, the fine-grained, denser, and mica-rich rocks may have become seals that retained fluid within the interlayered coarse-grained schists. Differences in the residual hydration between the two types of rocks could have been determinant for their different behavior during the latter mineral growth process, as fluids are a basic agent for metamorphic reactions [83].
The Betic Cordillera underwent a complex evolution including compressional and extensional deformations. Recent tectonic and paleogeographical models [22] place the Nevado-Filábride Complex in the Iberian paleomargin, in the ESE or SE prolongation of the Iberian Massif. These terrains were subducted during the convergence of the African and Iberian plates and later exhumed, e.g., [15,84] and references therein. In this scenario, plate parallel strain could be localized in more mica-rich areas (i.e., fine-grained schists) along layering (probably near the subduction interface). Later, during uplift, they become seals that retain fluid within the interlayered coarse-grained schists. As a summary, a probable mylonitization process triggered by ductile deformation at an earlier stage of the metamorphic path prevents the development and growth of these mineral grains during the LP–HT. An additional but important conclusion arises from the above: the mylonitization should have taken place contemporarily to the HP event, in order to be a determining factor in controlling mineral growth during this event and latter stages of the metamorphism. Therefore, these mylonites cannot have been formed either during exhumation or in a post-metamorphic stage. In this sense, there is a difference with previously reported mylonites in the Nevado-Filábride and formed during the late stages of the exhumation, e.g., [4,5].
Finally, a possible sequence of events could be the following: (1) sedimentation of a sedimentary protolith with variable grain size and clay content; (2) subduction of these materials, followed by (3) HP-metamorphism accompanied by shearing, leading the mylonitization of the most strained schist levels, probably those having a higher mica content. Under these conditions the phengitic micas and garnet cores preferentially nucleated. (4) Later HT–LP metamorphism accompanied the rim’s formation in these mineral phases. During this stage, the grain’s growth in the less-sheared, more-fluid rich schists was more remarkable than in the case of the mylonitic schists, increasing the difference in grain size observed between the two types of rocks.

6. Conclusions

Rocks showing contrasting field characteristics, in terms of grain size, are present in the western part of the Sierra de los Filabres area of the Nevado-Filábride Complex (Betic Cordillera, Spain). The protolith of both rocks was similar according to the geochemical signature, but discrepancies exist, mainly regarding the clay content. The metamorphic grade is not responsible for their dissimilarities, as they present similar metamorphic paragenesis. The differential features are attributed to two combined factors: (1) the differential shearing of the rock mass, which controlled the formation of mylonites interlayered with less sheared bands, leading to (2) their different behavior during the latter metamorphic path; in the low-pressure stage, mylonites remained fundamentally unchanged, while the less-sheared rocks developed a low-pressure/high-temperature paragenesis. The mylonitic schists, which had been previously described in the literature of the region as lutites or slates, were generated during the high-pressure stage as a difference with other previously described mylonites of the metamorphic chain [19].

Supplementary Materials

The following supporting information can be downloaded at: https://www.mdpi.com/article/10.3390/min13010024/s1, Supplementary Material Table S1: Representative compositions of each growth zone of the garnets in the basis of EMPA data; Supplementary Material S2: Holland and Powell (1998)—database update 5.5; Supplementary Material S3: Chemical composition of micas; Supplementary Material Table S4: Minor and trace element contents corresponding to mylonites and schists (ppm).

Author Contributions

Conceptualization, C.S.d.G.; Formal analysis, Á.S.-L., I.A. and F.N.; Funding acquisition, I.A. and F.N.; Investigation, Á.S.-L., I.A. and F.N.; Methodology, Á.S.-L., I.A. and F.N.; Writing—original draft, Á.S.-L., I.A. and F.N.; Writing—review and editing, Á.S.-L., I.A., F.N. and C.S.d.G. All authors have read and agreed to the published version of the manuscript.

Funding

This research was funded by Projects PGC2018-094573-B-I00 and PID2019-104624RB-I00 from the MCIN-AEI/10.13039/501100011033/-FEDER; Project PY20_00675 from the Junta de Andalucía (PAIDI 2020); Project FEDER-UJA 2020 1380934; Research Groups RNM-325 and RNM-179 of the Junta de Andalucía.

Data Availability Statement

All data supporting reported results have been included in the manuscript and as Supplementary Materials (S1–S4).

Acknowledgments

The authors woud like to express their gratitude to an anonymous reviewer and Alexander Simakin for their stimulating comments and suggestions and Charisma Lu for the editorial handling. We acknowledge the technical and human support provided by the CICT of Universidad de Jaén (UJA, MINECO, Junta de Andalucía, FEDER) and the use of the PANalytical X’Pert Pro diffractometer of the “Departamento de Mineralogía y Petrología, Universidad de Granada, Spain”. M.A. Hidalgo is especially recognized for helping with the EPMA work and O. Cazalla-Vázquez for the ICP-MS analyses at the “Centro de Instrumentación Científica of the Universidad de Granada”. X-ray fluorescence analyses were carried out in the Instituto Andaluz de Ciencias de la Tierra by A. Salido-Ruiz, whom we also acknowledge.

Conflicts of Interest

The authors declare no conflict of interest.

References

  1. Jabaloy, A. La Estructura de la Región Occidental de la Sierra de los Filabres (Cordilleras Béticas); Universidad de Granada, Monografía Tierras del Sur: Granada, Spain, 1993; p. 200. [Google Scholar]
  2. Sanz de Galdeano, C.; López-Garrido, A.C. The Nevado-Filábride Complex in the western part of Sierra de los Filabres (Betic Internal Zone), structure and lithologic succession. Bol. Geol. Min. 2016, 127, 823–836. [Google Scholar] [CrossRef]
  3. Sanz de Galdeano, C.; Santamaría-López, A. The lithological sequence of the Nevado-Filábride complex (Betic Internal Zone) in the Sierras Nevada and Filabres. Rev. Soc. Geol. Esp. 2019, 32, 113–126. [Google Scholar]
  4. Martínez-Martínez, J.M. Coexistencia de zonas de cizalla dúctil de extensión y de acortamiento en el domo de Sierra Nevada, Béticas (SE de España). Rev. Soc. Geol. Esp. 2007, 20, 229–245. [Google Scholar]
  5. Martínez-Martínez, J.M.; Torres-Ruiz, J.; Pesquera, A.; Gil-Crespo, P.P. Geological relationships and U-Pb zircon and 40Ar/39Ar tourmaline geochronology of gneisses and tourmalinites from the Nevado–Filábride Complex (wes¬tern Sierra Nevada, Spain): Tectonic implications. Lithos 2010, 119, 238–250. [Google Scholar] [CrossRef]
  6. Passchier, C.W.; Trouw, R.A.J. Microtectonics; Springer: Berlin/Heidelberg, Germany, 2005; pp. 67–109. [Google Scholar]
  7. Trouw, R.A.J.; Passchier, C.W.; Wiersma, D.J. Atlas of Mylonites-and Related Microstructures; Springer: Berlin/Heidelberg, Germany, 2010; p. 322. [Google Scholar]
  8. Haldar, S.K. Introduction to Mineralogy and Pretology, 2nd ed.; Elsevier: Amsterdam, The Netherlands, 2020; p. 436. [Google Scholar]
  9. White, S.H.; Burrows, S.E.; Carreras, J.; Shaw, N.D.; Humphreys, F.J. On mylonites in ductile shear zones. J. Struct. Geol. 1980, 2, 175–187. [Google Scholar] [CrossRef]
  10. Warr, L.N. IMA–CNMNC approved mineral symbols. Mineral. Mag. 2021, 85, 291–320. [Google Scholar] [CrossRef]
  11. Augier, R.; Booth-Rea, G.; Agard, P.; Martínez-Martínez, J.M.; Jolivet, L.; Azañón, J.M. Exhumation constraints for the lower Nevado-Filábride complex (Betic Cordillera, SE Spain): A Raman thermometry and Tweequ multiequilibrium thermobarometry approach. Bull. Soc. Géol. Fr. 2005, 176, 403–416. [Google Scholar] [CrossRef]
  12. Platt, J.P.; Kelley, S.P.; Carter, A.; Orozco, M. Timing of tectonic events in the Alpujárride Complex, Betic Cordillera. S. Spain. J. Geol. Soc. 2005, 162, 451–462. [Google Scholar] [CrossRef] [Green Version]
  13. Platt, J.P.; Anczkiewicz, R.; Soto, J.I.; Kelley, S.P.; Thirlwall, M. Early Miocene continental subduction and rapid exhumation in the western Mediterranean. Geology 2006, 34, 981–984. [Google Scholar] [CrossRef]
  14. Gómez-Pugnaire, M.T.; Nieto, F.; Abad, I.; Velilla, N.; Garrido, C.J.; Acosta-Vigil, A.; Barich, A.; Hidas, A.; López Sánchez-Vizcaíno, V. Alpine Metamorphism in the Betic Internal Zones. In The Geology of Iberia: A Geodynamic Approach; Quesada, C., Oliveira, J.T., Eds.; Springer Nature Switzerland AG: Cham, Switzerland, 2019; pp. 519–544. [Google Scholar]
  15. Santamaría-López, Á.; Lanari, P.; Sanz de Galdeano, C. Deciphering the tectono-metamorphic evolution of the Nevado-Filábride complex (Betic Cordillera, Spain)—A petrochronological study. Tectonophysics 2019, 767, 128158. [Google Scholar] [CrossRef]
  16. Brouwer, H.A. Zur Tektonik der Betischen Kordilleren. Geol. Rundsch. 1926, 17, 332–336. [Google Scholar] [CrossRef]
  17. Puga, E.; Díaz de Federico, A.; Nieto, J.M. Tectonostratigraphic subdivision and petrological characterization of the deepest complexes of the Betic zone: A review. Geodin. Acta 2002, 15, 23–43. [Google Scholar] [CrossRef]
  18. Puga, E.; Díaz de Federico, A.; Fontboté, J.M. Sobre la individualización y sistematización de las unidades profundas de la Zona Bética. Estud. Geol. 1974, 30, 543–548. [Google Scholar]
  19. Martínez-Martínez, J.M.; Soto, J.I.; Balanyá, J.C. Orthogonal folding of extensional detachments: Structure and origin of the Sierra Nevada elongated dome (Betics, SE Spain). Tectonics 2002, 21, 1–22. [Google Scholar] [CrossRef] [Green Version]
  20. Puga, E.; Díaz de Federico, A. Pre-Alpine metamorphism in the Sierra Nevada Complex (Betic Cordilleras Spain). Cuad. Geol. Univ. Granada 1976, 7, 161–171. [Google Scholar]
  21. Santamaría-López, Á.; Sanz de Galdeano, C. SHRIMP U–Pb detrital zircon dating to check subdivisions in metamorphic complexes: A case of study in the Nevado–Filábride complex (Betic Cordillera, Spain). Int. J. Earth Sci. 2018, 107, 2539–2552. [Google Scholar] [CrossRef]
  22. Jabaloy, A.; Talavera, C.; Gómez-Pugnaire, M.T.; Sánchez-Vizcaíno, L.V.; Vázquez Vílchez, M.; Rodríguez-Peces, M.J.; Evans, N.J. U-Pb ages of detrital zircons from the Internal Betics: A key to deciphering paleogeographic provenance and tectono-stratigraphic evolution. Lithos 2018, 318–319, 244–266. [Google Scholar] [CrossRef]
  23. Jabaloy, A.; Talavera, C.; Rodríguez-Peces, M.J.; Vázquez-Vílchez, M.; Evans, N.J. U-Pb geochronology of detrital and igneous zircon grains from the Águilas Arc in the Internal Betics (SE Spain): Implications for Carboniferous-Permian paleogeography of Pangea. Gondwana Res. 2021, 90, 135–158. [Google Scholar] [CrossRef]
  24. Priem, H.N.A.; Boelrijk, N.A.; Hebeda, E.H.; Verschure, R.M. Isotopic age determinations on tourmaline granite-gneiss and a metagranite in the Eastern Betic Cordilleras, SE Spain. Geol. Mijnb. 1966, 45, 184–187. [Google Scholar]
  25. Gómez-Pugnaire, M.T.; Rubatto, D.; Fernández-Soler, J.M.; Jabaloy, A.; López Sánchez-Vizcaíno, V.; González-Lodeiro, F.; Galindo-Zaldívar, J.; Padrón-Navarta, J.A. Late Variscan magmatism in the Nevado-Filábride Complex: U-Pb geochronologic evidence for the pre-Mesozoic nature of the deepest Betic complex (SE Spain). Lithos 2012, 146–147, 93–111. [Google Scholar] [CrossRef]
  26. Ruiz-Cruz, M.D.; Sanz de Galdeano, C. Genetic significance of zircon in orthogneisses from Sierra Nevada (Betic Cordillera, Spain). Mineral. Mag. 2017, 81, 77–101. [Google Scholar] [CrossRef]
  27. Rodríguez-Cañero, R.; Jabaloy-Sánchez, A.; Navas-Parejo, P.; Martín-Algarra, A. Linking Palaeozoic palaeogeography of the Betic Cordillera to the Variscan Iberian Massif: New insight through the first conodonts of the Nevado-Filábride complex. Int. J. Earth Sci. 2018, 107, 1791–1806. [Google Scholar] [CrossRef]
  28. Fallot, P.; Faure-Muret, A.; Fontboté, J.M.; Solé Sabarís, L. Estudio sobre las series de Sierra Nevada y de la llamada Mischungzone. Boletín Inst. Geológico Min. España 1960, 81, 347–557. [Google Scholar]
  29. Jabaloy, A.; González-Lodeiro, F. La deformación en los bloques de techo y muro de los cabalgamientos de las unidades inferiores Nevado-Filábrides (Cordilleras Béticas, SE. España). Estud. Geológicos 1988, 44, 253–261. [Google Scholar] [CrossRef]
  30. Booth-Rea, G.; Martínez-Martínez, J.M.; Giaconia, F. Continental subduction, intracrustal shortening and coeval upper-crustal extension: P-T evolution of subducted south-Iberian paleomargin metapelites. Tectonophysics 2015, 663, 122–139. [Google Scholar] [CrossRef]
  31. Kisch, H.J. Illite crystallinity: Recommendations on sample preparation, X-ray diffraction settings, and interlaboratory samples. J. Metamorph. Geol. 1991, 9, 665–670. [Google Scholar] [CrossRef]
  32. Warr, L.N.; Rice, A.H.N. Interlaboratory standardization and calibration of clay mineral crystallinity and crystallite size data. J. Metamorph. Geol. 1994, 12, 141–152. [Google Scholar] [CrossRef]
  33. Warr, L.N.; Ferreiro-Mählmann, R. Recommendations for Kübler Index standardization. Clay. Miner. 2015, 50, 283–286. [Google Scholar] [CrossRef]
  34. Sassi, F.P.; Scolari, A. The b0 value of the potassium white micas as a barometric indicator in low-grade metamorphism of pelitic schists. Contrib. Mineral. Petrol. 1974, 45, 143–152. [Google Scholar] [CrossRef]
  35. Pouchou, J.L.; Pichoir, F. ‘PAP’ (f) I (t) procedure for improved quantitative microanalysis. In Microbeam Analysis; Armstrong, J.T., Ed.; San Francisco Press: San Francisco, CA, USA, 1985; pp. 104–106. [Google Scholar]
  36. Lanari, P.; Vidal, O.; De Andrade, V.; Dubacq, B.; Lewin, E.; Grosch, E.G.; Schwartz, S. XmapTools: A MATLAB©-based program for electron microprobe X-ray image processing and geothermobarometry. Comput. Geosci. 2014, 62, 227–240. [Google Scholar] [CrossRef] [Green Version]
  37. Lanari, P.; Vho, A.; Bovay, T.; Airaghi, L.; Centrella, S. Quantitative Compositional Mapping of Mineral Phases by Electron Probe Micro-analyser. Geol. Soc. Spec. Publ. 2019, 474, 39–63. [Google Scholar] [CrossRef]
  38. De Andrade, V.; Vidal, O.; Lewin, E.; O’Brien, P.; Agard, P. Quantification of electron microprobe compositional maps of rock thin sections: An optimized method and examples. J. Metamorph. Geol. 2006, 24, 655–668. [Google Scholar] [CrossRef]
  39. Lanari, P.; Giuntoli, F.; Loury, C.; Burn, M.; Engi, M. An inverse modeling approach to obtain P-T conditions of metamorphic stages involving garnet growth and resorption. Eur. J. Mineral. 2017, 29, 181–199. [Google Scholar] [CrossRef] [Green Version]
  40. Chapman, A.; Luffi, P.; Saleeby, J.; Petersen, S. Metamorphic evolution, partial melting and rapid exhumation above an ancient flat slab: Insights from the San Emigdio Schist, southern California. J. Metamorph. Geol. 2011, 29, 601–626. [Google Scholar] [CrossRef]
  41. Holland, T.J.B.; Powell, R. An internally consistent thermodynamic data set for phases of petrological interest. J. Metamorph. Geol. 1998, 16, 309–343. [Google Scholar] [CrossRef]
  42. Mellini, M.; Nieto, F.; Alvarez, F.; Gomez-Pugnaire, M.T. Mica-chlorite intermixing and altered chlorite from the Nevado-Filábride micaschists, Southern Spain. Eur. J. Mineral. 1991, 3, 27–38. [Google Scholar] [CrossRef]
  43. Nieto, F.; Mata, M.P.; Bauluz, B.; Giorgetti, G.; Arkai, P.; Peacor, D.R. Retrograde diagenesis, a widespread process on a regional scale. Clay Miner. 2005, 40, 93–104. [Google Scholar] [CrossRef] [Green Version]
  44. Abad, I.; Nieto, F.; Peacor, D.; Velilla, N. Prograde and retrograde diagenetic and metamorphic evolution in metapelitic rocks of Sierra Espuña (Spain). Clay Miner. 2003, 38, 1–23. [Google Scholar] [CrossRef] [Green Version]
  45. Petschick, R. MacDiff 4.2.6. 2004. Available online: https://www.uni-frankfurt.de/69528130/Petschick___MacOS_Software (accessed on 22 December 2021).
  46. Merriman, R.J.; Peacor, D.R. Very low-grade metapelites: Mineralogy, microfabrics and measuring reaction progress. In Low-Grade Metamorphism; Frey, M., Robinson, D., Eds.; Blackwell Science: Oxford, UK, 1999; pp. 10–60. [Google Scholar] [CrossRef]
  47. Abad, I. Physical meaning and applications of the illite Kübler index: Measuring reaction progress in low-grade metamorphism. In Diagenesis and Low-Temperature Metamorphism. Theory, Methods and Regional Aspects; Nieto, F., Jiménez-Millán, J., Eds.; Seminarios SEM: Jaén, Spain, 2007; Volume 3, pp. 53–64. [Google Scholar]
  48. Guidotti, C.V.; Mazzoli, C.; Sassi, F.P.; Blencoe, J.G. Compositional controls on the cell dimensions of 2M1 muscovite and paragonite. Eur. J. Mineral. 1992, 4, 283–297. [Google Scholar] [CrossRef]
  49. Guidotti, C.V.; Sassi, F.P.; Blencoe, J.G.; Selverstone, J. The paragonite-muscovite solvus: I. P-T-X limits derived from the Na-K compositions of natural, quasi-binary paragonite-muscovite pairs. Geochim. Cosmochim. Acta 1994, 58, 2269–2275. [Google Scholar] [CrossRef]
  50. Coggon, R.; Holland, T. Mixing properties of phengitic micas and revised garnet-phengite thermobarometers. J. Metamorph. Geol. 2002, 20, 683–696. [Google Scholar] [CrossRef]
  51. Parra, T.; Vidal, O.; Agard, P. A thermodynamic model for Fe–Mg dioctahedral K white micas using data from phase-equilibrium experiments and natural pelitic assemblages. Contrib. Mineral. Petrol. 2002, 143, 706–732. [Google Scholar] [CrossRef]
  52. Massonne, H.J.; Schreyer, W. Phengite geobarometry based on the limiting assemblage with K-feldspar, phlogopite, and quartz. Contrib. Mineral. Petrol. 1987, 96, 212–224. [Google Scholar] [CrossRef]
  53. Massonne, H.J.; Szpurka, Z. Thermodynamic properties of white micas on the basis of high- pressure experiments in the systems K2O-MgO-Al2O3-SiO2-H2O. Lithos 1997, 41, 229–250. [Google Scholar] [CrossRef]
  54. Taylor, S.R.; McLennan, S.M. The Continental Crust: Its Composition and Evolution; Blackwell Scientific Publications: Oxford, UK, 1985; p. 312. [Google Scholar]
  55. Herron, M.M. Geochemical classification of terrigenous sands and shales from core or log data. J. Sediment. Petrol. 1986, 58, 820–829. [Google Scholar]
  56. Jones, B.; Manning, D.A.C. Comparison of geochemical indices used for the interpretation of palaeoredox conditions in ancient mudstones. Chem. Geol. 1994, 111, 111–129. [Google Scholar] [CrossRef]
  57. Hatch, J.R.; Leventhal, J.S. Relationship between inferred redox potential of the depositional environment and geochemistry of the Upper Pennsylvanian (Missourian) Stark Shale Member of the Dennis Limestone, Wabaunsee County, Kansas, USA. Chem. Geol. 1992, 99, 65–82. [Google Scholar] [CrossRef]
  58. Li, B.; Massonne, H.J. Two Tertiary metamorphic events recognized in high-pressure metapelites of the Nevado-Filábride Complex (Betic Cordillera, S Spain). J. Metamorph. Geol. 2018, 36, 603–630. [Google Scholar] [CrossRef]
  59. McLaren, P.; Bowles, D. The effects of sediment transport on grain-size distributions. J. Sediment. Res. 1985, 55, 457–470. [Google Scholar] [CrossRef]
  60. Prodger, S.; Russell, P.; Davidson, M.; Miles, J.; Scott, T. Understanding and predicting the temporal variability of sediment grain size characteristics on high-energy beaches. Mar. Geol. 2016, 376, 109–117. [Google Scholar] [CrossRef] [Green Version]
  61. Yan, Y.; Xia, B.J.; Lin, G.; Cui, X.; Hu, X.; Yan, P.; Zhang, F. Geochemistry of the sedimentary rocks from the Nanxiong Basin, South China and implications for provenance, paleoenvironment and paleoclimate at the K/T boundary. Sediment. Geol. 2007, 197, 127–140. [Google Scholar] [CrossRef]
  62. Chen, S.C.; Wu, D.; Liu, G.J. Geochemistry of major and trace elements in Permian coal: With an emphasis on No. 8 coal seam of Zhuji coal mine, Huainan Coalfield, China. Environ. Earth Sci. 2016, 75, 494–500. [Google Scholar] [CrossRef]
  63. Sternbeck, J.; Sohlenius, G.; Hallberg, R.O. Sedimentary trace elements as proxies to depositional changes induced by a Holocene fresh–brackish water transition. Aquat. Geochem. 2000, 6, 325–345. [Google Scholar] [CrossRef]
  64. Tribovillard, N.; Algeo, T.J.; Lyons, T.; Riboulleau, A. Trace metals as paleoredox and paleoproductivity proxies: An update. Chem. Geol. 2006, 232, 12–32. [Google Scholar] [CrossRef]
  65. Han, S.; Zhang, Y.; Huang, J.; Rui, Y.; Tang, Z. Elemental Geochemical Characterization of Sedimentary Conditions and Organic Matter Enrichment for Lower Cambrian Shale Formations in Northern Guizhou, South China. Minerals 2020, 10, 793. [Google Scholar] [CrossRef]
  66. Wang, L.; Zhang, Y.; Xing, E.; Peng, Y.; Yu, D. Distribution of Trace Elements, Sr-C Isotopes, and Sedimentary Characteristics as Paleoenvironmental Indicator of the Late Permian Linxi Formation in the Linxi Area, Eastern Inner Mongolia. J. Chem. 2020, 2020, 7027631. [Google Scholar] [CrossRef]
  67. Riquier, L.; Tribovillard, N.; Averbuch, O.; Devleeschouwer, X.; Riboulleau, A. The Late Frasnian Kellwasser horizons of the Harz Mountains (Germany): Two oxygen–deficient periods resulting from different mechanisms. Chem. Geol. 2006, 233, 137–155. [Google Scholar] [CrossRef]
  68. Piercey, S.J.; Gibson, H.L.; Tardif, N.; Kamber, B.S. Ambient redox and hydrothermal environment of the Wolverine volcanogenic massive sulfide deposit, Yukon: Insights from lithofacies and lithogeochemistry of Mississippian host shales. Econ. Geol. 2016, 111, 1439–1463. [Google Scholar] [CrossRef]
  69. Ernst, T.W. Geochemical Facies Analysis; Elsevier: Amsterdam, The Netherlands, 1970; p. 152. [Google Scholar]
  70. Lewan, M.D. Factors controlling the proportionality of vanadium to nickel in crude oils. Geochim. Cosmochim. Acta 1984, 48, 2231–2238. [Google Scholar] [CrossRef]
  71. Rimmer, S.M. Geochemical paleoredox indicators in Devonian–Mississippian black shales, Central Appalachian Basin (USA). Chem. Geol. 2004, 206, 373–391. [Google Scholar] [CrossRef]
  72. Wilde, P.; Quinby-Hunt, M.S.; Erdtmann, B.-D. The whole-rock cerium anomaly: A potential indicator of eustatic sea-level changes in shales of the anoxic facies. Sediment. Geol. 1996, 101, 43–53. [Google Scholar] [CrossRef]
  73. Elderfield, H. The oceanic chemistry of the rare-earth elements. Philos. Trans. R. Soc. Lond. Ser. A. 1988, 325, 105–126. [Google Scholar] [CrossRef]
  74. Spirakis, C.S. The roles of organic matter in the formation of uranium deposits in sedimentary rocks. Ore Geol. Rev. 1996, 11, 53–69. [Google Scholar] [CrossRef]
  75. Fouad, H.K.; El-Rakaiby, R.M. Environmental geochemistry for heavy metals and uranium potentiality in oil shale sediments, Quseir, Red Sea, Egypt. J. Appl. Sci. Res. 2009, 5, 914–921. [Google Scholar]
  76. Rallakis, D.; Michels, R.; Brouand, M.; Parize, O.; Cathelineau, M. The Role of Organic Matter on Uranium Precipitation in Zoovch Ovoo, Mongolia. Minerals 2019, 9, 310. [Google Scholar] [CrossRef] [Green Version]
  77. Morand, V. High chromium and vanadium in andalusite, phengite and retrogressive margarite in contact metamorphosed Ba-rich black slate from the Abercrombie Beds, New South Wales, Australia. Mineral. Mag. 1990, 54, 381–391. [Google Scholar] [CrossRef] [Green Version]
  78. Lee, C.H.; Lee, H.K. Vanadium- and barium-bearing green mica within coaly metapelite from the Ogcheon Supergroup, Republic of Korea. J. Asian Earth Sci. 2003, 21, 343–351. [Google Scholar] [CrossRef]
  79. Frey, M. Low Temperature Metamorphism; Blackie: Glasgow, UK, 1987; p. 328. [Google Scholar]
  80. Cao, S.; Neubauer, F.; Bernroider, M.; Liu, J. The lateral boundary of a metamorphic core complex: The Moutsounas shear zone on Naxos, Cyclades, Greece. J. Struct. Geol. 2012, 54, 103–128. [Google Scholar] [CrossRef] [Green Version]
  81. Dai, W.; Zhou, Y.; Ma, X. Pseudotachylyte-Mylonites Record of Transient Creep from Inter-Seismic Ductile to Co-Seismic Rupture. Front. Earth Sci. 2022, 10, 931005. [Google Scholar] [CrossRef]
  82. Airaghi, L.; Lanari, P.; de Sigoyer, J.; Guillot, S. Microstructural vs compositional preservation and pseudomorphic replacement of muscovite in deformed metapelites from the Longmen Shan (Sichuan, China). Lithos 2017, 282–283, 262–280. [Google Scholar] [CrossRef]
  83. Putnis, A.; Austrheim, H. Fluid-induced processes: Metasomatism and metamorphism. Geofluids 2010, 10, 254–269. [Google Scholar] [CrossRef]
  84. Williams, J.R.; Platt, J.P. A new structural and kinematic framework for the Alborán Domain (Betic-Rif arc, western Mediterranean orogenic system). J. Geol. Soc. 2018, 175, 465–496. [Google Scholar] [CrossRef]
Figure 1. Two representative examples of hand samples of fine-grained metamorphic rock (a) and schists (b), taken at the same outcrop. Thin-section optical images (crossed nicols) of four selected fine-grained metamorphic rocks rich in quartz, albite and white mica and intensely foliated (cf); and two schists (g,h) showing the typical texture and minerals of this type of rock. Red and yellow lines in e and f highlight C-S fabrics on fine-grained metamorphic rocks (mineral abbreviations according to Warr [10]).
Minerals 13 00024 g001
Figure 2. (a) Geologic scheme of the Betic Cordillera; (b) general map of the Nevado-Filábride Complex. The position of Figure 3b is indicated, in addition to position of samples RA-8 and SN-1p. Modified from Sanz de Galdeano and Santamaría-López [3].
Minerals 13 00024 g002
Figure 3. (a) Simplified lithologic column of the Nevado-Filábride in the Sierra de los Filabres modified from Sanz de Galdeano and Santamaría-López [3]. The approximate position of the samples in the lithologic sequence is indicated; (b) geological map of the western part of the Sierra de los Filabres, modified from Sanz de Galdeano and López-Garrido [2], with indication of the position of the samples except for the pair SN-1p and RA-8 (see Figure 2 for their location).
Minerals 13 00024 g003
Figure 4. BSE images of slate-like rocks: (a) well-developed foliation in sample Fi-1p; (b) sample Fi-5p composed by a fine-grained matrix of muscovite and quartz with albite, chlorite, garnet and titanite porphyroblasts (mineral abbreviations according to Warr [10]).
Minerals 13 00024 g004
Figure 5. BSE images of schist Fi-2e and EDX spectra corresponding to the two types of dioctahedral micas: (a) porphyroblasts of garnet partially surrounded by chlorite laths and with numerous quartz inclusions; (b) evidence of the crenulation cleavage that usually characterize these rocks (red and yellow arrows correspond to the EDX spectra marked with red and yellow asterisks respectively in c and d); (c) EDX spectra of muscovite, with higher Al and Na contents than phengites (red arrow in b); (d) EDX spectra of phengite with higher Si and Mg content than muscovites (yellow arrow in b) (mineral abbreviations according to Warr [10]).
Minerals 13 00024 g005
Figure 6. Guidotti et al. [48] diagram including the d001 (ordinate axe) and b (abscissa axe) XRD parameters of slate-like rocks and schists and their relation with the chemical composition of micas determined by EPMA, whose overall ranges are indicated by color rectangles. Dashed lines connect the differentiated (060) peaks for white micas, corresponding to higher (more phengitic, green circle) and lower (less phengitic, yellow circle) values.
Minerals 13 00024 g006
Figure 7. Relation between the Na/Na + K ratio and Fe + Mg content for 51 EPMA analyses of muscovites and phengites of four selected samples, two slate-like rocks (p, gray and yellow triangles) and two schists (e, blue and red dots). Rough extreme values of pressure and temperature (in green) are according to Guidotti et al. [49], Coggon and Holland [50], Parra et al. [51], Massonne and Schreyer [52] and Massonne and Szpurka [53]. Apfu = atoms per formula unit.
Minerals 13 00024 g007
Figure 8. X-ray compositional maps of micas belonging to the four selected samples analyzed by EPMA and processed with XMAPTOOLS: (a) EPMA BSE images; (b) Si4+ (apfu) content maps; (c) XMg maps; (d) Na+ (apfu) content maps. Yellow squares highlight the zonation of mica grains from core to rim. Yellow and red arrows correspond to mica cores and rims, respectively.
Minerals 13 00024 g008
Figure 9. X-ray compositional maps of end-member fractions for the garnet porphyroblasts belonging to the three selected samples analyzed by EPMA and processed with XMAPTOOLS. Dashed lines delimit the growth zones defined for each garnet on the basis of the composition. Arrows show the location of the domains used for extracting the representative composition of each growth zone (see text): (a) EPMA BSE images; (b) Xgrs maps; (c) Xalm maps; (d) Xprp maps; (e) Xsps maps. Grs: grossular; alm: almandine; prp: pyrope; sps: spessartine.
Minerals 13 00024 g009
Figure 10. Major element binary diagrams based on X-ray fluorescence data showing chemical differences between slate-like rocks and schists: (a) SiO2 vs. Al2O3; (b) SiO2 vs. Fe2O3; (c) SiO2 vs. K2O; (d) SiO2 vs. MgO.
Minerals 13 00024 g010
Figure 11. Minor and trace elements plots: spider diagram of the schists (a) and the slate-like rock samples (b); rare earth elements (REE) patterns normalized to the PAAS for the schists (c) and slate-like rock samples (d) [54].
Minerals 13 00024 g011
Figure 12. Chemical classification scheme of metasediments based on the log (Fe2O3/K2O) vs. log (SiO2/Al2O3) (a) of Herron [55] and crossplots of redox indices: V/Cr vs. U/Th (b), Ni/Co vs. U/Th (c) and V/(V + Ni) vs. U/Th (d). White, gray and dark gray fields correspond to oxic, dysoxic and anoxic conditions respectively.
Minerals 13 00024 g012
Figure 13. P-T results of each garnet belonging to the different samples, superposed to the proposed P-T paths from literature. The reference numbers correspond to the selected garnet domain [11,15,58].
Minerals 13 00024 g013
Table 1. Mineral composition and mica “crystallinity” indices of slate-like rocks determined by XRD (mineral abbreviations according to Warr [10]).
SampleMinerals (+Qz + Ph + Bt + Pl)Illite “Crystallinity” (CIS)
<2 µmWhole Fraction
Fi-1pKfs, Sme, Kln0.250.23
Fi-2pKfs, Kln0.240.20
Fi-3pSme ↓↓, Kln0.210.20
Fi-4pKln ↓↓0.190.20
Fi-4p-bisSme ↓↓, Kln ↓0.240.21
Fi-5pAmp, Grt, Pg, Sme, Kln ↓0.250.23
SN-1pKfs, Sme, Kln0.230.26
Qualitative indication of abundance ↓ (low), ↓↓ (very low); CIS anquizone limits = 0.32–0.52 (Warr and Ferreiro-Mählmann [33]).
Table 2. Values of Si (apfu), XMg and Na (apfu) in mica cores and rims determined from EPMA data.
Mica CoreMica Rim
SiXMgNaSiXMgNa
schists
Fi 2e3.370.630.063.180.430.13
Fi 4e3.400.630.033.140.400.15
slate-like rocks
Fi 5p3.500.700.052.900.300.15
Fi 9p3.350.650.023.050.20.20
Table 3. Whole rock analyses of major elements of slate-like rocks (p) and schists (e) (oxide wt.%).
SamplesSiO2Al2O3Fe2O3MnOMgOCaONa2OK2OTiO2P2O5LOITOTAL (with LOI)
Fi-1e76.3212.611.760.010.750.170.783.800.620.052.0898.95
Fi-1p75.2112.792.980.011.000.200.903.650.580.072.4599.80
Fi-2e65.9717.564.910.031.230.320.623.880.930.094.0899.63
Fi-2p77.8212.591.810.010.530.170.733.600.800.081.91100.04
Fi-3e88.406.510.710.000.240.111.641.000.450.020.92100.00
Fi-3p75.9812.013.910.010.660.091.203.230.660.092.22100.06
Fi-4e75.0711.644.530.050.810.230.612.430.650.092.7798.88
Fi-4p58.3622.004.460.021.270.160.197.231.010.105.1499.93
Fi-4e-bis73.5512.315.230.040.920.260.602.060.700.113.1598.92
Fi-4p-bis61.7521.103.150.011.170.110.946.131.030.064.5099.95
Fi-5p56.4621.126.820.081.685.021.092.871.060.173.5899.95
Fi-9e83.438.781.060.000.740.150.322.160.490.021.7998.94
Fi-9p68.8515.374.580.050.920.200.633.580.890.123.6498.81
Fi-10p69.9115.263.590.021.480.120.514.110.680.043.0698.78
RA-8 (e)66.5617.035.940.061.160.490.882.620.900.173.9299.75
SN-1p63.3019.353.930.031.350.540.285.750.970.044.4499.96
Table 4. T values obtained after independent two-sample t-test, for comparing differences in major element content between schists and slates-like rocks samples. Only two major elements (Al2O3 and K2O) show a t value higher than the threshold (2.145; for a 95% confidence level and 14 degrees of freedom).
SiO21.997Al2O32.209Fe2O30.522MnO0.039MgO1.572
CaO0.791Na2O0.312K2O2.839TiO21.922P2O50.295
Table 5. T values obtained after independent two-sample t-test, for comparing differences in minor, trace and REE content between schists and slate-like samples. Only three elements (Ba, Rb and Tl) show a t value higher than the threshold (2.145; for a 95% confidence level and 14 degrees of freedom).
Ba2.773Cr1.071Ta1.704Th2.051Tb0.351
Li0.308Co0.993Zr2.139La1.761Dy0.247
Rb2.603Ni0.810Hf1.370Ce1.462Ho0.338
Cs1.693Cu0.498Mo0.827Pr1.719Er0.394
Be2.038Zn0.436Sn1.568Nd1.657Tm0.439
Sr1.025Ga1.996Tl2.397Sm1554Yb0.029
Sc1.618Y0.084Pb0.805Eu1.312Lu0.312
V0.909Nb1.732U0.889Gd0.834
Disclaimer/Publisher’s Note: The statements, opinions and data contained in all publications are solely those of the individual author(s) and contributor(s) and not of MDPI and/or the editor(s). MDPI and/or the editor(s) disclaim responsibility for any injury to people or property resulting from any ideas, methods, instructions or products referred to in the content.

